
Abstract
Representative bureaucracy and workforce diversity have become central topics in the field of public administration. Although representation and diversity are distinct concepts, public administration researchers often conflate them. This study seeks to provide analytical clarity by outlining and comparing the various conceptual definitions of representation and diversity. We also explain the causal logic of how representation and diversity influence organizational performance. Finally, with South African local government as the research setting, we examine the empirical relationship between these two concepts and explore how different forms of representation and diversity are related to organizational performance.
Interest in the social identity of public employees has grown substantially among policymakers and researchers. In response to demographic changes and calls for employment equity and good governance, governments throughout the world have taken deliberate measures to alter the demographics of public organizations to make them more representative, diverse, and inclusive. Studies of representative bureaucracy and workforce diversity show beyond its symbolic significance (Mosher, 1968), the demographic composition of public organizations has a major influence on the behavior and attitudes of public employees and citizens as well as on public sector performance (Ding et al., 2021; Kennedy, 2014; Meier, 2019; Pitts & Recascino Wise, 2010).
A variety of terms arise in research on the demographics of public organizations, with representation (or representative bureaucracy) and diversity figuring prominently in the literature. Representation and diversity are distinct concepts with different consequences for public organizations. However, a fair amount of confusion remains as to their meaning, prompting calls for greater clarity in discussions of organizational demography (Gazley et al., 2010; Pitts & Recascino Wise, 2010; Gooden & Portillo, 2011). Some who study the concept of representative bureaucracy use the terms representation and diversity interchangeably (e.g., Bradbury & Kellough, 2011; Hong, 2016; Riccucci et al., 2014; Rocha & Hawes, 2009; Turgeon & Gagnon, 2013). The situation becomes even more muddled when researchers conflate or mix up the concepts of representation (or representative bureaucracy) and diversity. Selden (1997), Andrews et al. (2014), and Grissom et al. (2015) state representative bureaucracies are more diverse in their composition because they reflect a diverse population. They seem to overlook that representative bureaucracies can be homogenous instead of diverse in countries where a single racial or ethnic group constitutes a large majority of the population (e.g., Japan, Germany, and South Africa). Whether a representative bureaucracy is also a diverse one, therefore, depends on the composition of the population. Finally, Pitts and Recascino Wise (2010) and Weisinger et al. (2016), in their reviews of research on diversity in public and nonprofit organizations, respectively, find researchers often use measures of racial, ethnic, and gender representation rather than of variety or heterogeneity when analyzing the concept of diversity.
To be sure, there are researchers who treat representation and diversity as distinct concepts (e.g., Gazley et al., 2010; Gooden & Portillo, 2011; Groeneveld & Meier, 2022; Kennedy, 2014; Pitts, 2005; Wise & Tschirhart, 2000). For them, representation means the extent to which a social group is represented in an organization, while diversity refers to differences, variety, or heterogeneity among employees. Gooden and Portillo (2011) treat social equity as a conceptual “pillar” made up of various units or “bricks,” including representation, diversity, employment equity, and affirmative action. Groeneveld and Van de Walle (2010) argue representative bureaucracy has various meanings, including representation and diversity, depending on the context. When the goal is to promote equity and fairness, representative bureaucracy means proportional representation, whereas when the aim is to improve performance, terms like diversity and diversity management are used. Diversity has become a more innocuous term for voluntary initiatives based on economic reasoning, compared to affirmative action to achieve proportional representation, which raises the specter of a zero-sum game in which the historically privileged stand to lose (see Groeneveld & Van de Walle, 2010).
This study aims to enhance conceptual clarity by outlining and comparing the various conceptual and operational definitions of representation and diversity. We also describe the different causal logics by which representation and diversity influence organizational performance. In addition, the relationship between representation of majority and minority groups and diversity is analyzed using panel data from South African local government. Finally, we analyze the same panel dataset to examine the effects of different forms of representation and diversity, including both relations-oriented and task-oriented diversity, on organizational performance.
Conceptualizing Representation and Diversity
We begin by defining representation and diversity in organizations to better distinguish between these two concepts. Regarding representation, Mosher (1968) distinguishes between passive representation of social groups in bureaucracy, and active representation, meaning efforts by bureaucrats to advocate for the interests of their social groups. Focusing just on passive representation since it pertains to the demographics of organizations, we find two definitions in the literature. There is the notion of passive representation as proportional representation, referring to the extent to which a social group is represented in bureaucracy compared to its share of the general population. Mosher (1968) refers to this as representativeness, or the degree to which the workforce mirrors society (see also Krislov, 1974). Proportional representation has been measured using the representation index and Gini index of concentration or Lorenz Curve. Alternatively, researchers define representation as the extent to which a social group is represented in the bureaucracy without regard for its share of the general population. We refer to this as basic representation. The concept of basic representation, which figures prominently in representative bureaucracy research, can be traced to Kingsley (1944), who examined the consequences of a civil service populated primarily by members of the British ruling class without regard for this group’s share of the population.
Shifting the focus to workforce diversity, Harrison and Klein (2007), noting the variety of terms and notions of diversity in the literature, propose a diversity typology outlining three types of within-unit differences: variety, separation, and disparity. Diversity as variety refers to how members of a unit differ from one another qualitatively or on a categorical attribute (e.g., race or occupation) and on the distribution across categories (Harrison & Klein, 2007). Minimum variety occurs when all members fall in a single category, while maximum variety occurs when each member falls in a unique category. Blau’s index is commonly used to measure diversity as variety, along with Teachman’s entropy index (Harrison & Klein, 2007). Diversity as variety, measured using Blau’s index, predominates in research on diversity in public organizations (e.g., Gazley et al., 2010; Opstrup & Villadsen, 2015; Pitts, 2005).
Diversity as separation refers to how members of a unit are located along a lateral continuous attribute (e.g., values, beliefs, and attitudes toward an organization) (Harrison & Klein, 2007). Minimum separation occurs when there is perfect agreement among members on any point along the continuum, whereas maximum separation occurs when members are evenly split at two ends of the continuum. Simple standard deviations and the Euclidean distance are used to measure diversity as separation (Harrison & Klein, 2007).
Finally, there is diversity as disparity, or how members of a unit differ in the extent to which they hold a valued or desirable resource (e.g., pay or power). Minimum disparity occurs when all members possess an equal share of the resource and maximum disparity occurs when one member is in complete possession of the resource. Disparity, the least studied conceptualization of diversity, is operationalized as the coefficient of variation and the Gini coefficient to capture asymmetry within groups (Harrison & Klein, 2007; Qin et al., 2014).
The concepts of representation and diversity have similarities. Both pertain to the social identity of employees and to the demographic composition of organizations, particularly the extent to which they employ members of different social groups, and are attributes of organizations, not of individuals. Representation, however, typically involves the extent to which one social group in represented in an organization, as a percent of the workforce (i.e., basic representation) or as a percent of the workforce compared to the percent of the population (i.e., proportional representation). Conversely, diversity considers representation of multiple groups at once and the differences in representation between them. Importantly, the concept of proportional representation concerns how a social group’s representation in an organization corresponds with the group’s share of the population. Hence, its conceptual domain encompasses demographic features of both the organization and its external environment. Researchers who study diversity, however, treat it as an internal feature of an organization without reference to the external environment. Hence, the empirical relationship between proportional representation and diversity is contingent on the demographic composition of the population served.
Due partly to the conceptual distinction between representation and diversity, the literatures on these topics have taken different paths. As Groeneveld and Meier (2022) explain, representative bureaucracy research focuses on representation of disadvantaged social groups in organizations and how it produces substantive benefits for its members at large. Conversely, diversity research endeavors to understand the impact of workforce heterogeneity on group processes and performance, without regard for proportional representation of social groups in organizations. They point to the concept of status distance as a common element of these two literatures that can help to integrate them and generate new ideas for advancing the study of organizational demography. We will revisit the concept of status distance below to help explain how both representation and diversity influence performance.
Linking Representation and Diversity to Performance
Besides being distinct concepts, representation and diversity influence performance in different ways. Beginning with representation, empirical research across a range of policy settings has established a relationship between representation of social groups in bureaucracies and actions taken by bureaucrats to promote the interests and well-being of these groups, that is, active representation. Studies have linked racial representation in public organizations to subtle forms of discrimination against K-12 students (Grissom et al., 2009; Meier & Stewart, 1992), farm loan awards (Selden, 1997), employment discrimination investigations (Hindera & Young, 1998), and law enforcement actions (Bradbury & Kellough, 2011). In addition, a growing number of studies have found evidence of a link between representation of historically disadvantaged groups and effectiveness of public organizations and programs. Research points to a positive relationship between representation of Blacks, Latinos, and women among school teachers and the performance of Black, Latino, and female K-12 students (Keiser et al., 2002; Meier, 1993; Meier et al., 1999); representation of women in police departments and enforcement of laws against sexual violence toward women (Meier & Nicholson-Crotty, 2006); representation of women in child support agencies and enforcement collections (Wilkins & Keiser, 2006); representation of racial minorities in federal agencies and awarding of government contracts (Fernandez et al., 2013); and representation of Blacks in South African national departments and achievement of annual performance goals (Fernandez, 2020).
Representation does not automatically translate into substantive benefits for social groups. Meeting certain conditions significantly increases the likelihood of the former producing the latter (Keiser et al., 2002; Meier, 1993). First, bureaucrats must be able to exercise discretion at work. Second, bureaucrats should be in a position to influence members of their social group through decisions or actions they take. Finally, the policies bureaucrats implement should be salient or significant to the demographic group in question. In the case of effectiveness or goal achievement, a fourth precondition—goal alignment between policymakers and bureaucrats—should also be met (Fernandez, 2020). Group socialization aligns the values and interests of bureaucrats and citizens, setting the stage for active representation or advocacy. However, for representation to impact performance, the goals of bureaucrats should align with those of policymakers and the programs they establish. From a principal-agent perspective, increasing representation of a social group that is the intended beneficiary of a policy serves to align the goals of policymakers and bureaucrats, reducing the likelihood of moral hazard (McCubbins et al., 1989). Kingsley (1944) alluded to this when he wrote of a common background causing bureaucratic agents to act as if they were political principals.
Research offers insight into how representation can improve performance. Lim (2006) notes bureaucratic advocacy can result in better performance when a policy or program is designed specifically to advance the interests of that group. He also argues bureaucracies that closely mirror the population can be more effective at understanding the needs of citizens and at communicating with them (Lim, 2006). In addition, a bureaucracy that generally looks like the population has more legitimacy and can encourage positive behavior by citizens, including more cooperation, compliance, and coproduction (Hong, 2016; Lim, 2006; Riccucci et al., 2014). Finally, when disadvantaged groups are better represented in bureaucracies, they raise awareness of and curb discriminatory practices by privileged groups against their members (Lim, 2006). Groeneveld and Meier (2022) describe many of the same pathways connecting representation to performance but introduce the concept of status distance. For instance, more representative bureaucracies lower the status distance between bureaucrats and citizens, improving the quality of their interactions and enhancing service delivery effectiveness. And interaction between low-status and high-status bureaucrats can change the negative attitudes of the latter, fostering better appreciation of the needs of low-status citizens and facilitating service delivery. Interestingly, Hindera (1993) and Fernandez (2020) propose a similar set of causal mechanisms linking representation to performance, a sign perhaps of emerging consensus around the notion active representation is just one of various ways representative bureaucracy can improve performance.
Turning now to the impact of diversity, two competing theoretical perspectives have emerged to explain the effects of diversity on groups. The social categorization perspective posits people tend to classify themselves and others into social groups and compare their group to others in ways that makes the ingroup appear more positive and likeable than outgroups (Hogg et al., 1995; Turner et al., 1987; Van Knippenberg & Schippers, 2007; Williams & O’Reilly, 1998). When people strongly associate with a group, group values and norms become a source of information about appropriate thoughts, feelings, and behavior that are internalized by members. Perceived congruence in values and norms fosters interpersonal trust and a sense of reciprocity, encouraging altruism and cooperation among ingroup members and increasing group cohesiveness (Hogg et al., 1995; Turner et al., 1987). Conversely, people are more likely to make negative attributions of an outgroup perceived to be different, to display distrust and hostility toward outgroup members, and to discriminate against them. Diverse groups are more susceptible to this process of social categorization than homogenous groups, which are less likely to splinter into sub-groups and remain cohesive due to similarities among group members. As a result, more homogenous groups should exhibit greater cooperation and less conflict among members, perform better, and make better decisions than diverse groups. Groeneveld and Meier (2022) add social categorization is more likely to occur within diverse organizations in fractionalized countries where status differences are exacerbated than in more homogenous countries.
An alternative perspective, the information/decision-making perspective, emphasizes the benefits of cognitive diversity (Van Knippenberg & Schippers, 2007). Greater diversity can infuse groups with knowledge, skills, abilities, experiences, and perspectives, enabling group members to pool diverse cognitive resources to improve decision quality, especially when confronting non-routine problems, as well as to integrate diverse information to arrive at creative solutions. Hence, more diverse groups are expected to be innovative and perform better.
Meta-analyses of the link between diversity and performance offer nuanced findings and point to small effects sizes that depend largely on the type of diversity (Bell et al., 2011; Horwitz & Horwitz, 2007; Joshi & Roh, 2009; Webber & Donahue, 2001). This has led researchers to warn against broad conclusions about diversity being “good” or “bad” (Bell et al., 2011). Importantly, researchers draw a distinction between two types of diversity: task-related diversity pertaining to highly job-related attributes like functional and education background, occupation, and tenure, and relations-oriented diversity based on more surface-level demographic attributes like age, race, and gender. Meta-analyses generally show task-oriented diversity has a small positive main effect on performance (Horwitz & Horwitz, 2007; Joshi & Roh, 2009), with the effect size increasing in situations where employees are interdependent and use sophisticated technologies (Joshi & Roh, 2009). Bell et al.’s (2011) analysis of specific task-related attributes like functional background find they had a small positive main effect on team performance that becomes stronger when groups are expected to be innovative. In one of the very few studies of task-related diversity in public organizations, Moon and Christensen (2020), using a simple measure of functional diversity, found functional diversity to be negatively related to performance, but a climate that promotes diversity diminishes this negative effect.
Meta-analyses offer much weaker evidence of a link between relations-oriented diversity and performance. Webber and Donahue (2001) and Horwitz and Horwitz (2007) conclude there is no evidence linking relations-oriented diversity and performance. Joshi and Roh (2009) find relations-oriented diversity has a small negative effect on team performance, but under certain conditions such as in service industries and when teams perform for short periods, the effect becomes positive. Focusing specifically on racial and gender diversity, two relations-oriented attributes, Bell et al. (2011) find they are weakly negatively related to performance. In short, relations-oriented diversity seems to promote social categorization, which in many cases can lead to miscommunication, conflict, and lower performance, although this can be offset in part by efforts to manage diversity. This is supported by studies of racial diversity in public organizations showing it can have little or no impact on performance (Choi & Rainey, 2010; Pitts, 2005; Wise & Tschirhart, 2000), but that organizations managing diversity well can turn racial diversity into an asset (Choi & Rainey, 2010).
The South African Local Government Context
South Africa offers a fascinating context in which to explore the demographic composition of public organizations and their performance. Prior to 1994, the country was condemned internationally for apartheid, a political and social system of racial segregation, oppression, and exploitation devised to promote the interests of a small white minority and ensure minority rule (Thompson, 1995). One of the hallmarks of apartheid was its system of labor laws and practices that protected white workers, inflated their wages, and denied employment opportunities for Africans and other Black groups in a range of industries (Giliomee & Schlemmer, 1989). Apartheid policies dramatically skewed the demographic composition of the public workforce. In 1990, approximately 14% of the population was White, yet Whites held roughly 42%, 32%, and 27% of all positions in national, provincial, and local government, respectively, including over 90% of highly skilled and managerial positions (Fernandez, 2020). With the advent of non-racial democracy, the African National Congress (ANC), which has won all the national elections and most of those at the provincial and local levels since 1994, has pursued a policy of affirmative action to transform the public workforce into a representative bureaucracy. An array of deliberate measures authorized by the constitution has been taken, including setting hiring targets for historically disadvantaged racial groups and women, identifying and removing barriers affecting their selection and retention, and training and mentoring new hires. These steps have proved fruitful, as Blacks now occupy positions in the national and provincial public service commensurate with their share of the national population and women are overrepresented in those spheres of government (Fernandez, 2020). In local government, female representation increased from 20% in 1990 (Central Statistical Services (1992) to 38% in 2018 (Commission for Employment Equity, 2019). Female underrepresentation persists in part because education and health, two sectors where women are employed in large numbers, are provincial functions. According to the same sources, the biggest changes have been the significant drop in White representation from 27% in 1990 to 6% in 2018 and a concomitant increase in African representation from 53% to 73% during the same period.
South Africa has a quasi-federal system of government comprised of national, provincial, and local spheres of government. The Constitution along with a series of white papers and statutes have created a decentralized local government system that entrenches certain functions and powers in local governments and grants them authority to make their own policies, levy their taxes, and appoint personnel. However, in regard to provision of basic public services, the national government continues to play an important role in capacitating and supporting local governments. In the case of electricity, water, and sanitation, one or more national departments is responsible for planning, regulation, resource production, and infrastructure development, while local governments play the role of distributor and retail provider. This creates a very complex legal and political environment for municipal leaders and employees (Palmer et al., 2017). Moreover, local distribution of electricity, water, solid waste, and sanitation entails a high degree of technical complexity due to the need to effectively perform and coordinate a variety of functions within and across spheres of government, including developing and maintaining infrastructure, consulting with communities, metering and billing for services, and mitigating the environmental effects of building and maintain infrastructure and disposing of waste (Palmer et al., 2017). This high level of technical complexity creates favorable conditions for task-related diversity to improve delivery of public services by South African local governments.
The current system of local government has had mixed success in developing adequate capacity to meet the needs of their residents. Since the end of apartheid, the three spheres of government have worked together to achieve notable increases in access to basic public services. Access to electricity increased dramatically from 35% of the population in 1990 to nearly 90% by 2011 (Statistics South Africa, 2012). Similarly, access to drinking water and sanitation increased from 81% and 54% in 1990, respectively, to 95% and 74% in 2014, respectively (World Health Organization, 2015). These gains notwithstanding, many local governments, particularly smaller ones, struggle to develop adequate administrative systems, human capital, and leaders determined to meet the needs of residents (Auditor-General of South Africa, 2020; Koelble & Siddle, 2014; Palmer et al., 2017). The local sphere also appears plagued by politicization of the bureaucracy and widespread appointment of political cadres lacking the requisite skills and experience to effectively manage local government (Habib, 2013).
A careful analysis of the effects of racial and gender representation on service delivery should consider if the conditions mentioned previously have been met in the South African context. Regarding the first condition, there is evidence of considerable administrative discretion in South African local government, as less than 10% of municipalities achieved a clean audit and more than R32 billion in irregular spending was uncovered in local government due to inadequate or non-existent internal controls pertaining to financial management, procurement, and personnel management, creating ample opportunities for representation to substantively benefit social groups (Auditor-General of South Africa, 2020). The second condition of having bureaucrats in positions where they can make decisions that affects citizens is also met since our empirical analysis considers municipal employees at all echelons, in all functional units, and performing the entire gamut of tasks undertaken by local governments.
Regarding the third precondition, redress and redistributive policies in South Africa appear more salient to Blacks than to women since the former group has benefited more from them. This makes conditions ripe for Black representation to impact performance but less favorable when it comes to female representation. A principal aim of the ANC has been to correct the racial injustices of apartheid and uplift all Blacks, regardless of gender. Previous laws imposing racial segregation in housing, schools, universities, health care facilities, and public amenities have been repealed (Thompson, 1995). The ANC has also pursued a far-reaching set of programs to reduce income inequality along racial lines, including a significant expansion in social grants, dramatic increases in public service provision, and Black Economic Empowerment (BEE) programs to promote Black business ownership (Seekings & Nattrass, 2016). Despite establishing an elaborate legal framework to ensure gender equality, however, gender discrimination remains an endemic problem in South Africa. Elements of hegemonic masculinity that foster domination of women and patriarchal norms and practices that promote their subordination remain pervasive (Morrell et al., 2012). Evidence also points to persistently high levels of gender inequity in employment and pay (Seekings & Nattrass, 2016) and violence against women (Morrell et al., 2012). Statistics from the United Nations Development Program (2016) point to the ANC’s mediocre record in promoting gender equality, with South Africa ranked 83 out of 155 countries.
Methodology
We seek to understand how different forms of representation and diversity impact organizational performance. Organizational performance is conceptualized as a local government’s effectiveness at providing four basic public services that all South Africans are entitled to receive according to the Constitution: electricity, solid waste, water, and sanitation. Our dependent variables are the number of access points per 1,000 municipal residents to these services: electricity access, solid waste access, water access, and sanitation access (see Table 1 for measures and descriptive statistics). Effectiveness appears to be the most widely considered performance criteria in public management research (Walker & Andrews, 2015), with earlier studies using measures like ours of service delivery effectiveness, particularly in less developed countries and emerging economies (e.g., Avellaneda, 2016; Muraoka & Avellaneda, 2021). These variables were created using data from Statistics South Africa’s Non-Financial Census of Municipalities. Access points consist of both domestic and non-domestic (business) customers, including single-family homes, communal homes, public facilities shared by neighborhood residents, and business establishments. Local governments regularly collect and report data on public service provision since access is a constitutional right granted to all South Africans.
Measures and Descriptive Statistics.
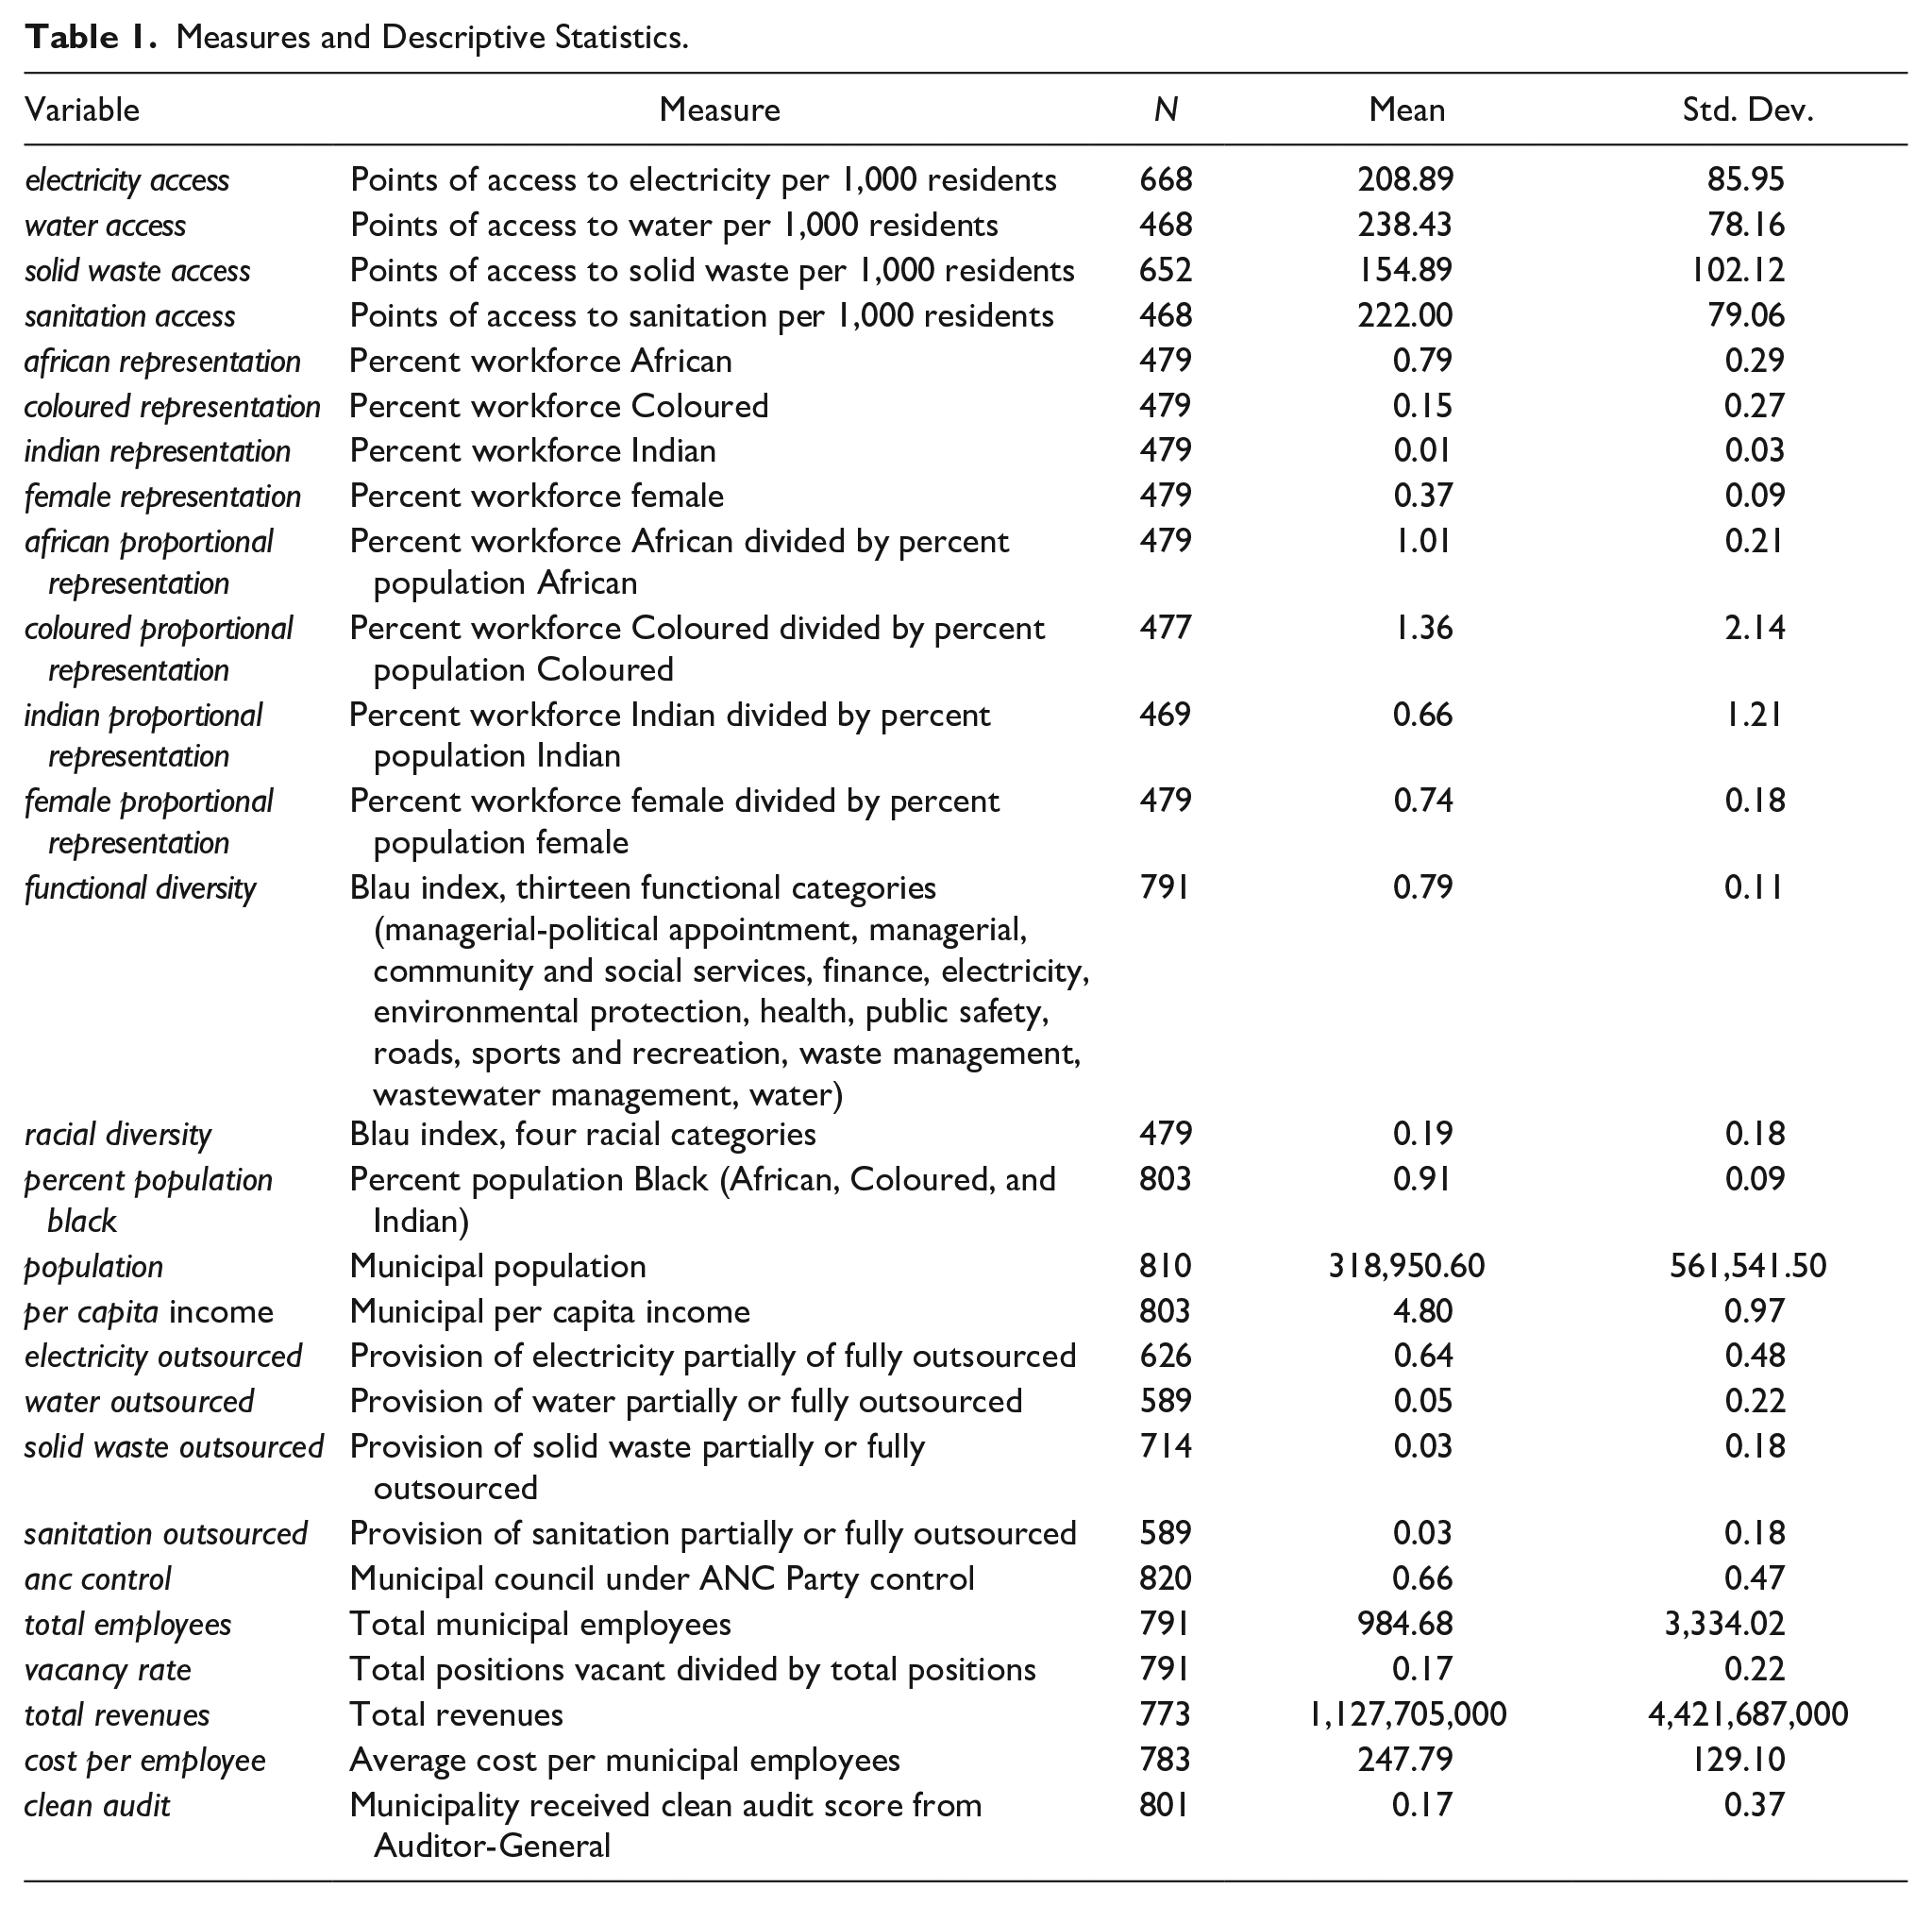
The independent variables include measures of basic and proportional representation in the municipal workforce: african representation, coloured representation, indian representation, and female representation, along with african proportional representation, coloured proportional representation, indian proportional representation, and female proportional representation. We also include measures of racial and functional diversity in the municipal workforce: racial diversity and functional diversity. Functional diversity pertains to the primary function performed by employees for the local government (e.g., finance and administration, public safety, and community and social services). Both forms of diversity are operationalized using Blau’s index,
t
We control for several factors that may impact both organizational performance and the demographic composition of the municipal workforce. The sources of data for these variables are Stats SA’s Non-Financial Census of Municipalities and Financial Census of Municipalities, the Auditor-General’s Municipal Management Finance Act Consolidated General Reports, Stats SA’s Census, and the Electoral Commission of South Africa. A series of variables control for the demographics of municipalities: percent of the municipal population that is Black, total population (logged), and per capita income. Because a local government’s responsibility for delivering a service does not preclude it from outsourcing it, the models control for whether the service is outsourced. We also control for whether the ANC controls the municipal council to account for political factors that may shape personnel decisions and policy outcomes. In addition, the models include controls for characteristics of the municipal government, including number of employees (logged), cost of hiring an employee, total revenues (logged), the employee vacancy rate, and whether the municipality received a clean audit from the Auditor-General. Finally, dummy variables for years are included in the models.
Researchers consider representative bureaucracy an explanatory theory and seek to make causal inferences about representation’s effect on bureaucratic outputs and performance (e.g., Bradbury & Kellough, 2011; Ding et al., 2021; Fernandez, 2020; Keiser et al., 2002; Meier & Stewart, 1992; Meier et al., 1999). Our empirical approach, therefore, is to use a fixed effects estimator to analyze an unbalanced panel of South African municipalities over a 3-year period (2014–2016). Such an approach controls for all time invariant factors that could affect both representation and outcomes, thereby allowing us to rule out many more potentially confounding factors and reduce omitted variable bias more effectively than a cross-sectional approach (Wooldridge, 2010). Our models also include robust standard errors clustered by local government.
The panel data set consists of all South African local governments responsible for providing electricity, solid waste, water, and sanitation services from 2014 to 2016. In a system of overlapping jurisdictions, where smaller local municipalities exist within the boundaries of a district municipality, not every local government in South Africa is responsible for providing these services. Local municipalities and the corresponding district municipality work together to determine responsibility for providing services. From 2014 to 2016, there were 668, 468, 652, and 468 municipalities responsible for providing electricity, water, solid waste, and sanitation, respective. Merging these various data sources resulted in samples sizes of 325 for electricity, 264 for water, 377 for solid waste, and 264 for sanitation. Most of the missing data was due to less than two-thirds of municipalities reporting demographic data to the Department of Labour.
Findings
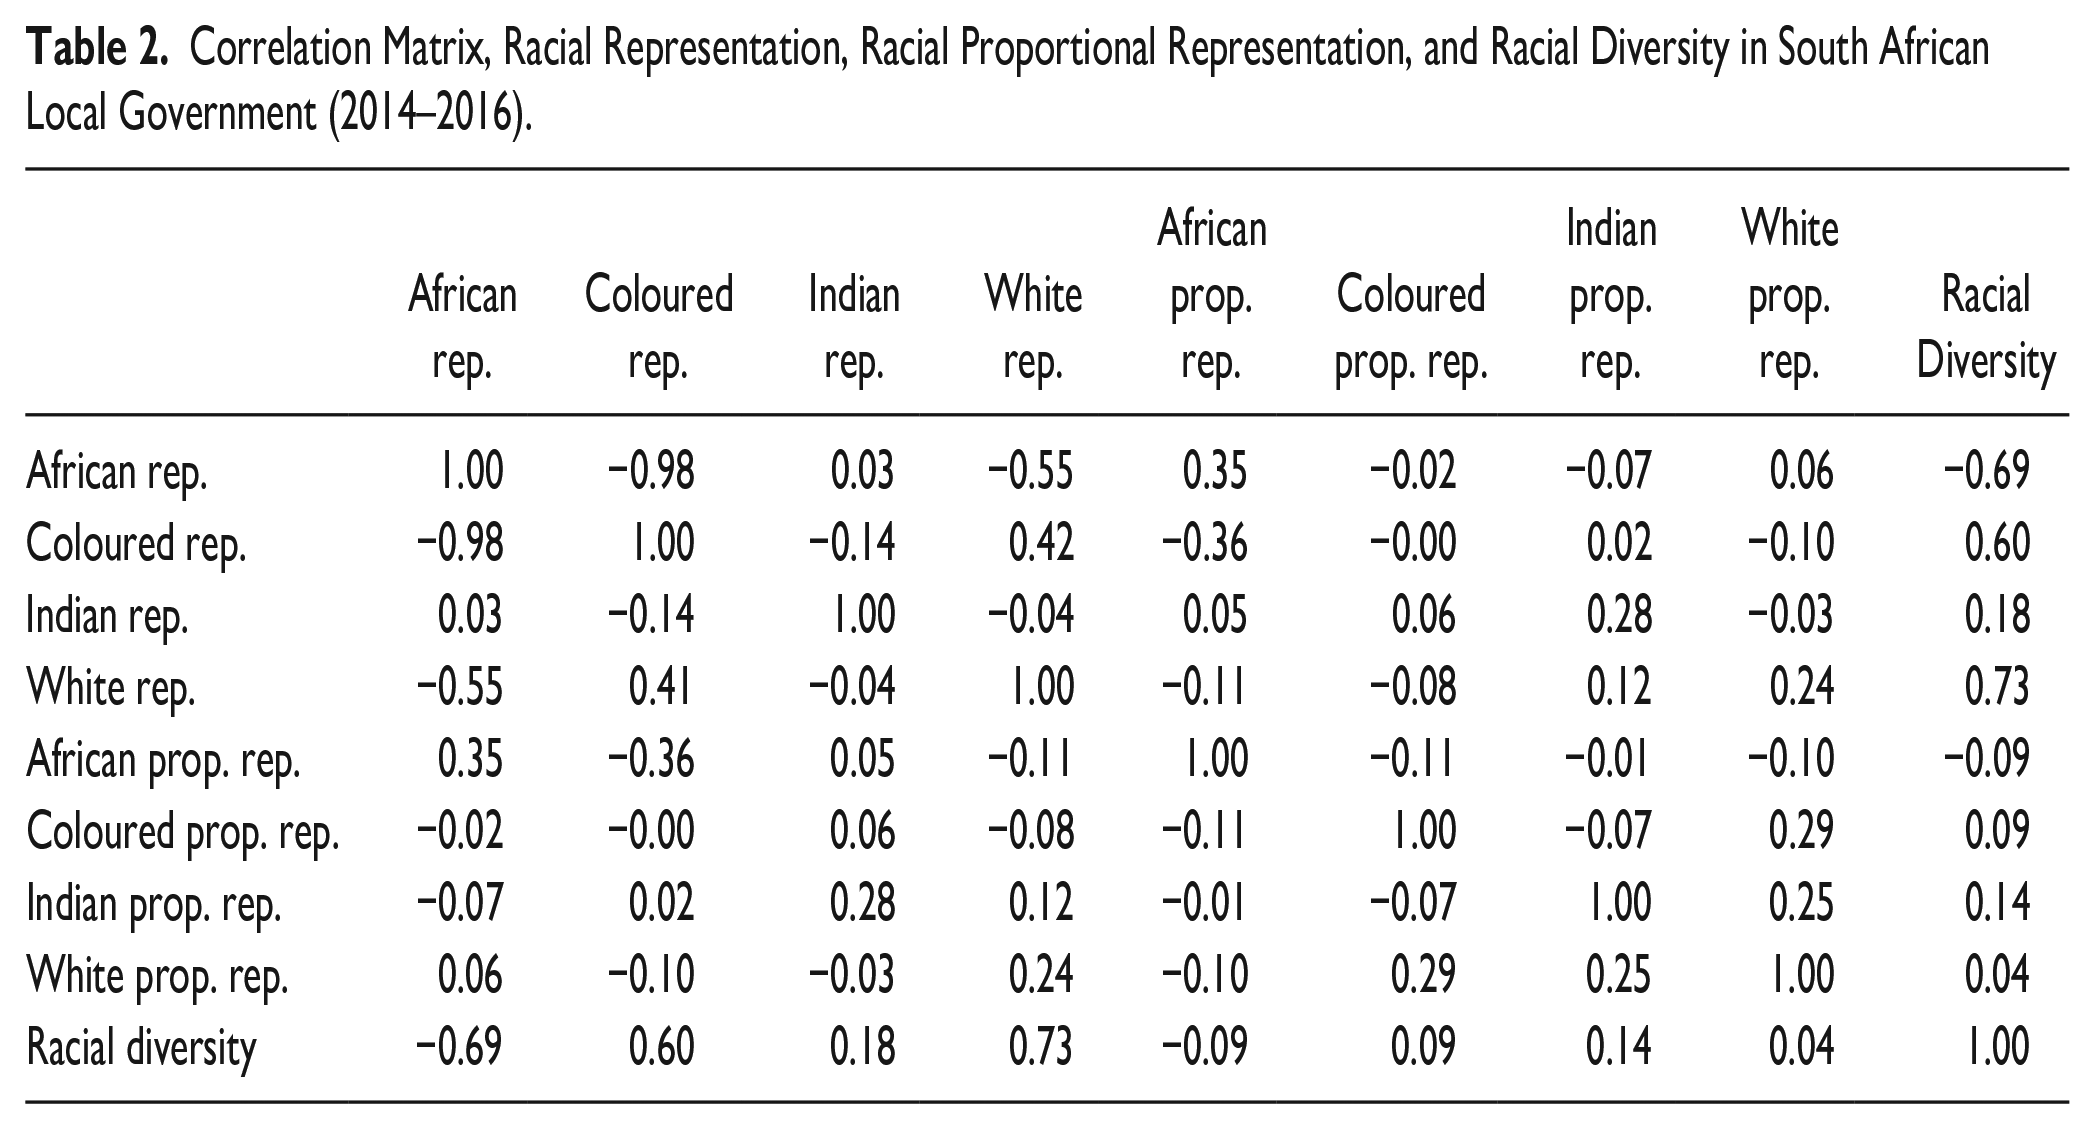
Before reporting the regression results, we examine the relationship between racial representation and racial diversity, the two main concepts of interest. South Africa has four officially designated racial groups: Africans (80.2% of population), Coloureds (8.8% of population), Indian (2.5% of population), and White (8.4% of population) (Statistics South Africa, 2011). Africans, Coloureds, Indians, women, and people with disabilities are historically disadvantaged groups and the intended beneficiaries of affirmative action. South Africa has a relatively homogenous population where Africans constitute a large majority, one significantly larger than the dwindling White majority in the U.S., whose population is increasingly becoming more diverse.
Table 2 shows the bivariate correlations between representation of the four racial groups and racial diversity, measured using the Blau index, for a 3-year panel (2014–2016) of local governments in South Africa. Representation of the African majority is negatively related to racial diversity. Conversely, representation of each minority group—Coloureds, Indians, and Whites—is positively related to racial diversity. A similar pattern was uncovered when we analyzed a 10-year panel (2006–2015) of national government departments (results not shown). To achieve the highest score of 0.75 on the Blau index, each group would have to constitute 25% of the workforce. Hence, public organizations in South Africa may become either more representative by hiring employees from each racial group according to their share of the population or more diverse by overrepresenting the three minority groups and underrepresenting the large African majority. Because of the homogenous nature of the population, they appear unable to have both a representative bureaucracy and a highly diverse workforce. This signifies a trade-off between proportional racial representation and racial diversity in homogenous countries, confronting public officials with a choice between policies to promote representativeness or diversity. It also illustrates why representation and diversity are distinct concepts and how representation of racial majorities can be negatively related to diversity in racially homogenous countries.
Correlation Matrix, Racial Representation, Racial Proportional Representation, and Racial Diversity in South African Local Government (2014–2016).
The discussion now turns to the regression results, focusing first on the impact of basic representation on performance. The regression results offer some evidence basic representation of historically disadvantaged racial groups impacts access to public services (Table 3, Models 1–4). Model 3 indicates an increase in the percent of the municipal workforce that is African, the historically disadvantaged majority group, increases access points per 1,000 residents to solid waste (coefficient of 573.25, p < .05). Basic representation of Coloureds and Indians, historically disadvantaged minority groups, is not related to access to services. Basic representation of women is negatively related to access points per 1,000 citizens to electricity (coefficient of-169.55, p < .05) and water (−147.91, p < .05). As argued above, women, a historically disadvantaged group, have not gained from redress policies to the same extent as Blacks. And since women and men would seem to benefit equally from water, electricity, sewage, and waste collection, provision of these basic public services is not particularly salient in regard to gender. The fact this precondition for active representation is not met in the South African context likely accounts for this finding. Lack of saliency also seems to account for why other studies fail to find a link between gender representation and bureaucratic outcomes in a variety of settings (see Keiser et al., 2002). We also explored the possibility a critical mass of female basic representation must be achieved for female representation to impact performance (Nicholson-Crotty et al., 2017). However, a quadratic term for female basic representation failed to achieve statistical significance when inserted in Models 1 to 4.
Two-Way Fixed Effects Regression Results, DV’ s = Service Connections per 1,000 Citizens.
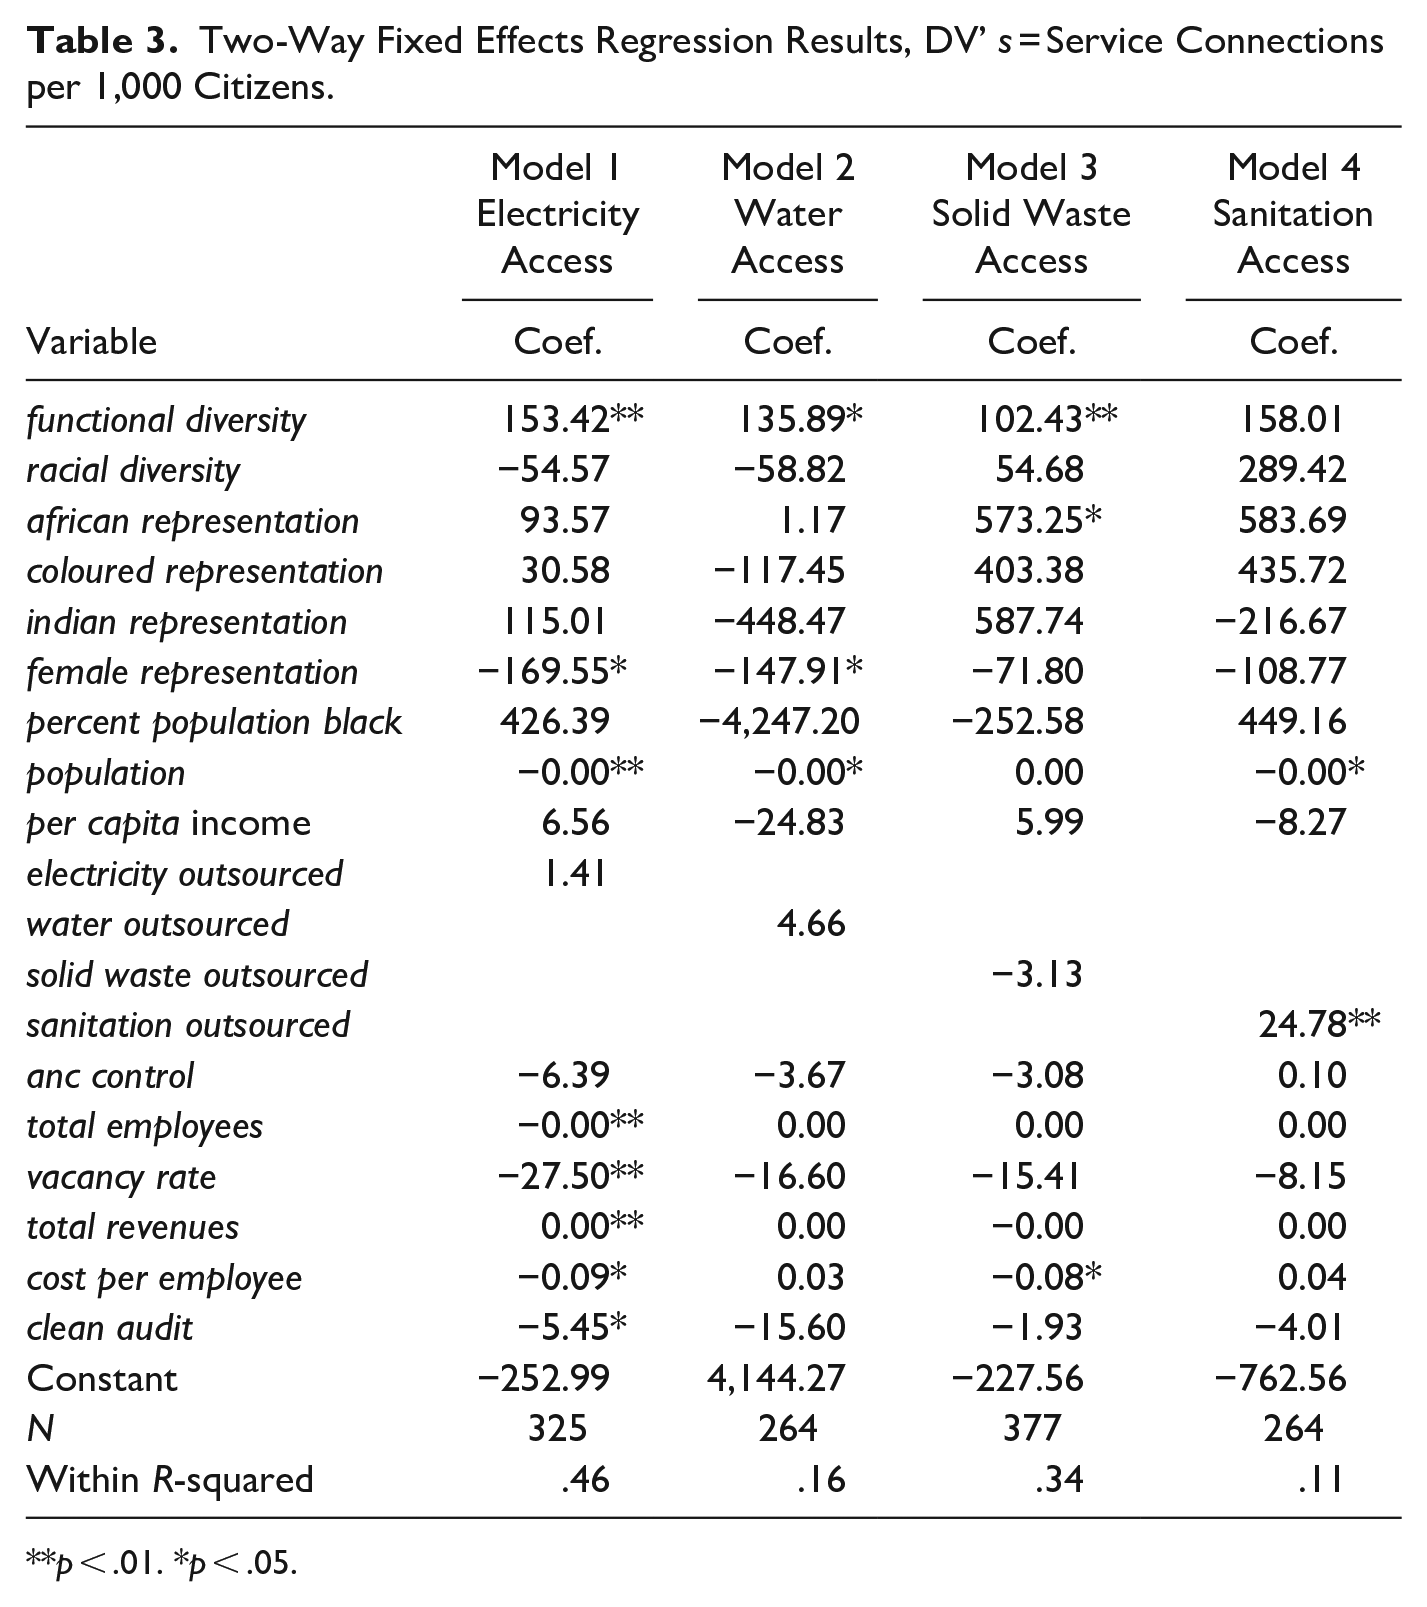
p < .01. *p < .05.
The results from Models 5 to 8 (see Table 4) offer stronger evidence proportional representation of historically disadvantaged racial groups positively impacts access to public services. An increase in proportional representation of Africans increases access points per 1,000 residents to solid waste (coefficient of 52.72, p < .01) and sanitation (coefficient of 50.43, p < .05). Although the magnitude of the effect is much smaller, an increase in proportional representation of Coloureds increases access to electricity (1.01, p < .01) and solid waste (coefficient of 1.10, p < .05). We find proportional representation of women is negatively related to access points per 1,000 citizens to electricity (coefficient of −65.33, p < .05). As with basic representation, we failed to find evidence of the need to achieve a critical mass for female proportional representation to influence performance.
Two-Way Fixed Effects Regression Results, DV’s = Service Connections per 1,000 Citizens.
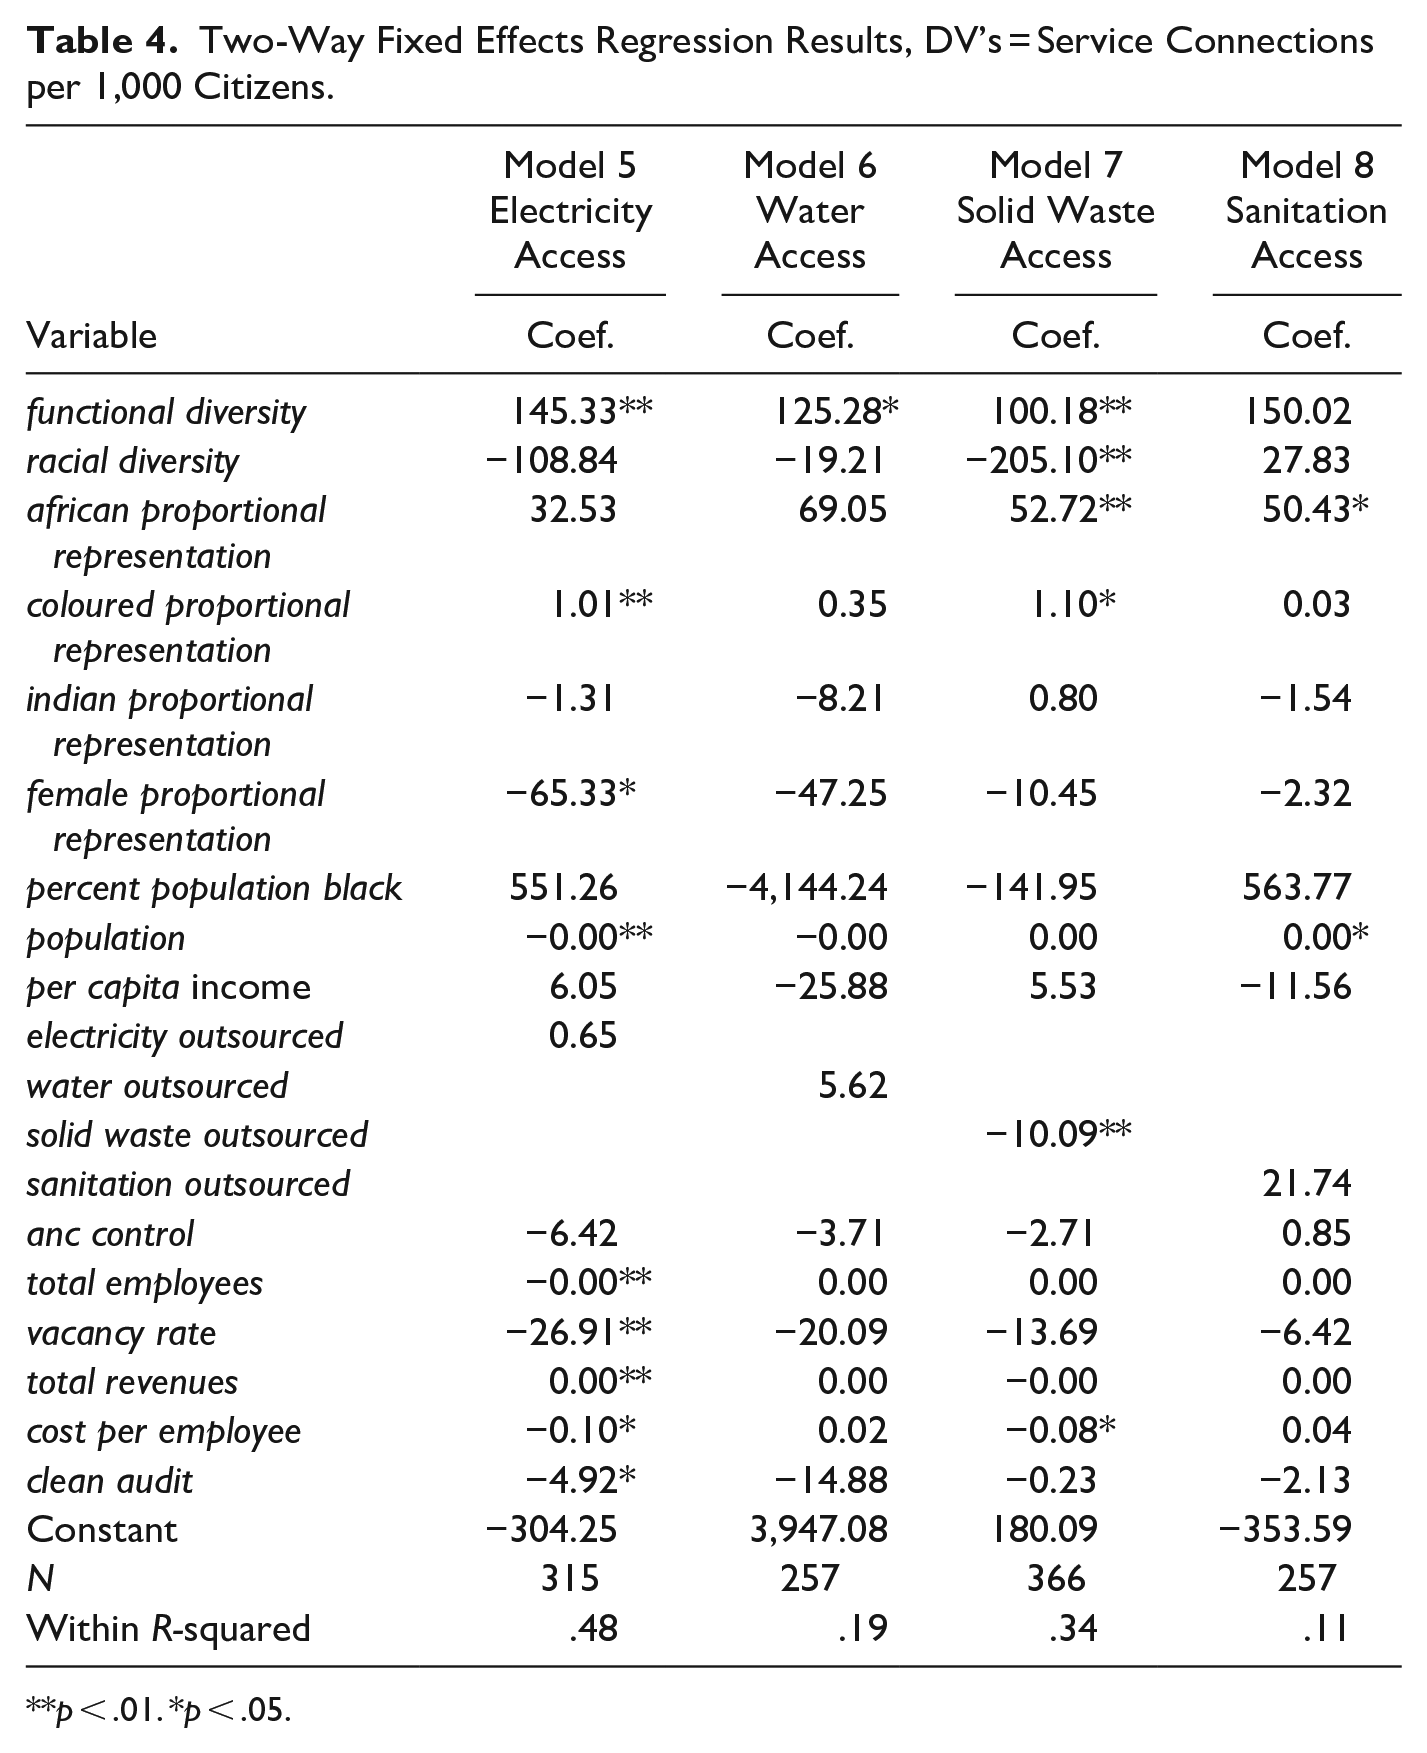
p < .01. *p < .05.
In short, the evidence suggests proportional representation of historically disadvantaged racial groups, particularly Africans and Coloureds, may matter more than basic representation when it comes to increasing access to public services, especially those involving close interaction with and coproduction by citizens. As discussed previously, representation can influence performance through pathways like better communication between bureaucrats and citizens and greater coproduction. We find proportional representation of two Black groups, Africans and Coloureds, positively impacts provision of solid waste. Of these four services, solid waste collection is the one that is most labor intensive and requires direct contact with citizens coproducing the service. Coloureds and especially Africans are more often multilingual, speaking various languages from among the 12 official ones in South Africa. Representing them in proportion to their share of the population, therefore, may improve the quality of interactions and facilitate communication between bureaucrats and citizens by reducing status differences between them, as Groeneveld and Meier (2022) note, as well as by increasing the odds citizens encounter bureaucrats who speak their primary language. A mere increase in basic representation may not suffice to infuse the bureaucracy with proficiency in the various languages needed to effectively communicate and work with the South African citizenry. South Africa also has a long history of distrust of bureaucracy (Fernandez, 2020). Greater proportional representation, so that the overall workforce more closely reflects the community, may be necessary to encourage compliance and coproduction by large numbers of citizens belonging to myriad ethno-linguistic groups, nearly all of which experienced violent oppression at the hands of the apartheid bureaucracy prior to 1994.
Shifting the focus from representation to diversity, we find very little evidence of a relationship between racial diversity and performance. In seven of the eight models, the variable racial diversity fails to achieve statistical significance, even at p < .10. Only Model 7 indicates a relationship between racial diversity and access per 1,000 residents to solid waste, and in this case, the relationship is negative (coefficient of −205.10, p < .01). When it comes to functional diversity, however, the regression models offer strong evidence of its positive impact on performance. In six of the eight models (Models 1–3 and 5–7), the coefficient for functional diversity is positive and statistically significant at either p < .05 or p < .01.
Taken together, the diversity results are consistent with findings from meta-analyses showing diversity in terms of highly job-relevant attributes like education, occupation, or functional expertise contributes more to performance than racial, ethnic, or other forms of relations-oriented diversity (Bell et al., 2011; Horwitz & Horwitz, 2007; Joshi & Roh, 2009; Webber & Donahue, 2001). This appears to be the case especially in situations involving high levels of task complexity, such as provision of public services in the periphery of urban centers in developing countries where high levels of poverty and crime persist. Any advantages in information processing derived from racial diversity appear to be minimal and are offset by the negative effects of social categorization, requiring effective diversity management. Groeneveld and Meier (2022) propose the adverse effects of social categorization on diverse organizations are most severe in fractionalized societies. Our findings seems to bear this out, since we find no evidence of racial diversity improving service delivery in South Africa, a highly unequal society fractionalized along racial lines and with a long history of racial discrimination and exploitation.
Another explanation for why we find little evidence of a relationship between racial diversity and service delivery is because racial diversity is negatively related to representation of Africans. To increase racial diversity, many local governments must underrepresent Africans and overrepresent racial minorities, making the workforce less representative of the citizenry and denying it the benefits of a representative bureaucracy. For them, a more diverse workforce means fewer employees fluent in the nine languages spoken by Africans and fewer employees empathizing with and motivated to advocate for the historically disadvantaged majority.
Since serial correlation is a concern with panel data, we performed the Wooldridge test for autocorrelation for all the models using the xtserial command in Stata 16. The null hypothesis of no first-order autocorrelation was rejected for Models 4 and 8 (p < .05). We therefore estimated these models using an Baltagi-Wu GLS estimator with the xtregar command in Stata 16. The results (not shown) were generally consistent with those of Models 4 and 8, except for two notable differences. The variable african proportional representation loses its significance in Model 8 (p = .81), although importantly, the Baltagi-Wu GLS estimator reduces the sample size by more than a third, causing the models to lose statistical power. More importantly, the coefficients for functional diversity become significant in both models at p < .05 or p < .01, providing further evidence of task-oriented diversity’s impact on performance.
Turning briefly to the control variables, we find most achieve statistical significance in at least one regression model. Municipalities with shrinking populations tend to experience gains in access to public services. The findings for outsourcing are mixed, with evidence suggesting it improves access to sanitation but reduces access to solid waste collection. An increase in employee vacancies reduces access to electricity. And cities that experience reductions in employee pay tend to experience a drop in access to electricity and solid waste, alluding to the importance of pay in attracting and retaining skilled workers.
Discussion and Conclusion
This study set out to elucidate discussions of organizational demography in which experts often conflate terms like representation and diversity. Several main conclusions emerge from our theoretical and empirical analyses. First, experts should be precise in defining representation and diversity and not treat the two terms as if they are interchangeable or synonymous. Although both concepts pertain to the demographic composition of organizations, they have distinct meanings. Proportional representation refers to the extent to which a social group in the population is proportionally represented in an organization, while diversity is a quality of organizations pertaining to differences, variety, or heterogeneity among employees.
Second, and perhaps more importantly, experts should recognize representation and diversity affect performance in different ways, and not always positively. Previous studies as well as our own empirical analysis reveal that representation of historically disadvantaged groups can improve the performance of public organizations and programs, especially when bureaucrats have discretion and the values and interests of bureaucrats, citizens, and policymakers align. The effects of diversity on performance, on the other hand, vary across types of diversity and are generally quite modest. Relations-oriented diversity, including racial or ethnic diversity, can enrich organizations and groups with a variety of cultural backgrounds, values, and perspectives that may enable public managers to make better decisions. However, it also has the propensity to trigger the process of social categorization. These costs and benefits can offset or cancel each other out so that no gains in performance are achieved from greater relations-oriented diversity unless organizational leaders manage diversity effectively to mitigate the deleterious effects of social categorization and harness its benefits. Conversely, task-related diversity on highly job-relevant attributes is more likely to lead to gains in performance without leaders having to intervene to manage conflict, build trust, and improve communication. Moreover, the gains should be greater when tasks and problems are unstructured and characterized by considerable uncertainty, like in the case of South African local government service delivery. In short, we should heed the warning to avoid drawing glib conclusions about diversity being generally “good” or “bad” and not overstate its advantages for improving performance.
Finally, it is important to realize representative bureaucracies, where social groups are represented in proportion to their share of the population, are not necessarily diverse ones. In societies that are becoming more racially and/or ethnically heterogeneous like the United States, a more representative bureaucracy may become more diverse at the same time. However, in countries like South Africa, Japan, and most Western European countries that are more racially homogenous, workforces that are very diverse will have to underrepresent majority groups and overrepresent minorities to promote variety, preventing them from fully capitalizing on the advantages of representative bureaucracy. In cases like the former, organizations can enjoy the benefits of both representation and diversity, while those like the latter experience a trade-off of sorts between gains in performance derived from having a bureaucracy that mirrors the citizenry and those that come from having a diverse workforce.
Our analysis points to several directions for future research. Ample work has already been done on the effects of racial and ethnic diversity on public organizations (Pitts & Recascino Wise, 2010; Wise & Tschirhart, 2000). Researchers should begin shifting their attention toward analyzing the effects of task-related diversity in the public sector, including diversity regarding education, profession, and tenure, since these attributes are highly relevant to work and more likely to impact decision making and performance. Researchers also need to pay more attention to conceptualizations of diversity as disparity and separation, as these other types of diversity may also have consequences for public organizations. For example, organizations experiencing polarization in employee attitudes toward the organization and those with highly unequal distribution of scarce resources may become conflict-ridden and difficult to manage. Finally, additional work is needed to better understand the full range of organizational and environmental conditions that enhance or diminish the impact of different types of workforce diversity on performance.
Footnotes
Declaration of Conflicting Interests
The author(s) declared no potential conflicts of interest with respect to the research, authorship, and/or publication of this article.
Funding
The author(s) received no financial support for the research, authorship, and/or publication of this article.