






Abstract
Background
Software choice in psychology statistics courses remains debated. The long-term impact of software choice on researchers’ own use is unknown.
Objective
We sought to identify which statistical software researchers commonly used and the reasons for its use, with a particular focus on the extent to which use was related to what participants were formally taught.
Method
Psychology researchers from Canada and the United States (N=311) filled out an online survey asking about their statistical software use, preferences, and reasons for use. We conducted a content analysis to identify themes related to the use of specific software programs.
Results
Nearly all researchers (96%) used SPSS, and the primary reasons for its use were perceived ease of use and familiarity, often due to their training. Almost two-thirds of participants had used R at some point; it was the top software they wanted to improve their skills in. Common reasons for using R were its capabilities and advanced features, including an alignment with open science.
Conclusion
Reasons for using statistical software differ based on the program, with a strong contrast between familiarity-based use (SPSS) and capacity-driven use (R).
The culture surrounding academic research is undergoing a significant transformation, with increasing emphasis on open science principles such as transparency, reproducibility, and accessibility (Asendorpf et al., 2013; Miguel et al., 2014; Peng, 2015). This shift has important implications for how psychology courses, particularly those focused on research methods and statistics, are taught. As peer-reviewed publications increasingly require data and code availability statements for publications, it becomes imperative for academic programs to equip students with the necessary skills and practices to meet evolving research expectations. Statistical software is one component of skills-based training typically provided in undergraduate programs. However, little empirical attention has been given to how early exposure to statistical software during training influences researchers’ long-term research practices. In the absence of broader data on researchers’ familiarity with and usage of software, it is difficult for instructors to situate course-level decisions in relation to potential long-term impacts on research and open science practices. In the current study, we asked researchers from Canada and the United States about their familiarity with, and reasons for using, different types of statistical software in their research. We aimed to explore the extent to which software use and familiarity relate to open science, training in statistics courses, or other educational contexts.
Formal Training and Skills in Methodological and Open Science Practices
For students to become proficient in open science practices 1 , they must be explicitly taught, ideally with hands-on opportunities for students to engage in the practices themselves. This need is explicitly recognized in the American Psychological Association (APA) guidelines, which underscore the importance of statistical proficiency and open science practices as key components of modern undergraduate psychology degrees (APA, 2023). How best to incorporate open science skills into psychology curricula in North America is a topic of ongoing discussion; significantly fewer papers address the pedagogy of open science than open science in research more broadly. Some exceptions include Morling and Calin-Jageman (2020), who provide recommendations for teaching practices related to open science and statistical estimation, and Frankowski (2023) who discuss using course-based research projects to teach open science practices. Additionally, in a systematic review, Pownall et al. (2023) found evidence that teaching about open science or embedding open science practices, such as pre-registration or open data, in courses was associated with stronger scientific literacy and greater student engagement. These papers all provide some recommendations and highlight the benefits of incorporating open science into different types of psychology courses.
Because statistics courses are a requirement of virtually all psychology degrees in North America at the undergraduate (Halili-Sychangco, 2023; Norcross et al., 2016) and graduate level (Aiken et al., 2008; Counsell et al., 2016), they provide a particularly influential context for modeling and teaching open science practices. Further, these courses routinely involve hands-on engagement with data analysis, making them well-suited for introducing practices such as data and code sharing and reproducing analytic results, both of which align with the open science principles of transparency and reproducibility. However, in a Delphi study conducted with instructors in the United Kingdom, Thibault et al. (2024) found variability in the perceived necessity of including open science and methodological skills in undergraduate methods and statistics courses. Some open science topics, such as reproducibility, generalizability/robustness, research misconduct, and questionable research practices, reached consensus, while others did not (e.g., data, code, and material sharing as well as preregistration and registered reports). Notably, specific open science practices, rather than broader principles, were less likely to reach consensus, highlighting a discrepancy between theory and the hands-on skills relevant for open science in undergraduate curricula. Thibault et al. (2024) also found a lack of consensus regarding the use of particular kinds of statistical software, mirroring debates in North America (e.g., Counsell & Cribbie, 2020; Rode & Ringel, 2019).
Statistical Software
Incorporating statistical software into psychology statistics courses is both common (Davidson et al., 2019) and recommended as best practice (GAISE College Report ASA Revision Committee, 2016). At a fundamental level, the software used in a statistics course is often a means to an end: facilitating the development of statistical reasoning, data analysis skills, and conceptual understanding. However, statistical software functions not only as a tool for analyzing data, but also as a core component of students’ professional preparation, supporting readiness for graduate training and careers beyond academia. Accordingly, software fluency is often treated as an indicator of job readiness, with recent reports emphasizing that psychology graduates are expected to demonstrate proficiency and adaptability in working with data analysis tools (Naufel et al., 2018). Furthermore, for students in psychology graduate programs, statistical software is a crucial tool in many research projects that increasingly require complex data structures and analyses.
Software packages may vary in how effectively they support instructional goals and job readiness. Abbasnasab Sardareh et al. (2021) compared several popular software programs for novice users, highlighting how technical features and human–computer interaction may support social science students in gaining introductory statistics knowledge. Although their paper did not discuss open science, their analysis highlights how software differs along dimensions that are increasingly relevant for open science and long-term skill development, including whether tools are freely accessible and open-source, and whether analyses are conducted through point-and-click graphical interfaces or through written syntax. Freely available and open-source software may lower barriers to continued use beyond the classroom, whereas proprietary software can limit access once institutional licenses expire. Similarly, graphical interfaces may reduce initial learning barriers and support conceptual understanding, while syntax-based approaches can more readily support transparency, reproducibility, and scalability to more advanced analyses (Abbasnasab Sardareh et al., 2021). Taken together, these differences suggest that software selection is not pedagogically neutral, as tools may differentially shape both the data analytic skills students acquire and their capacity to engage in open and reproducible research practices over time. These considerations highlight the importance of reflecting on whether the statistical software used in their psychology courses provides sufficient opportunity to gain key methodological skills recommended by the APA (2023).
We identified two complementary theoretical models relevant to the use of statistical software for fostering open science and broader methodological skills within and beyond the classroom: the Technology Acceptance Model (TAM; Davis, 1985) and the COM-B model for behavioral change (Michie et al., 2011).
Technology Acceptance Model
The TAM posits that technology design features influence a user's perceived ease of use and perceived utility of the technology, which in turn are key factors in shaping a user's attitudes toward it and eventual use. This model could be applied to instructors’ decision-making around how they see their students as users of a statistical software program. Additionally, the perceived utility and ease of use of open science practices may relate to instructors’ attitudes toward their importance and the need to adopt them in their courses or in their own work. A limitation of the TAM for this research context, however, is the assumption of agency on the part of the user, which may not be the case for instructors. Institutional norms and constraints around software in North America vary considerably. Some instructors have the autonomy to choose the statistical software for their own courses, whereas others must adhere to departmental-level standards or obtain approval from other decision-makers. Likewise, students are also bound by their institutional constraints, which could limit the degree to which they learn additional software beyond that which is taught to them. That said, the TAM may be particularly appropriate for researchers using statistical software in their own work, when they have a choice.
The COM-B
This framework proposes that capacity (C), opportunity (O), and motivation (M) are all necessary components required for behavioral change (B). More specifically, capacity refers to an individual's psychological or physical ability for the behavior, whereas opportunity relates to the external factors that dictate whether a behavioral change is possible. The theory proposes that capacity and opportunity influence the relationship between motivation and behavior rather than the direct behavior itself. This model offers a complementary lens to the TAM in examining how both researchers’ desire to use different software programs and instructors’ pedagogical choices are shaped within their own contexts. For example, within the TAM, if an instructor or user doesn’t believe that a given statistical software package has high utility or is relatively easy to use, they are less likely to perceive the software favorably and adopt it. However, instructors who do not feel that they have the capacity or skills to use a particular software, do not have the decision-making power to choose the software, or lack motivation to change course materials due to limited resources or time constraints, will not adopt a new software even if they see its utility and value. Similarly, when students are taught software that focuses solely on ease of use, their transition into independent researchers may result in reduced capacity, opportunity, or motivation to engage with alternative analytic tools.
Study Rationale and Aims
Because research related to statistical software tends to focus on impact within the context of a single course or academic year, longer-term consequences of pedagogical software choice are missing from the literature. Identifying researchers’ current software practices, including facilitators and barriers, can provide one snapshot of how current practices follow from training. Understanding how researchers engage with statistical software in practice is also relevant for informing curricular decisions
In the current paper, we examined psychology researchers’ use of statistical software and the reasons for using various programs. We had the following research questions:
Which statistical software programs are used by North American psychology researchers in their own work?
At what level do researchers assess their own software proficiency? Are researchers satisfied with their statistical software, or would they like to learn new software? What are the reasons North American psychology researchers identify as contributing to their use (or lack of use) of particular software programs?
To what extent do these reasons relate to their statistics course training and relevant methodological or open science skills?
Method
Study Design
We used secondary data from a larger online observational survey assessing North American researchers’ attitudes toward open science and broader methodological practices (Alter et al., 2025; Crone et al., 2026). Participants were recruited in 2021 through several channels: directly via email, via email contact with graduate coordinators at their institution, and via advertising through the Canadian/APAs and on social media (Twitter). The full survey was estimated to take approximately 30 min to complete, with a median completion time of 26.50 min. Participants who provided their email in a separate survey, separate from their responses, were entered into a draw for one of ten $50 gift cards (CAD for Canadian participants and USD for participants from the United States) as an incentive to participate. Institutional ethics approval was obtained from the host institution of the first author.
Inclusion Criteria
The dataset included 418 participants. However, some participants did not meet our inclusion criteria or data quality standards. Our target population was psychology researchers in Canada or the United States. Our first inclusion criterion was an education equivalent to or higher than a Master's degree to ensure participants had sufficient research experience for the survey questions. Our second inclusion criterion was being a researcher in psychology or a closely related field, located in either Canada or the United States. We removed 85 participants who failed to meet one or both criteria. Additionally, we excluded 11 participants who did not complete the survey and stated they wanted partial data deleted on the consent form. Finally, we removed 11 participants due to poor data quality, namely, data in which a participant completed the survey too quickly (i.e., completed the full 30-min survey in less than 10 min) or self-reported that their data should not be used in analyses in response to a question at the end of the survey.
Participants
Our final sample included 311 participants. Most of our sample identified as women (n = 198; 63.70%), with 50 (16.10%) identifying as men, 7 (2.25%) as nonbinary, and 56 (18.00%) with missing data or preferring not to report their gender. Of the 253 participants who reported ethno-racial data, most participants were white (n = 215; 85.00%); with 30 (11.86%) identifying as East Asian or Southeast Asian, 9 (3.56%) as South Asian, and 8 (3.16%) as Latin American. All remaining ethno-racial categories (Black, Middle Eastern, Arab, West Asian, Indigenous, Other groups) had four or fewer participants, each accounting for under 2% of the sample. The sample was primarily Canadian (n = 205; 65.90%), with 106 participants from the United States (34.10%). Most of the participants held an academic position at the time of participating. Just under half of the participants were Ph.D. students (n = 141; 45.3%), 9 were post-doctoral researchers (2.89%), 27 were assistant professors (8.68%), 29 were associate professors (9.32%), and 35 were full professors (11.20%). The sample also included four researchers from outside of academia (1.29%). The rest of the sample specified a different title (e.g., scientist for an undisclosed company, data analyst, sessional lecturer; n = 14; 4.50%) or had missing data (n = 51; 16.40%). Participants came from a wide variety of subdisciplines within psychology (see supplementary materials on our OSF page; Crone & Counsell, 2026).
Measures
The entire survey from the full project (including the measures for this study) can be found on the project's OSF page (Crone & Counsell, 2026). Items relevant to this paper included closed-ended questions about their software use and preferences, as well as one open-ended question. Participants were first asked to select the statistical software programs that they have used or currently use. The survey then asked follow-up questions about the software programs the participant selected. Frequency of use was assessed by asking, “From the following statistical software, please indicate how often you use each software in your work” with response options, 1 = do not use it anymore, 2 = use it sparingly or infrequently, 3 = use it for less than half my projects, 4 = use it for about half my projects, 5 = use it for the majority of my projects, or 6 = use it for all or almost all of my projects. Next, participants were asked to rate their software proficiency for each program they selected on a scale of 1 = fundamental awareness, 2 = novice, 3 = intermediate, 4 = advanced, and 5 = expert. Then, each participant was asked to select and rank their top three preferred software programs. Lastly, participants were asked to choose from a list of statistical software programs they would be interested in learning, select reasons for wishing to learn new software, and identify barriers preventing them from learning new software. Open-ended text data came from the question “In your own words, what made you select this/these choice(s) as your preferred software” after the question asking them to rank their top three preferred statistical software programs.
Research Paradigm and Analytic Approach
We applied a mixed methods approach. Quantitative data from closed-ended survey questions are presented through descriptive statistics in tables and figures. For text data from the open-ended question asking about reasons for software use/preferences, we employed a qualitative content analysis (Drisko & Maschi, 2015), taking an inductive approach, where we tried to accurately capture the words of the participants and group them accordingly, with minimal researcher interpretation. We treated each participant's text data response about a particular statistical software program as an individual meaning unit (IMU). Generally, participants’ comments explicitly identified a particular statistical software package. In cases where the comment could apply to more than one, we applied the comment to each software identified by the participant (could be up to three) unless it seemed highly implausible or too vague. Unclear or vague responses (in terms of content itself or the software it was applied to) did not receive an initial code or final theme/subtheme. A single IMU (i.e., combination of participant and software program) could reflect one or more distinct themes or subthemes, but initial codes housed under the same subtheme were only counted once per IMU. This approach ensured that our results did not unfairly weigh participants who wrote longer responses about highly similar topics.
We adopted a postpositivist research paradigm, meaning we acknowledge “that the researcher may have some influence on that being researched, but objectivity and researcher–subject independence remain important guidelines for the research process” (Ponterotto, 2005, p. 131). Consequently, we openly interrogated our own biases and interpretations throughout the qualitative analytic process, especially in refining codes, themes, and categories. While the second author took the lead on the initial codes and first round of theme generation, both authors met regularly to discuss and revise codes and themes. The theming process included at least seven iterations that arose from conversations across synchronous meeting discussions and asynchronous comments in email exchanges and collaborative documents. We also make the full text data available to readers so that they can determine the extent to which they agree with our coding and theming.
Results
Descriptive Results of Software Use, Preferences, and Proficiency
In our sample of researchers, SPSS was, by far, the most popular software, with 96% of the sample reporting using it at some point in their careers. Figure 1 displays a bar chart illustrating the use of various statistical software programs. Here, we can see that around two-thirds of the sample reported using Excel or R at some point, while Mplus was used by about one-quarter of the sample and SAS by about one-fifth. JASP, Python, Matlab, and jamovi were each used by between 12% and 16% of the sample. Of note, 90% of the sample reported using more than one statistical software (M = 3.43, SD = 1.50, Mode = 3). Two participants (both qualitative researchers) reported not using any of the statistical software listed. Because these data highlight using any software during one's training and career, we included follow-up questions to learn more about patterns of use.
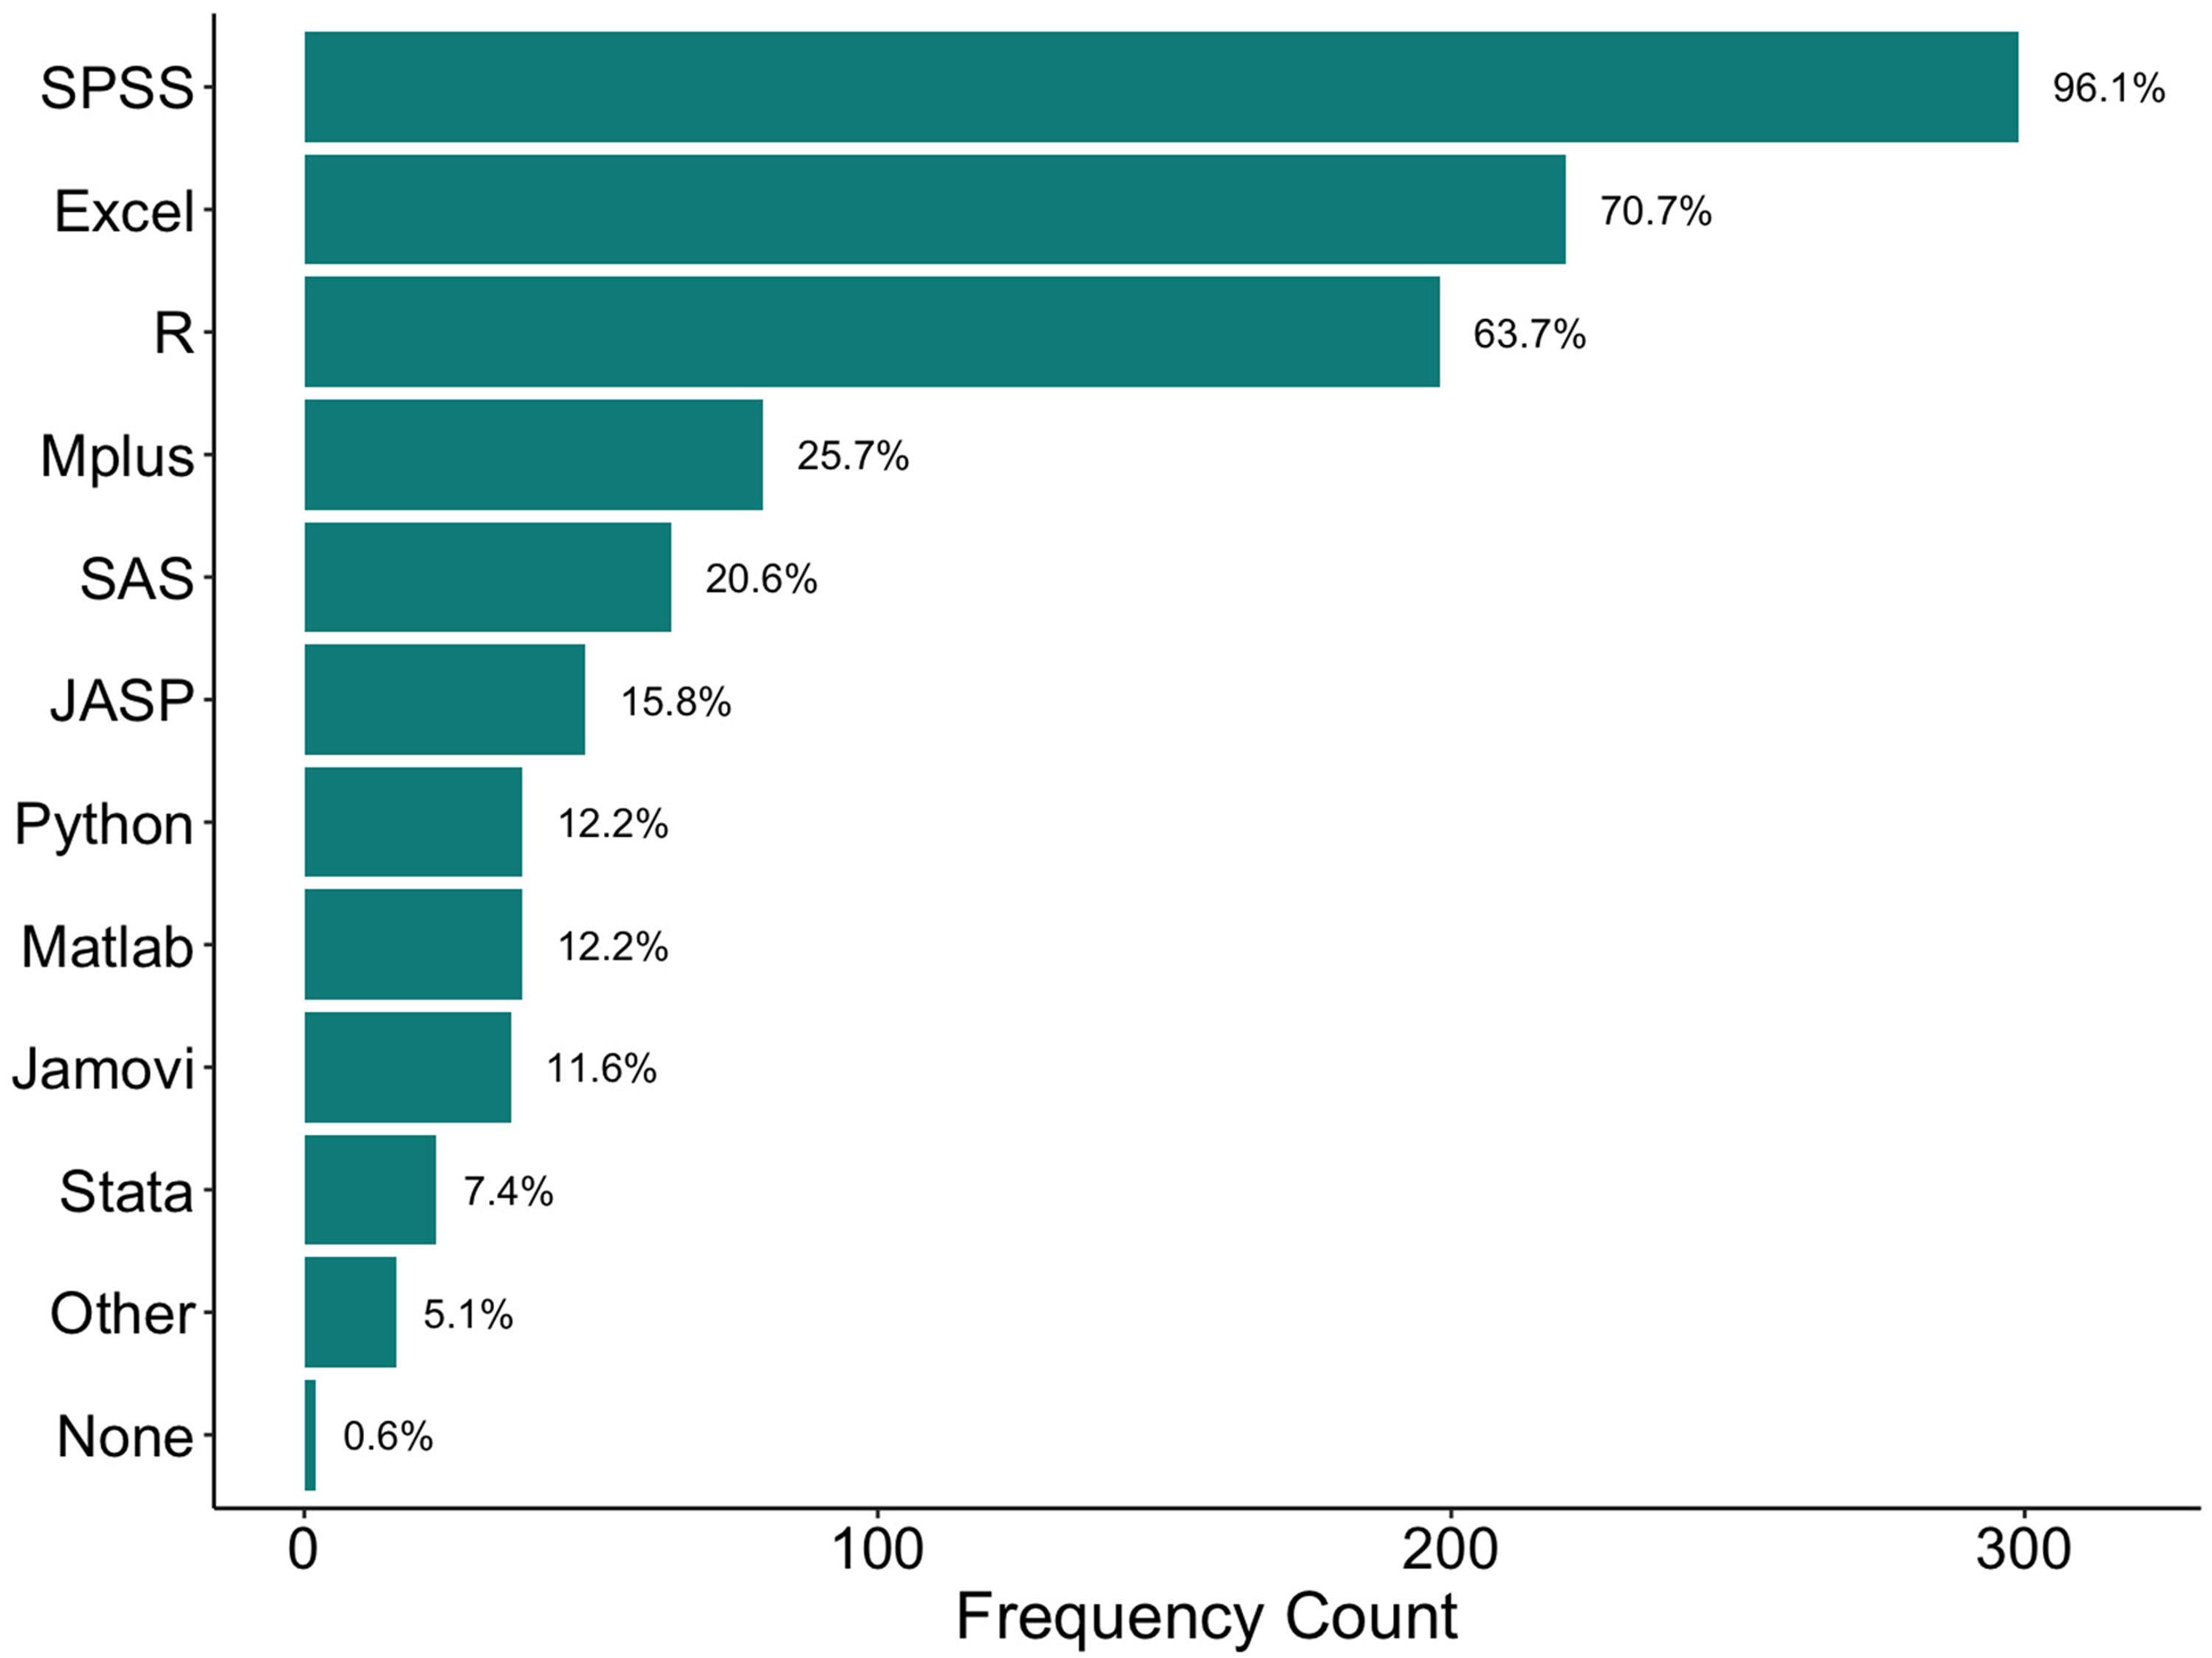
Frequency and proportion of the sample that used a given statistical software program at some point during their career.
We were also interested in participants’ frequency of software use as well as their self-assessed proficiency using any given statistical software program. Average ratings across the various statistical software programs are presented in Table 1. Those using SPSS, Excel, and/or R tended to use that software for at least half of their research projects, while those using the other statistical programs tended to report doing so infrequently for their research. Figure 2 presents a more detailed breakdown of the proportion of participants who selected any given response option for the three most popular statistical programs: SPSS, Excel, and R. This figure shows that for SPSS users, almost half of them use the software for all or almost all their projects, whereas Excel and R tend to be more evenly split between using it for all projects vs. infrequently.
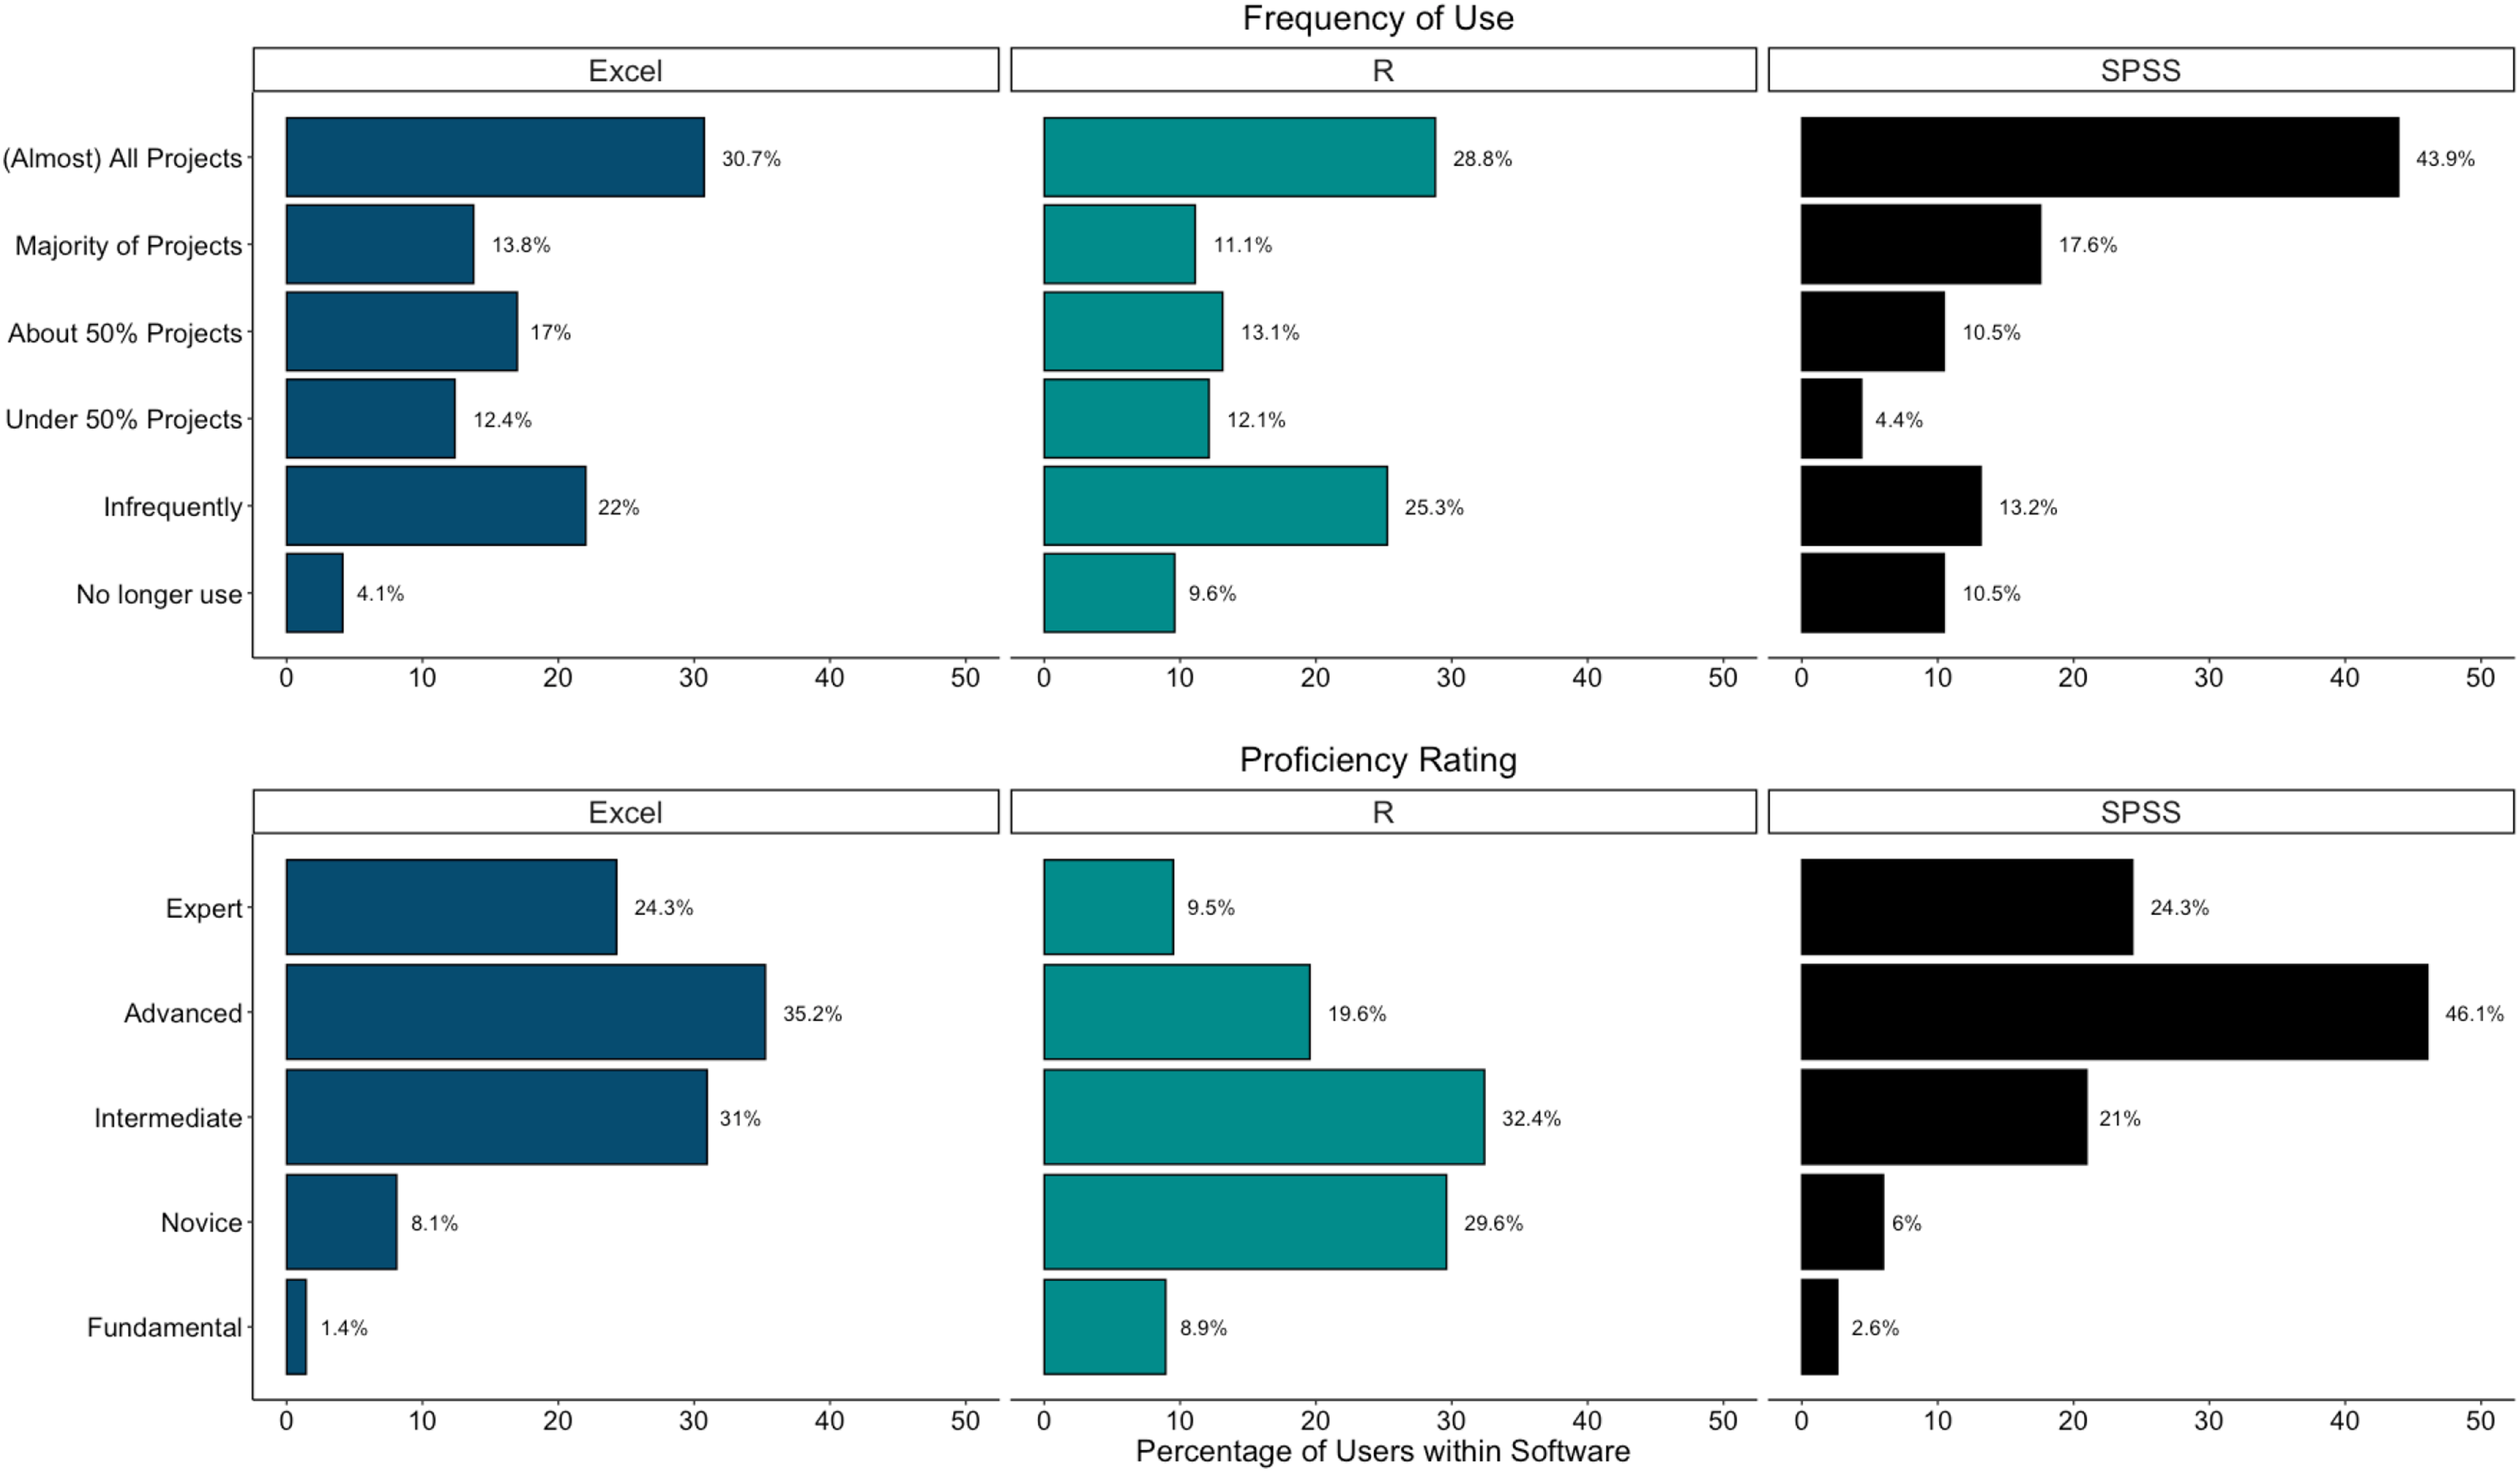
Detailed response breakdown of frequency and proficiency ratings for Excel, R, and SPSS.
Average Frequency and Proficiency Ratings Across Statistical Software Programs.
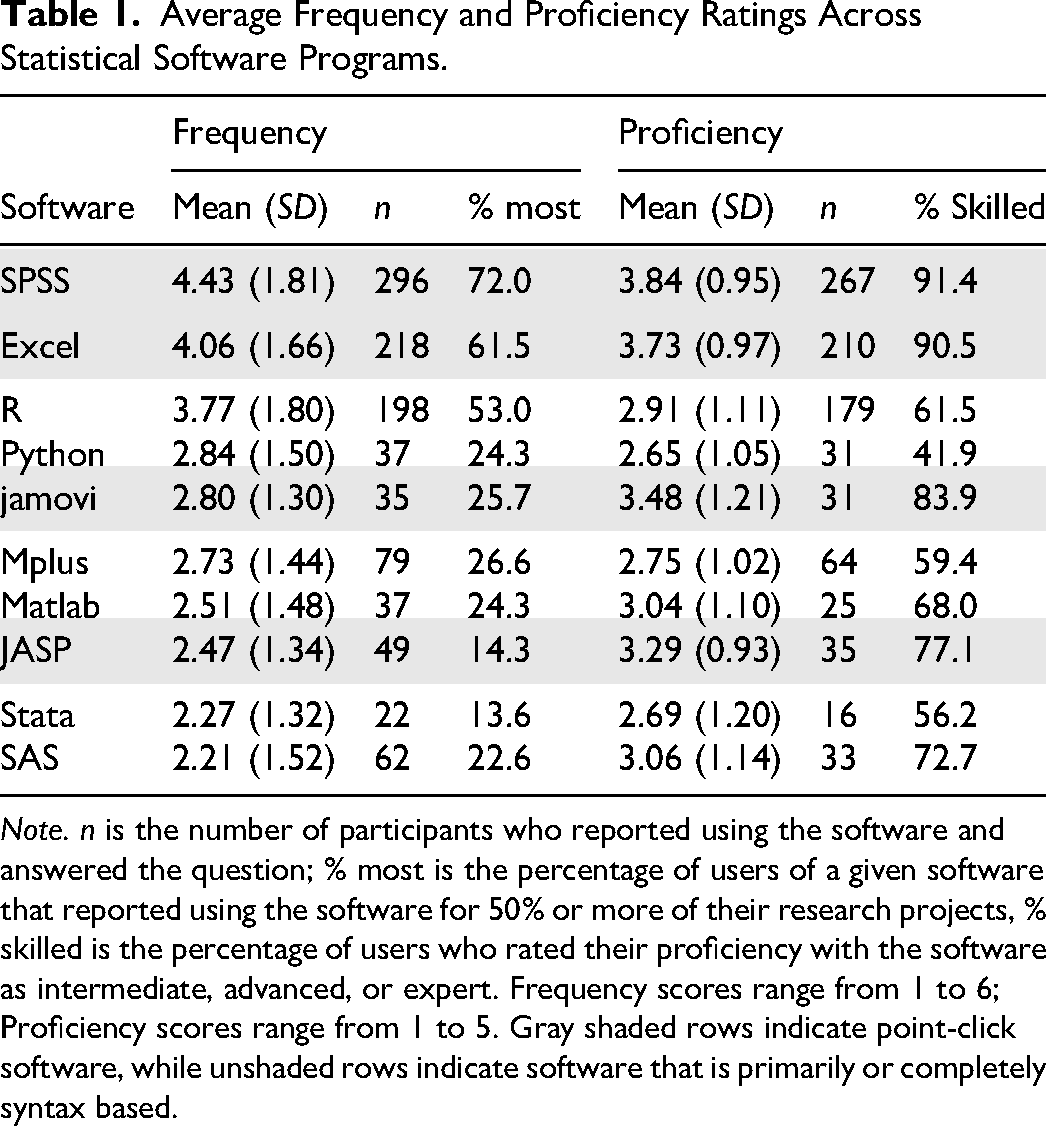
Self-assessed proficiency ratings demonstrate that over 90% of SPSS and Excel users rate their skills at an intermediate level or higher, with average scores closer to an “advanced” user. Close to 80% of jamovi and JASP users rated their proficiencies as intermediate or higher. R users tended to rate their proficiency, on average, as just under “intermediate,” with 62% above an intermediate level. Other software users tended to rate their skills around or just under an intermediate level, although a minority of Python users rated themselves as having at least intermediate skills with the software. In general, participants rated themselves as more proficient with point-click software programs compared to syntax-based ones. In fact, the lowest mean proficiency rating for a point-click software was 3.29 (JASP), which exceeded the highest mean proficiency rating for a syntax-based software (3.06 for SAS). For more details, see Table 1.
Reasons for Software use and Preferences
We had 266 participants (86%) provide interpretable data on the open-ended question describing the reasons for their preferences and use of their top-rated statistical software. After collapsing initial codes of the same theme per software and user, we ended up with 713 unique statements across all statistical software and participants. However, 39 of the codes did not make it into a final candidate theme due to the text being vague or addressing something that was fairly unique (e.g., “software strengthened statistical thinking”). Accordingly, we had a total of 674 statements in our final themed dataset. Some of our original candidate themes included a positive and negative valence to signify whether use was encouraged or discouraged, but only 31 statements (5%) had a negative valence, so our final results focus on the positively valenced themes only (N = 643 statements). Of the negative statements, comments about R generally pertained to either its perceived difficulty (n = 8) or that the participant was not familiar enough with the software through use or training (n = 5; i.e., a negative familiarity or training subtheme). Negative comments about SPSS tended to focus on its cost or being a barrier to engaging in open science (n = 5). The others described features about several software programs that participants did not like, while one participant expressed that they would use R more if their supervisor or collaborators were able to use it.
Themes around reasons for use can be organized into the following broader categories: (1) Previous Experience; (2) Alignment with Open Science Practices or Ideals, (3) Software Features and Capabilities; (4) Support and Collaboration, and (5) Analytic sufficiency and Scope of Use. Specific themes, descriptions, and example quotations per theme within each of these five categories are presented in Table 2. All coded statements can be found in a spreadsheet at on the project OSF (Crone & Counsell, 2026), which includes statements organized by theme and software, a description of the themes, and the raw text data per participant ID.
Content Analysis Themes, Description, and Example Quotations.
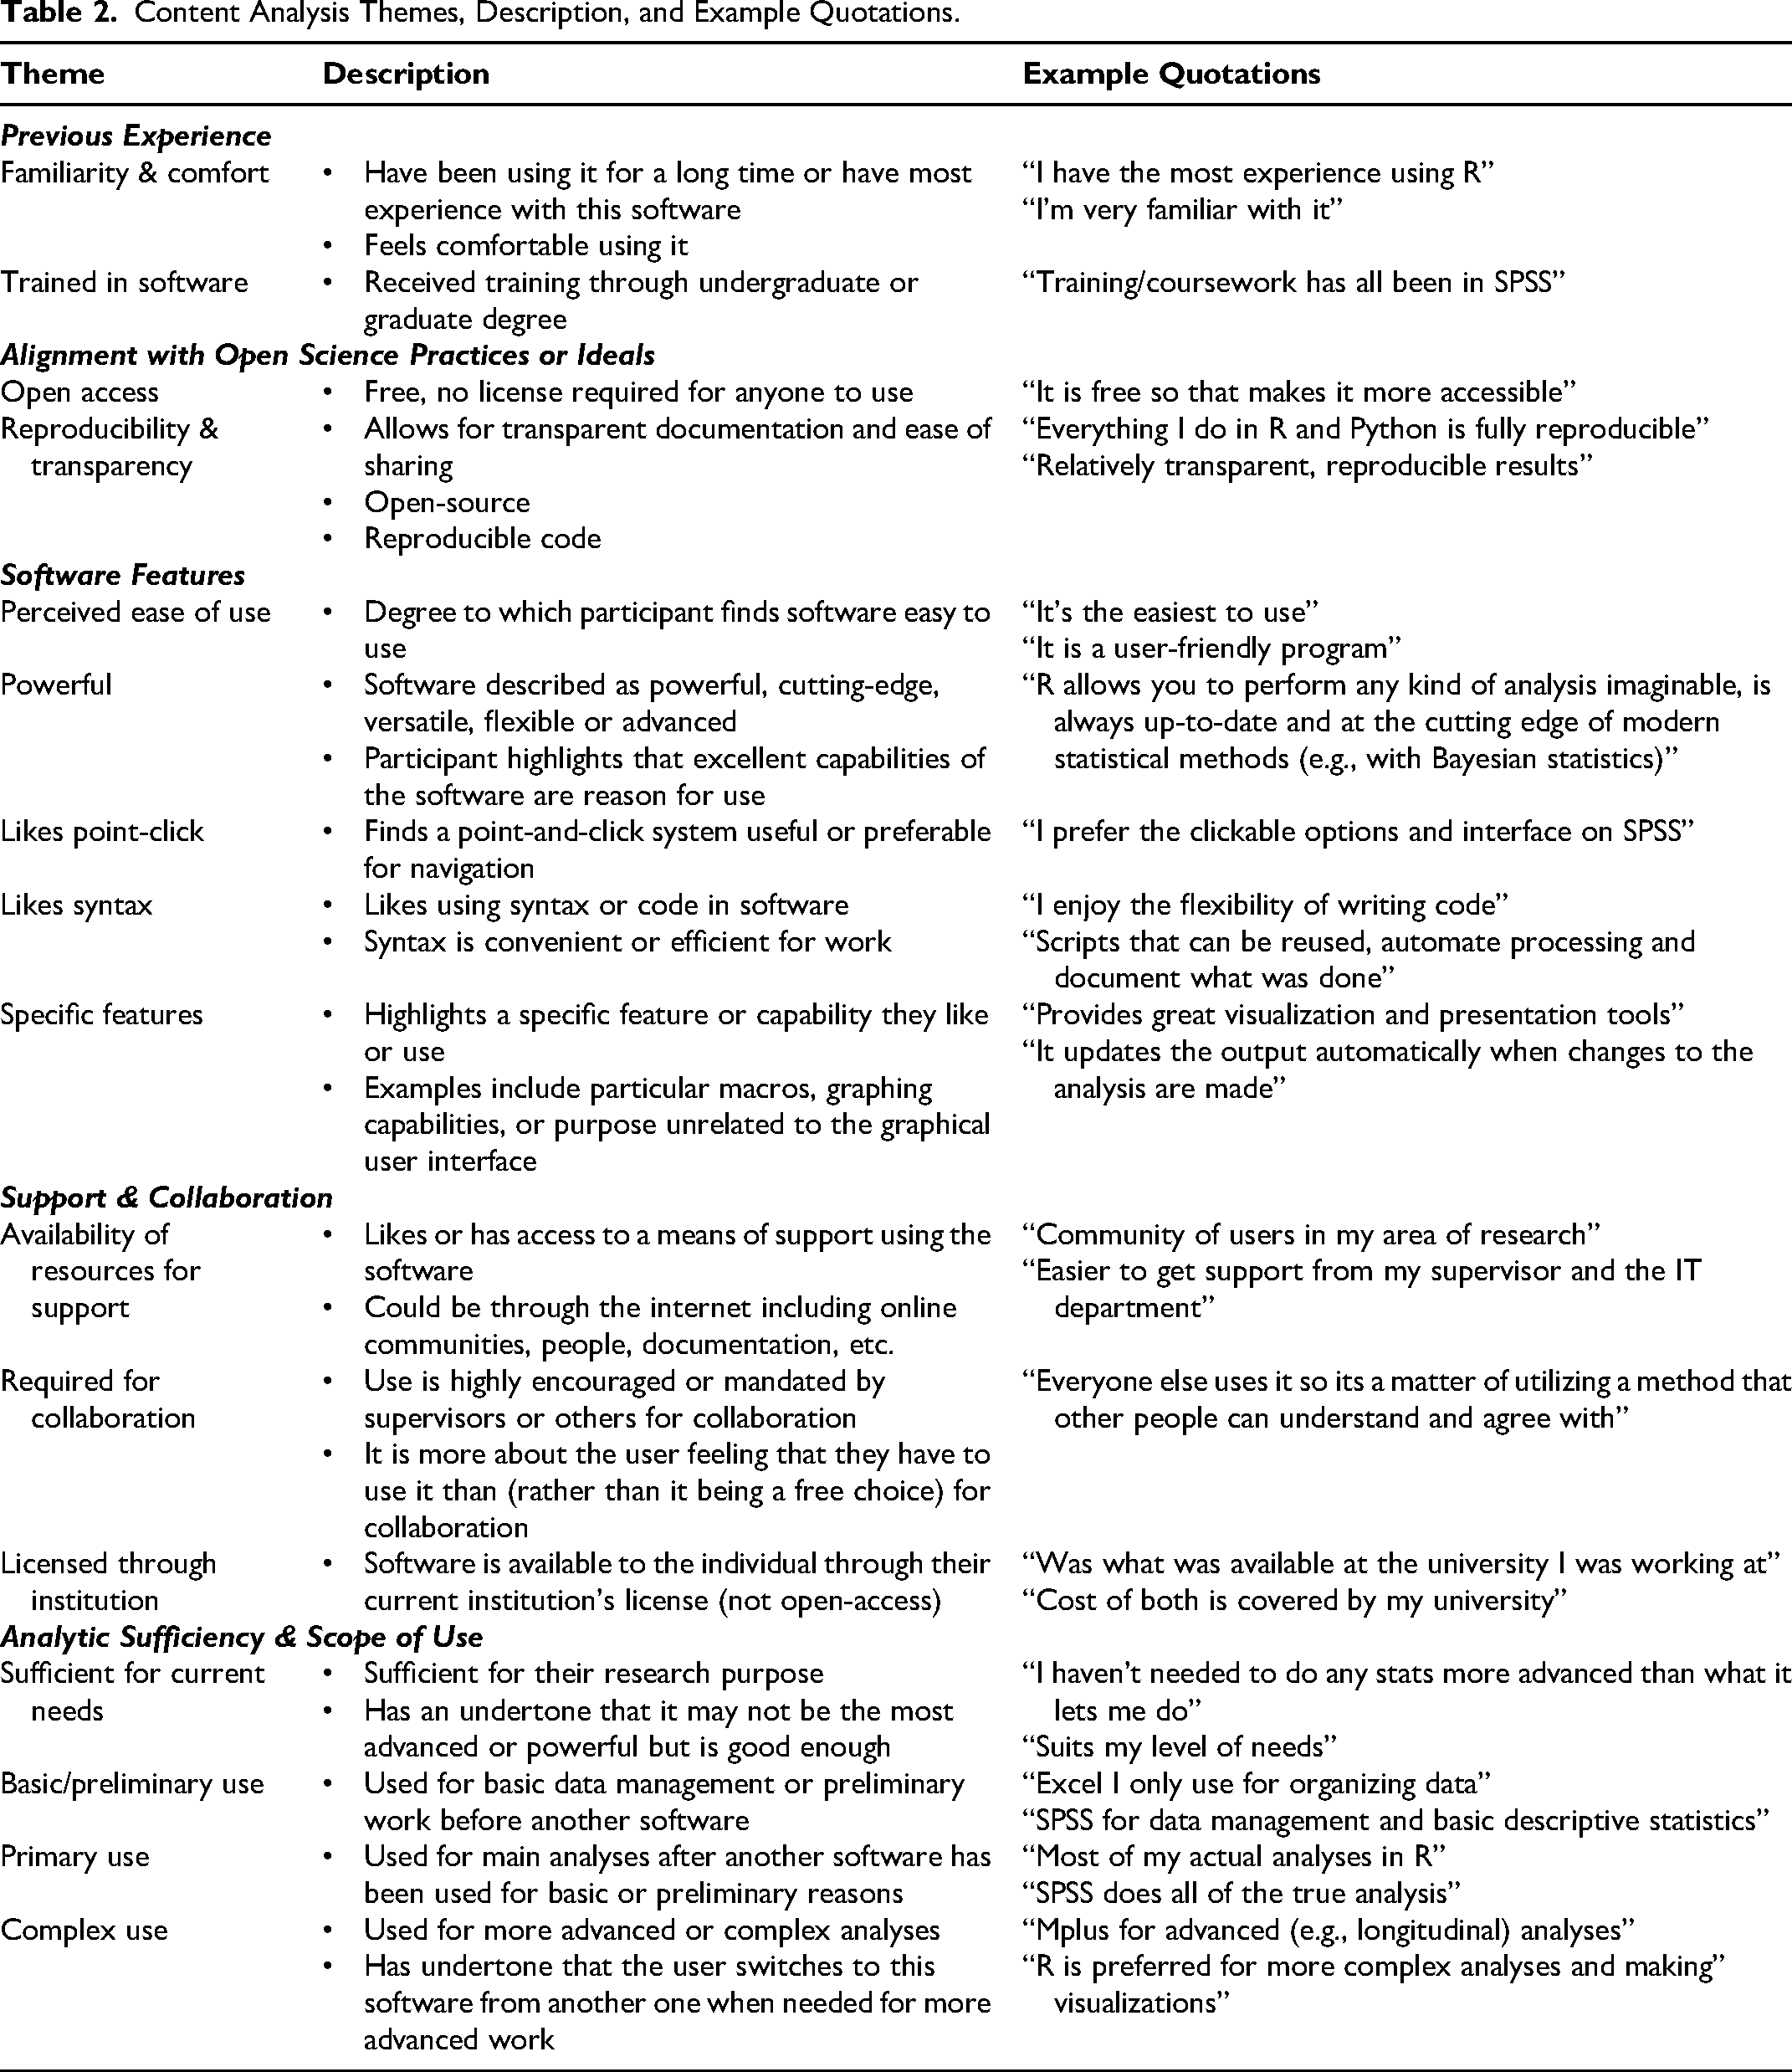
Table 3 provides frequency data about the themes for the full sample (about all software programs), as well as a breakdown separately by R and SPSS to demonstrate that reasons for use have disparate patterns based on one's preferred software. These two programs were selected as they accounted for almost 80% of all comments, are commonly used in psychology, and are strongly present in ongoing conversations about software choice in psychology statistics courses. Originally, we sought to include separate data for Excel, but only 7% of comments were about Excel. These comments generally discussed its ease of use, familiarity, and comfort, or that it was used as a basic or preliminary step before other software programs. Readers interested in the breakdown by other software programs can refer to the full text data on the OSF project page.
Frequency of Themes for all Software Comments and Separated by SPSS and R.
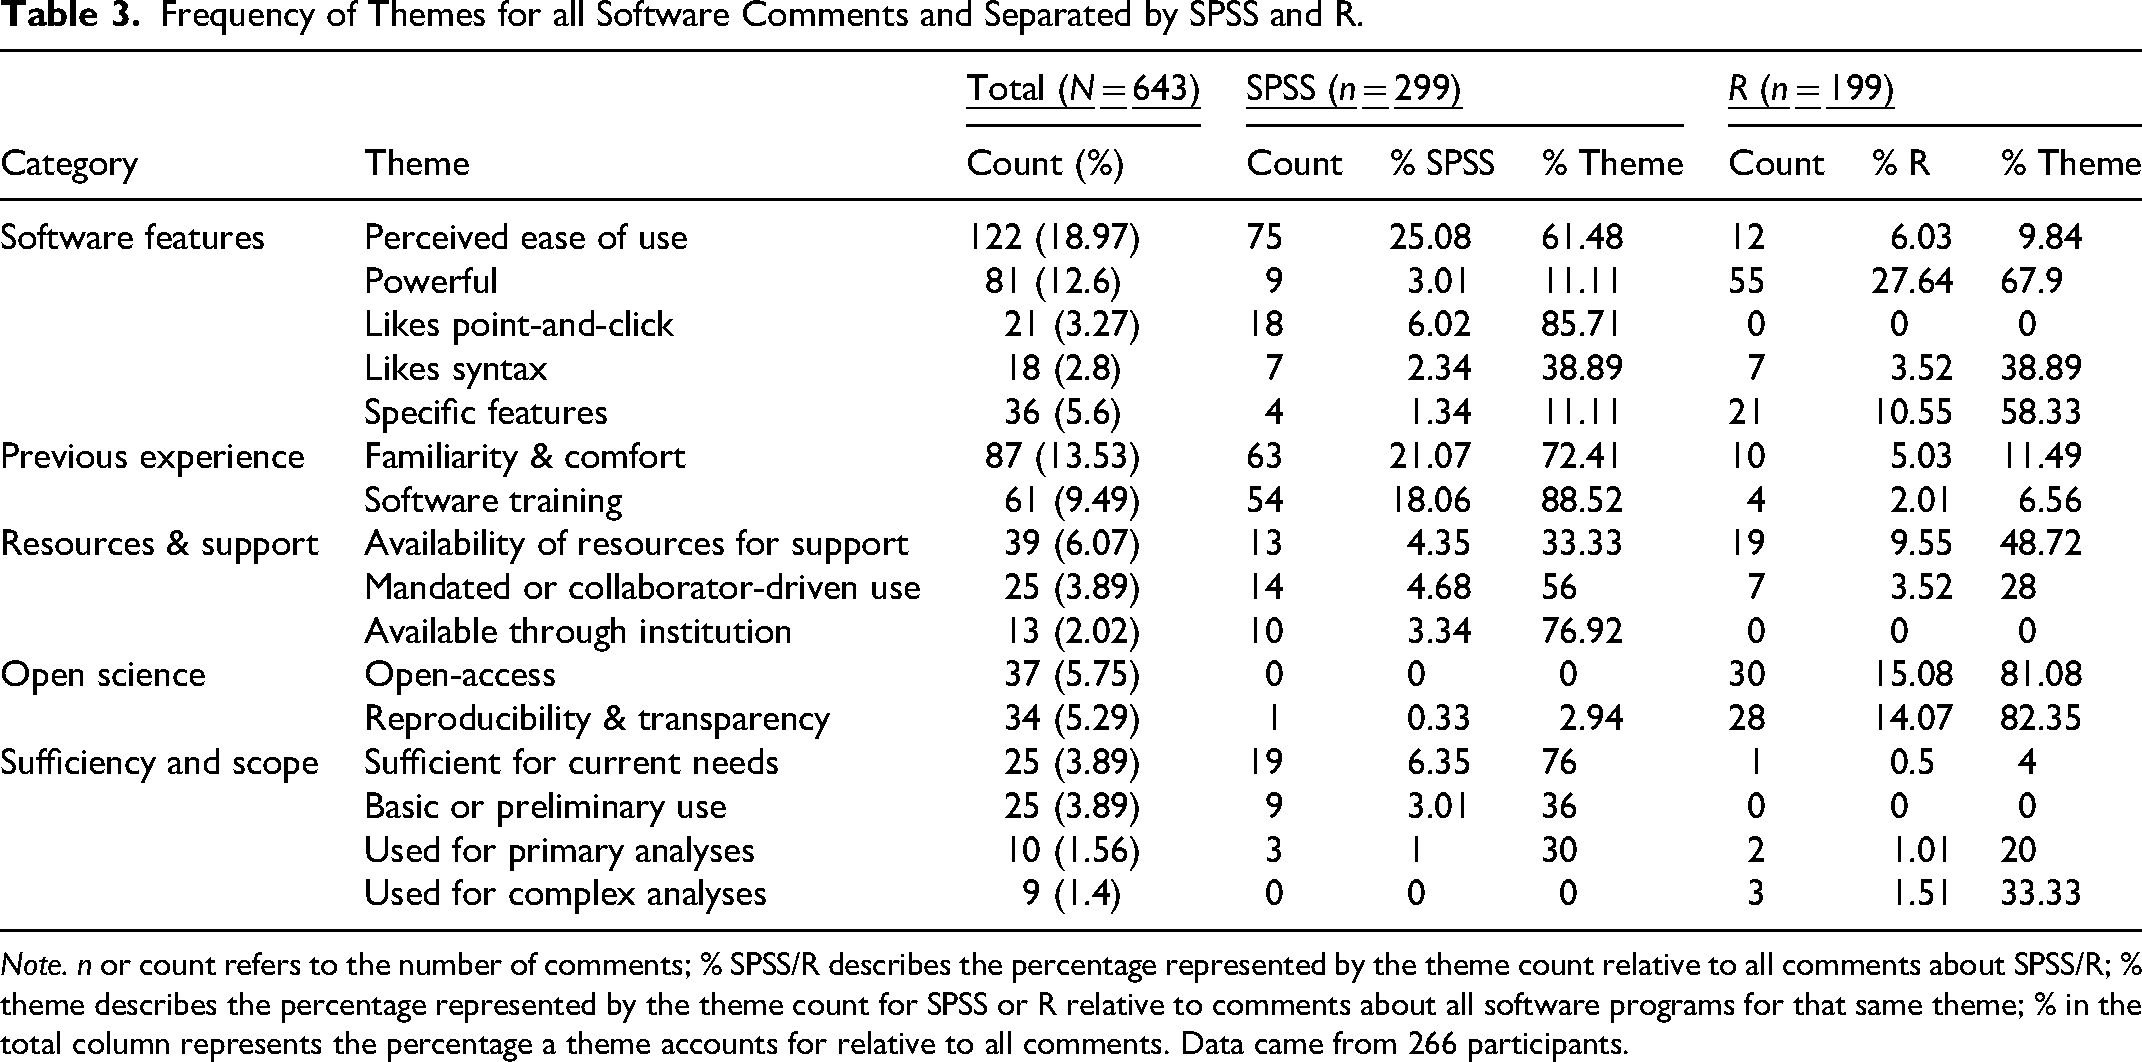
Note. n or count refers to the number of comments; % SPSS/R describes the percentage represented by the theme count relative to all comments about SPSS/R; % theme describes the percentage represented by the theme count for SPSS or R relative to comments about all software programs for that same theme; % in the total column represents the percentage a theme accounts for relative to all comments. Data came from 266 participants.
For those describing their reasons for using and preferring SPSS, the top reasons included its ease of use, familiarity with the software, and that it was the software they were trained on. In fact, these three themes comprised almost two-thirds of all comments about SPSS. Of all comments highlighting previous training being a reason driving their use of a particular software, almost 90% of them were about SPSS. Although occurring to a lesser extent, SPSS users also tended to highlight that the software was sufficient for their needs or that they use it because their collaborators use it. Few SPSS users highlighted the capabilities of the software itself (beyond preferring the point-click interface) or alignment with open science practices. These features were more strongly emphasized by R users, however, with 38% of R comments emphasizing the power and versatility or specific features of the software as a key reason driving use. An additional 29% of R comments highlighted its alignment with open science practices as a reason they use it. R comments emphasized familiarity and ease of use at more moderate levels relative to other reasons for using R, and to a lesser extent than comments about SPSS.
Learning New Statistical Software
About one-quarter of our sample (n = 79) was not currently interested in learning a new statistical software or becoming more proficient with a software program. For those who did select at least one program of interest, R and Python were by far the most popular, with just over 30% of our sample expressing interest in each of these (n = 105 and n = 98, respectively). 2 All remaining programs had less than 14% endorsement for interest in learning. When asked to choose the reason(s) why they wanted to learn the software, 220 participants provided a response. Almost two-thirds stated that others using it was a reason, 54% selected being able to conduct more complex analyses, 45% highlighted it was becoming more popular, while 28% thought it would be helpful for getting a job, and 15% selected another reason that they provided. These other responses were very similar to those mentioned earlier, such as the new software being easier to use, more accessible (no cost), and more capable of performing specific functions. Other reasons mentioned included acknowledgment of the limitations that one's current software had (e.g., inability of current software to perform specific analyses), wishing to build a more diverse skill set, being curious to try out new software, or using it in their own teaching.
Similarly, 221 participants provided data on preventing factors for why they have not already learned the software program of interest. By far, the most common reason was a lack of time, selected by 80% of those who answered the question (n = 183). Just under half selected no current need (n = 101), 39% said it was difficult (n = 82), and 22% selected licensing issues (n = 49). Eleven participants included other reasons such as preferring to learn in a structured environment (e.g., in a university course), technical limitations (e.g., inaccessible to Mac users, computers could not run it), and a lack of learning opportunities available. In fact, a couple of participants included open-text data reinforcing these ideas. One stated, “I would prefer to use R more, I just don’t know where to start,” while another wrote, “I wish that I had been instructed on how to use R in my graduate program … I also wish that my program had provided more coding experience as now I find I am very poor at fumbling through R code and it takes much longer and much more internet consultation than I would like.”
Discussion
This paper sought to examine patterns of use and reasons for use of statistical software in psychology researchers in Canada and the United States. The broad aim was to determine whether software use patterns followed from the software formally taught in courses, and whether researchers found that software programs aligned better with methodological and open science skills. Although researchers and educators continue to debate the “best” statistical software for use in the classroom, many participants used multiple software programs at some point in their own work. SPSS, Excel, and R were by far the most popular programs used, a finding that mirrors the software taught in psychology courses in Canada (Davidson et al., 2019). In fact, previous training was one of the top themes in reasons for use identified by researchers using SPSS. Those who used SPSS were also much more likely to use it for most or all their research projects compared to those using R or Excel. We also inquired about which statistical software (if any) participants wanted to learn, the reasons for wishing to learn them, and the reasons why they had not done so already. Most participants in our sample were interested in learning more, whereby R and Python were, by far, the top two programs for which participants reported wanting to learn or improve their proficiency. Preventative factors for learning a new software aligned with the TAM (Davis, 1985) and COM-B (Michie et al., 2011) frameworks; most researchers identified a lack of capacity, opportunity, or motivation. Not having enough time was the most common response, but some researchers reported that the software seemed too difficult or that they did not have a current need for it. These findings underscore the long-term implications for research stemming from the software taught in statistics courses.
Our content analysis highlighted a difference in reasons for preferring to use a given software, depending on the statistical package used. Researchers who use R were much more likely to cite benefits such as the power and versatility of the software itself or its facilitation of open science practices. By contrast, those using SPSS were more likely to note that they use it because it was what they were taught, it's easy to use, and they are comfortable or familiar with using it. Comments about SPSS rarely surrounded the features and benefits of the software itself. Additionally, across 299 statements about SPSS, only one mentioned its syntax allowing for reproducible analyses, highlighting a general lack of consideration for open science with SPSS use. These differential patterns across software users speak to different components of the TAM. SPSS comments were strongly aligned with perceived ease of use, whereas R comments were strongly aligned with what the software allowed them to do (i.e., perceived utility). In other words, researchers’ reasons for using SPSS appeared to be more of a function of its simplicity and integration in formal training. In contrast, reasons for using R were more strongly related to facilitating best practice in research and open science. In relating these findings to APA curriculum recommendations for methodological and open science skills, researchers highlight a disconnect between the software taught and the software valued in research and professional settings.
Implications and Recommendations for Teaching
Although our results provide a snapshot of software use among researchers and their reasons for using it, we believe this work has meaningful insights for instructors and those involved in curriculum work. Researchers did not identify SPSS as a useful tool for facilitating open science due to it not being open-access, and generally not identifying ways to use it that promote reproducibility (e.g., preferring point-and-click instead of syntax). Consequently, the choice of statistical software has critical implications for both the implementation of open science and facilitating accessibility and equity in the classroom. Our findings revealed that researchers’ SPSS use was strongly driven by familiarity and educational training rather than a deliberate methodological choice. This is important information when considering course or program learning outcomes. Ease of use is important, but choosing software based on tradition or it being easy is at odds with the recommendations for modern skills with which students should be coming out of degrees (APA, 2023). That said, we recognize that the needs of students vary greatly across institutions and program level (i.e., undergraduate vs. Master's/PhD), and that most undergraduate students will not continue into a graduate program or academic research career.
Below, we provide recommendations for teaching software in statistics courses across different degree levels, aimed at those who have the ability to choose the software for their courses or programs. These recommendations draw on results from this study alongside previous literature.
Undergraduate Statistics Courses
The broader implication that people use SPSS because it was what they were taught or familiar with, rather than for its inherent capabilities and benefits (and despite it generally not aiding open science), warrants discussion of whether something else would better serve students. In the short term, for introductory-level statistics, where software should serve as a facilitator of concepts rather than a critical research skill, perceived ease of use is an important consideration. However, there are more recent statistical programs with a similar ease of use that also allow for scalability of statistical skills and align with open science principles like accessibility, transparency, and reproducibility.
Although not used extensively by researchers in this sample, the open-source programs JASP and jamovi represent a great option for this context. The APA guidelines for the undergraduate psychology major (2023) highlight these (and R) as software that researchers are choosing over SPSS, because “using open-source software may promote sound statistical practices well beyond graduation” (p. 35). JASP and jamovi generally have a similar ease of use to SPSS but include additional capabilities, such as serving as an on-ramp to learning R coding, and are freely accessible, reducing a key barrier for students who cannot work on campus or access the software at home. Additionally, a recent eye tracking study provides some evidence that jamovi is even more user-friendly and effective for novice users than SPSS (Abbasnasab Sardareh et al., 2026). Because jamovi and JASP are freely accessible, but work from R code, they include the ease-of-use benefit of SPSS and the open science benefits of R. Of the relatively few comments about jamovi or JASP in our data, most highlighted their ease of use and/or efficacy for teaching introductory statistics.
For psychology programs with students who have stronger mathematics backgrounds, a strong and well-coordinated sequence of statistics courses, or that include specializations like neuroscience, we recommend starting statistics courses with R or at least incorporating some R syntax alongside other software. Similarly, in programs offering upper-year or advanced undergraduate statistics courses or an honors thesis, teaching R would be valuable for non-academic jobs and prepare students with research skills relevant to graduate school. Given that almost all the researchers in our sample used multiple software packages, fostering transferable skills related to flexibility across different software would serve students well.
Statistics Courses in Master's or Doctoral Programs
We argue that statistics courses or other methodological training in Master's or doctoral psychology programs should be taught with R. It was the statistical program that participants most wanted to learn or improve their proficiency, with some researchers explicitly stating they wish their graduate program taught it. This finding reinforces the results of Randall et al. (2021), where doctoral students across a range of quantitative programs emphasized the importance of R to their work and career success. For advanced research past the undergraduate level, R will facilitate open science practices and provide the most flexibility across a range of analytical needs. Teaching these skills early on in graduate statistics courses will allow for greater proficiency when conducting research in a variety of settings and allow researchers to feel more familiar and comfortable with the software when they need it. While Python was another statistical software of interest, it is not as well-suited to statistical analysis as R (Possamai, 2023). That said, it may be a better choice for some programs with a stronger computational focus (neuroscience or applications of machine learning) and a strongly valued skill in data science fields outside of academia. In all, teaching one or both of these open-source software programs will provide useful methodological skills to help set researchers up for success in academic or non-academic contexts, while ensuring that practices are aligned with open science.
For instructors who must use SPSS (i.e., do not have the capacity or opportunity to use another software), teaching students how to use/paste syntax can still support reproducible workflows and develop transferable analytic skills. Instructors can also make students aware of free, open-source alternatives by providing brief introductions and optional resources for further learning.
Constraint of Generality Statement
Our participants were researchers in psychology from Canada and the United States. Undergraduate and non-clinical graduate programs in these countries lack formal accreditation standards, contributing to substantial variation in the statistical software used in courses. Norms vary across institutions as to whether departmental, instructor, or committee consensus is required to change the software taught in courses. As a result, our findings and recommendations are most directly generalizable to institutions within these countries. However, several recommendations are broadly applicable across contexts, particularly those emphasizing the use of free, open-source software to enhance accessibility, and the finding that researchers find some tools more supportive of open science practices than others.
Limitations
The present study included some limitations. First, the data were collected in 2021, which may have impacted the use of newer open-access software like jamovi and JASP. We suspect that use of these programs may now be higher than what we found in this sample, especially in the wake of the COVID pandemic, where the importance of freely accessible materials was particularly salient. Another limitation is the lack of diversity of the sample, whereby most participants were white and identified as women. Our sample also included more Canadian participants, despite the United States having a much higher population. However, we found no differences in a preliminary investigation of the results (see supplemental files for details). Because the data came from a larger project on open science, participants may have been more interested in open science and, therefore, more likely to report wanting to learn software that they perceived to be associated with open science than a general population of researchers. Finally, our coding differentiated between “open-source” and “open-access” with the former representing replicability and transparency, and the latter, accessibility. In reviewing the comments, though, it seemed that some participants who wrote “open-source” likely meant open-access. That said, both subthemes pertained to a broader theme of alignment with open science practices.
Conclusion
Our study provided some evidence for long-term research implications of the statistical software taught in psychology statistics courses. The selection and integration of statistical software in academic curricula represents a crucial avenue for modeling and facilitating open science ideals and practices. Ultimately, we would like to raise the pedagogical question: should introductory courses rely on software that prioritizes ease of use, or should they expose students early to platforms that scale with their training? Given the role of statistical software in both psychological science and the job market, educators must balance ease of use with future-readiness. A tiered approach, such as introducing intuitive tools like jamovi or JASP at the undergraduate level and transitioning to R for upper-level or graduate students, may offer the dual benefits of inclusivity and rigor, ensuring modeling of open-science in introductory courses.
Footnotes
Acknowledgments
The authors thank Udi Alter who assisted with data collection for the overarching research project. We would also like to thank James Bartlett and Liam Hill, who provided immensely helpful feedback on earlier drafts of the paper.

Ethical Approval
Ethical approval was received from the Toronto Metropolitan University Research Ethics Board (previous institution name at time of research: Ryerson; #2020–532).
Informed Consent
All participants consented to participate and those who consented to partial data use and did not provide full data were removed from the shared dataset.
Funding
The authors disclosed receipt of the following financial support for the research, authorship, and/or publication of this article: This work was supported by the Social Sciences and Humanities Research Council of Canada.
Declaration of Conflicting Interests
The authors declared no potential conflicts of interest with respect to the research, authorship, and/or publication of this article.
Data Availability Statement
Power Analysis
N/A as there are no null hypothesis significance tests (NHST) in the paper. All quantitative results are descriptive in nature.
Data Exclusions
These are clearly detailed in the paper and are based on inclusion criteria for the study or on obvious data quality metrics related to random responding.
Covariates and Statistical Models
N/A. No traditional statistical modeling was used.
Measures and Questions
All survey questions related to the research question are described in the measures section. Since the data came from a larger open science survey, we include the full survey on the project OSF page. Citations to each of the papers (which have their own OSF pages) are included in the paper.
Missing Data
The number of respondents (relative to the total sample size) for each question is provided in the results section.
Qualitative Coding and Analysis
We provided details of our coding process and included the codebooks on the project OSF page. The coding process was highly iterative over several months. This is shared in the paper.