
Abstract
Previous studies on the economic performance of immigrants in the United States of America showed that successive immigrants possess lower skills and experience sluggish wage growth, thereby making the wage convergence with the natives almost impossible. However, analysis of variance (ANOVA) post hoc tests using data from the American Community Survey (ACS) 2010–2019 on China- and India-born immigrants revealed otherwise. Both immigrant groups have significantly higher levels of education, better occupation and higher earnings compared to all foreign-born immigrants and natives. During 2010–2019, the earnings of China- and India-born immigrants increased faster than the natives’ due to their higher educational attainment. Thus, the general characteristics and experiences of all foreign-born vis-a-vis natives cannot be generalized across specific immigrant groups. Immigrants from different origin countries who have different skill levels and competencies show different earning differentials compared with the natives. Some immigrant groups even become more productive over time due to the increased portability of the human capital of their latest cohorts.
Introduction
An educated workforce is an essential prerequisite for the faster economic development of a country. Harbison and Myers (1964) emphasized that human resources constitute the ultimate basis for the wealth of nations. They argued that capital and natural resources are passive factors of production, whereas human beings are the active agents who accumulate capitals, exploit natural resources, build social, economic and political organizations, and carry forward national development. The international migration of highly skilled and educated workers emerged as a compelling force at the beginning of the 21st century due to the steep rise in the demand for such workers internationally (World Bank, 2018). The migration of the highly skilled and the consequent formation of skilled diasporas the world over has become a core issue of development debates both in the origin and destination countries (Potnuru and Sam, 2015). The possible gains of high skilled migration for countries of origin in the form of remittances, return migration and an emigration-induced rise in enrollments in higher education (Beine et al., 2001; Khadria, 1999; Ratha, 2007) have replaced the “brain drain” discourse with the debatable concept of “brain gain” (Khadria, 2009).
The United States of America (USA) is a major destination of the highly skilled. This strand of migration adds to the increasing diversity of the US population, which now receives more than one million immigrants annually (Budiman, 2020; Riche, 2000). Destination countries value migrants with favorable human, social and cultural capital. Thus, destination countries make a conscious effort to maximize the net gains of immigration through their immigration policy (Holzer, 2019). Khadria (2009) argues that the new immigration policy of the advanced countries which emphasize temporary skilled migration is aimed at maximizing the benefits deriving from age (by replacing older workers with younger ones), wage (by paying low wages to younger immigrants) and vintage (by employing people with the latest technological knowledge) of new immigrants. Such policies are a response to the aging and shrinking labor force in the advanced countries which cause a decline in employment by 0.2 percentage points a year and adversely affects economic growth (World Economic Outlook, 2015). This paper’s focus on the high skilled China- and India-born immigrants in the USA and their economic performance in the labor market provides empirical support for their contributions to the destination society.
Studies on the economic performance of immigrants in the USA have shown that successive immigrants possess lower skills, earn lower incomes and experience slow wage growth, thereby raising questions on their ability to catch up with the natives (Borjas, 1995, 2015; World Bank, 2018). The present paper analyzes the international migration of the highly skilled from China and India to the USA and compares their economic differentials with all foreign-born and natives in the USA.
The China-born and India-born migrants in the USA constitute the second and third largest immigrant population, respectively, after the Mexico-born (US Census Bureau, 2019). Moreover, the Chinese and Indians have dominated the student and high-skilled employment visas in the USA for years, in contrast with the mostly low-skilled immigration from Mexico, the primary source country of immigration to the USA (Institute of International Education, 2019). The rising trend of immigration from Asian countries, particularly from China and India, will influence the quality and composition of future human capital in the USA.
The paper has four sections discussing the following: A review of the literature on immigrants’ performance vis-a-vis natives’ in the USA; data and methods used in this paper; findings on human capital profile, economic performance and earning differentials of the China-born and India-born vis-à-vis the overall foreign-born and natives in the USA in 2010–2019; and discussion and conclusion.
Literature review
Studies that examine and compare immigrants’ and natives’ economic performance find that over time, as immigrants gain labor market skills and experience, they gradually catch up with the natives’ incomes (World Bank, 2018). One of the earliest analyses by Chiswick (1978) using 1970 US Census data found that immigrants earned about 17 percent less than the natives’ when they entered the US labor market. But after 15 years, immigrants caught up with natives’ earnings, and after 30 years, immigrants earned 11 percent more than the natives. Chiswick (1986) later argued that immigrants initially lacked US-specific skills, such as English proficiency, information on the job search and networks, that were key for effective performance. However, after acquiring skills and resources, the human capital stock of immigrants grew rapidly compared to the natives, subsequently, immigrants outpacing the natives. This situation explained by selectivity, with migrants being more able and highly motivated (Borjas, 1994; Chiswick,1978, 1986), and working longer and harder than non-immigrants (Carliner, 1980).
However, later literature pointed out that it is erroneous to forecast the potential of future immigrants based on experiences observed from cross-sectional studies. For example, as Schoeni (1997: 684) argued, “This relationship in cross-sectional data could be since immigrants arriving in different times have different skills and abilities, with more recent arrivals having lower labor market “quality” than the earlier. Therefore, a point-in-time comparison of workers who arrived recently with those who arrived several years earlier would find disparities among these groups even if there were no assimilation effect.” Another study (Borjas, 1994: 1672) noted, “It might be the case, however, that newly arrived immigrants are inherently different from those who migrated 20 years ago. Hence, we cannot use the current labor market experiences of those who arrived 20 years ago to forecast the future earnings of newly arrived immigrants.”
Borjas (1985) had earlier demonstrated that the skills of successive immigrant cohorts relative to natives have started declining in the post-war period and much rapidly in the 1970s. Consequently, the wage convergence between immigrants and natives slowed down. Nevertheless, these new findings were not free from criticism and debate. Chiswick (1986) clarified that the wage convergence in the 1980s between immigrants and natives had slowed down not because the skills of successive immigrant cohorts declined, but because their rate of increase relative to the natives was lower. The period effects of labor market changes rewarded the high-skilled relatively more than the low-skilled, causing the earnings of the more skilled to grow faster than that of the less skilled. As a result, the wage gap between highly educated natives and comparably less-educated immigrants increased (Chiswick, 1986).
However, the debate was rekindled with Borjas’ study (1995, 2015) that showed the lower skills, much lower starting salaries and sluggish wage growth of successive immigrant cohorts, questioning the possibility of wage convergence between immigrants and natives. Additionally, Borjas’ (2015) study suggests that larger national origin groups experienced less economic assimilation than their earlier cohorts. In contrast, some studies examining the labor market performance of specific groups of immigrants by age, national origin and employment category show that not all immigrants have performed below the levels of the natives nor suffered a decline in their skill quality over a period. For example, Friedberg (1992) considered the age of immigrants at arrival and noted that while the skill quality of certain immigrant groups declined over time, there was no evidence of the same among the immigrants from Mexico and East Asia. Lee and Zhou (2014) suggested that contemporary Asian immigrants, on average, are more highly educated and selected than before.
The World Bank (2018) noted that immigrants and refugees in the USA faced economic disadvantage through a wage gap of 20 percent compared to with the natives due to their employment pattern, wage levels and occupational distribution. Through a process of economic integration, immigrants and refugees catch up with the natives in terms of wages and employment over a period of 10–20 years (World Bank, 2018). Another exciting study (Strader et al., 2020) examined rank, promotion and retention of immigrant and native soldiers in the US army between 2002 and 2009 and found that immigrants performed equally well or better than native-born soldiers.
This paper aims to contribute to the literature by probing the skill quality and earnings of the China-born and India-born immigrants in the USA. Do they have lower or higher earnings than the US native-born? Have the skills and earnings of the China-born and India-born in the USA relative to the native-born declined and what happened to their earning differentials over a period of time? The findings of this study will help us understand if the conclusions on the economic performance of immigrants drawn from studies of the foreign-born (Borjas, 2015; World Bank, 2018) can be used to understand the characteristics and potentials of specific immigrant groups, such as the India- and China-born immigrants.
Data and methods
The American Community Survey (ACS) of the US Census Bureau is the main source of data for this study. American Community Survey collects data through email, postal mail and personal visits by the ACS staff using systematic sampling of households. The dataset provides data separately based on five-years estimates, three-years estimates and one-year estimates. According to the US Census Bureau, five-years estimates are best used where precision is more important than currency in analyzing very small populations and smaller geographies because one-year estimates are not available. The one-year estimates are best used when currency is more important than precision in analyzing large populations. Moreover, five-years and three-years estimates are not available for the foreign-born by country-of-birth (US Census Bureau, 2017a).
Thus, one-year estimates of the ACS for the period 2010–2019 are explored in this study for the purpose of analyzing the human capital characteristics (including earnings) of selected foreign-born by country of birth. Since one-year estimates for the India-born and China-born population groups are not available for the interim period of 2011–2015, we simulated data points for these population groups for the unavailable interim years based on their respective average annual growth rate between 2010 and 2016. Further, the annual median earnings of the select population groups for the period 2010–2019 are inflation-adjusted to 2019 US dollars.
The working definitions and different age group classifications are explained in the succeeding sections. Cross tabulations and analysis of variance (ANOVA) post hoc tests using the SPSS software were used for data processing and analysis.
Findings
Human capital characteristics of China-and India-born in the USA
Population
Top three foreign-born population in the USA, by country of birth: 2010 and 2019.
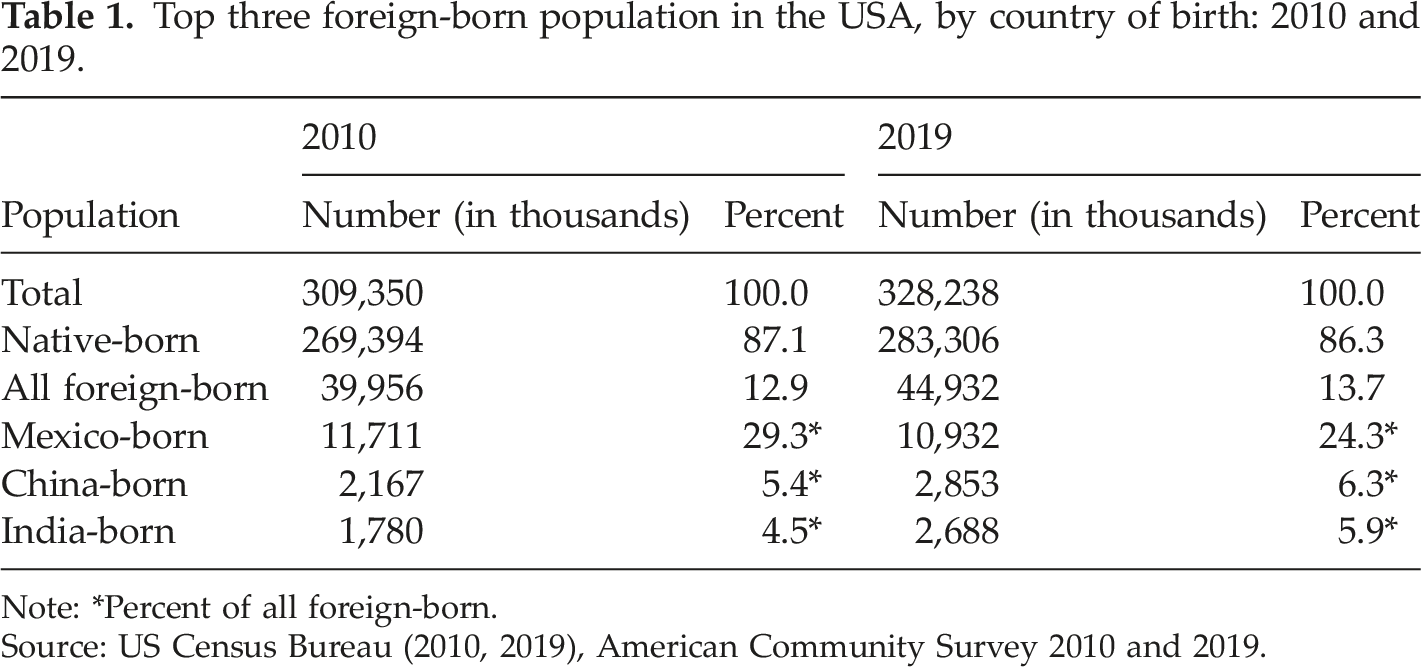
Note: *Percent of all foreign-born.
Source: US Census Bureau (2010, 2019), American Community Survey 2010 and 2019.
As Table 1 shows, Mexico is the primary source of the foreign-born population in the USA, but the share of the Mexico-born declined in 2019. This decline was primarily due to the sharp drop in the population of unauthorized immigrants following the crackdown on irregular immigrants during the Trump administration (Gonzalez-Barrera and Krogstad, 2019). After the Mexico-born (24.3 percent), the China-born is a distant second with 6.3 percent, followed by India-born with 5.9 percent of all foreign-born population in the USA in 2019 (Table 1). Between 2010 and 2019, both the India-born and China-born population groups have registered a significant increase in their numbers and share among the foreign-born population in the USA (Table 1). In terms of the annual inflow of immigrants into the USA in 2018, China was at the top with 149,000 of its people granted immigration, followed by India (129,000), Mexico (120,000) and the Philippines (46,000) (Budiman, 2020).
Age and education
Human capital characteristics of natives, foreign-born, China-born and India-born residents in the USA, 2019.
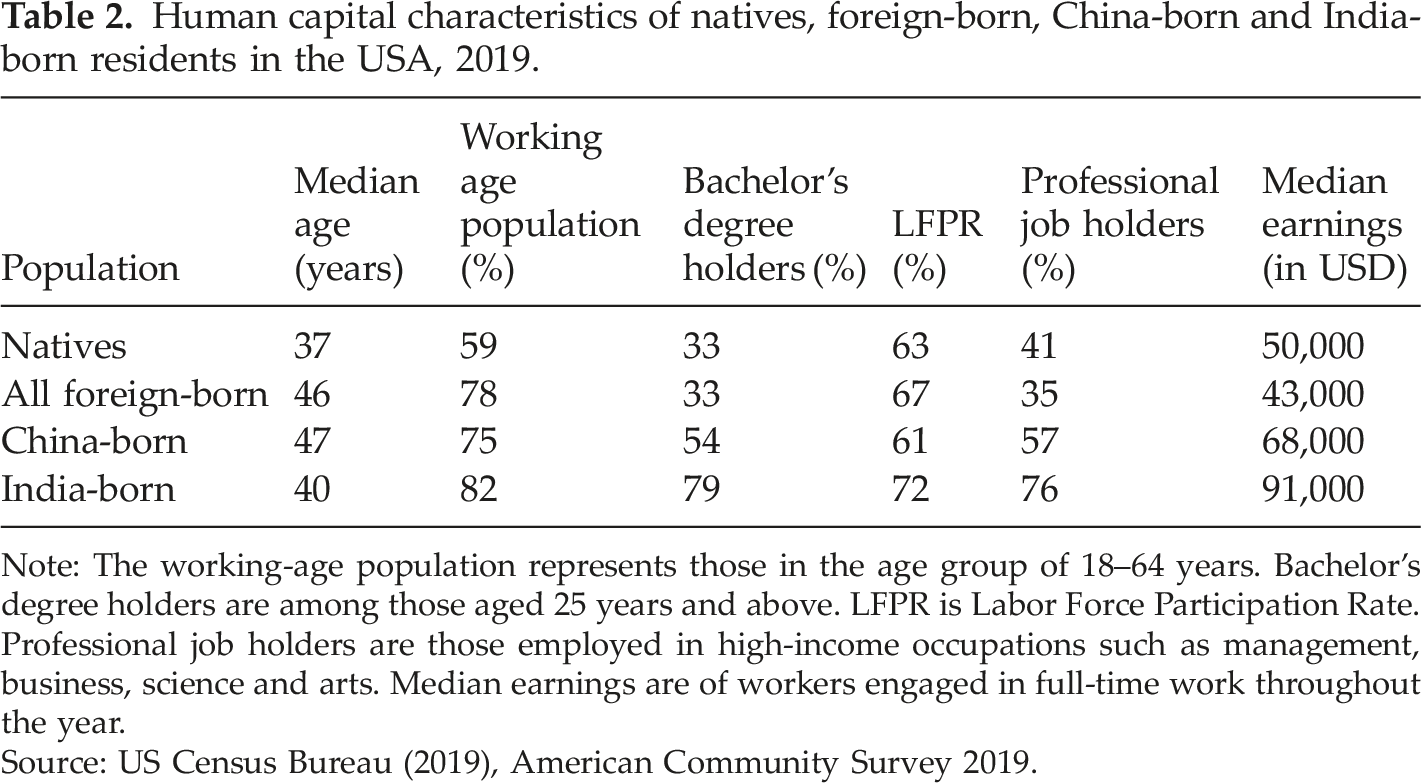
Note: The working-age population represents those in the age group of 18–64 years. Bachelor’s degree holders are among those aged 25 years and above. LFPR is Labor Force Participation Rate. Professional job holders are those employed in high-income occupations such as management, business, science and arts. Median earnings are of workers engaged in full-time work throughout the year.
Source: US Census Bureau (2019), American Community Survey 2019.
About 78 percent of all foreign-born, 75 percent of China-born and 82 percent of India-born constituted the working-age group of 18–64 years compared to only 59 percent among the natives in 2019 (Table 2). In 2019, 33 percent each of natives and all foreign-born aged over 25 years possessed at least a bachelor’s degree. In comparison, 79 percent of India-born and 54 percent of the China-born aged over 25 years held a bachelor’s degree or higher (Table 2).
Employment and earnings
The labor force participation rate of those aged over 16 years in 2019 shows that the India-born have participated at a slightly higher rate of 72 percent compared to 63 percent of the natives and 67 percent of all foreign-born. The China-born, shows a lower labor force participation rate of 61 percent than the natives and all foreign-born (Table 2). Both the India-born and China-born engaged in high-income occupations, such as management, business, science and arts, accounted for 76 and 57 percent, respectively, compared to 41 percent of the natives and 35 percent of all foreign-born in 2019. Thus, the higher educational attainment and high-skilled professional occupations of the India-born and China-born translate into higher incomes. The annual median earnings of year-round full-time workers of the India-born and the China-born in the USA were USD 91,000 and USD 68,000 respectively, much higher than the year-round full-time workers’ median earnings of the natives (USD 50,000) and all the foreign-born (USD 43,000) (Table 2).
Economic contributions of the high-skilled Chinese and Indian immigrants in the USA
Many immigrants from China and India enter the USA either as international students pursuing higher education or as H-1B visa holders (professional workers) 1 which helps explain the higher education and higher median earnings of these two immigrant groups. In 2018–2019, the China-born, numbering 369,548, were the largest enrollees in US higher educational institutions, followed by 202,014 India-born. These China-born and India-born students comprised 34 percent and 18 percent, respectively of the 1,095,299 international students admitted in the USA in the same year (Institute of International Education, 2019). In 2015–2016, 80 percent of 166,000 India-born students and 43 percent of 329,000 China-born students in the USA were enrolled in science, technology, engineering and mathematics (STEM) programs (Zong and Batalova, 2017a, 2017b). Among the foreign-born who received doctoral degrees in the USA in 2015, the China-born accounted for about 31 percent, followed by India-born with 14 percent (Zong and Batalova, 2017a, 2017b). Between 2005 and 2015, about 48,000 PhDs were awarded to China-born and 22,000 to India-born scholars in the USA (NSF, 2017). More than 90 percent of these PhDs was in STEM fields. According to a survey undertaken between 2005 and 2015, 88 percent of India-born and 87 percent of China-born earning PhDs in the USA preferred to stay in the USA after completing their studies (NSF, 2017).
Apart from enriching the academic environment with their diverse geographical background, culture and ideas, international students have significantly contributed to the economy. For example, international students constituted only 5.5 percent of the total USA higher education population but their expenditure on education and stay contributed a significant USD 45 billion to the US economy in 2018–2019 (Institute of International Education, 2019). About half of this contribution came from the China-born (USD 14.9 billion) and India-born (USD 8.2 billion) students. A report (NAFSA, 2019) states that three jobs were created and supported in the USA by expenditures made in higher education, accommodation, dining, retail, transportation, telecommunication and health insurance sectors for every seven international students. The estimate shows that 458,290 such jobs were created in the USA in 2018 (NAFSA, 2019).
India-born were the top recipients of the US high-skilled worker (H-1B) visas. According to the US Citizenship and Immigration Services (USCIS), 426,710 foreign nationals were issued H-1B visas in the USA as of 30 September 2020. A whopping 74.9 percent (319,490) were India-born. At a distant second, 51,597 (12 percent) of H-1B visa holders were Chinese nationals (USCIS, 2021). There is significant evidence of the productive contribution of high-skilled immigrants to the firms they work for and the US economy. For example, Khanna and Lee (2018) found that companies with a 10 percent increase in the share of high-skilled workers on H-1B visas are associated with a two percent rise in replacing their older and obsolete products with newer ones. Further, Bernstein et al. (2019) estimated that over 30 percent of US innovations since 1976 were produced by either the direct or indirect contributions of high-skilled immigrants in the USA. Kerr (2018) showed that while one in every 220 patents in the USA in 1975 was invented or co-invented by a Chinese or Indian ethnic inventor working in the San Francisco Bay Area, this has increased to one in every 12 patents by 2017.
Change in human capital indicators of the China- and India-born and others, 2010 to 2019
Comparison of selected human capital characteristics of natives, all foreign-, China- and India-born residents, 2010 and 2019.
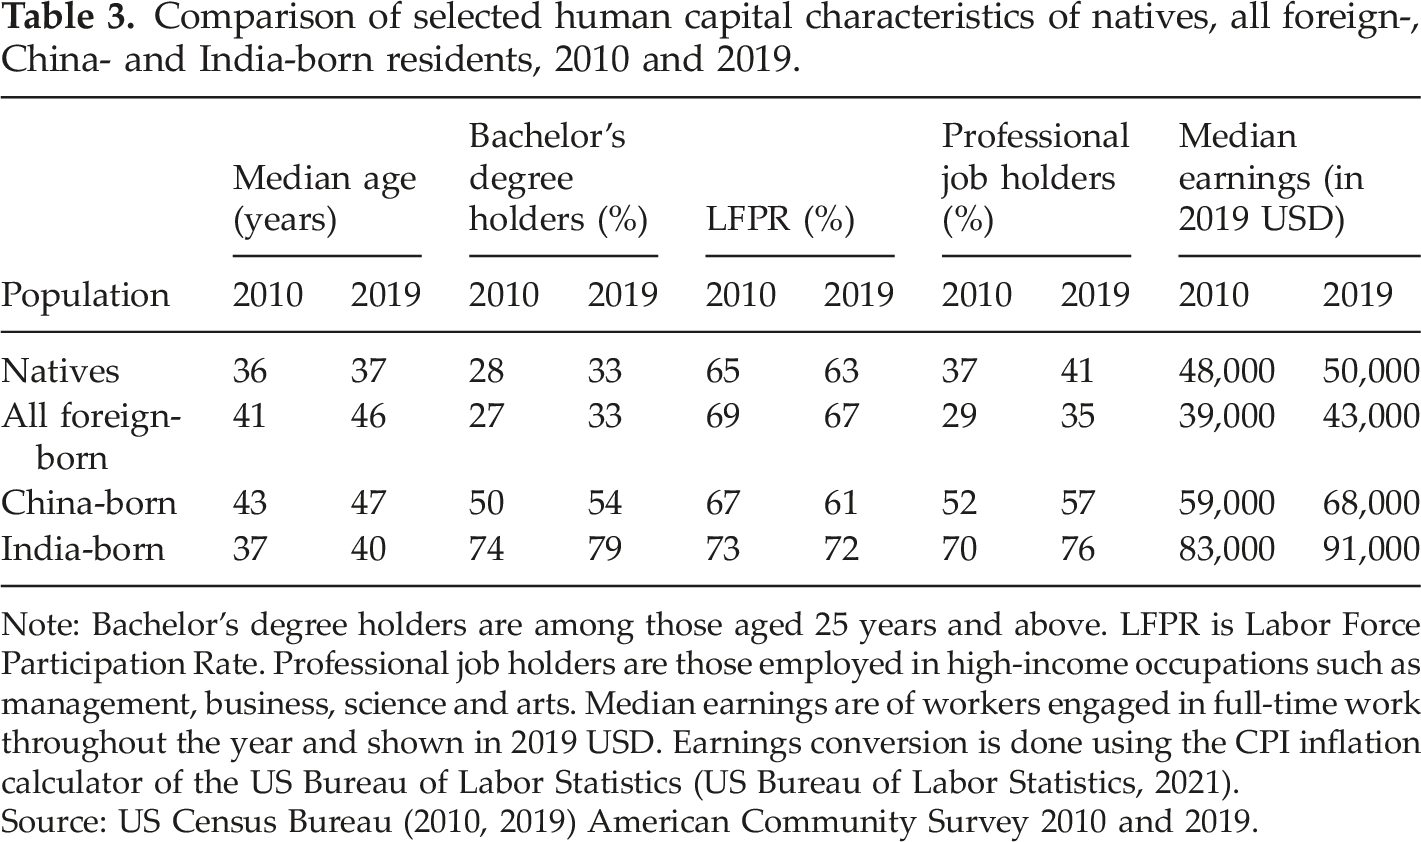
Note: Bachelor’s degree holders are among those aged 25 years and above. LFPR is Labor Force Participation Rate. Professional job holders are those employed in high-income occupations such as management, business, science and arts. Median earnings are of workers engaged in full-time work throughout the year and shown in 2019 USD. Earnings conversion is done using the CPI inflation calculator of the US Bureau of Labor Statistics (US Bureau of Labor Statistics, 2021).
Source: US Census Bureau (2010, 2019) American Community Survey 2010 and 2019.
A considerable proportion of the India-born population (41 percent) in the USA in 2019 compared to all foreign-born (25 percent) and China-born (33 percent) recently arrived in 2010 or later (US Census Bureau, 2019). This is important to note because an overall change in the human capital characteristics of immigrant groups is dependent on two things: (1) a change in these characteristics of those already living in the USA and (2) a change in the same characteristics of the new immigrant flows joining them during the period.
From 2010 to 2019, the median age of all foreign-born increased by five years from 41 to 46 years, while the median age of the natives increased from 36 years to 37 years. It is significant to note that the lower median age of the natives compared to the foreign-born is due to the higher share of children among the natives compared to the foreign-born. For example, the share of children under 18 years of age among the natives was 25 percent in 2019, while it was only six percent among the foreign-born (Table 3). The China-born and India-born experienced increase in their median age by about four years and three years, respectively, but lower than the increase in the median age of the overall foreign-born (Table 3).
There is an increase in the share of people holding a bachelor’s degree from 2010 to 2019 in all the population groups. The all foreign-born registered the highest increase by six percentage points (from 27 percent to 33 percent), followed by the natives and India-born by five percentage points each (from 28 percent to 33 percent and 74 percent to 79 percent, respectively). The China-born showed the least gain (from 50 percent to 54 percent) (Table 3). It is intriguing to note that while Chinese higher education students accounted for the highest share, 34 percent (369,548) of 1,095,299 international students in the USA in 2018–2019, compared with the second-highest Indian students at 18 percent (202,014) (Institute of International Education, 2019), this did not result in the same increase of China-born with bachelor’s degree. This is due to three reasons. First, the Chinese higher education students in the USA mostly comprised of undergraduate students who were not counted among bachelor’s degree holders. Li and Yu (2016) showed that the share of Chinese graduate students in the USA declined from 80 percent in 2004–2005 to 40 percent in 2014–2015, while undergraduate students increased from 14 percent to 40 percent during the same time. Secondly, most of those who completed their undergraduate studies in the USA did not stay but returned home to China. As Wang (2013) reported, over 272,900 Chinese students returned to China from overseas (mostly from the USA) in 2012 alone, showing an increase of 46.6 percent over 2011. In 2013, more than 350,000 students returned to China, nearly 30 percent more than the number returned in 2012 (Xiang, 2016). 2 Thirdly, about 0.32 million Indian professionals working in the USA in 2020 under the H-1B visa supposedly possessed a university degree compared to about 52,000 Chinese professionals in the same category (US Citizenship and Immigration Services, 2021).
The labor force participation rate (LFPR) among those aged 16 years and above has declined across all origin groups, including natives during 2010–2019 (Table 3). The decline was marginal, about one or two percentage points among the natives, overall foreign-born and India-born. The China-born, however, showed a significant decline by six percentage points from 67 percent in 2010 to 61 percent in 2019. The change in the share of workers holding professional jobs from 2010 to 2019 shows a net increase of four percentage points among the natives, as against five percentage points among the China-born, and six percentage points each for foreign-born and India-born.
Arrivals of selected foreign-born aged 25–64 years with college degree, 1980–2017 (selected periods).
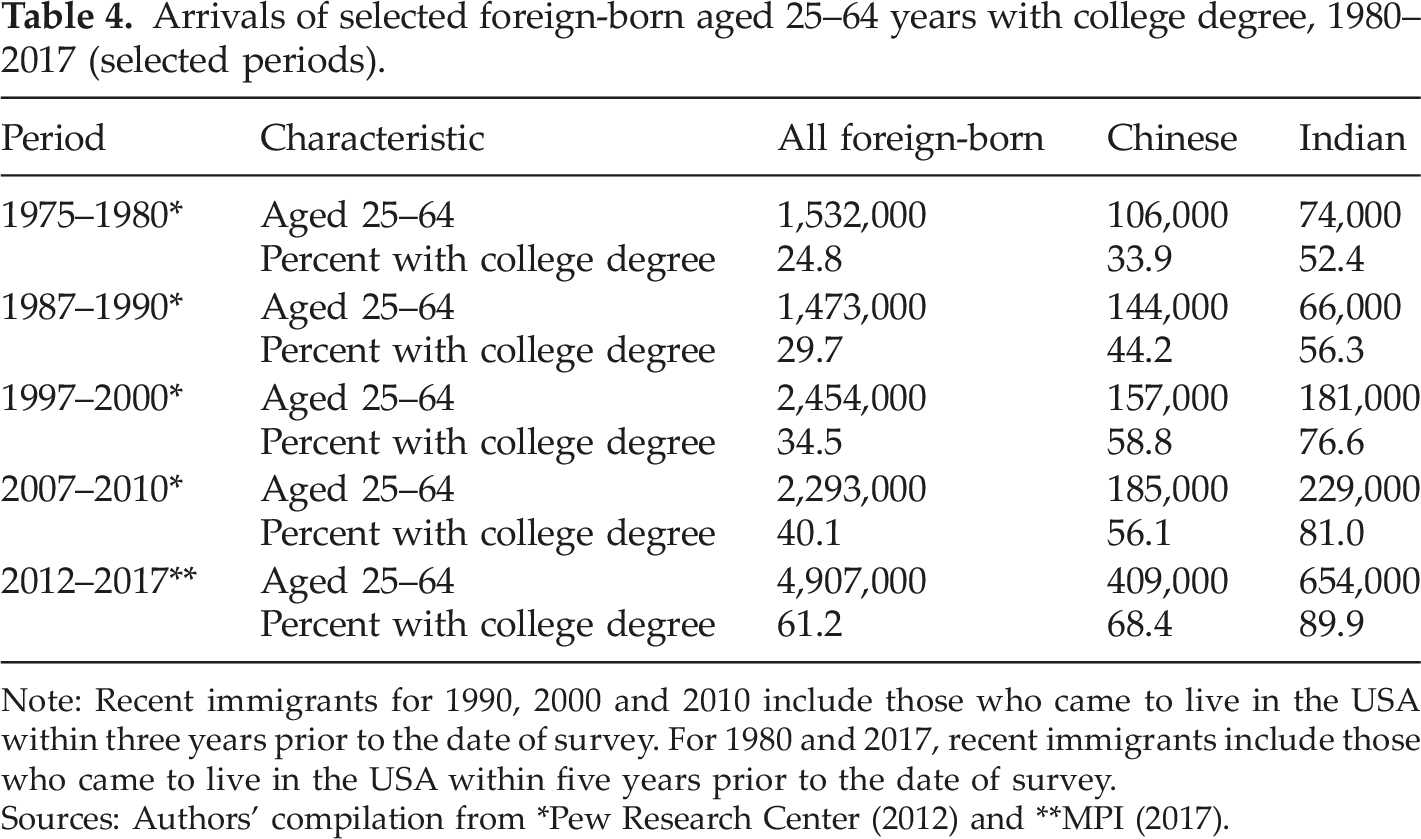
Note: Recent immigrants for 1990, 2000 and 2010 include those who came to live in the USA within three years prior to the date of survey. For 1980 and 2017, recent immigrants include those who came to live in the USA within five years prior to the date of survey.
Sources: Authors’ compilation from *Pew Research Center (2012) and **MPI (2017).
The period from 2000 to 2010 also corresponds to China’s rapid economic growth phase (World Bank, 2020). During this period, the higher economic growth rate in China has contributed to the slowing down of its high-skilled emigration due to increased employment opportunities in China itself and increase in its students’ migration to the USA, as increased incomes provide the capacity to fund higher education abroad. Therefore, Li et al. (2019) likened this shift in the dominance of Chinese high-skilled emigration before 2000 to students’ emigration afterwards with the Japanese migration experience of the late 20th century when the faster pace of economic development in Japan increased students’ migration but reduced its labor migration to the USA. However, as observed in the recent Chinese immigrant cohort of 2012–2017 with a higher share of college (or associate) degree holders, the reversal of this trend raises doubt if the Chinese high-skilled employment-based emigration is really slowing down. If COVID-19 accelerated brain drain from the developing countries, the expectation of slowdown of the Chinese high-skilled employment-based emigration to the USA will further be delayed (Khadria, 2020).
Earning differentials of the China-born and India-born relative to all foreign-born and natives
Figure 1 shows the median earnings growth of the China-born, India-born, all foreign-born and natives in the USA for the period 2010–2019 (at 2019 USD). The figure shows that the annual median earnings of full-time workers of all foreign-born were lower than that of the natives during 2010–2019 (Figure 1). The earning differential between them, however, has contracted, as is evident from the decrease in the gap between the median earnings lines of the two population groups. On the other hand, the China-born and India-born median earnings were higher than the median earnings of the natives during this period (Figure 1). The median earning differential between them during 2010–2019, as seen in the gap between the respective median earnings lines of the population groups, also increased with a higher rate of growth of median earnings of the China-born and India-born compared to that of the natives. We have noted earlier that both the China-born and India-born have experienced significant growth in their annual median earnings during 2010–2019 due to an increasing share of college degree holders among the cohorts of their recent arrivals (Table 4). Median earnings of the India-born, China-born, all foreign-born and natives in the USA, 2010–2019 (at 2019 USD).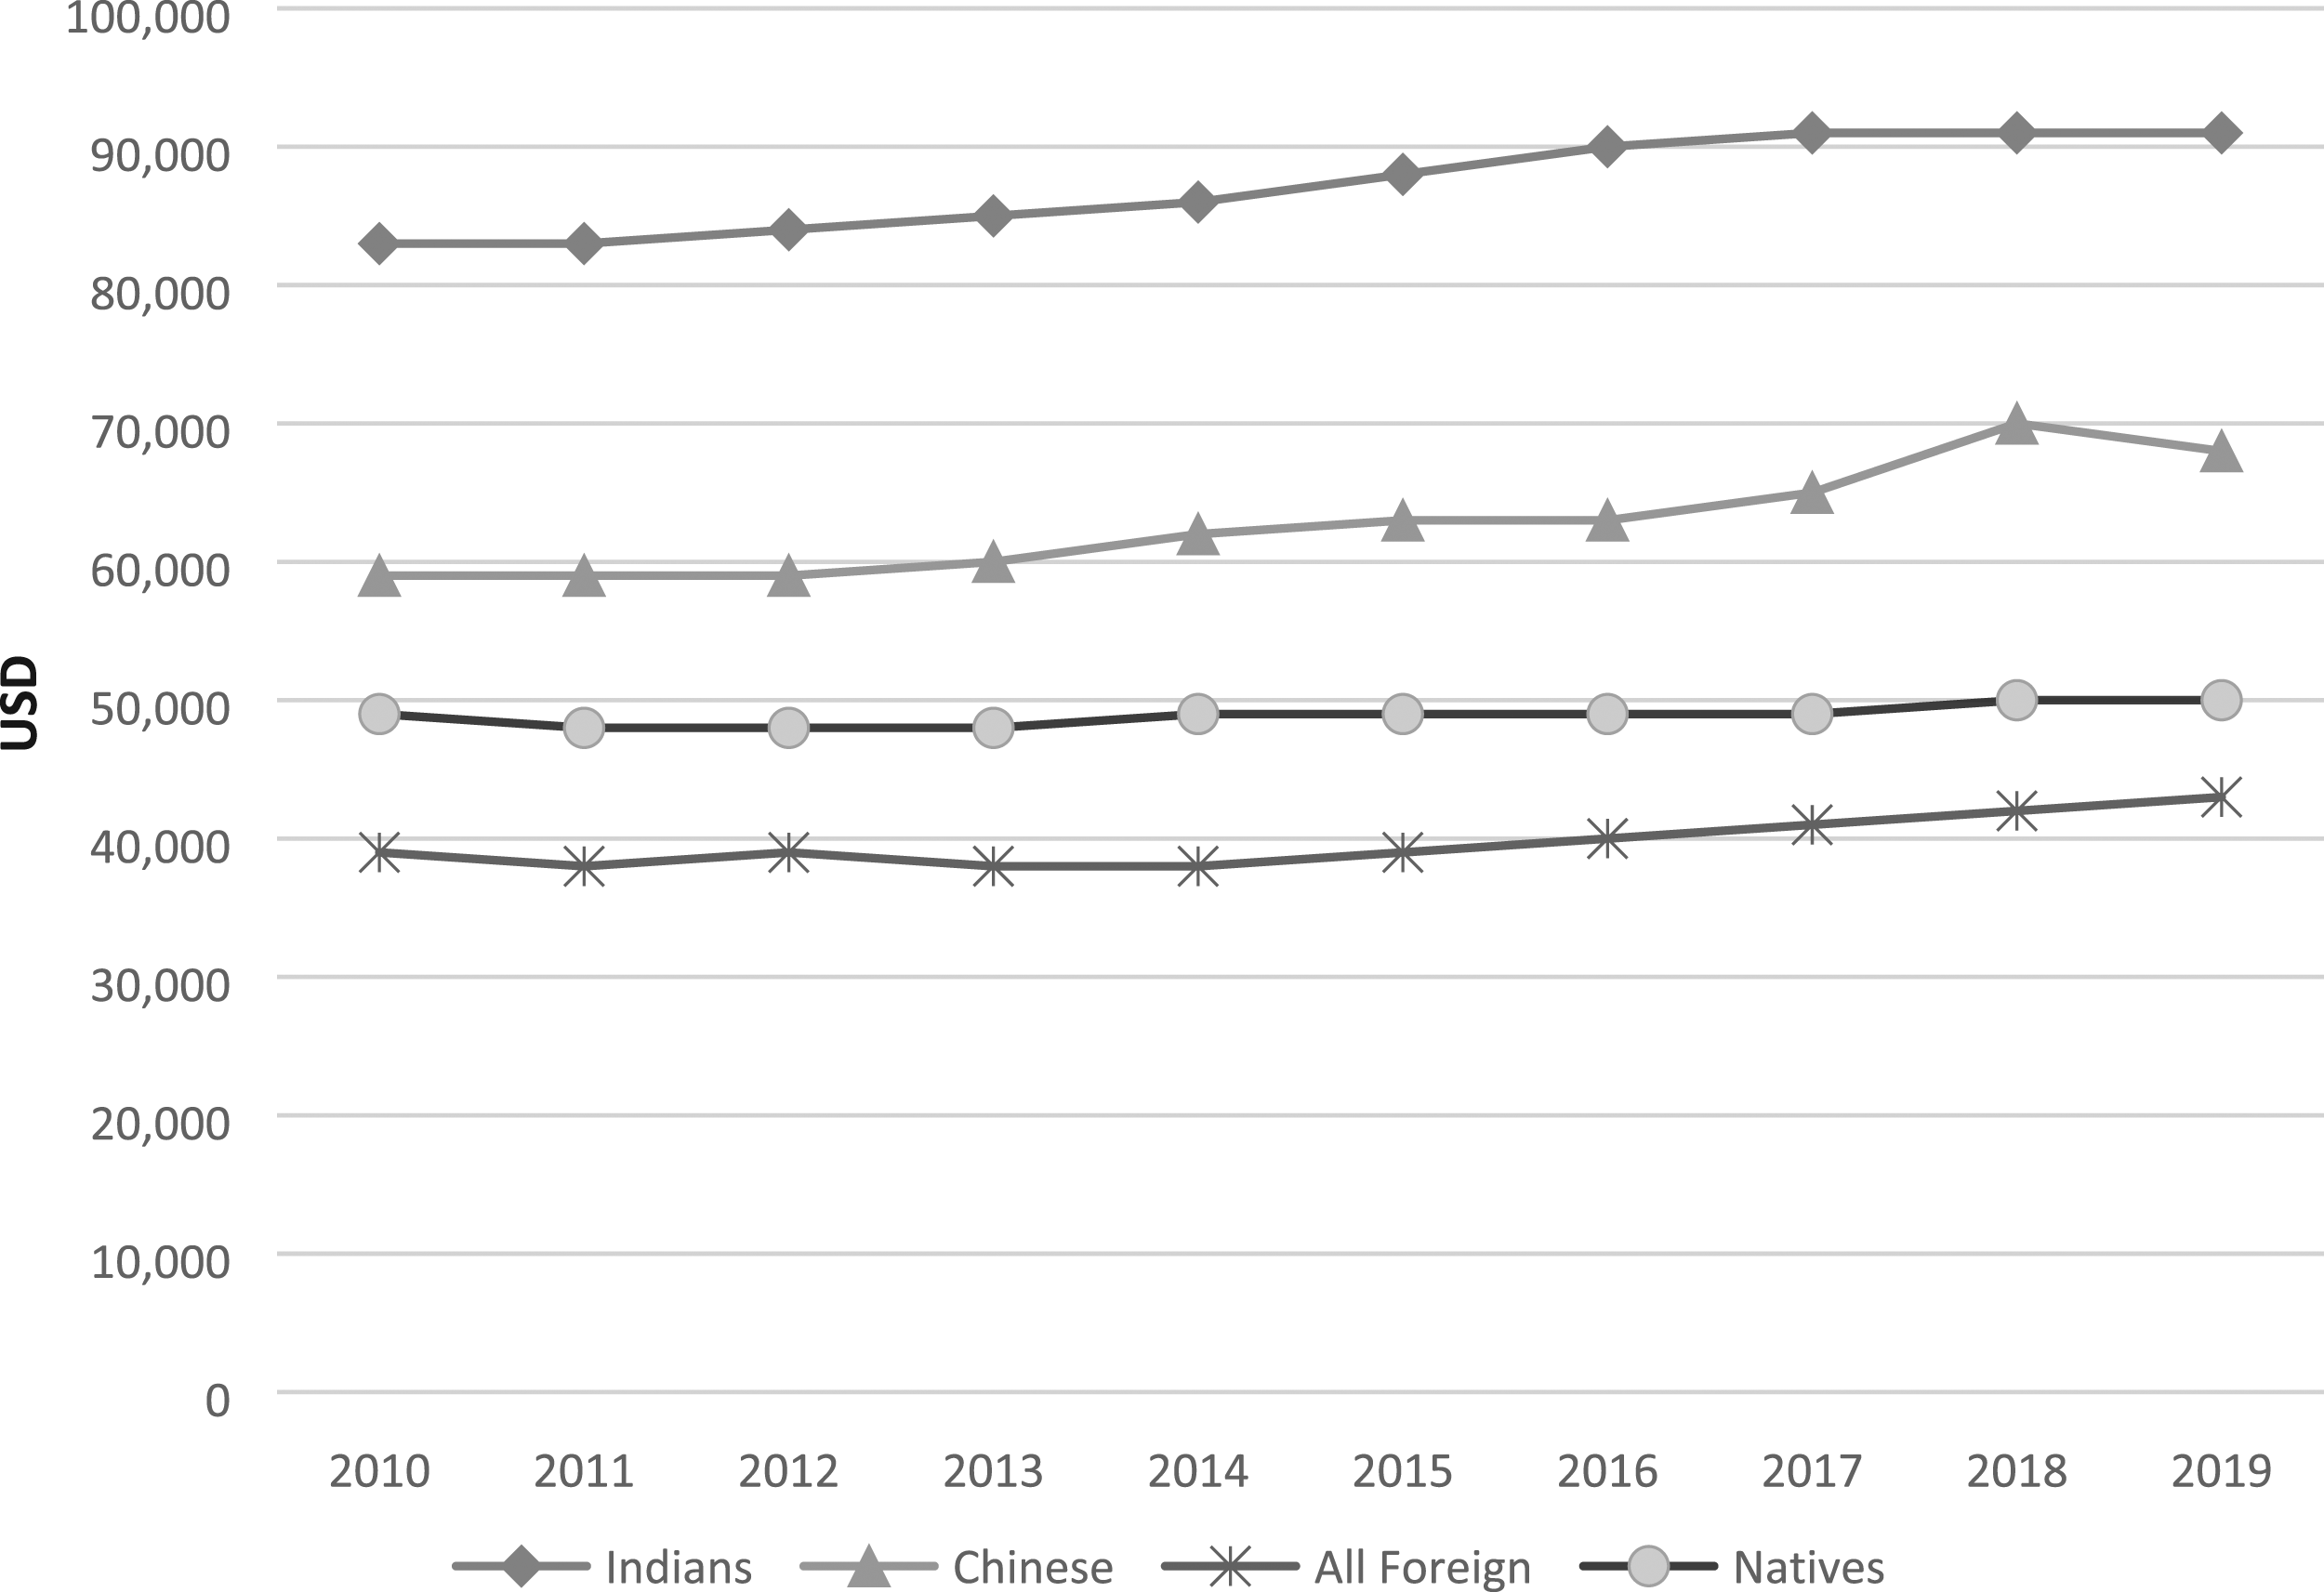
Tests of between-subjects effects.
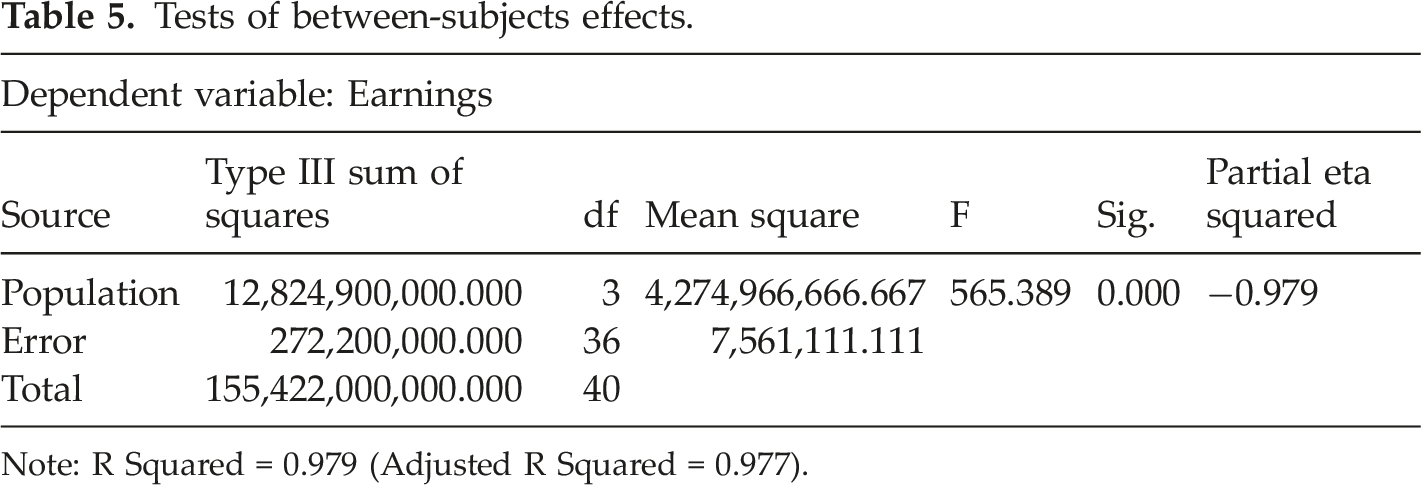
Note: R Squared = 0.979 (Adjusted R Squared = 0.977).
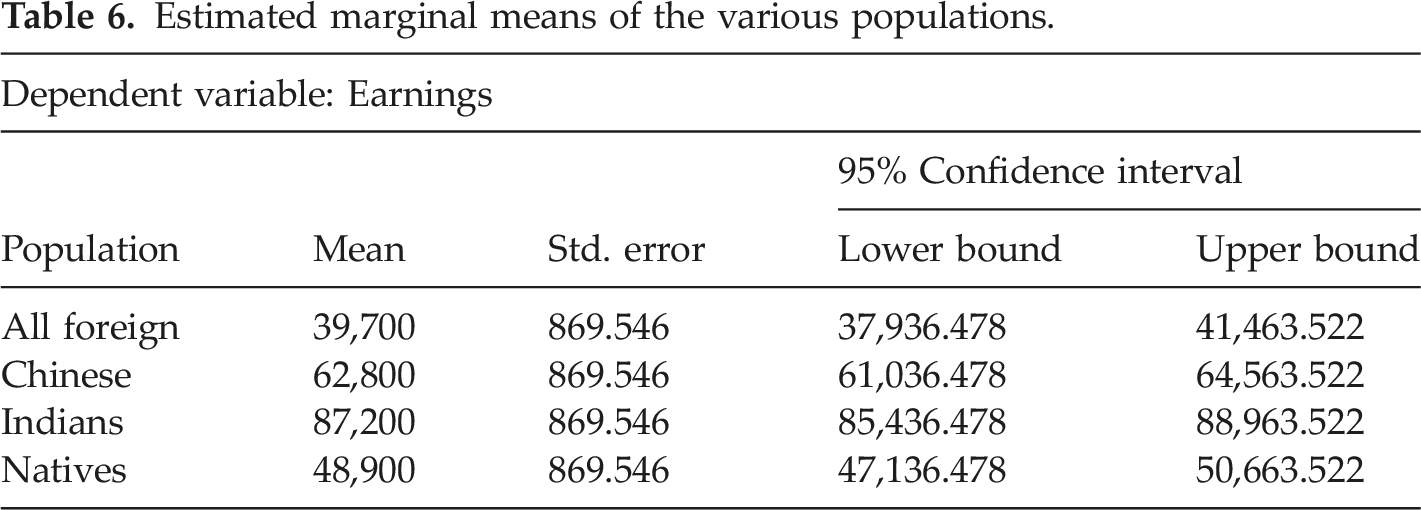
Estimated marginal means of the various populations.
Tukey honestly significant difference (HSD) multiple comparisons.
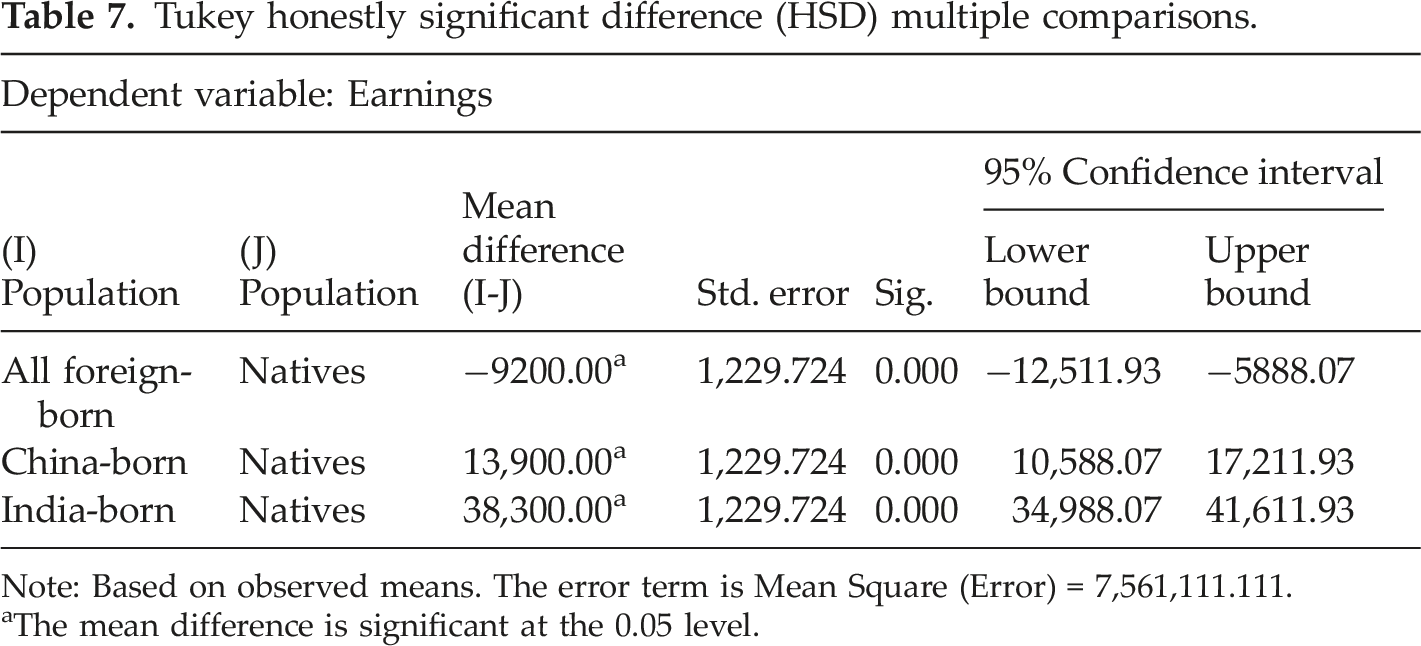
Note: Based on observed means. The error term is Mean Square (Error) = 7,561,111.111.
aThe mean difference is significant at the 0.05 level.
Discussion and conclusion
Overall, the foreign-born population earn lower incomes than the natives due to their lower skills and differences in the labor market conditions in the home and host countries. It is believed that they gradually catch up with the natives’ incomes by gaining labor market skills and experience in the host country. However, some studies, as discussed in the literature review, argued that successive immigrant cohorts in the USA possess lower skills, earn much lower starting salaries and experience sluggish wage growth, raising doubts about their wage convergence with the natives (Borjas, 1985, 1995, 2015). In contrast, other studies which consider variations in the age, national origins and employment categories of immigrant groups show that not all immigrants perform below the levels of the natives nor suffered a decline in their skill quality over time (Friedberg, 1992; Lee and Zhou, 2014; Strader et al., 2020).
This paper showed that the foreign-born population in the USA is not a homogeneous group and that their characteristics can differ widely by country of birth. The India-born and China-born differed significantly in selected human capital characteristics—age, education and earnings—from the overall foreign-born. Therefore, the general characteristics and experiences of the overall foreign-born vis-a-vis natives, as demonstrated by earlier studies like Borjas (1995, 2015) and Schoeni (1997), cannot be generalized across specific immigrant groups. Immigrants from different origin countries who have different skill levels and competencies show different earning differentials with the natives. Some immigrant groups are even becoming more productive over time due to the increased portability of the human capital of their latest cohorts.
The China- and India-born constituted the second and the third-largest immigrant populations, after the Mexicans in the USA, and they have higher shares of the working-age population, educational attainment, professional jobs and median earnings than the overall foreign-born and native-born Americans. Between 2010 and 2019, the China-born have experienced a significant rise in their median earnings due to a jump in the share of college degree holders among new arrivals in 2012–2017 compared to those who arrived in 2007–2010. As a result, the earning differential between the China-born and the natives widened in this period.
The faster increase in the skill levels of successive Indian immigrant cohorts in the USA further increased their earnings lead over the natives. According to an earlier study, the median earnings of the India-born were 1.85 percent more than that of the natives in 1990. This lead widened to 29.6 percent in 2000 and further to 66.7 percent in 2010 (Potnuru, 2017a). The difference in mean earnings between the India-born and natives estimated by this study is at 78 percent (USD 38,300) for the period 2010–2019 (Table 6). One of the reasons for the widening income differential between the India-born and the natives during 1990–2010 was the consolidation of Indian migrant flows with higher human capital than its older cohorts (Potnuru, 2017a). The growing trend of Indian high-skilled migration to the USA continued beyond 2010 with about 90 percent of them having at least a bachelor’s degree among the 2012–2017 arrivals compared to 81 percent among 2007–2010 arrivals (Table 4). It is also remarkable to note that the flow of Indian science and engineering professionals to the USA increased from 747,000 in 2010 to 950,000 in 2013, increasing 27 percent in just three years (Gambino and Gryn, 2011). In the health sector, 48,337 Indian doctors were practicing in the USA in 2014 (Potnuru, 2017b). The share of H-1B visas issued to Indians increased from 56 percent (72,438) of the total 129,134 H-1B visas issued globally in 2011 (Pew Research Center, 2012) to 74.9 percent (319,494) of 426,710 H-1B visas issued globally as of October 2020 (USCIS, 2021). The analysis also highlights the significant contribution of India-born high-skilled professionals and China-born and India-born students in enhancing the productive potential of US firms and educational institutions.
These findings validate the assertion of selective discrimination in immigration policy based on skills and countries of origin. The highest selectivity of the high-skilled migrant workers and students in the US immigration policy explains the faster growth of India-born and China-born professionals and students in the USA. Nevertheless, the countries of origin, despite recognizing the adverse consequences of the emigration of their highly skilled citizens, could not restrict the departure of the highly skilled or make the receiving countries accountable or address the adverse impacts on the origin (Potnuru and Khadria, 2019). In fact, the major worry of policymakers in India and China is generating employment for their large stocks of educated youth rather than restricting the emigration of skilled nationals. The policymakers instead tend to view the emigration of the educated as a “safety valve” or a temporary relief from the pressures of employment generation. Therefore, terms like “brain bank” and “brain gain” have gained traction with the hope that their overseas-based nationals can be a resource for future development (Khadria, 2001). The diasporic engagement policies of both India and China over the years have revolved around this understanding (Khadria, 2009; Xiang, 2016). However, what the policymakers have failed to understand or ignored at the least, is that a significant proportion of the high-skilled emigrants from India and China to the advanced countries have been the top-rankers from their higher educational institutions of repute. The findings of this paper are a testimony of their superior human capital and higher productive potential. Thus, both countries may have to re-think their approach to the emigration of the highly skilled that goes beyond diasporic engagement. Given the complications and difficulties of a broader or country-wide regulation of emigration, India and China may possibly enter into separate agreements or cooperation with the USA in specific fields or sectors which employ many Indian or Chinese immigrants. For example, India may negotiate with the USA for a certain level of foreign direct investment or exchange of knowledge in information and communication technology (ICT) and healthcare in India for easy access of Indian ICT and healthcare professionals to the US labor market. Similarly, China may engage with the USA to enhance educational exchange and services for developing higher education in China. Such cooperation can also be brought down to the institutional level. For example, the All India Institute of Medical Sciences (AIIMS) in Delhi which experiences significant emigration of its medical students and professionals can engage with the US healthcare system to fast-track the exchange of healthcare ideas and services.
Footnotes
Acknowledgments
The infrastructural support provided by the FORE School of Management, New Delhi for undertaking this research is greatly appreciated.
Declaration of conflicting interests
The authors declared no potential conflicts of interest with respect to the research, authorship, and/or publication of this article.
Funding
The authors received no financial support for the research, authorship, and/or publication of this article.