
Abstract
Objectives:
To examine time-trends in ethnic differences in UK medical specialty destinations at two key career points: entry into specialty training (CT/ST1) and awarding Certificate of Completion of Training (CCT).
Design:
Repeated cross-sectional analysis using General Medical Council (GMC) secondary data; CT/ST1: 12 specialties, 2012-2022; CCT: 11 specialties, 2007–2021.
Setting:
Postgraduate specialty training groups within the UK National Health Service.
Participants:
Doctors with a UK Primary Medical Qualification (CT/ST1: 64,995; CCT: 62,380), categorised as White, Asian and other ethnic groups using GMC data.
Main outcome measures:
The ethnic distribution across specialties was examined using chi-squared tests. The temporal trend was evaluated with ordinary least squares regression of the effect size. Trends in over- and under-representation of ethnic groups within specialties were identified using Kendall’s tau-b correlations.
Results:
White doctors comprised the majority proportion (67.1% CT/ST1; 70.3% CCT), followed by Asian (23.4% CT/ST1; 22.6% CCT) and other ethnicities (9.5% CT/ST1; 7.1% CCT). Ethnic differences were statistically significant for all years except CCT in 2007, with larger effect sizes at CT/ST1. Effect sizes increased over time at both levels (CT/ST1 p = 0.041; CCT p = 0.024). Asian doctors were over-represented in Ophthalmology at both levels and Radiology at CT/ST1, and White doctors over-represented in Acute Care at CT/ST1 and Emergency Medicine at CCT.
Conclusions:
Persistent ethnic differences exist in UK medical specialty destinations. Systemic factors may therefore influence specialty choice, selection processes and progression to CCT. Future research should explore the underlying causes of ethnic differences between specialties to assess if biases affect career progression.
Introduction
Over the past decade, there has been increased focus on diversity in the medical workforce. It has been well-documented that a diverse medical workforce improves patient outcomes and scientific advancement.1 –6 Encouraging, valuing and evaluating diversity and inclusion in the medical workforce remains a priority in the UK National Health Service (NHS).7,8 While the NHS boasts one of the most ethnically diverse workforces in the world, 3 with over 47% of doctors identifying as ethnic minorities, 9 ethnic minority groups are less likely to obtain speciality training posts compared to White British doctors 10 and there remains an ethnicity pay gap in the NHS. 11 Thus, there are still concerns about fairness in career progression and the systemic barriers faced by doctors from ethnic minority backgrounds.
A key inflection point in the career trajectory for UK doctors is entry into specialty training. Ethnic differences not only undermine workforce equity but also risk compromising patient care by perpetuating inequalities in healthcare leadership and representation. Black and South Asian doctors have historically been over-represented in general practice and psychiatry and under-represented in competitive specialties such as surgery and higher medical specialties.12,13
There have been targeted strategies aimed at recruitment and retention of under-represented minorities in medicine, but there is insufficient analysis as to if these strategies have been effective or whether targeted interventions that address the unique barriers faced by different ethnic groups at various career stages are needed. 14 Despite growing awareness, there is limited research examining how differences have evolved over time. Existing studies often provide cross-sectional data, offering valuable but static insights into the representation of ethnic groups within specialties at a single point in time.13,15 Thus, there is insufficient understanding of how differences manifest and evolve during critical career milestones, such as the transition into specialty training and subsequent progression to the Specialist or General Practitioner (GP) Register.
Recent policy developments and heightened awareness of diversity issues provide a timely impetus for re-examining ethnic differences in specialty destinations. The NHS has worked to improve inclusivity, including mandatory reporting on workforce diversity (the Workforce Race Equality Standard) and greater scrutiny of recruitment processes. 10 These efforts, combined with societal calls for racial justice, such as Black Lives Matter, signal a pivotal moment for addressing inequalities in medicine. This study seeks to fill a critical gap by conducting a longitudinal analysis of secondary data to explore if and how ethnic differences in specialty destinations have changed over time. We address the following research questions, for doctors entering specialty training and those completing it and joining the Specialist or GP Register:
Has the difference in the ethnicity distribution of doctors across all specialties changed over time?
Which ethnicities are over- or under-represented in each specialty and how have any patterns changed over time?
Methods
This study complied with the STrengthening the Reporting of OBservational studies in Epidemiology (STROBE) reporting guidelines for observational studies. 16
Study design
This was a longitudinal analysis of secondary data, analysed as a repeated cross-sectional study.
Setting, participants and data
Data were obtained from the General Medical Council’s (GMC) data reporting tool (https://edt.gmc-uk.org/progression-reports/specialty-destination) on 10th March 2025. All doctors who obtained their primary medical qualification (PMQ) from a UK medical school since 1990, and started Core/Specialty Training Year 1 (CT/ST1) or completed specialty/General Practice (GP) training (i.e. gained their Certificate of Completion of Training and joined the specialist/GP register (CCT)), were included. Data were available for 2012–2022 (CT/ST1) and 2007–2021 (CCT). The dataset included the total number of doctors from each ethnicity group starting or completing training in each specialty group, in each year.
Doctors who had missing ethnicity data were excluded. The GMC consistently used five ethnicity groups: Asian, Black, Mixed, White and Other. The numbers of doctors in the Black, Mixed and Other groups were too small to enable meaningful analysis, so these groups were combined into an ‘Other’ ethnicity group.
Changes in the structure of CT/ST1 meant specialty groups were not consistent across all 11 years, making it necessary to combine some specialty groups (‘Surgery’/‘Core Surgical Training’; ‘Core Medical Training’/‘Internal Medicine Training’ and ‘Emergency Medicine’/‘Acute Care Common Stem’ (ACCS)). Data from the ‘Broad Based Training’ pilot were excluded and there were no accessible data for the Sexual and Reproductive Health specialty due to suppression of small numbers, leaving 12 specialty groups for analysis (Table 1).
Doctors by ethnicity group (where known) and specialty group/year.
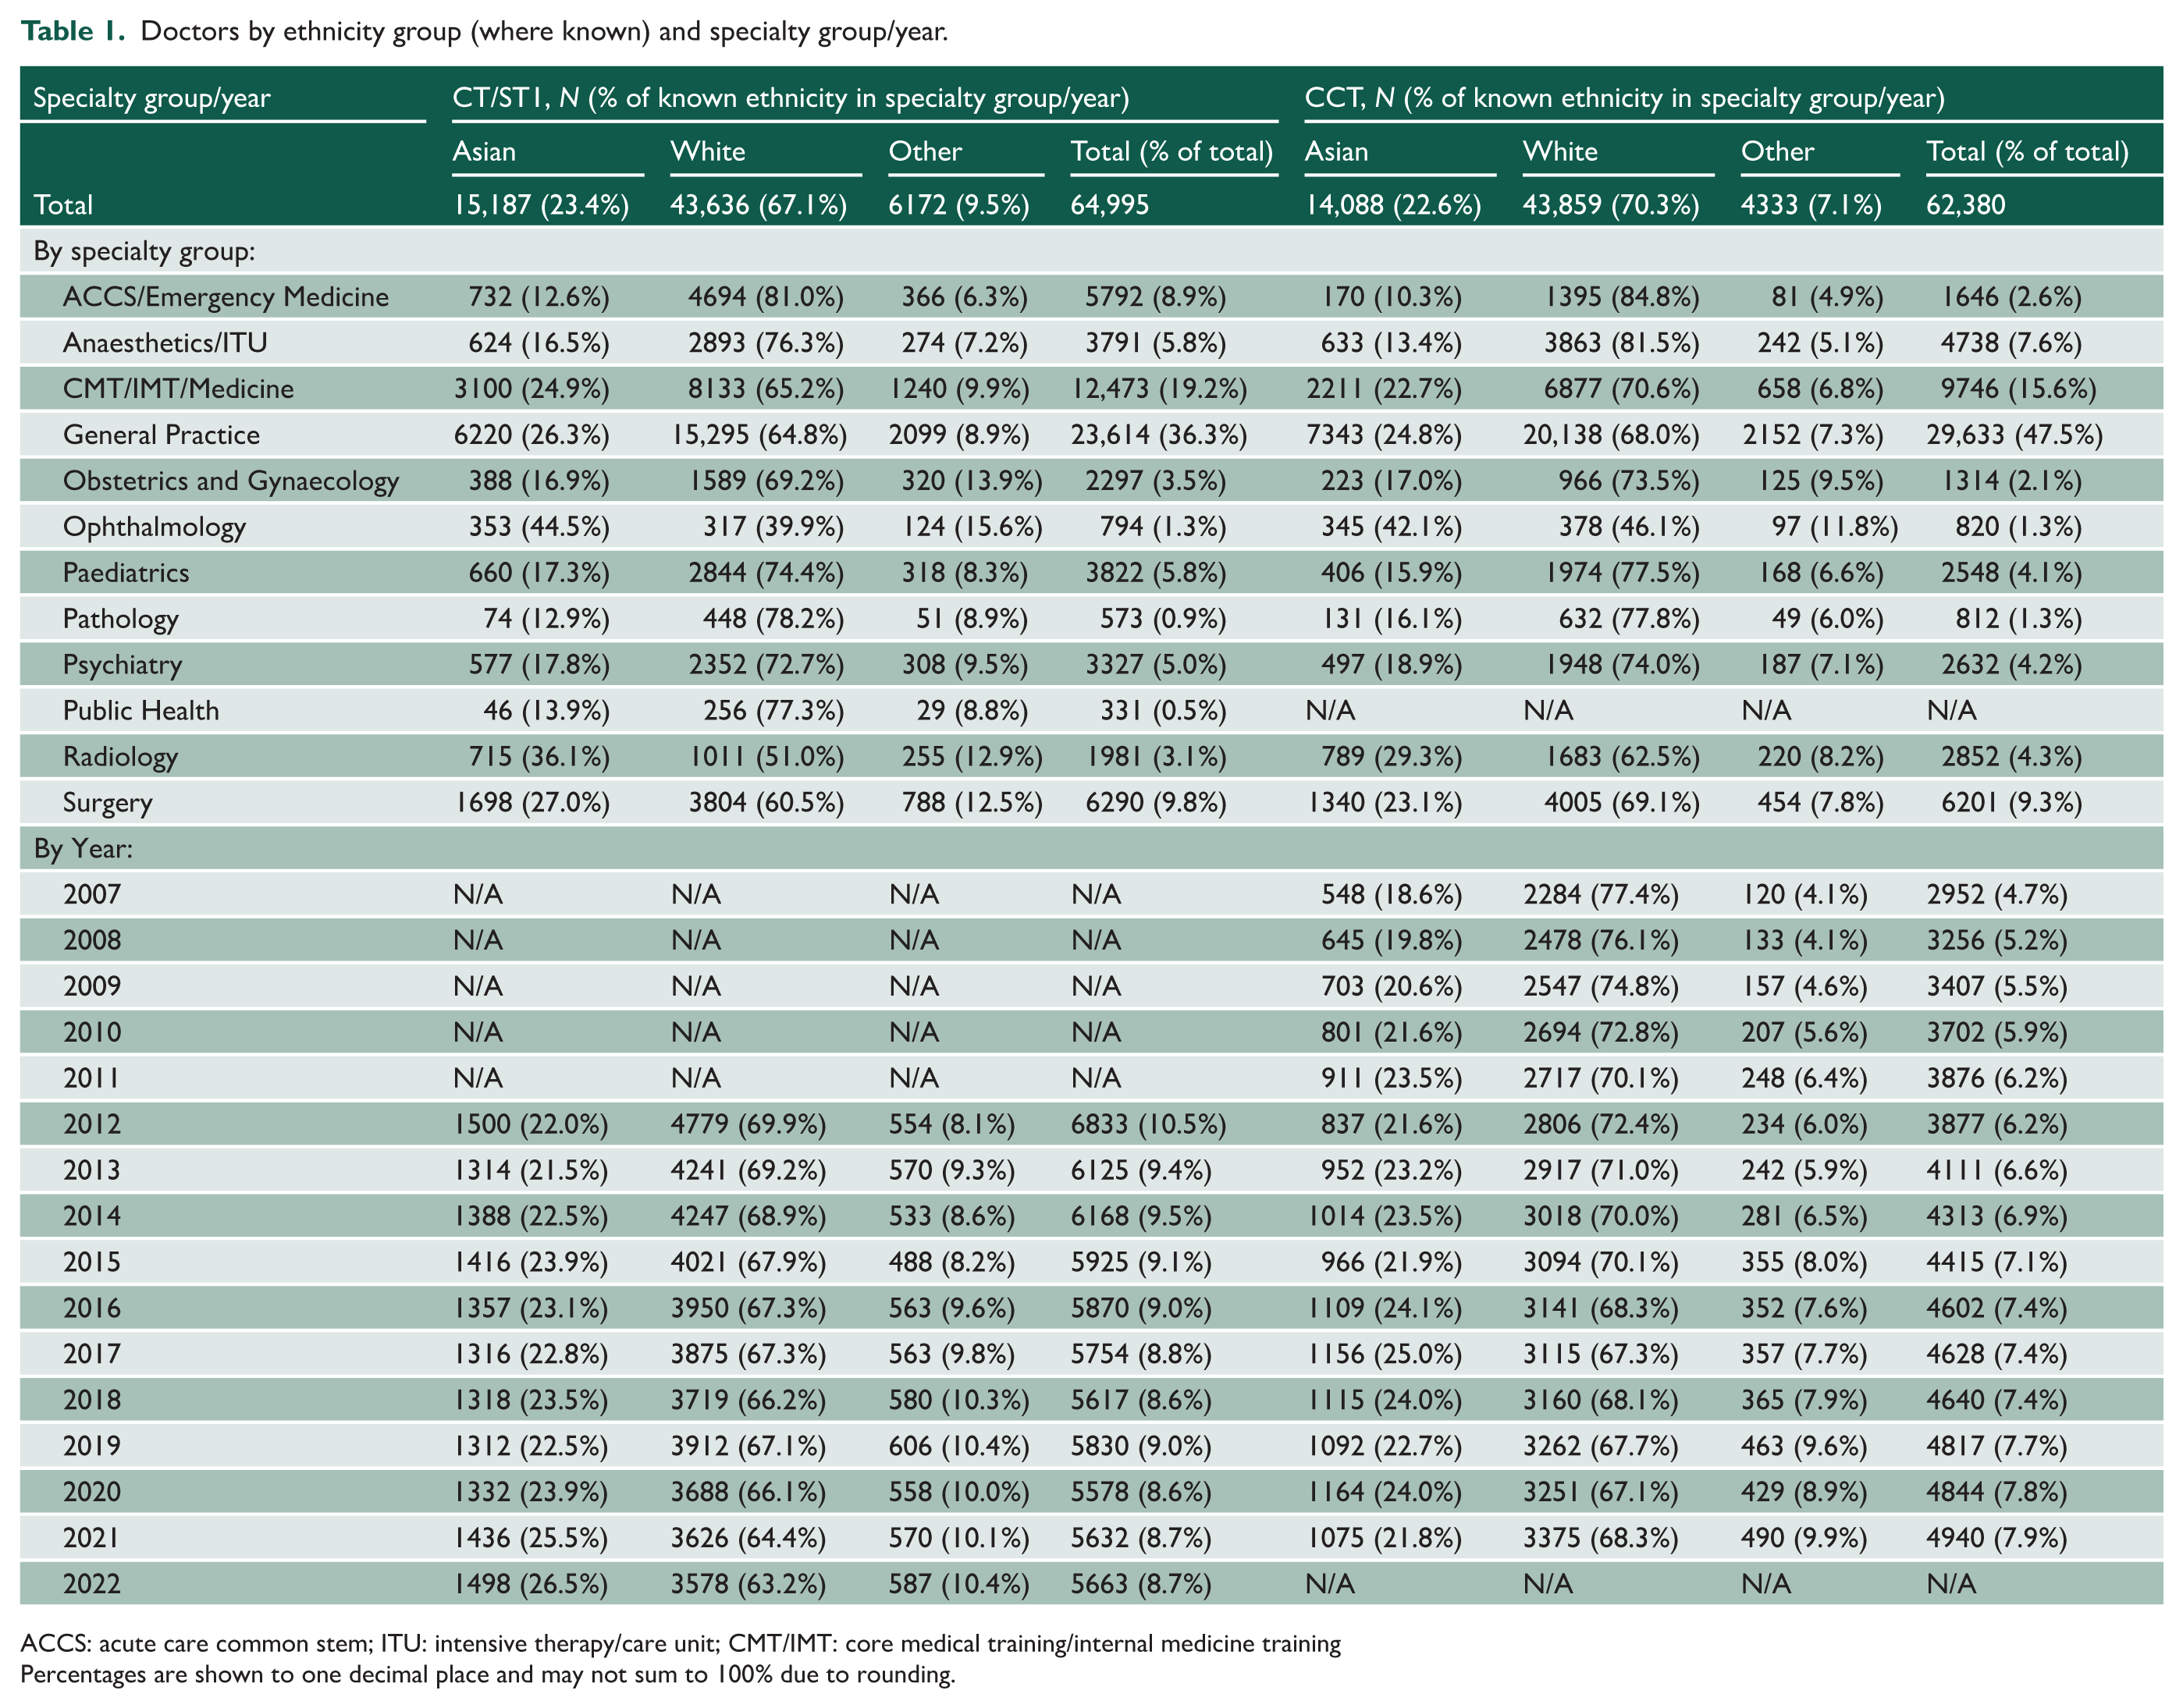
ACCS: acute care common stem; ITU: intensive therapy/care unit; CMT/IMT: core medical training/internal medicine training
Percentages are shown to one decimal place and may not sum to 100% due to rounding.
At CCT level, data for Occupational Health Medicine were missing entirely, and data for Public Health were missing for 5 years (2010–2014). Thus, we could not include Occupational Health Medicine, and we excluded Public Health as trends could not be analysed with 5 years of missing data. This left us with data on 11 specialty groups (Table 1).
Statistical analysis
For research question 1, we undertook a chi-squared test for each level and year. These tests compared the observed number of doctors of each ethnicity within each specialty group to the number expected if each specialty group comprised of the same proportion of doctors from each of Asian, White and other ethnicity backgrounds in that year/level as a whole. To determine statistical significance, we adjusted a baseline critical p-value of 0.05 for the number of tests using the Dunn–Sidak correction, giving critical p-values of 0.0047 (CT/ST1) and 0.0034 (CCT). We calculated Cohen’s w effect size and plotted the absolute difference between Cohen’s w and the relevant critical w (i.e. net effect size) against time on a line graph. The larger the net effect size, the larger the ethnicity distribution difference compared to the expected distribution. Finally, we undertook an ordinary least squares regression of the net effect size (i.e. Cohen’s w – critical w) against time to evaluate the trend in ethnicity distribution differences. To provide context for our results, we also calculated the percentage of doctors who would need to move specialties for there to be proportionate representation of each ethnicity group in each specialty group in each year.
For research question 2, we firstly calculated the total percentage of doctors from each ethnicity group in each specialty group who would need to move specialties for proportionate representation at each level, highlighting the specialties where at least one quarter of doctors would need to move for proportionate representation. We then repeated the percentage calculations by year and analysed the trend over time for each ethnicity group/specialty group combination at each level using a Kendall’s tau-b correlation coefficient. We considered a tau-b coefficient of greater than 0.33 to be practically significant, based on the large effect size threshold of 0.5 for Pearson’s r and applying Gilpin’s method of transforming tau-b to r. 17 With 36 tests at CT/ST1 and 33 at CCT level (one for each specialty group/ethnicity group combination), p-values of <0.0014 and <0.0016 would be required for statistical significance, using the Dunn–Sidak correction for multiple comparisons. We plotted the results on a set of time-series graphs.
Study size
We had data for around 6000 doctors per year (CT/ST1) and 3000–5000 (CCT). We estimated that we would be able to detect statistically significant effects for year/level combinations (research question 1) if around 10% (relative) of doctors were in a different specialty to that expected if each specialty group had the same proportion of doctors from Asian, White and, other ethnicity backgrounds in that year/level as a whole (Cohen’s w of approximately 0.1, i.e. a small effect size). Our power calculation used a baseline alpha of 0.05, adjusted for multiple comparisons as detailed above.
Ethical approval
This study was approved by the Imperial College London Education Ethics Review Process (EERP) with reference EERP2324-115 on 25th June 2024.
Patient and public involvement
The study and manuscript development did not involve patients and/or members of the public because we did not have funding or resources for these additional activities.
Results
Data were provided for a total of 67,263 entrants to CT/ST1 across 12 specialty groups and 11 years, and 65,517 doctors obtaining CCT across 11 specialty groups and 15 years. Of these totals, ethnicity data were missing for 3.4% of CT/ST1 entrants and 4.8% of those obtaining CCT, giving us usable samples of 64,995 for CT/ST1 and 62,380 for CCT. The extent of missing ethnicity data varied by specialty and year. By specialty/level, the range was 2.2% for CT/ST1 Paediatrics to 7.4% for CCT Ophthalmology. At CT/ST1 level, the extent of missing data by year ranged from 2.6% in 2012 to 4.3% in 2013 and 2015, whereas there was a general downwards trend in the extent of missing data at CCT level. Table 1 summarises the total number of doctors from each ethnicity group by specialty group and year. Across all specialty groups combined, the trend over time at both levels – more so at CCT level than at CT/ST1 level – is that the proportion of White doctors decreases, whereas the proportions of Asian doctors and those from other ethnicity groups increase.
For research question 1, the chi-squared tests for each level and year were statistically significant for all but one test: CCT in 2007 (Appendix 1). Figure 1 shows the trend in the net Cohen’s w effect size over time for each level; any value greater than 0 is statistically significant. The net Cohen’s w is noticeably higher for CT/ST1 than for CCT, indicating greater ethnicity differences in specialty group destinations at entry to training than at successful completion of training. The regression lines for each level are also shown on the plot. Both lines have a positive gradient indicating that ethnicity differences in specialty group destinations are increasing over time. Both trends for CT/ST1 and CCT were statistically significant (the p-values for the coefficients on time were 0.041 for CT/ST1 and 0.024 for CCT; see Figure 1 legend for full results).
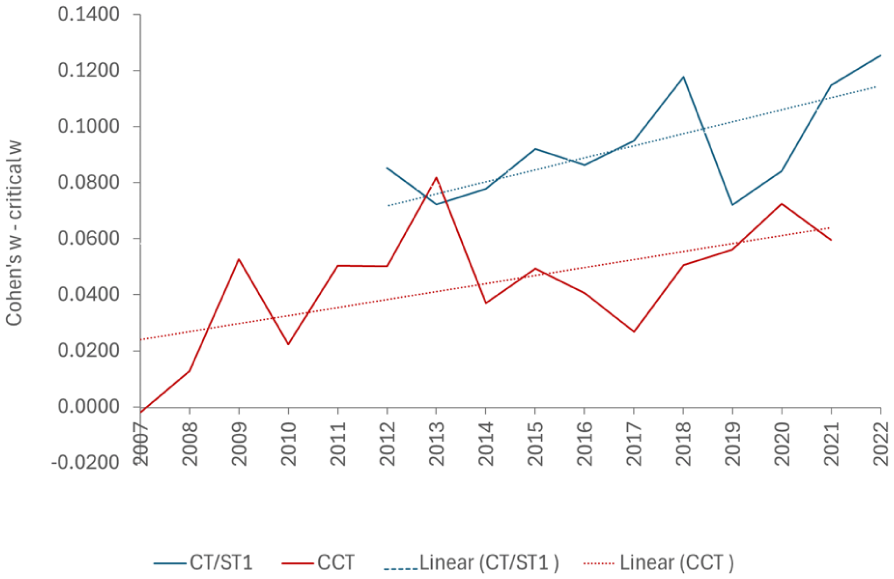
The dotted lines show the linear trend over time for the net Cohen’s w at each level.
The total percentage of doctors who would need to move specialty groups for proportionate representation of each ethnicity group in each specialty group increases from 10.1% in 2012 to 16.2% in 2022 for CT/ST1, and from 7.0% in 2007 to 9.8% in 2021 for CCT. Across all years combined, a greater proportion of Asian doctors would need to move (20.4% at CT/ST1 and 14.5% at CCT), compared to doctors in the ‘other’ ethnicity group (14.9% at CT/ST1 and 8.5% at CCT) and White doctors (8.1% at CT/CT1 and 5.3% at CCT).
Figure 2 shows the percentage of doctors from each ethnicity group in each specialty group at CT/ST1 and CCT level who would need to move specialty groups for there to be proportionate representation in each year. Across all years combined, Medicine is the most representative specialty at both levels (3.9% of doctors would need to move at CT/ST1 level and 0.7% at CCT level). Ophthalmology, with over-representation of Asian doctors, is the least representative specialty at both levels (54.5% of doctors would need to move at CT/ST1 level and 48.1% at CCT level). Other specialty groups where at least one quarter of doctors would need to move for proportionate representation were Radiology (31.4%) and ACCS (28.3%) at CT/ST1 and Emergency Medicine (28.6%) at CCT.
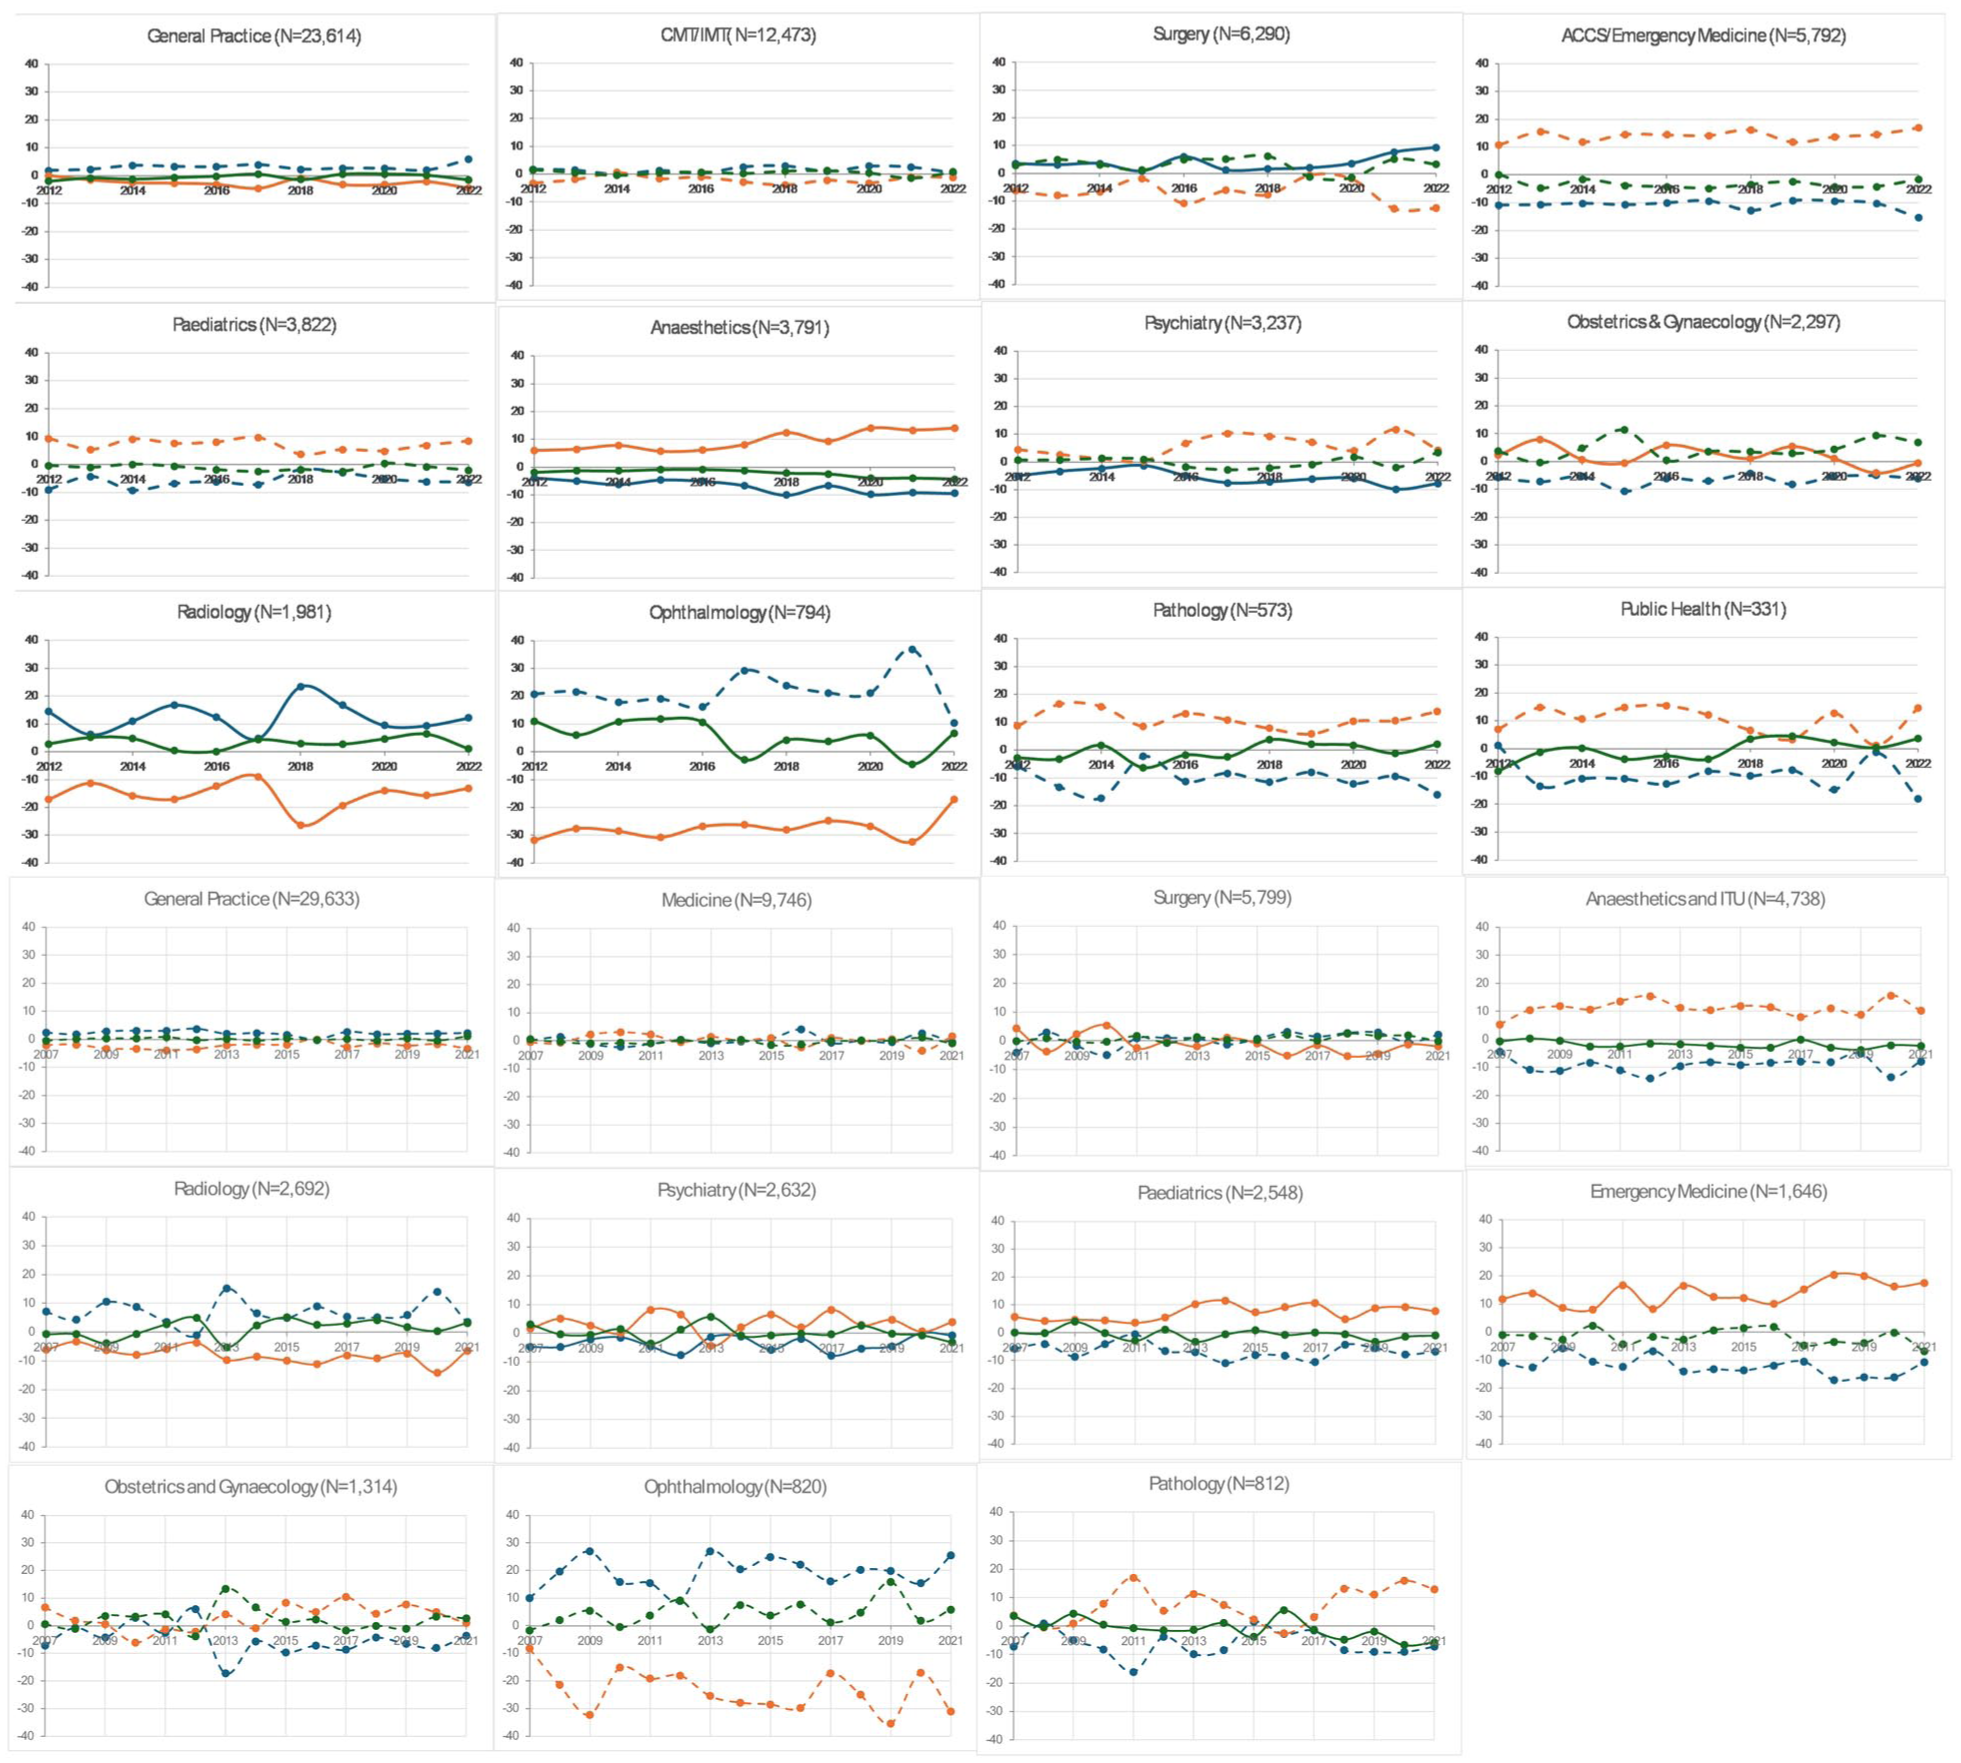
(top) CT/ST1 and (bottom) CCT. The y-axis shows the over (positive) or under (negative) representation of each ethnicity group in the specialty as a percentage of doctors in that specialty in each year. Graphs are ordered by specialty size (shown as N in the title).
None of the individual time-trends were statistically significant (see Appendix 2 for full results), although some of the trends showed a large effect size, as summarised in Table 2. There were nine large effect sizes where the extent of over- or under-representation of a specific ethnicity group was exacerbated in the period studied compared with three where there was a move towards proportionate representation across ethnicity groups, including the most diverse specialty at the outset (Ophthalmology), but only at CT/ST1.
Time-trends with a large effect size.
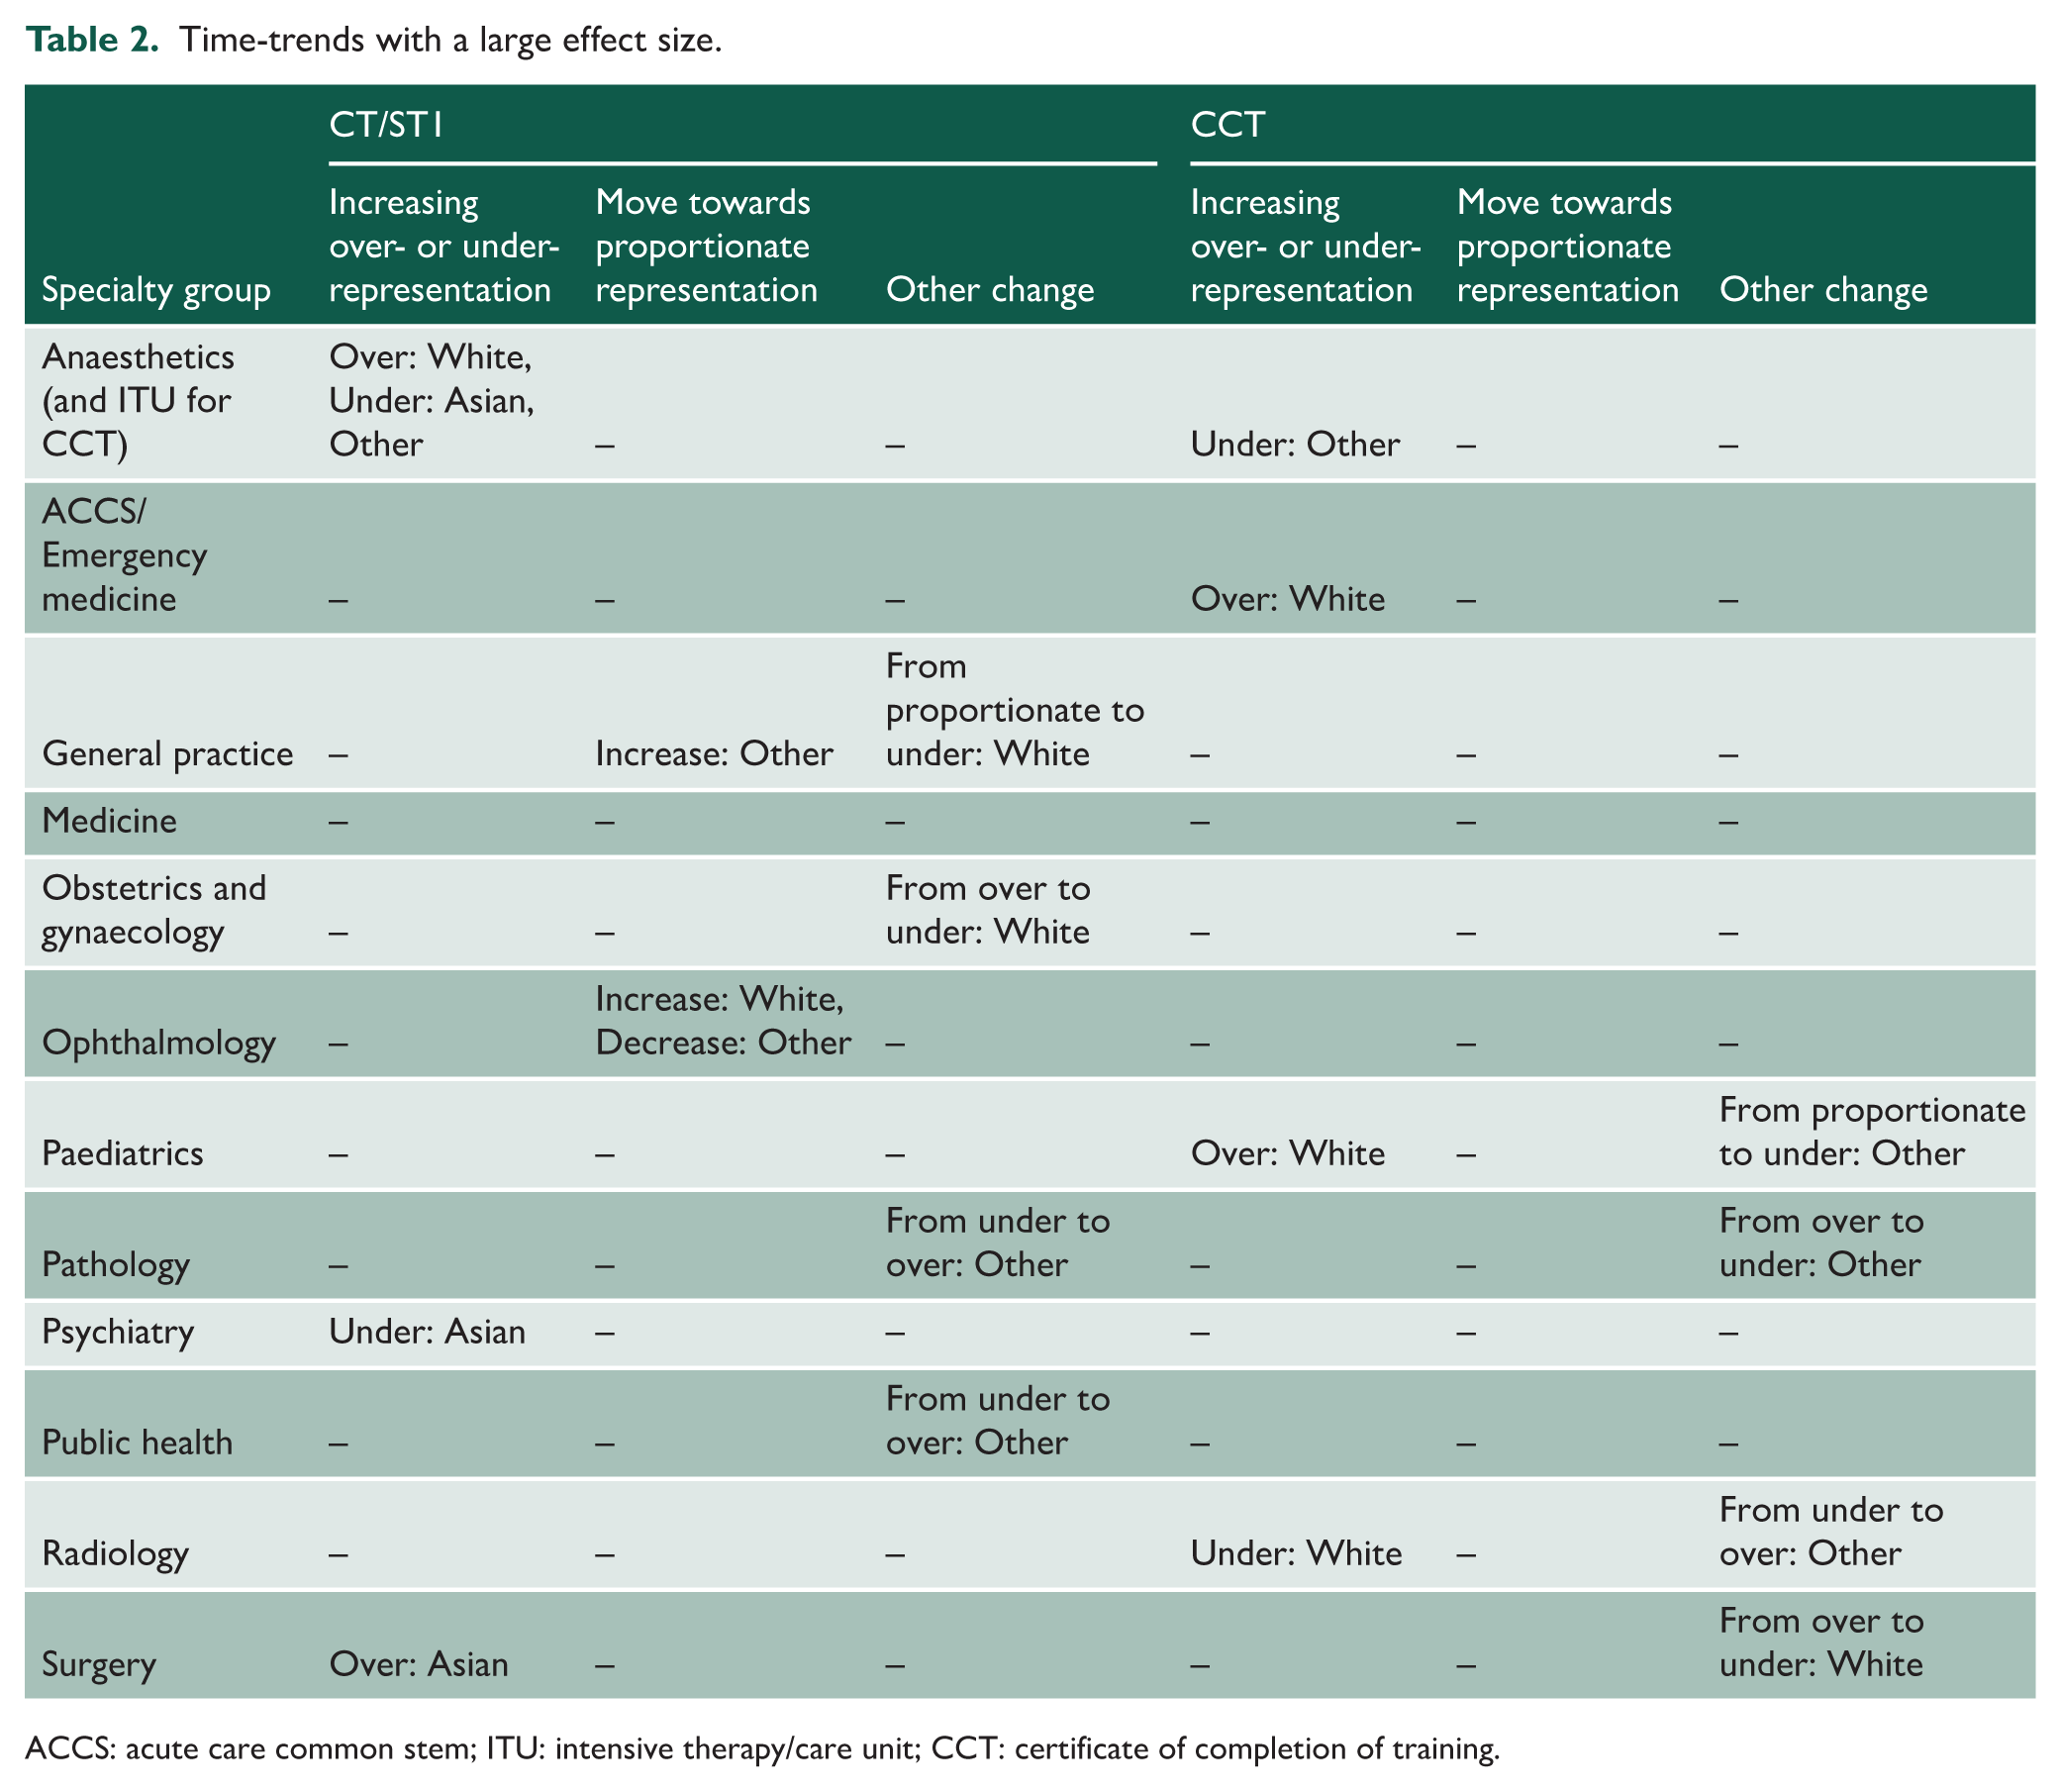
ACCS: acute care common stem; ITU: intensive therapy/care unit; CCT: certificate of completion of training.
Discussion
Statement of principal findings
Our dataset of 64,995 CT/ST1 entrants and 62,380 CCT completions identified persistent ethnic differences across the training pathway. Ethnic differences between specialty groups were more marked at entry into training, and there was an overall trend of increasing diversity of the study population over time at both levels. Across all years combined, White doctors were over-represented in Anaesthetics, Intensive Care and Emergency Medicine and Asian doctors in Ophthalmology and Radiology, although there is no gold standard criterion for determining over- or under-representation. Of the specialties identified above, there was some evidence of a move towards proportionate representation in Ophthalmology at CT/ST1 level, but the trend was not statistically significant.
Strengths and weaknesses of the study
To our knowledge, our study is the first to comprehensively examine ethnicity differences in relation to entry and completion of UK specialty group training. It utilises a large national dataset encompassing all doctors who obtained their PMQ from a UK medical school across multiple specialty groups and over multiple entry/cohort years.
Several limitations must be acknowledged. Our analysis was restricted to UK-PMQ trained doctors; therefore, our findings may not be generalisable to International Medical Graduates or other healthcare education systems given the unique structure of UK postgraduate medical training. Nevertheless, our sample will include some doctors who migrated to the United Kingdom to obtain their PMQ and remained for specialty training, and these doctors may continue to face challenges related to linguistic, cultural or systemic factors. Our analysis also combined Black, Mixed and Other ethnicities into a single ‘Other’ ethnicity category due to small numbers, which may have masked important patterns specific to these individual groups. Additionally, there was a small proportion of doctors of unknown ethnicity; with missingness unlikely to be ‘missing completely at random’ (e.g. missing data were more common in Ophthalmology than in other specialties). Such patterns of missingness may have biased our results.
Our analysis did not disaggregate data by sex or gender due to dataset limitations and the risk of identifying individuals from intersectional minoritised groups. Finally, our study does not account for factors such as medical school attended or prior academic performance: the GMC dataset was only available at aggregate, rather than individual level, so we were unable to adjust for confounders.
Strengths and weaknesses of the study in relation to other studies
Our findings align with a growing body of research on ethnic diversity and career progression in UK medicine. The ethnic composition of the medical workforce changes at higher career stages; a ‘funnel effect’ whereby minority representation diminishes in more senior ranks.3,11,18 For instance, a recent workforce analysis reported that among UK-trained NHS doctors in England, 37% of junior doctors were from non-White ethnic groups, compared to 24% of consultants. 3 This mirrors our observation of a drop (albeit modest) in minority proportions from the start of specialty training to CCT, indicating that while diversity at entry has increased, this has not yet been fully reflected at completion – a lag effect in which minority ethnic gains at entry have not yet translated into proportional gains at higher levels.
Ethnic differences at the point of selection into training have been highlighted in prior studies. National recruitment data from 2021 showed most ethnic minority applicant groups had significantly lower odds of being appointed to specialty training posts than their White British counterparts. 10
Our results concur with previous reports that the distribution of ethnic groups across specialties is uneven. A recent analysis of NHS workforce data noted all specialties in England have a higher share of non-White doctors than does the general population, 19 yet some specialties are far more ethnically diverse than others. 3 Ophthalmology, for example, was reported to have about 60% of its senior doctors from minority ethnic backgrounds (the highest of any major specialty), whereas Anaesthetics had approximately 39%. 3 We similarly found Ophthalmology and Radiology to have greater representation of minority ethnic doctors compared to the overall average, whereas Anaesthetics and Emergency Medicine had the opposite pattern. These parallels suggest that certain longstanding specialty preferences or structural factors continue to drive who enters different fields.
Furthermore, the ‘lag’ between entering CT/ST1 and obtaining CCT varies by specialty group and individual circumstances; therefore, we could not calculate ‘success rates’ by ethnicity from our dataset. Nevertheless, the smaller ethnicity differences between specialty groups at CCT level compared with CT/ST1 may mask a concerning trend of a lower success rate for ethnic minority doctors, as noted by others. 18
Meaning of the study: possible explanations and implications
The observed ethnic differences suggest a dynamic interplay between multiple factors, including ethnicity, preferences, systemic factors and career progression. Specialty group preferences may be shaped by cultural and social influences, perceptions regarding accessibility and historical patterns within specific fields. However, the persistent and increasing ethnic differences identified suggest underlying structural and systemic factors. Extensive evidence exists regarding differential attainment,20,21 indicating minority ethnic doctors experience lower pass rates in postgraduate examinations and have less favourable training outcomes. Such differential attainment may significantly impact observed progression patterns. Moreover, workplace discrimination, as evidenced by higher reported incidents of bullying and harassment among minority ethnic NHS staff, 3 potentially exacerbate these differences by discouraging entry to certain high-competition specialties or contributing to attrition. The net effect of these complex factors could provide plausible explanations for the lower proportion of minority doctors at CCT, and the persistent gaps observed at specialty group entry.
Unanswered questions and future research
Despite highlighting important trends, our study raises several questions that warrant further investigation. The use of broad ethnicity categories (White, Asian and Other) may obscure specific patterns. Future research could use datasets with more granular exploration of ethnic subgroups to identify whether any particular groups are disproportionately affected. Qualitative research could also complement these analyses by exploring the lived experiences of minority ethnic trainees in different specialty groups, which could shed light on their perspectives of any barriers and facilitators they may face entering or completing specialty group training that may influence their career trajectory. Finally, it remains unclear to what extent the observed specialty group choices reflect personal preference versus external influences and potential biases in selection and progression.
Conclusions
The data present clear evidence of persistent ethnic differences in UK medical specialty training, as well as reduced diversity across specialty groups over time. This highlights the need for continued attention to equity in medical training and career progression. Our results do not necessarily indicate bias in specialty selection or training progression based on ethnicity. If all doctors are able to train in their preferred specialty group, then ethnicity balance becomes a trade-off between individual preferences and the benefits of workforce diversity within each specialty group, rather than a clear-cut objective.
Supplemental Material
sj-docx-1-jrs-10.1177_01410768261455488 – Supplemental material for Ethnic differences in specialty destinations in UK medicine: a repeated cross-sectional analysis of secondary data
Supplemental material, sj-docx-1-jrs-10.1177_01410768261455488 for Ethnic differences in specialty destinations in UK medicine: a repeated cross-sectional analysis of secondary data by Celia Brown, Nariell Morrison, Karen Aus, Anna Coulson and Amir H Sam in Journal of the Royal Society of Medicine
Footnotes
Appendix
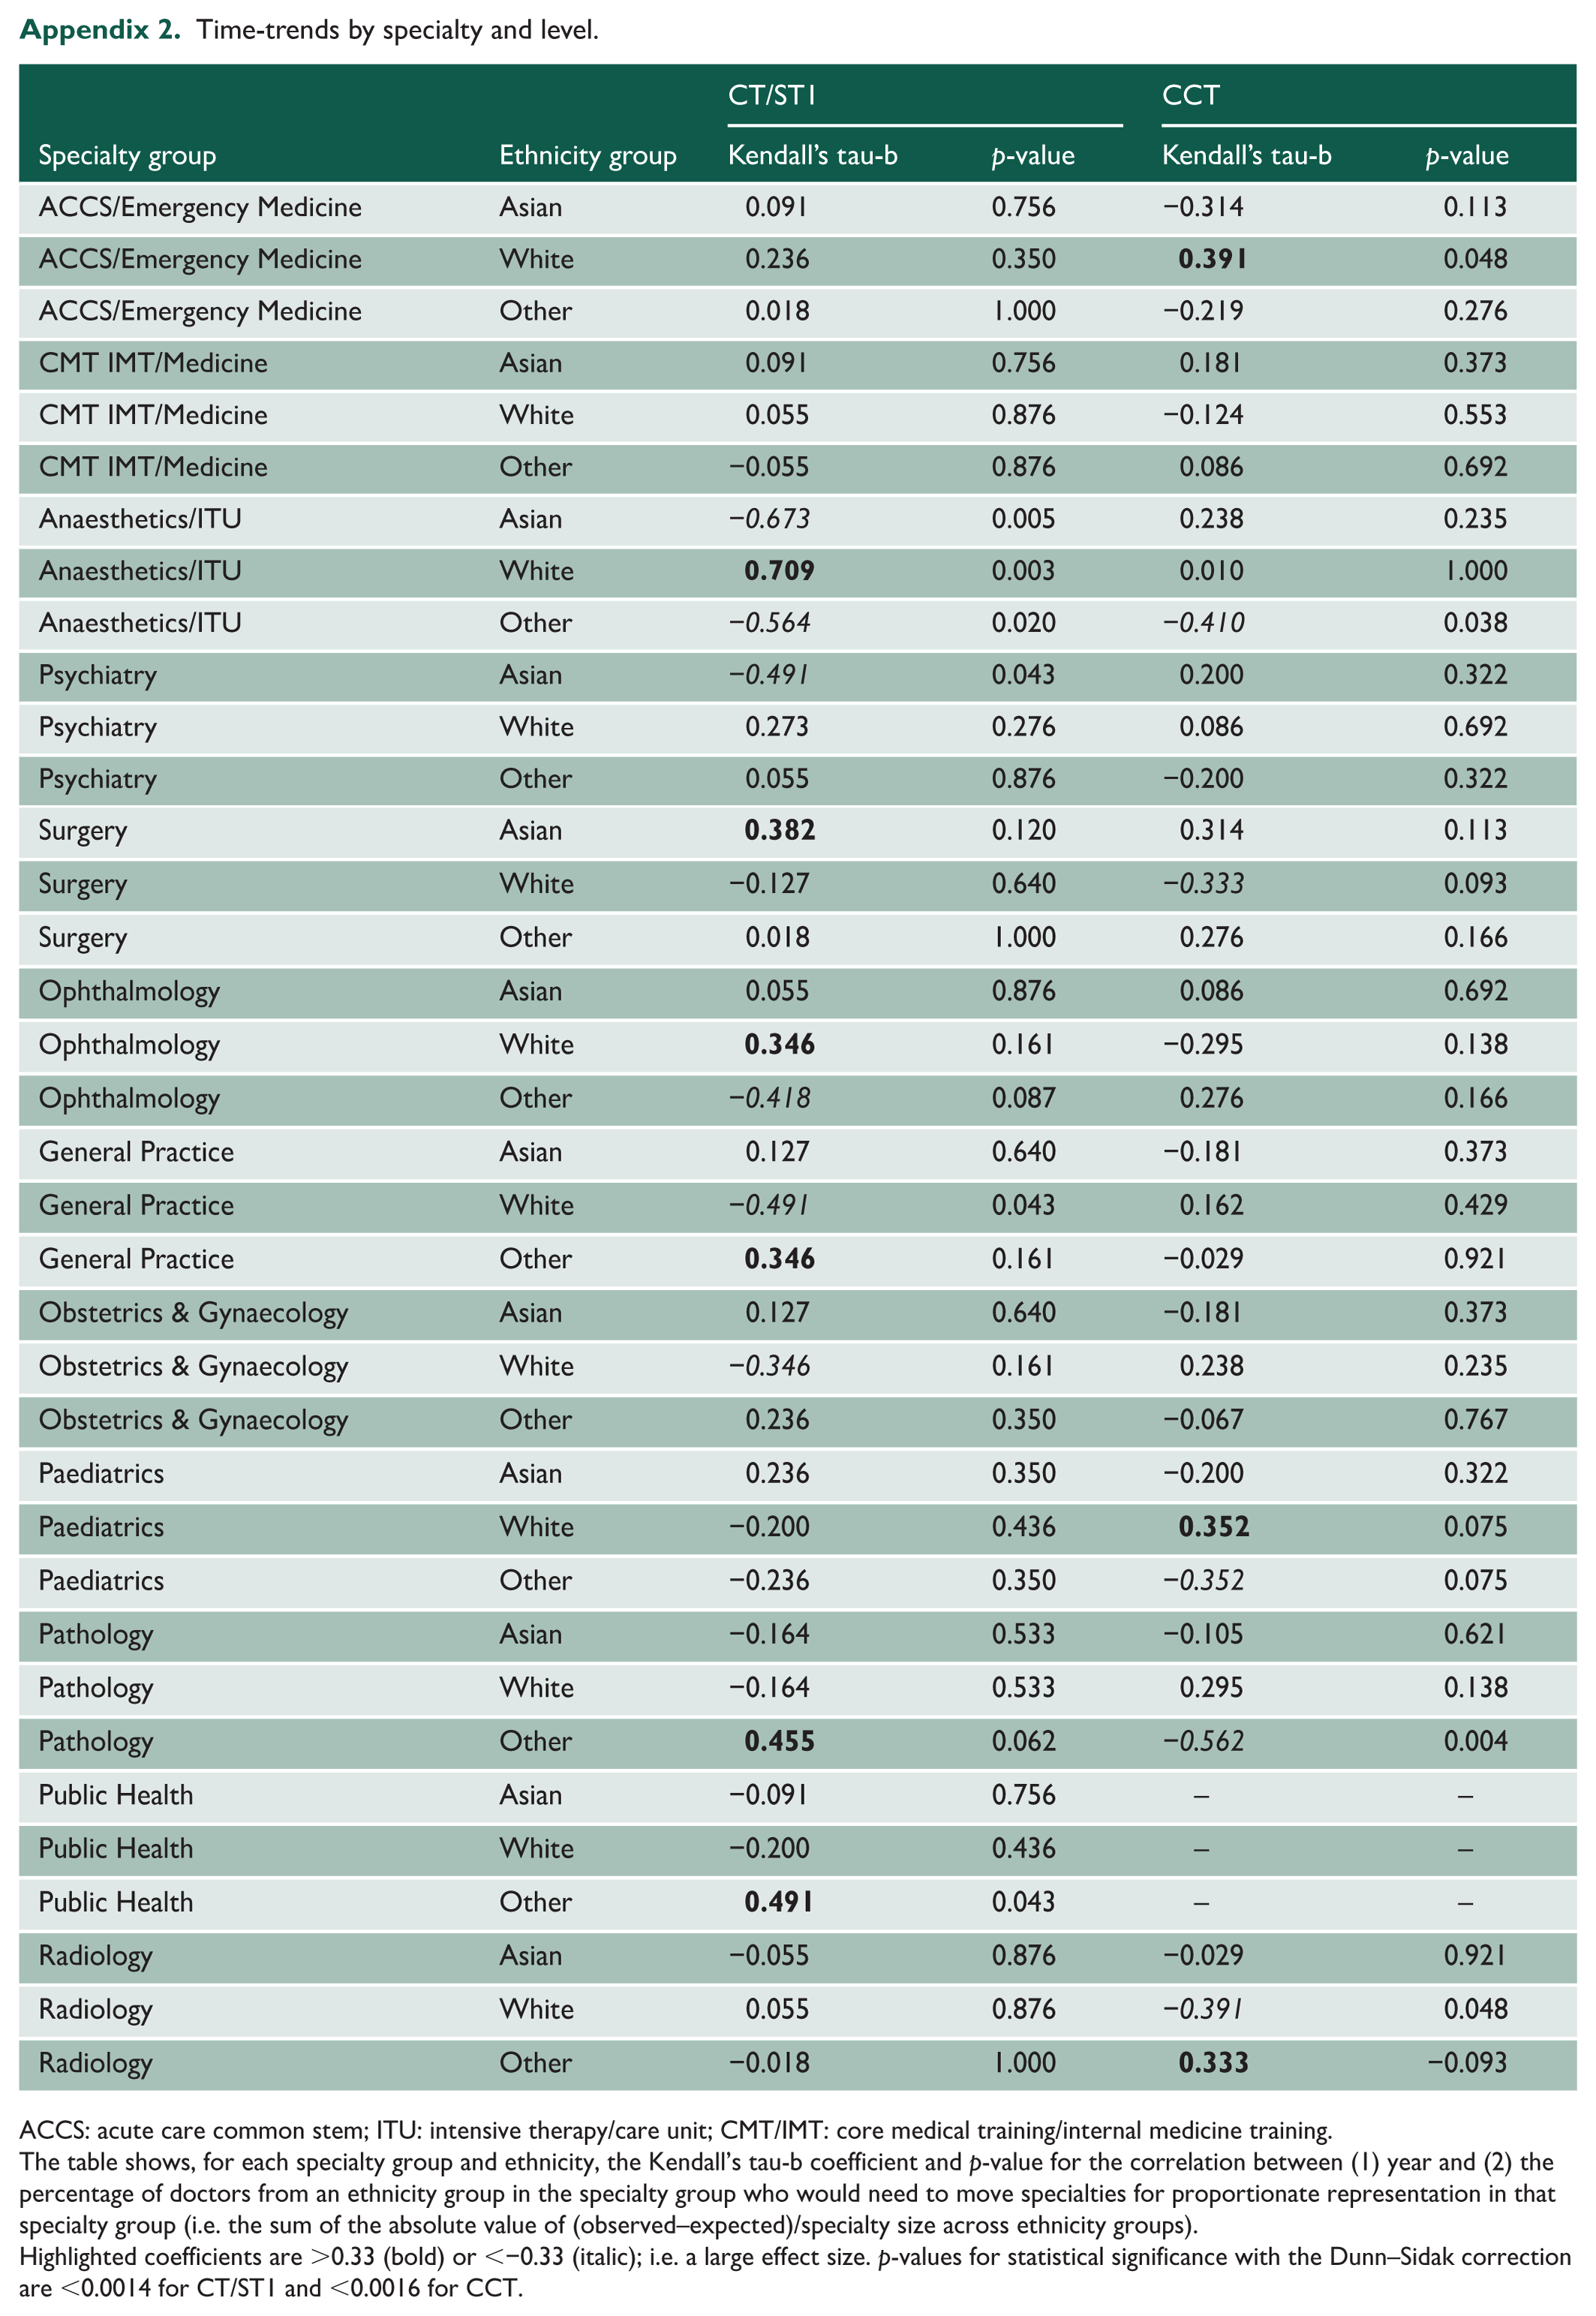
Time-trends by specialty and level.
| CT/ST1 | CCT | ||||
|---|---|---|---|---|---|
| Specialty group | Ethnicity group | Kendall’s tau-b | p-value | Kendall’s tau-b | p-value |
| ACCS/Emergency Medicine | Asian | 0.091 | 0.756 | −0.314 | 0.113 |
| ACCS/Emergency Medicine | White | 0.236 | 0.350 |
|
0.048 |
| ACCS/Emergency Medicine | Other | 0.018 | 1.000 | −0.219 | 0.276 |
| CMT IMT/Medicine | Asian | 0.091 | 0.756 | 0.181 | 0.373 |
| CMT IMT/Medicine | White | 0.055 | 0.876 | −0.124 | 0.553 |
| CMT IMT/Medicine | Other | −0.055 | 0.876 | 0.086 | 0.692 |
| Anaesthetics/ITU | Asian | −0.673 | 0.005 | 0.238 | 0.235 |
| Anaesthetics/ITU | White |
|
0.003 | 0.010 | 1.000 |
| Anaesthetics/ITU | Other | −0.564 | 0.020 | −0.410 | 0.038 |
| Psychiatry | Asian | −0.491 | 0.043 | 0.200 | 0.322 |
| Psychiatry | White | 0.273 | 0.276 | 0.086 | 0.692 |
| Psychiatry | Other | 0.055 | 0.876 | −0.200 | 0.322 |
| Surgery | Asian |
|
0.120 | 0.314 | 0.113 |
| Surgery | White | −0.127 | 0.640 | −0.333 | 0.093 |
| Surgery | Other | 0.018 | 1.000 | 0.276 | 0.166 |
| Ophthalmology | Asian | 0.055 | 0.876 | 0.086 | 0.692 |
| Ophthalmology | White |
|
0.161 | −0.295 | 0.138 |
| Ophthalmology | Other | −0.418 | 0.087 | 0.276 | 0.166 |
| General Practice | Asian | 0.127 | 0.640 | −0.181 | 0.373 |
| General Practice | White | −0.491 | 0.043 | 0.162 | 0.429 |
| General Practice | Other |
|
0.161 | −0.029 | 0.921 |
| Obstetrics & Gynaecology | Asian | 0.127 | 0.640 | −0.181 | 0.373 |
| Obstetrics & Gynaecology | White | −0.346 | 0.161 | 0.238 | 0.235 |
| Obstetrics & Gynaecology | Other | 0.236 | 0.350 | −0.067 | 0.767 |
| Paediatrics | Asian | 0.236 | 0.350 | −0.200 | 0.322 |
| Paediatrics | White | −0.200 | 0.436 |
|
0.075 |
| Paediatrics | Other | −0.236 | 0.350 | −0.352 | 0.075 |
| Pathology | Asian | −0.164 | 0.533 | −0.105 | 0.621 |
| Pathology | White | −0.164 | 0.533 | 0.295 | 0.138 |
| Pathology | Other |
|
0.062 | −0.562 | 0.004 |
| Public Health | Asian | −0.091 | 0.756 | – | – |
| Public Health | White | −0.200 | 0.436 | – | – |
| Public Health | Other |
|
0.043 | – | – |
| Radiology | Asian | −0.055 | 0.876 | −0.029 | 0.921 |
| Radiology | White | 0.055 | 0.876 | −0.391 | 0.048 |
| Radiology | Other | −0.018 | 1.000 |
|
−0.093 |
ACCS: acute care common stem; ITU: intensive therapy/care unit; CMT/IMT: core medical training/internal medicine training.
The table shows, for each specialty group and ethnicity, the Kendall’s tau-b coefficient and p-value for the correlation between (1) year and (2) the percentage of doctors from an ethnicity group in the specialty group who would need to move specialties for proportionate representation in that specialty group (i.e. the sum of the absolute value of (observed–expected)/specialty size across ethnicity groups).
Highlighted coefficients are >0.33 (bold) or <−0.33 (italic); i.e. a large effect size. p-values for statistical significance with the Dunn–Sidak correction are <0.0014 for CT/ST1 and <0.0016 for CCT.
Acknowledgements
The authors are grateful to the GMC for providing access to the data on their website and to the peer-reviewers who provided insightful comments to help them improve the paper. Data on the CT/ST1 and CCT populations are publicly available on the GMC website.
Declarations
Supplemental material:
Supplemental material for this article is available online.
Use of generative AI:
No generative AI was used during the preparation of this manuscript.
References
Supplementary Material
Please find the following supplemental material available below.
For Open Access articles published under a Creative Commons License, all supplemental material carries the same license as the article it is associated with.
For non-Open Access articles published, all supplemental material carries a non-exclusive license, and permission requests for re-use of supplemental material or any part of supplemental material shall be sent directly to the copyright owner as specified in the copyright notice associated with the article.