In this paper, we investigate the misleading effect of measurement errors on simultaneous monitoring of the multivariate process mean and variability. For this purpose, we incorporate the measurement errors into a hybrid method based on the generalized likelihood ratio (GLR) and exponentially weighted moving average (EWMA) control charts. After that, we propose four remedial methods to decrease the effects of measurement errors on the performance of the monitoring procedure. The performance of the monitoring procedure as well as the proposed remedial methods is investigated through extensive simulation studies and a real data example.
Control charts have become the most commonly tools for distinguishing between assignable and random causes in order to reduce process variation (Montgomery, 2007). Nowadays in most production environments, quality engineers are engaged in monitoring the mean and variability of multivariate processes where several correlated quality characteristics should be monitored simultaneously. In most multivariate monitoring methods, the process mean and the process variability are monitored separately, whereas only few studies have focused on simultaneous monitoring schemes. A typical approach to monitor the mean and variability of univariate and/or multivariate processes simultaneously is to plot the mean and the scale parameter estimators in a same control chart, as in White and Schroeder (1987) and Spring and Cheng (1998). Khoo (2004) proposed a bivariate control chart based on and statistics for simultaneous monitoring of both the process mean and the process variability in situations with multivariate data. He also presented numerous examples to show the application of his proposed control chart in real situations.
Chen et al. (2005) proposed a control scheme called maximum exponential weighted moving average (Max-EWMA) control chart for monitoring both location and dispersion criteria, simultaneously. They performed a comparison analysis and found that their proposed control chart performs better than the combination of chi-square and |S| control charts when small changes in the process parameters occur. Costa and Rahim (2004a) used joint /R control charts using two-stage sampling. In the first stage of their proposed approach, only one item of the sample is inspected. Based on the result of the first stage, the sampling is stopped if the process is found to be in-control; otherwise, the inspection of remaining items of the corresponding sample is continued in the second stage. Costa and Rahim (2004b) then proposed the exponentially weighted moving average (EWMA) control chart based on the non-central chi-square statistic for detecting assignable causes that affect the process mean and/or increase the variability. Reynolds and Cho (2006) proposed some multivariate exponential weighted moving average (MEWMA) control charts based on the combination of sample means and sum of squared regression adjusted deviation from target in order to monitor the mean vector and the covariance matrix of correlated quality characteristics simultaneously. Holan and Spinka (2007) used an unconstrained parameterization and developed a maximum likelihood estimator (MLE) in order to model the mean and covariance matrix for unbalanced repeated measures jointly. They also presented the approximate distribution of the estimated parameters. Hawkins and Maboudou-Tchao (2008) provided a control scheme (called the MAC control chart) to monitor both mean and variability of multivariate processes. For this purpose, they used the combination of the MEWMA and the multivariate exponentially weighted moving covariance matrix (MEC) control charts. Zhang and Chang (2008) introduced a new multivariate control procedure based on two multivariate EWMA control charts using individual observations to monitor the process mean and variance simultaneously and to identify proper sources of variations. Through a simulation study, they proved that the proposed hybrid control chart is able to identify appropriate types of shifts in terms of correct detection percentages. Costa et al. (2009) developed a synthetic control chart for monitoring both the mean and variance of a process by considering a two-stage testing. Niaki and Memar (2009) proposed a new methodology in order to monitor and diagnose bivariate normal mean vector and covariance matrix simultaneously. They transformed the primary monitoring space such that all control elements have the same probability distributions and then they only monitored the maximum absolute value of the transformed elements to monitor both the mean vector and the covariance matrix simultaneously. Guh (2010) used an artificial neural network (ANN)-based method for simultaneous recognition of three most common mean and variance control chart patterns including shift, trend and cycle. Zhang et al. (2010) designed a single control chart with integration of the EWMA statistic and generalized likelihood ratio (GLR) test for simultaneously monitoring of both the multivariate process mean and variability. Wang et al. (2014) applied the GLR test and the multivariate exponentially weighted moving covariance control chart to design a new statistic for simultaneously monitoring of the mean vector and the covariance matrix of a multivariate normal process. Maleki and Amiri (2015) proposed a monitoring scheme based on the combination of two neural networks to detect the mean and variance shifts simultaneously in multivariate-attribute processes whose quality characteristics are correlated.
The fact that the measurement errors result in a diminished power of both univariate and multivariate control charts in detecting process shifts is well documented in the literature. Abraham (1977) studied the effect of measurement errors on the performance of the usual control chart by adding measurement errors to the process once the control limits have been established and observing the measurement errors effect on the control chart. Kanazuka (1986) considered the joint power of /R control charts under the normality assumption to detect mean and variance shifts. He mentioned that in the presence of significant measurement errors, the power of the joint and R control charts is diminished and suggested using larger sample sizes to recover the lost power of the control chart. Mittag (1995) used the same model of Kanazuka (1986), considering the S control chart instead of the R control chart. Linna and Woodall (2001) addressed the problem of measurement errors in the univariate case on the performance of and S2 control charts considering a linear covariate model. Linna et al. (2001) then investigated the performance of multivariate control charts in the presence of measurement errors. Maravelakis et al. (2004) examined the effect of measurement errors on the ability of the EWMA control chart to detect mean shifts. Yang et al. (2007) investigated the effects of imprecise measurements on monitoring two dependent process steps. They applied an EWMA control chart in the first and a cause-selecting control chart in the second step to monitor small shifts in the process mean considering imprecise measurements. Abbasi (2010) examined the performance of the EWMA control chart in the presence of two-component measurement errors due to its immense importance in analytical chemistry and environmental settings. He found that taking multiple measurements at each sample point reduces the effect of measurement errors. Maravelakis (2012) investigated the effect of measurement errors on the performance of the cumulative sum (CUSUM) control chart to monitor the process mean. He showed that the CUSUM control chart is greatly affected when the measurement errors exist. Hu et al. (2015) studied the performance of the synthetic control chart when measurement errors exist using a linearly covariate error model. They showed that the performance of the synthetic control chart is significantly decreased in the presence of measurement errors. They also investigated the effect of taking multiple measurements for each item in a subgroup on the performance of synthetic control chart. Abbasi (2015) investigated the performance of the EWMA control chart in the presence of two-component measurement errors where the levels of two-component model parameters can vary. He also presented a cost function analysis to determine the optimal number of multiple measurements and the sample size for reducing the effect of two-component measurement errors. Khati Dizabadi et al. (2016) studied the effect of measurement errors on the performance of maximum exponentially weighted moving average and mean-squared deviation (MAX-EWMAMS) control chart when the variance of error term increases linearly with the process mean. Ghashghaei et al. (2016) investigated the effect of imprecise measurements on the performance of the ELR control chart (obtained by incorporating EWMA procedure into GLR statistic) when simple random sampling (SRS) and ranked set sampling (RSS) procedures are used.
The measurement errors exist in all statistical monitoring applications even with highly sophisticated advanced measuring instruments. For instance, in a production line filling bottles, it is impossible to obtain the exact volume of the liquid inside the bottles. In a mass-spectrometry analysis in analytical laboratories, measurement errors usually occur in the generation and measurement of peak area. In medical applications, the measurements of blood pressure by an analogue machine may not always give exact readings. Since the measurement errors affect both the rate of false alarms and the detecting performance of different control charts, it should be noticed to interpret different control charts. To the best of our knowledge, most researches concerning the effect of measurements errors on control charts are devoted to the univariate monitoring schemes and only few ones have studied such effects on the multivariate control charts. On the other hand, several works are available in the literature concerning the simultaneously monitoring of multivariate process mean and variability. However, simultaneous monitoring of mean vector and covariance matrix of multivariate processes in the presence of measurement errors has been neglected in the literature. Due to the impact of measurement errors on monitoring schemes as well as to fill the mentioned research gap, in this paper we simultaneously monitor the mean vector and the covariance matrix of multivariate normal processes in the case of imprecise measurement. Then, we suggest four remedial approaches to decrease the misleading effects of measurement errors on the performance of the monitoring scheme considered for simultaneous monitoring of the mean vector and the covariance matrix. We also highlight the motivation of our work by a real data example.
The structure for the rest of this paper is organized as follows: In the next section, we express measurement errors model assumptions. Then, we explain the ELR control chart by considering the measurement errors. The proposed remedial methods for reducing the measurement errors effects on the performance of the multivariate ELR control chart are discussed, and the effect of measurement errors on the performance of multivariate ELR control chart under different out-of-control scenarios is investigated through simulation studies. A comparison analysis of the proposed remedial methods is provided through an illustrative example, and application of the proposed control chart as well as the remedial methods is illustrated through a real data example. Finally, our concluding remarks and a recommendation for future research are given.
Measurement error model and assumptions
Consider a p-dimensional multivariate normal process in which the quality of a product is expressed as follows:
where is the jth; observation in the ith, subgroup corresponding to the qth; quality characteristic. Let and denote the mean vector and covariance matrix of the original quality characteristics, respectively. Due to the measurement errors in real process control applications, we cannot observe the original quality characteristics of interest. Consequently, in such situations, we have covariates that are linearly correlated to the original quality characteristics. The covariate model considered in this paper corresponding to the ith subgroup is calculated according to Equation (2):
where A is a p×1 vector of constants and B is an invertible p×p matrix, which contains the coefficients of the original quality characteristics in the covariate model. In order to simplify the model, the matrix B is considered a diagonal matrix. In Equation (2), is a p×1 normal random vector with the mean vector of 0 and covariance matrix of .We also assume that the values of error terms () are independent from the original quality characteristics ().
Obviously, the obtained p-dimensional vector of covariates follows multivariate normal distribution with mean vector of and covariance matrix of .
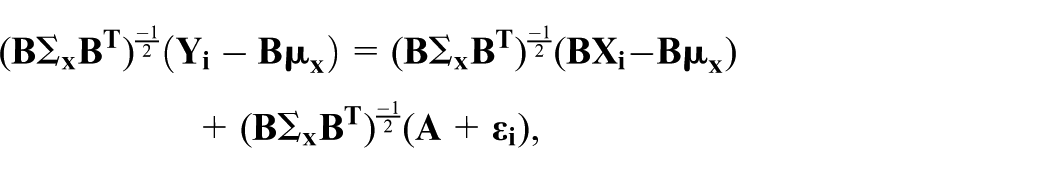
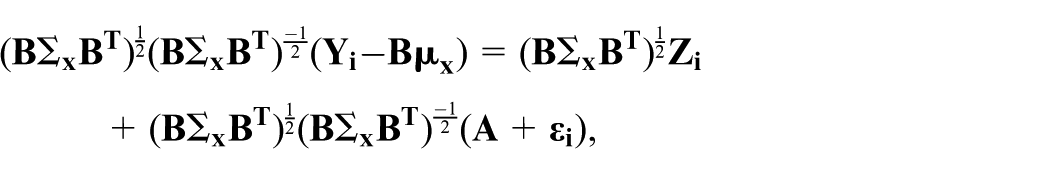
In order to derive the relationship between and standardized normal random variable we have:
then
Multiplying the in both sides of Equation (4), the following equation is obtained:
Finally, we have
Under the assumption of A=0 and B equals a p×p identity matrix, the following equation is obtained:
Recall that this paper is presented in Phase II. Hence, the process parameters, including the mean vector and covariance matrix of original quality characteristics and errors, as well as the constant values, are known, based on the Phase I analysis.
ELR control chart considering measurement errors
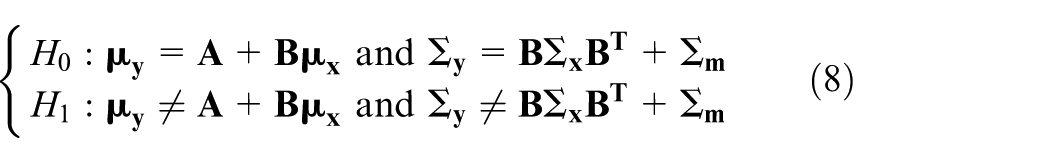
Let represent the ith sample of size n drawn from the process in the existence of measurement error. Also we assume that the random vectors are independent, both within a given sample and between samples. Let and be the ith sample mean vector and sample covariance matrix, respectively. Next, consider the following hypothesis test:
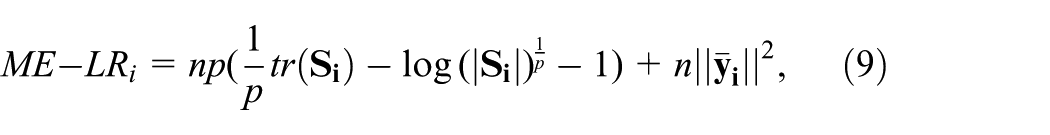
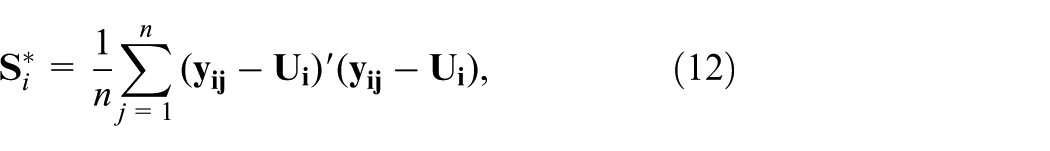
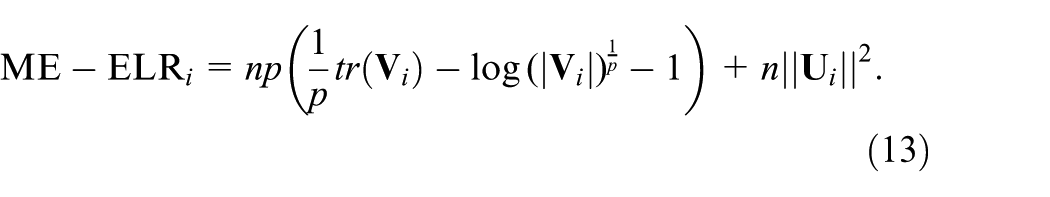
The GLR statistic corresponding to ith subgroup in the existence of measurement error (we call it ME-LRi statistic) is computed as follows:
where is the trace operator that computes the sum of diagonal elements in a given square matrix, |.| is the matrix determinant value and ||.|| represents the Euclidean distance of a given vector. It can be easily statistically proved that if then approximately follows chi-square distribution with degrees of freedom. The large value of corresponding to ith sample taken can lead to rejection of the null hypothesis.
Zhang et al. (2010) used the EWMA procedure in construction of likelihood ratio (LR) statistic and proposed the ELR control chart to increase the sensitivity of this control scheme in detecting small or moderate shifts. In this paper, we incorporate the measurement errors concept into multivariate ELR control chart and propose the ME-ELR control chart for simultaneous monitoring of mean vector and covariance matrix of multivariate processes. The proposed hybrid multivariate simultaneous monitoring scheme uses two EWMA statistics including and . The first statistic is computed based on the sample mean vector according to Equation (10), whereas the second one is computed based on the sample covariance matrix according to Equation (11):
where denotes the smoothing parameter. In comparison with large values of , using the small values of this parameter can improve the performance of the proposed control chart in detecting small and moderate shifts. It is usual that the smoothing parameter to be considered in the range of . Finally, the following equation is resulted and suggested for simultaneous monitoring of the mean vector and covariance matrix in a given multivariate process in the existence of measurement errors: (denoted the ME-ELR statistic):
Note that, the terms consider changes of the process mean and contribute to the variance changes. The performance of the proposed methodology is studied in terms of average run length (ARL) criterion considering different values of parameters , n, p and under different shifts in the mean vector and the covariance matrix .
Proposed remedial methods
Considering all simulation results in the presented examples, it is proved that the measurement errors have undesirable effects on the performance of the proposed ME-ELR control chart in detecting different out-of-control conditions. On the other hand, in almost all production environments, the existents of the measurement errors is unavoidable. In order to overcome this misleading effect, four remedial methods are proposed in this section to decrease the effects of the measurement errors.
Increasing sample size
In the first method, we decrease the undesirable effects of measurement errors by using larger sample sizes. We show through simulation studies that increasing the sample size can decrease the effect of measurement error on the performance of the control chart and consequently improves its performance in detecting different shifts in terms of average run length criterion.
Omitting outliers using interquartile range method
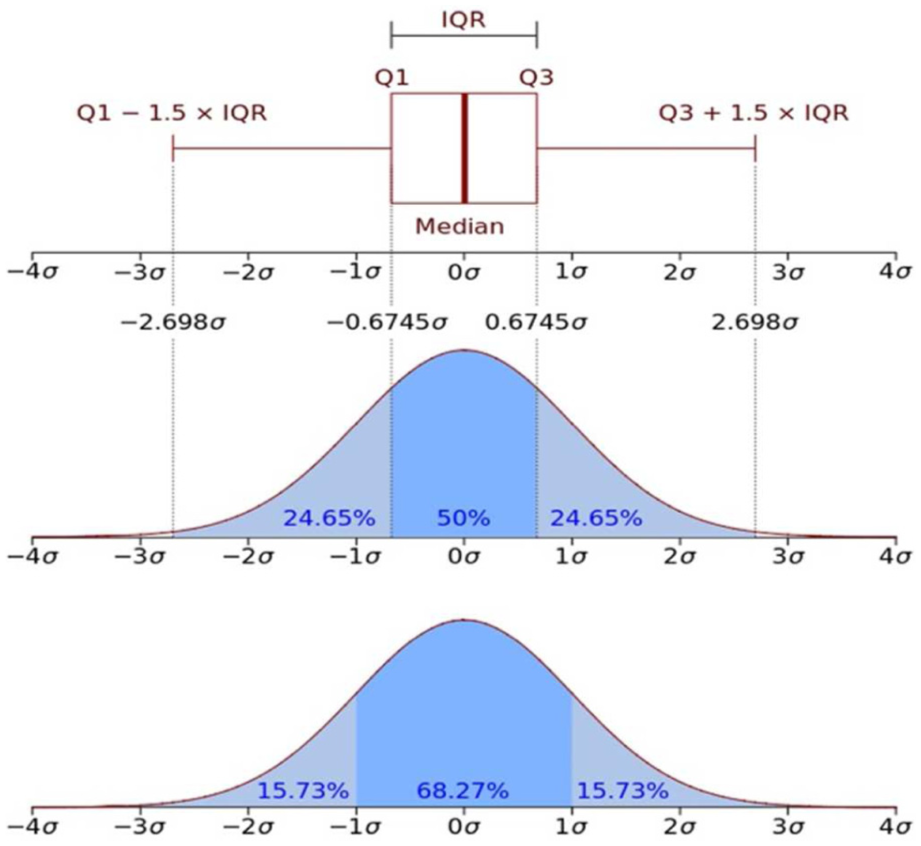
Another method that is suggested for reducing the effect of errors is using the box plot method provided by Tukey (1977). In this method, we eliminate the outlier data that are outside the specified range, which is calculated based on the interquartile range (IQR) method. In descriptive statistics, the IQR is called mid-spread or middle 50. IQR is a measure of statistical dispersion, which is equal to the difference between the upper and lower quartiles, i.e. . In other words, the IQR criterion is the first quartile subtracted from the third quartile. These quartiles can be clearly seen on a box plot in the given data. It is a trimmed estimator, which defined as the 25% trimmed mid-range, and it is the most significant basic robust measure of scale. The IQR is the length of the box in the box plot. An outlier is any value that lays more than one and a half times the length of the box from either end of the box. That is, if a data point is less than () or greater than (), it is viewed as being too far from the central values to be reasonable. Figure 1 shows a schematic view of the IQR approach.
Boxplot and a probability density function (pdf) of a normal population.
Omitting outliers using the IQR/√n method
Another method for decreasing the effect of errors is dividing IQR by square root of the sample size, i.e. IQR/√n, which was first introduced by Chambers et al. (1983).We used this method to eliminate data that fall outside the range of [), ].
Multiple measurements
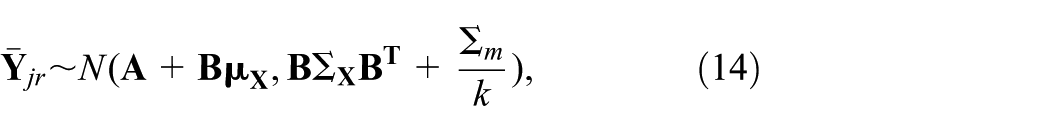
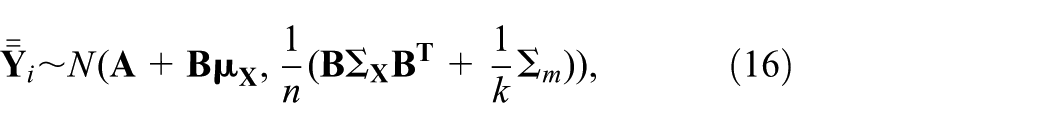
Linna and Woodall (2001) suggested a multiple measurements method, which is also implemented by Maravelakis (2012) and Haq et al. (2015) to reduce the effect of measurement errors. Taking several measurements and averaging the obtained values lead to a more precise measurement. Moreover, the variance of the measurement error component in the average of the multiple observations becomes smaller as the number of multiple measurements increases. Therefore, ideally if the number of multiple measurements becomes infinite, the variance of the measurement errors component will approach zero. Although the larger number of multiple measurements leads to reducing the effect of measurement errors, the additional cost and time is needed for these observations. We consider the covariate model , for and . Here, for each , k measurements are taken, where k is a positive integer. For given values of j and r:
where
Then, for
where .
Performance evaluation of the proposed ME-ELR control chart
In this section, we present two numerical examples in order to explain the effect of measurement errors on the performance of the multivariate ELR control chart. In all simulation experiments, we adjust the upper control limit (UCL) of the proposed control chart such that the in-control ARL (ARL0) is roughly equal to 200. Then, out-of-control scenarios including mean shifts and variance shifts, as well as simultaneous shifts under different error variances in terms of out-of-control ARL (ARL1) criterion are considered. The UCL values determined based on simulation experiments are shown in the first row of each table. The second and third row of each table is devoted to the standard deviation of the error terms and ARL0 value, respectively. The ARL1 values obtained under separate shifts in the mean vector and covariance matrix of the process are summarized in rows 4–7 and 8–11, respectively. Finally, the rows 12–23 of each table are devoted to the ARL1 values obtained under simultaneous shifts in the mean vector and covariance matrix of the process. Note that without loss of generality, and are considered in all simulation studies.
Example 1
Consider a bivariate normal process where the correlation coefficient between variables is considered equal to . The in-control mean vector and the covariance matrix of the original data are equal to and , respectively. The covariance matrix of the two component errors is considered equal to . Consequently, , and .
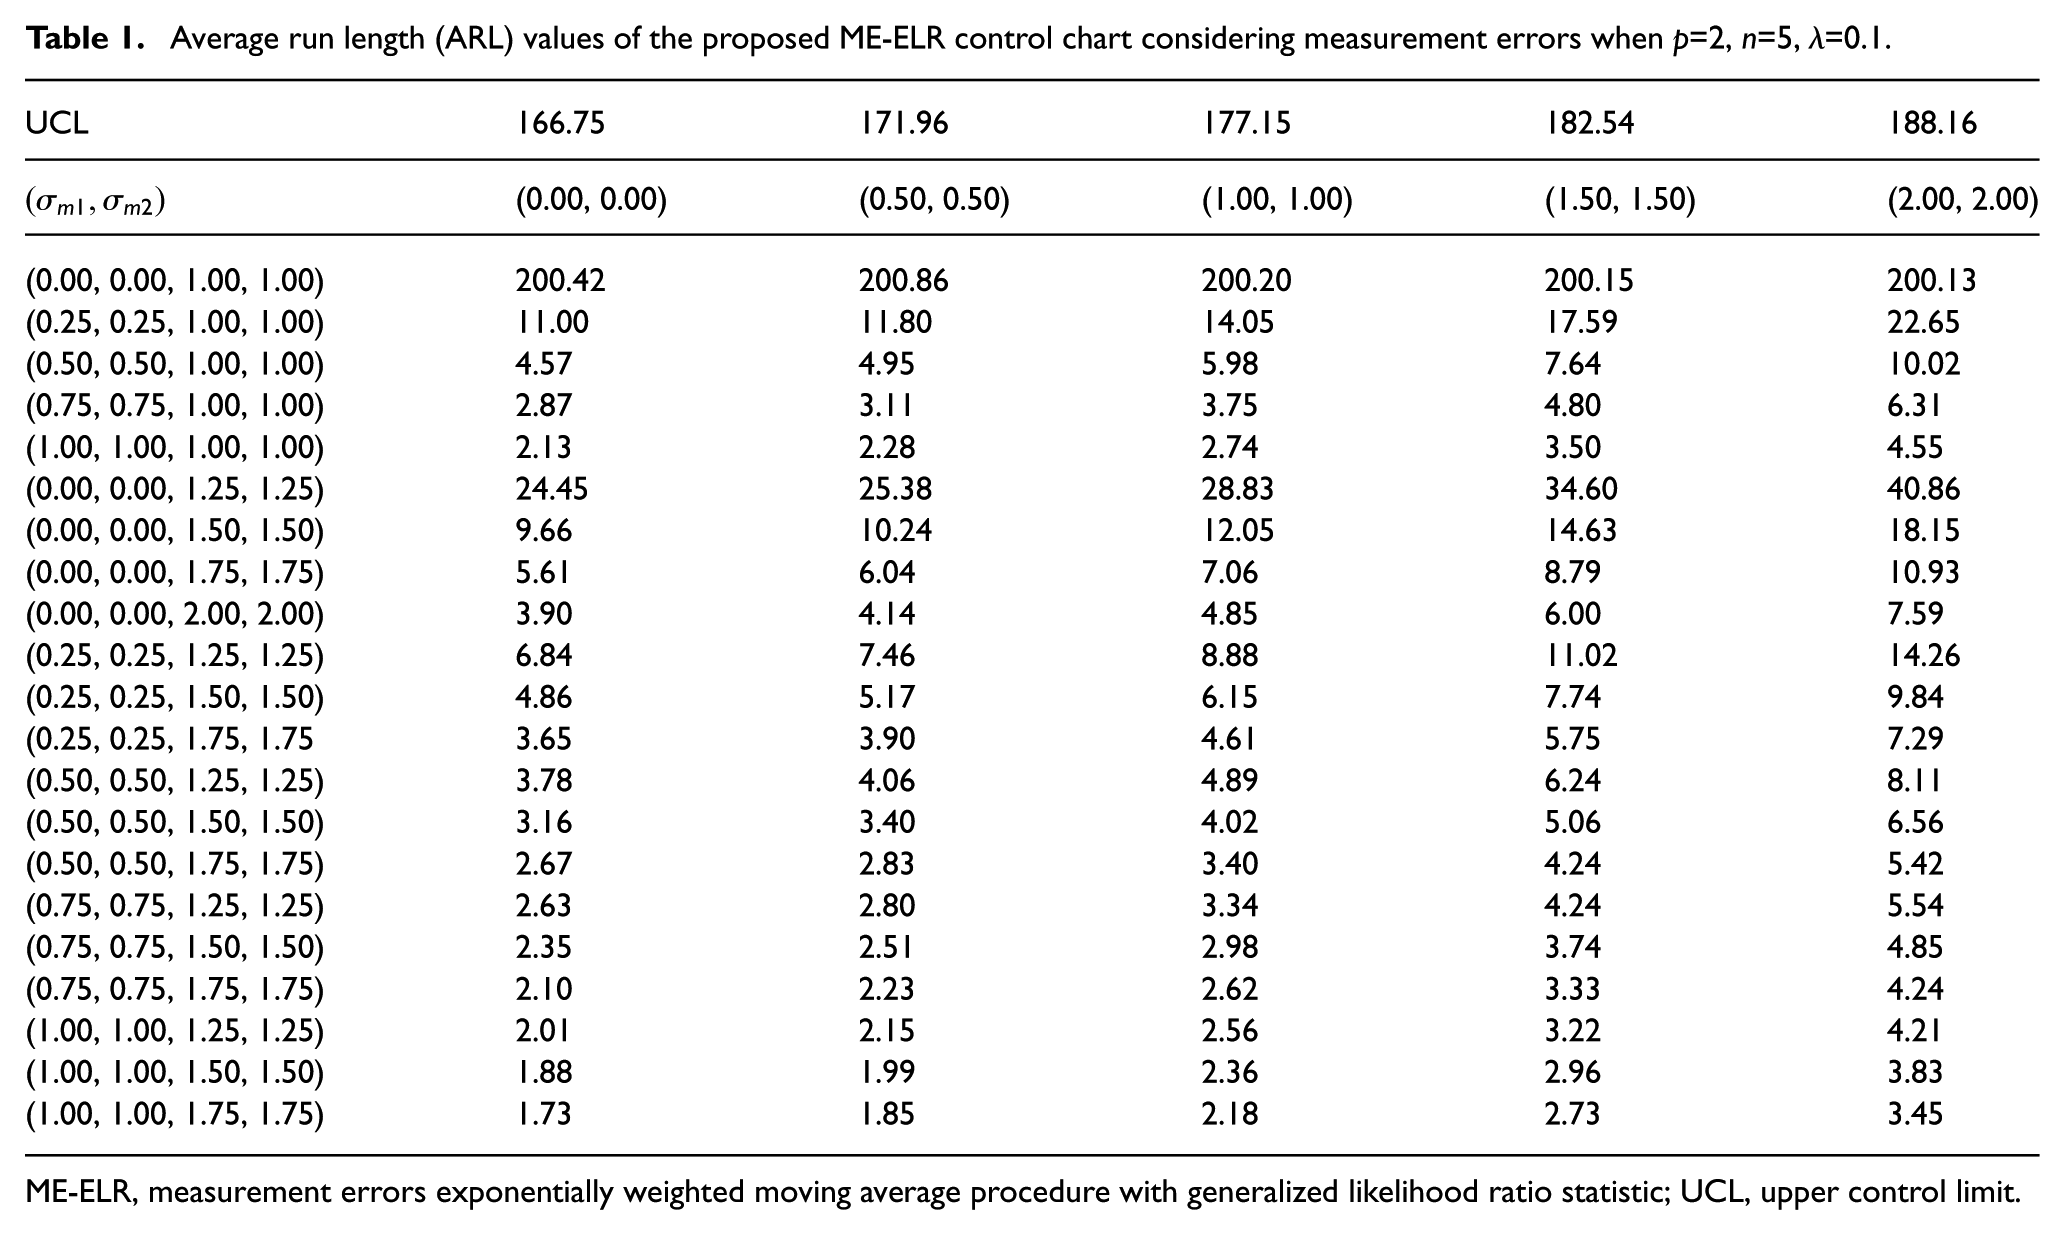
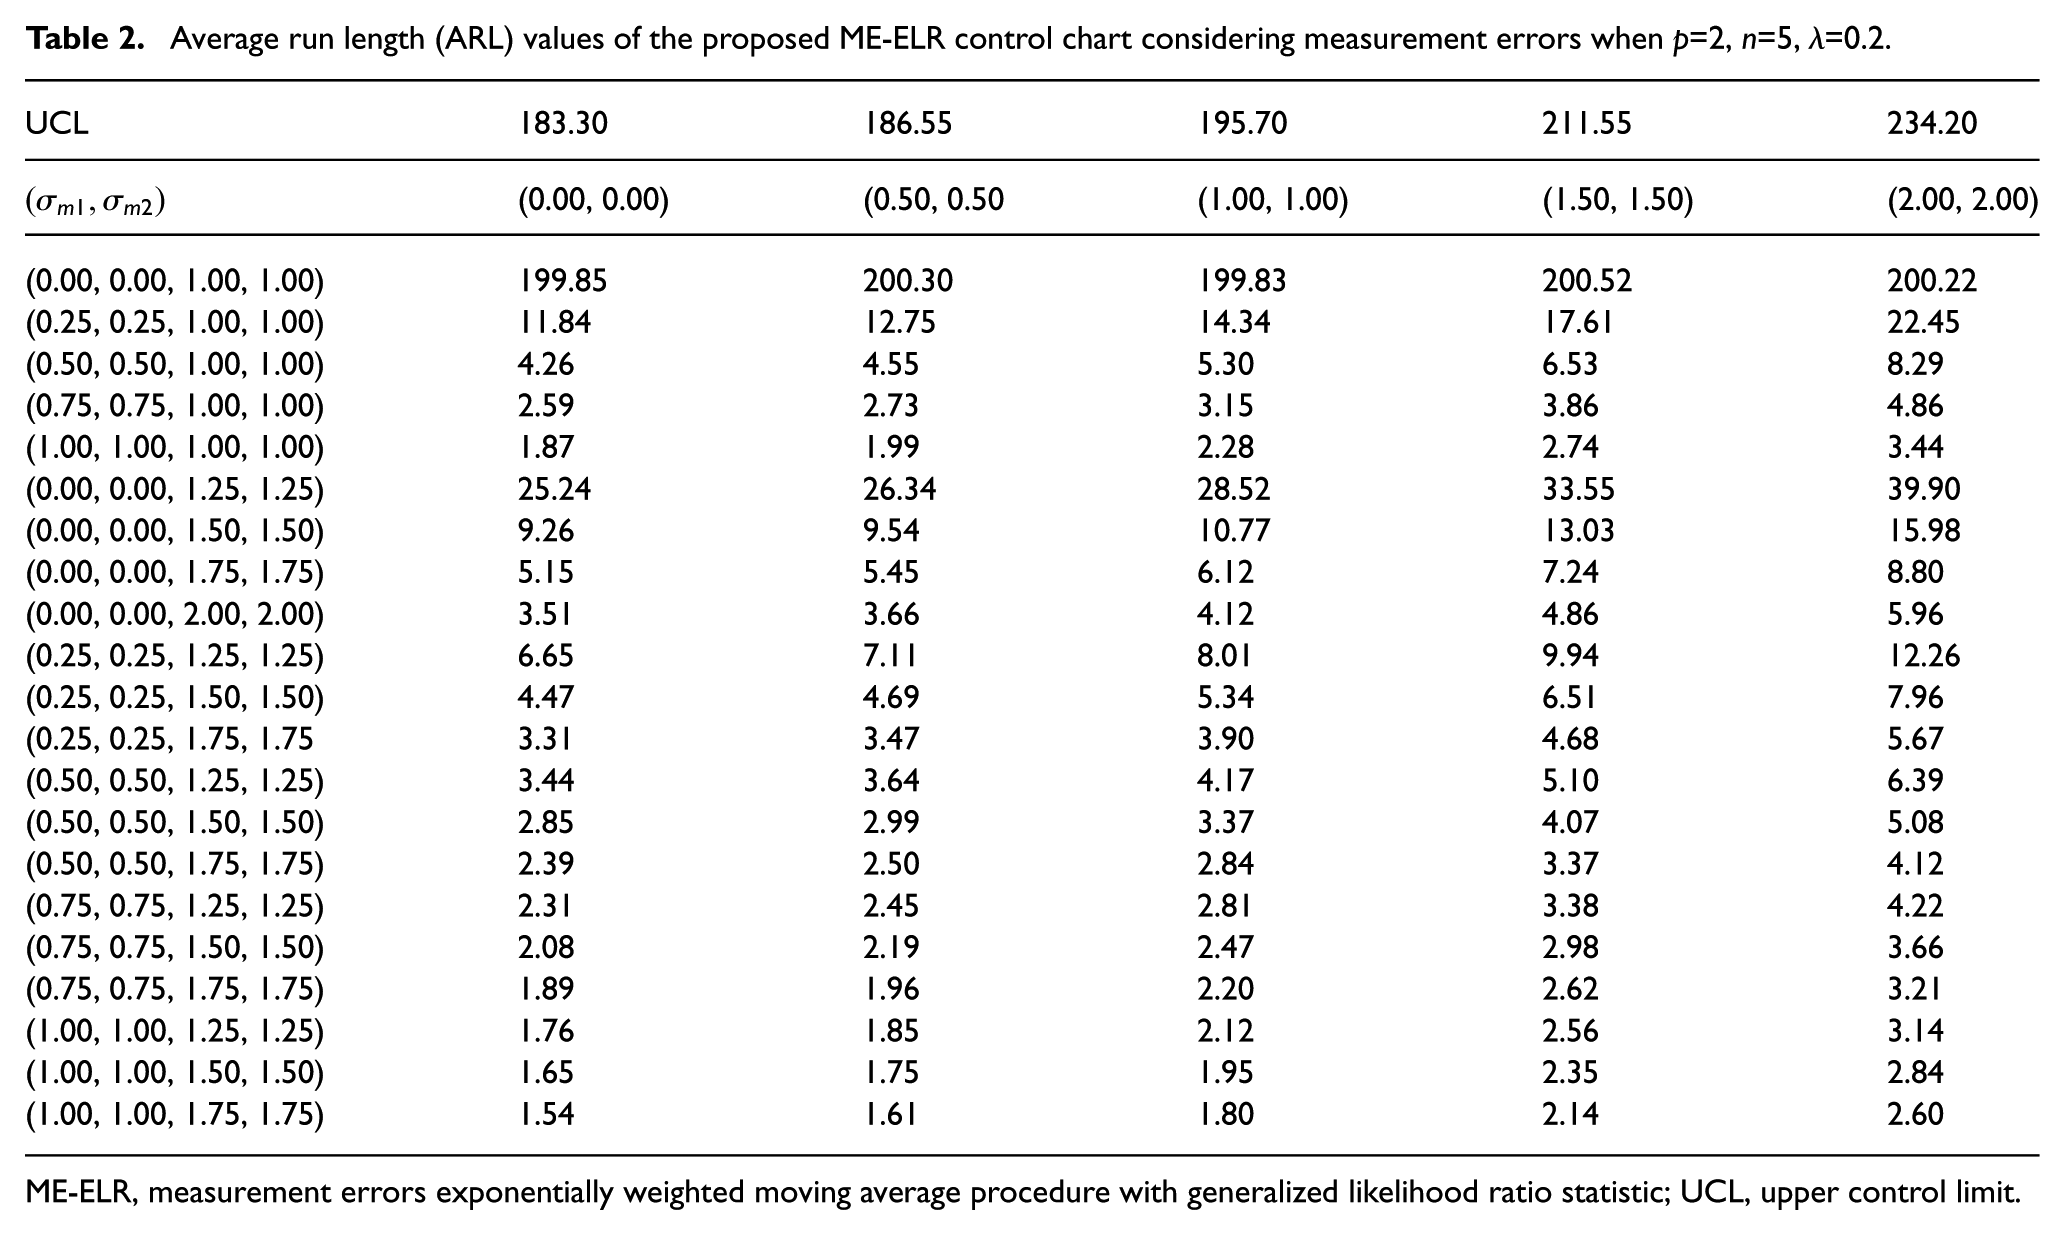
We denote the out-of-control shifts by the vector of in the first column of Tables 1 and 2. and are the magnitude of the mean shifts in the units of and in the first and second quality characteristics, respectively. In addition, and are the values of the standard deviation of quality characteristics after occurring shifts. Obviously, the vector shows that no shift in both the mean vector and covariance matrix of the process has occurred. The results of simulation experiments based on 10,000 replicates are summarized in Tables 1 and 2. Table 1 tabulates the simulation results when p=2, n=5 and . The results when p=2, n=5 and are also summarized in Table 2. Tables 1 and 2 show that for all mean, variance and simultaneous shifts, the ARL1 values increase when the variance of errors increases. In other words, under different out-of-control scenarios, as the variance of errors increases, the detecting performance of the proposed control chart decreases. In most shifts in the mean vector, increasing the parameter of from 0.1 to 0.2 can improve the performance of the proposed ME-ELR control chart in covering the effect of measurement errors. In the case of variance shifts, increasing also leads to smaller ARL1 values. As the magnitude of mean and variance shifts increase, the effect of increasing in improving the performance of the proposed ME-ELR control chart is more significant. Comparing the results of Tables 1 and 2, it is observed that applying leads to a more satisfactory performance of the control chart in detecting all simultaneous changes in the mean vector and covariance matrix of the process.
Average run length (ARL) values of the proposed ME-ELR control chart considering measurement errors when p=2, n=5, λ=0.1.
UCL
166.75
171.96
177.15
182.54
188.16
(0.00, 0.00)
(0.50, 0.50)
(1.00, 1.00)
(1.50, 1.50)
(2.00, 2.00)
(0.00, 0.00, 1.00, 1.00)
200.42
200.86
200.20
200.15
200.13
(0.25, 0.25, 1.00, 1.00)
11.00
11.80
14.05
17.59
22.65
(0.50, 0.50, 1.00, 1.00)
4.57
4.95
5.98
7.64
10.02
(0.75, 0.75, 1.00, 1.00)
2.87
3.11
3.75
4.80
6.31
(1.00, 1.00, 1.00, 1.00)
2.13
2.28
2.74
3.50
4.55
(0.00, 0.00, 1.25, 1.25)
24.45
25.38
28.83
34.60
40.86
(0.00, 0.00, 1.50, 1.50)
9.66
10.24
12.05
14.63
18.15
(0.00, 0.00, 1.75, 1.75)
5.61
6.04
7.06
8.79
10.93
(0.00, 0.00, 2.00, 2.00)
3.90
4.14
4.85
6.00
7.59
(0.25, 0.25, 1.25, 1.25)
6.84
7.46
8.88
11.02
14.26
(0.25, 0.25, 1.50, 1.50)
4.86
5.17
6.15
7.74
9.84
(0.25, 0.25, 1.75, 1.75
3.65
3.90
4.61
5.75
7.29
(0.50, 0.50, 1.25, 1.25)
3.78
4.06
4.89
6.24
8.11
(0.50, 0.50, 1.50, 1.50)
3.16
3.40
4.02
5.06
6.56
(0.50, 0.50, 1.75, 1.75)
2.67
2.83
3.40
4.24
5.42
(0.75, 0.75, 1.25, 1.25)
2.63
2.80
3.34
4.24
5.54
(0.75, 0.75, 1.50, 1.50)
2.35
2.51
2.98
3.74
4.85
(0.75, 0.75, 1.75, 1.75)
2.10
2.23
2.62
3.33
4.24
(1.00, 1.00, 1.25, 1.25)
2.01
2.15
2.56
3.22
4.21
(1.00, 1.00, 1.50, 1.50)
1.88
1.99
2.36
2.96
3.83
(1.00, 1.00, 1.75, 1.75)
1.73
1.85
2.18
2.73
3.45
ME-ELR, measurement errors exponentially weighted moving average procedure with generalized likelihood ratio statistic; UCL, upper control limit.
Average run length (ARL) values of the proposed ME-ELR control chart considering measurement errors when p=2, n=5, λ=0.2.
UCL
183.30
186.55
195.70
211.55
234.20
(0.00, 0.00)
(0.50, 0.50
(1.00, 1.00)
(1.50, 1.50)
(2.00, 2.00)
(0.00, 0.00, 1.00, 1.00)
199.85
200.30
199.83
200.52
200.22
(0.25, 0.25, 1.00, 1.00)
11.84
12.75
14.34
17.61
22.45
(0.50, 0.50, 1.00, 1.00)
4.26
4.55
5.30
6.53
8.29
(0.75, 0.75, 1.00, 1.00)
2.59
2.73
3.15
3.86
4.86
(1.00, 1.00, 1.00, 1.00)
1.87
1.99
2.28
2.74
3.44
(0.00, 0.00, 1.25, 1.25)
25.24
26.34
28.52
33.55
39.90
(0.00, 0.00, 1.50, 1.50)
9.26
9.54
10.77
13.03
15.98
(0.00, 0.00, 1.75, 1.75)
5.15
5.45
6.12
7.24
8.80
(0.00, 0.00, 2.00, 2.00)
3.51
3.66
4.12
4.86
5.96
(0.25, 0.25, 1.25, 1.25)
6.65
7.11
8.01
9.94
12.26
(0.25, 0.25, 1.50, 1.50)
4.47
4.69
5.34
6.51
7.96
(0.25, 0.25, 1.75, 1.75
3.31
3.47
3.90
4.68
5.67
(0.50, 0.50, 1.25, 1.25)
3.44
3.64
4.17
5.10
6.39
(0.50, 0.50, 1.50, 1.50)
2.85
2.99
3.37
4.07
5.08
(0.50, 0.50, 1.75, 1.75)
2.39
2.50
2.84
3.37
4.12
(0.75, 0.75, 1.25, 1.25)
2.31
2.45
2.81
3.38
4.22
(0.75, 0.75, 1.50, 1.50)
2.08
2.19
2.47
2.98
3.66
(0.75, 0.75, 1.75, 1.75)
1.89
1.96
2.20
2.62
3.21
(1.00, 1.00, 1.25, 1.25)
1.76
1.85
2.12
2.56
3.14
(1.00, 1.00, 1.50, 1.50)
1.65
1.75
1.95
2.35
2.84
(1.00, 1.00, 1.75, 1.75)
1.54
1.61
1.80
2.14
2.60
ME-ELR, measurement errors exponentially weighted moving average procedure with generalized likelihood ratio statistic; UCL, upper control limit.
Example 2
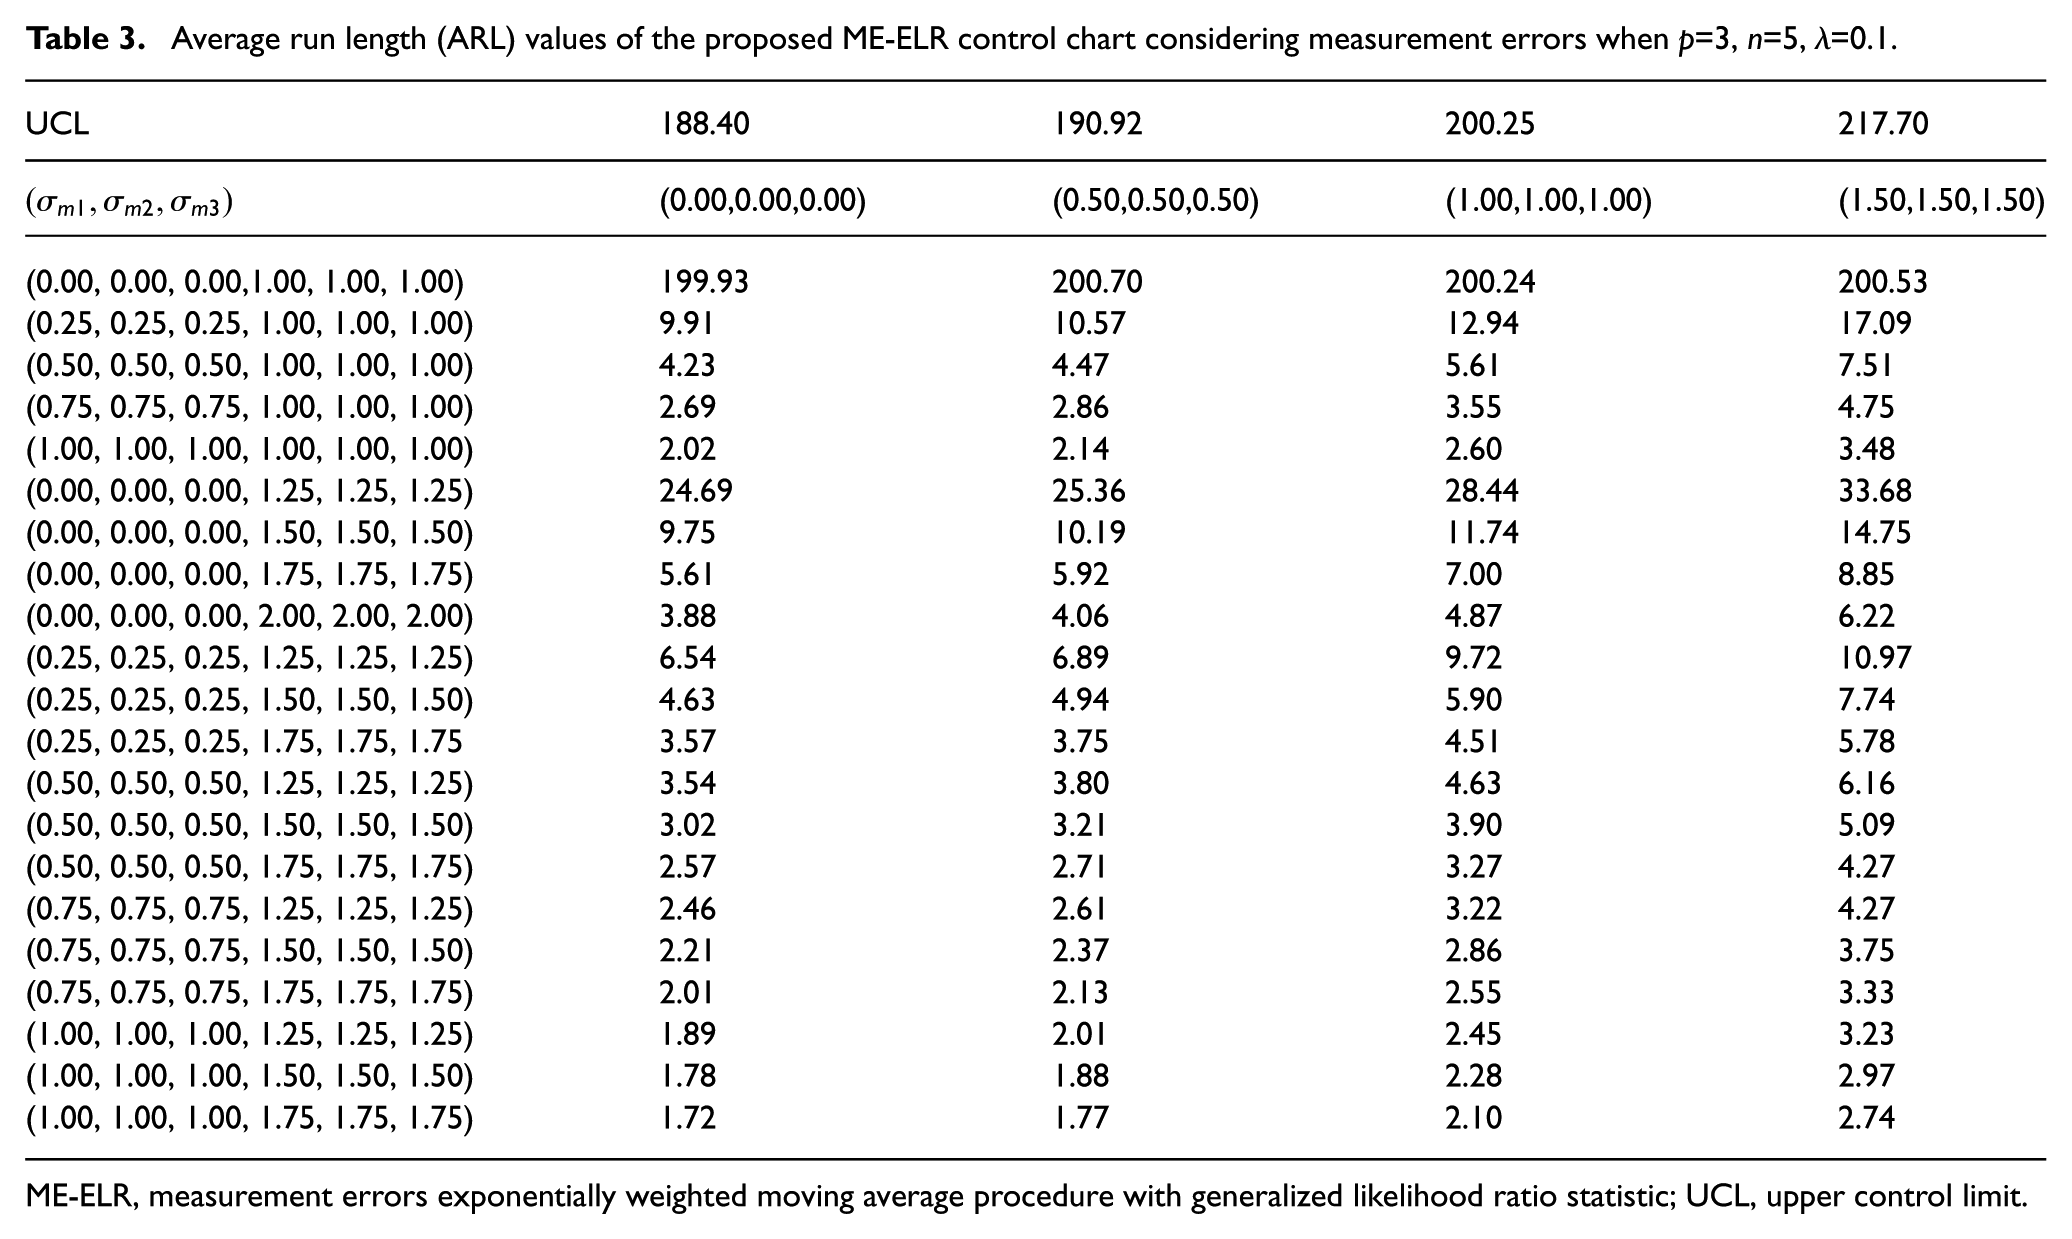
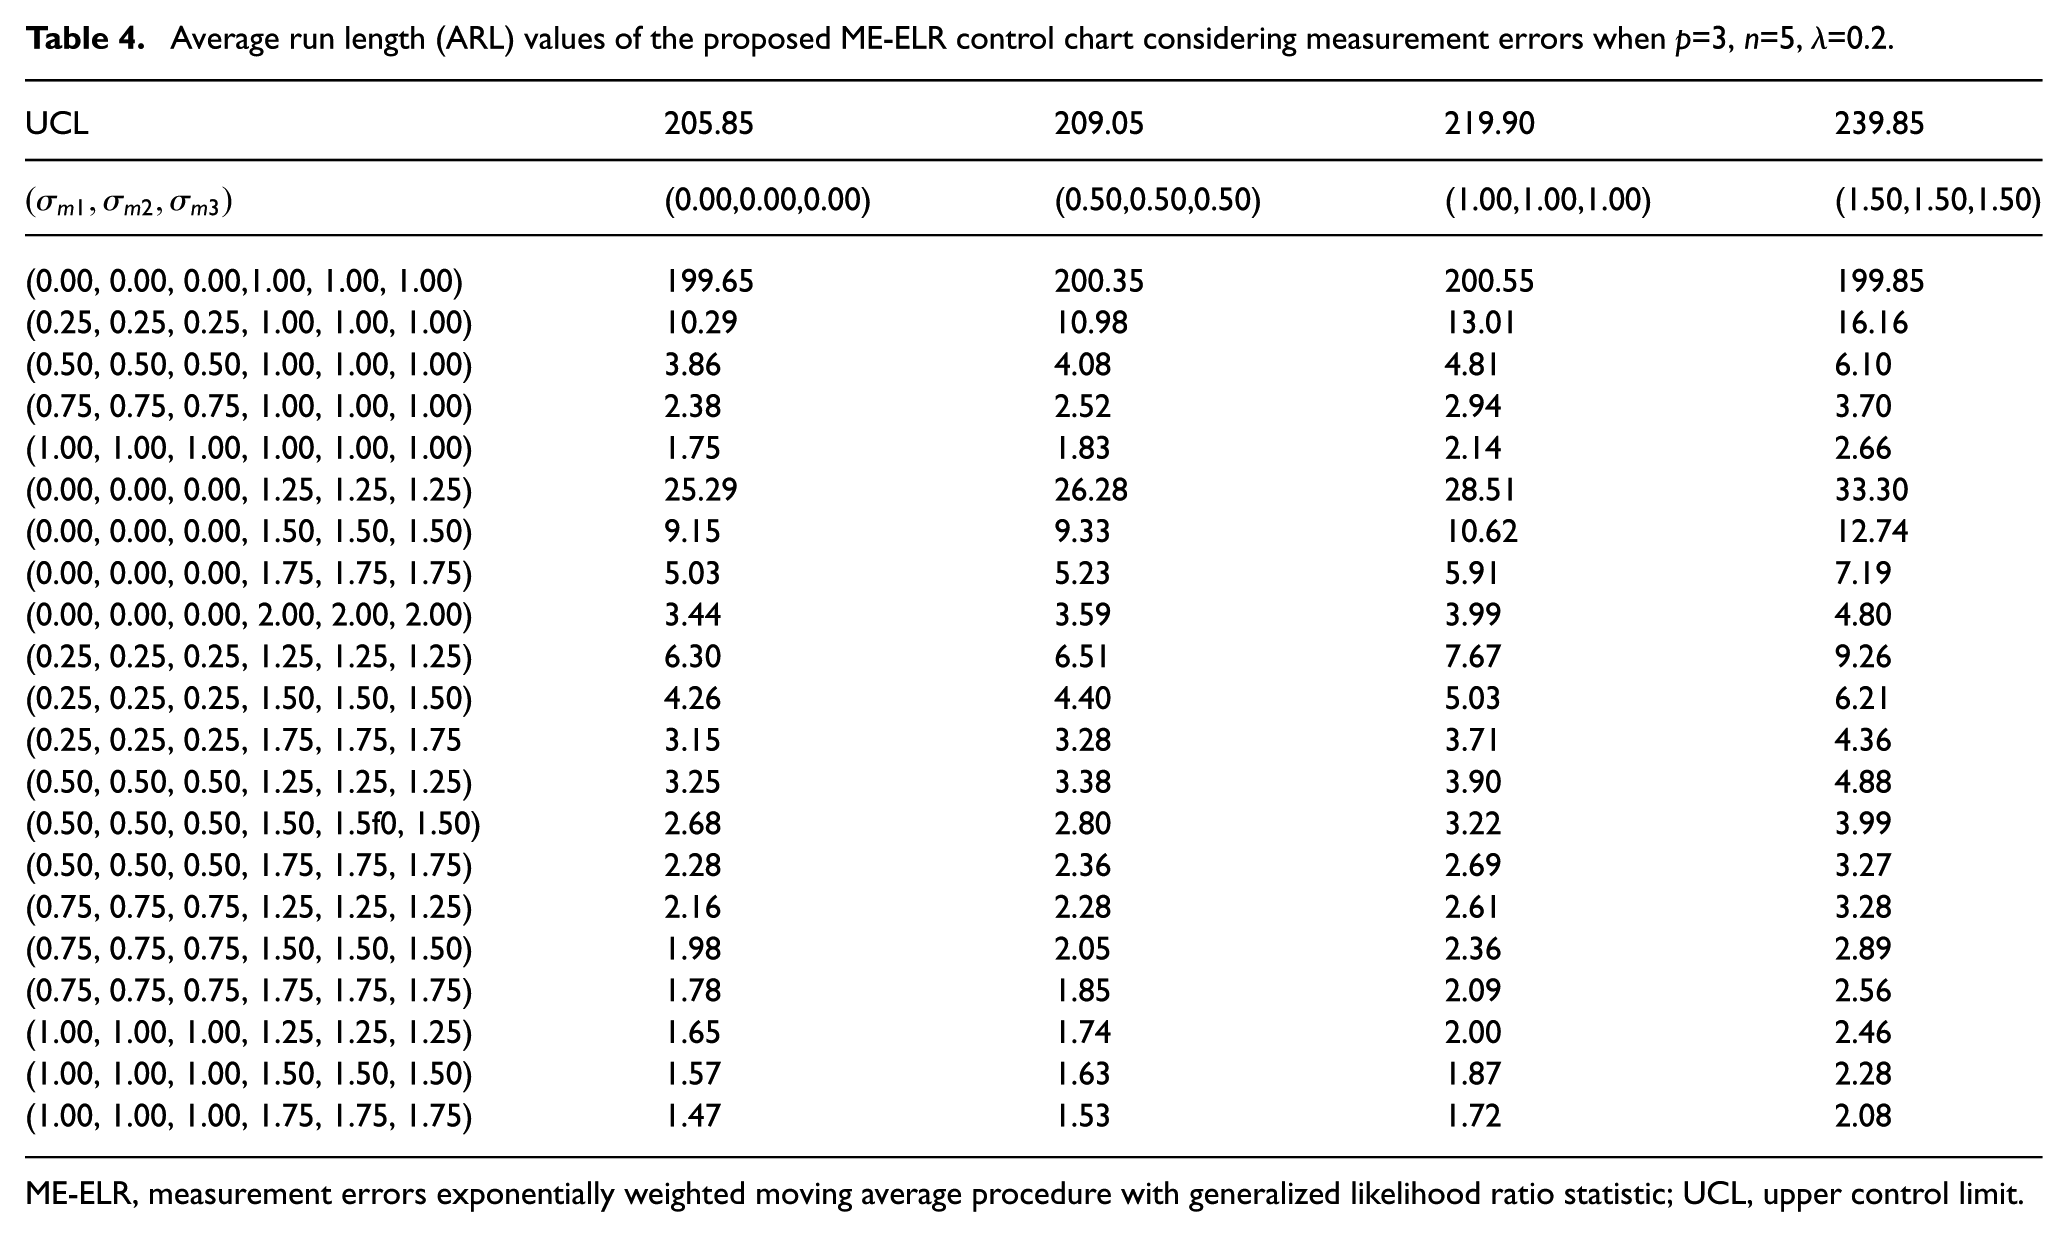
Consider a three-dimentional normal process where the correlation coefficients of , and exist between the quality characteristics. Recall that represents the correlation coefficient between ith and jth quality characteristics considered in this example. Similarly to Example 1, the random samples of size n=5 and the smoothing coefficient of and are used to simulate data. The in-control mean vector and covariance matrix are supposed to be equal to and , respectively. The covariance matrix is supposed to exist among the measurement errors terms. The simulation experiments are conducted in 10,000 replicates and the results are given in Tables 3 and 4. The results are obtained in terms of ARL criterion under different scenarios in shifts in process parameters and error terms. Table 3 tabulate the results of the proposed ME-ELR control chart in detecting separate and simultaneous shifts under different variance of error terms when p=3, n=5 and . In Table 4 the parameters are p=3, n=5 and . It is seen the increasing the variance of error terms leads to an undesirable effect on the performance of the ME-ELR control chart in detecting all separate and simultaneous shifts in process mean and variability. Comparing the results of Tables 3 and 4, it is concluded that by increasing , the performance of the ME-ELR control chart in detecting separate shifts in the mean vector and covariance matrix under different variance of measurement error is considerably improved. However, as the magnitude of mean and variance shifts and the variance of measurement errors increases, the recovering performance of the control chart in eliminating the error effect is more considerable. Similarly to numerical Example 1, the larger value of is desirable and leads to smaller values of ARL1.
Average run length (ARL) values of the proposed ME-ELR control chart considering measurement errors when p=3, n=5, λ=0.1.
UCL
188.40
190.92
200.25
217.70
(0.00,0.00,0.00)
(0.50,0.50,0.50)
(1.00,1.00,1.00)
(1.50,1.50,1.50)
(0.00, 0.00, 0.00,1.00, 1.00, 1.00)
199.93
200.70
200.24
200.53
(0.25, 0.25, 0.25, 1.00, 1.00, 1.00)
9.91
10.57
12.94
17.09
(0.50, 0.50, 0.50, 1.00, 1.00, 1.00)
4.23
4.47
5.61
7.51
(0.75, 0.75, 0.75, 1.00, 1.00, 1.00)
2.69
2.86
3.55
4.75
(1.00, 1.00, 1.00, 1.00, 1.00, 1.00)
2.02
2.14
2.60
3.48
(0.00, 0.00, 0.00, 1.25, 1.25, 1.25)
24.69
25.36
28.44
33.68
(0.00, 0.00, 0.00, 1.50, 1.50, 1.50)
9.75
10.19
11.74
14.75
(0.00, 0.00, 0.00, 1.75, 1.75, 1.75)
5.61
5.92
7.00
8.85
(0.00, 0.00, 0.00, 2.00, 2.00, 2.00)
3.88
4.06
4.87
6.22
(0.25, 0.25, 0.25, 1.25, 1.25, 1.25)
6.54
6.89
9.72
10.97
(0.25, 0.25, 0.25, 1.50, 1.50, 1.50)
4.63
4.94
5.90
7.74
(0.25, 0.25, 0.25, 1.75, 1.75, 1.75
3.57
3.75
4.51
5.78
(0.50, 0.50, 0.50, 1.25, 1.25, 1.25)
3.54
3.80
4.63
6.16
(0.50, 0.50, 0.50, 1.50, 1.50, 1.50)
3.02
3.21
3.90
5.09
(0.50, 0.50, 0.50, 1.75, 1.75, 1.75)
2.57
2.71
3.27
4.27
(0.75, 0.75, 0.75, 1.25, 1.25, 1.25)
2.46
2.61
3.22
4.27
(0.75, 0.75, 0.75, 1.50, 1.50, 1.50)
2.21
2.37
2.86
3.75
(0.75, 0.75, 0.75, 1.75, 1.75, 1.75)
2.01
2.13
2.55
3.33
(1.00, 1.00, 1.00, 1.25, 1.25, 1.25)
1.89
2.01
2.45
3.23
(1.00, 1.00, 1.00, 1.50, 1.50, 1.50)
1.78
1.88
2.28
2.97
(1.00, 1.00, 1.00, 1.75, 1.75, 1.75)
1.72
1.77
2.10
2.74
ME-ELR, measurement errors exponentially weighted moving average procedure with generalized likelihood ratio statistic; UCL, upper control limit.
Average run length (ARL) values of the proposed ME-ELR control chart considering measurement errors when p=3, n=5, λ=0.2.
UCL
205.85
209.05
219.90
239.85
(0.00,0.00,0.00)
(0.50,0.50,0.50)
(1.00,1.00,1.00)
(1.50,1.50,1.50)
(0.00, 0.00, 0.00,1.00, 1.00, 1.00)
199.65
200.35
200.55
199.85
(0.25, 0.25, 0.25, 1.00, 1.00, 1.00)
10.29
10.98
13.01
16.16
(0.50, 0.50, 0.50, 1.00, 1.00, 1.00)
3.86
4.08
4.81
6.10
(0.75, 0.75, 0.75, 1.00, 1.00, 1.00)
2.38
2.52
2.94
3.70
(1.00, 1.00, 1.00, 1.00, 1.00, 1.00)
1.75
1.83
2.14
2.66
(0.00, 0.00, 0.00, 1.25, 1.25, 1.25)
25.29
26.28
28.51
33.30
(0.00, 0.00, 0.00, 1.50, 1.50, 1.50)
9.15
9.33
10.62
12.74
(0.00, 0.00, 0.00, 1.75, 1.75, 1.75)
5.03
5.23
5.91
7.19
(0.00, 0.00, 0.00, 2.00, 2.00, 2.00)
3.44
3.59
3.99
4.80
(0.25, 0.25, 0.25, 1.25, 1.25, 1.25)
6.30
6.51
7.67
9.26
(0.25, 0.25, 0.25, 1.50, 1.50, 1.50)
4.26
4.40
5.03
6.21
(0.25, 0.25, 0.25, 1.75, 1.75, 1.75
3.15
3.28
3.71
4.36
(0.50, 0.50, 0.50, 1.25, 1.25, 1.25)
3.25
3.38
3.90
4.88
(0.50, 0.50, 0.50, 1.50, 1.5f0, 1.50)
2.68
2.80
3.22
3.99
(0.50, 0.50, 0.50, 1.75, 1.75, 1.75)
2.28
2.36
2.69
3.27
(0.75, 0.75, 0.75, 1.25, 1.25, 1.25)
2.16
2.28
2.61
3.28
(0.75, 0.75, 0.75, 1.50, 1.50, 1.50)
1.98
2.05
2.36
2.89
(0.75, 0.75, 0.75, 1.75, 1.75, 1.75)
1.78
1.85
2.09
2.56
(1.00, 1.00, 1.00, 1.25, 1.25, 1.25)
1.65
1.74
2.00
2.46
(1.00, 1.00, 1.00, 1.50, 1.50, 1.50)
1.57
1.63
1.87
2.28
(1.00, 1.00, 1.00, 1.75, 1.75, 1.75)
1.47
1.53
1.72
2.08
ME-ELR, measurement errors exponentially weighted moving average procedure with generalized likelihood ratio statistic; UCL, upper control limit.
Performance evaluation of the proposed remedial approaches
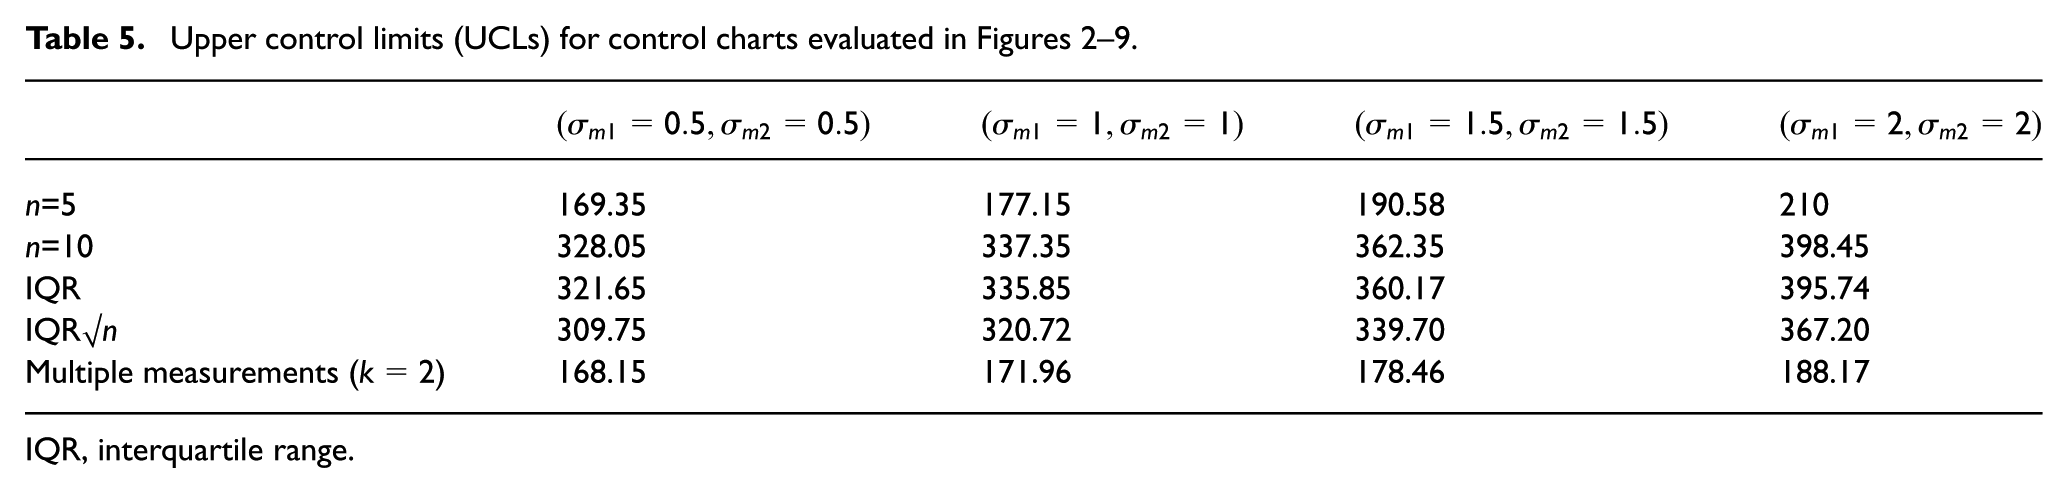
In this section, we conduct a comparison study between the proposed remedial methods using the input data of Example 1 when p=2 and . The shift in the mean of quality characteristics in units of sigma is shown by ( changes to ) and the shift in the standard deviation of quality characteristics is illustrated by ( changes to ). Here, we denote the mean and variance shifts by a single number. For example, the value of 0.5 in the first row of Table 6 shows that the magnitude of mean shift in both quality characteristics is equal to 0.5 units of sigma (). Note that in all of the proposed remedial methods, the sample size is fixed (not variable). In the first remedial method, we use a sample size larger than the initial sample size. Hence, under both large and small sample sizes, the size of samples taken is fixed (not variable). In the second and third remedial methods, the outliers are eliminated and substituted by the new observations. This process continued until all observations in a given sample fall inside the mentioned interval. In the fourth remedial method, each unit is measured several times and then the average value of the measurements is recorded. Consequently, similar to the first remedial method, the sample size in the second, third and fourth remedial methods remains constant and do not change during the process. As a result, the designed control charts are not adaptive and we can use ARL criterion to evaluate the detecting performance of the control charts in all comparison studies. The UCLs of all control charts under remedial approaches are set by simulation studies such that an in-control ARL equal to 200 is obtained. The values of UCLs are reported in Table 5.
Upper control limits (UCLs) for control charts evaluated in Figures 2–9.
n=5
169.35
177.15
190.58
210
n=10
328.05
337.35
362.35
398.45
IQR
321.65
335.85
360.17
395.74
IQR√n
309.75
320.72
339.70
367.20
Multiple measurements ()
168.15
171.96
178.46
188.17
IQR, interquartile range.
Randomized complete block design for the average run length (ARL) values of remedial methods under different magnitudes of mean shift when .
Remedial methods
Magnitude of mean shift (blocks)
0.1
0.2
0.3
0.4
0.5
0.6
0.7
0.8
0.9
1
n=5
43.21
18.44
11.07
7.74
5.94
4.82
4.06
3.50
3.06
2.73
n=10
33.31
12.73
7.82
5.56
4.34
3.58
3.06
2.65
2.36
2.14
IQR
30.51
12.58
7.73
5.48
4.17
3.43
2.90
2.52
2.22
2.10
IQR√n
28.09
10.83
6.39
4.54
3.45
2.83
2.43
2.11
1.88
1.70
Multiple measurements ()
40.99
16.71
9.92
6.90
5.34
4.25
3.55
3.08
2.71
2.45
IQR, interquartile range
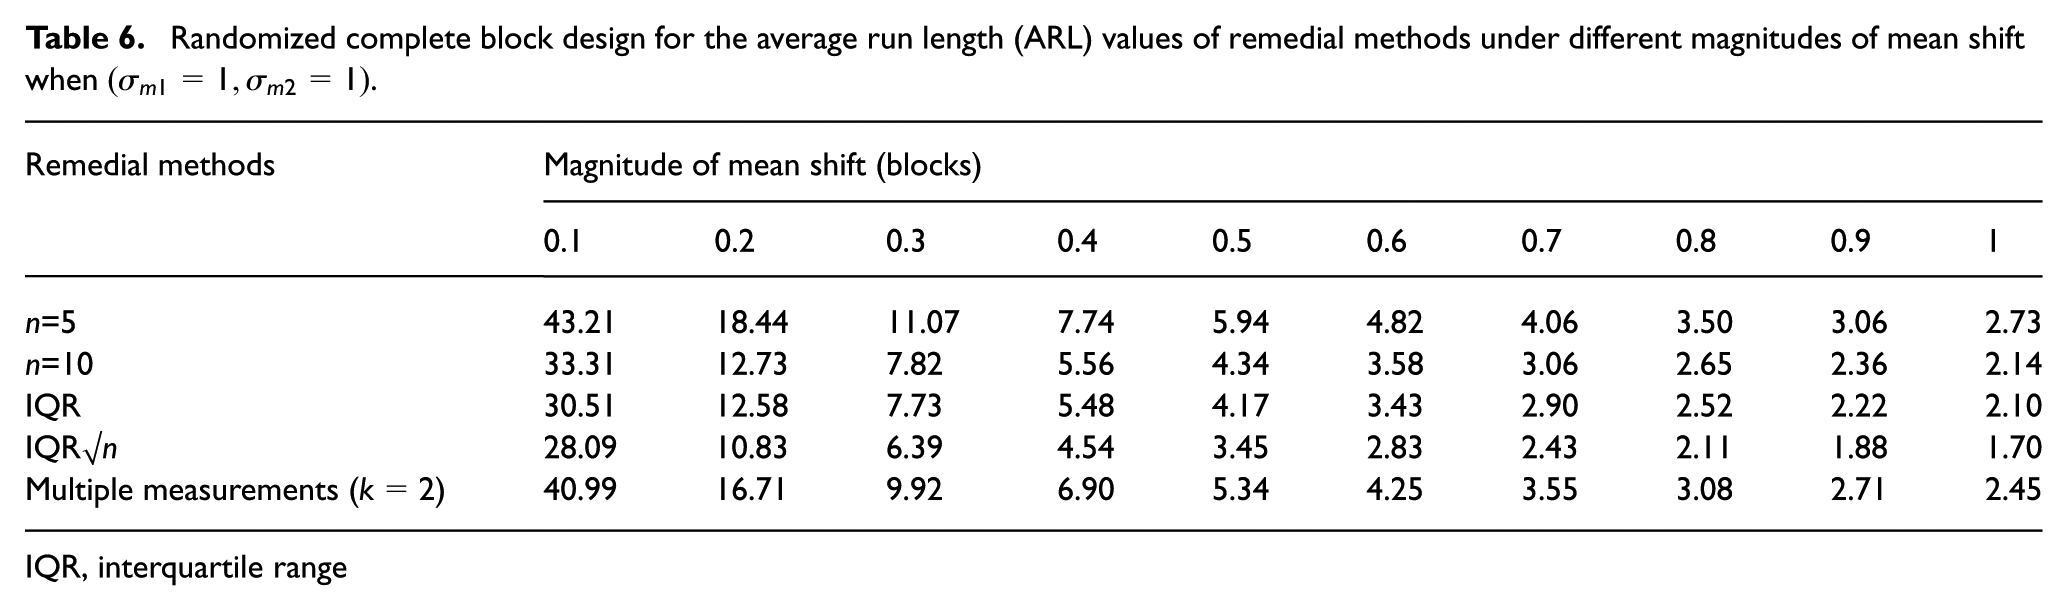
Here, a parametric statistical analysis to investigate the performance of the proposed remedial methods is provided by using the analysis of variance (ANOVA). The out-of-control ARLs for remedial methods under different mean shifts when are shown in Table 6. To apply ANOVA, we consider the remedial methods as the treatments (five levels) and the mean shifts as the blocks (10 levels). The results of ANOVA performed in Minitab software is shown in Table 7. The p-value for the treatments effect (remedial methods) is obtained equal to zero. Hence, selecting leads to the conclusion that there is significance difference among the remedial methods.
Analysis of variance for the remedial methods.
Source of variation
Sum of squares
Degrees of freedom
Mean square
F0
P-value
Treatments (remedial methods)
110.04
4
27.510
7.33
0.00
Blocks (shift values)
4634.83
9
514.981
137.23
0.00
Error
135.09
36
3.753
Total
4879.96
49
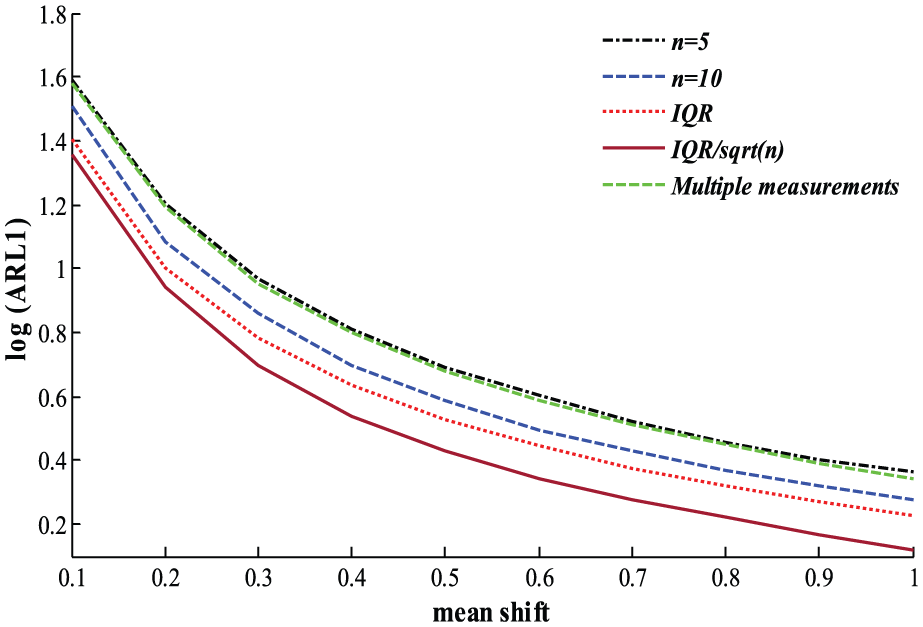
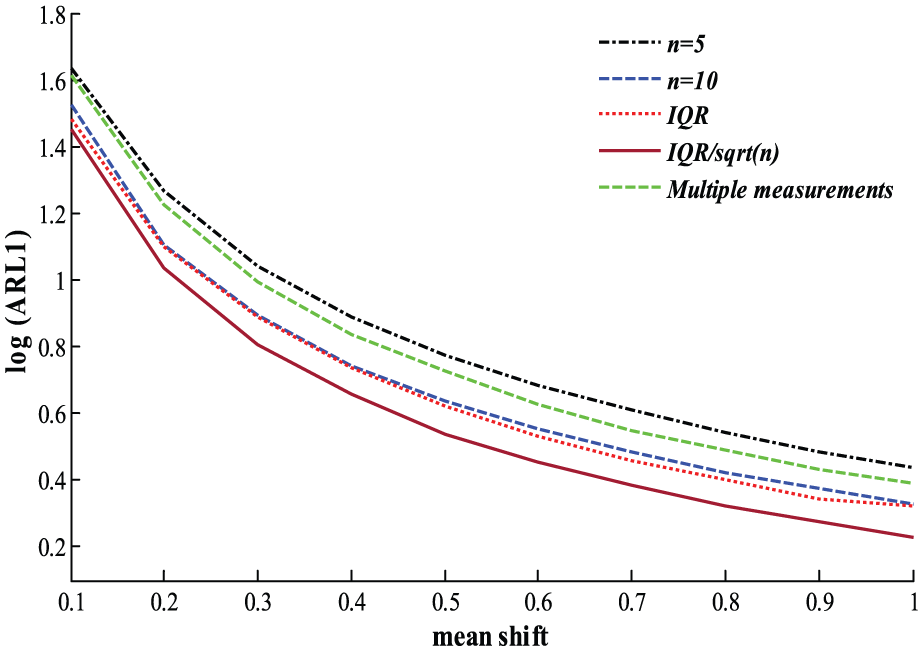
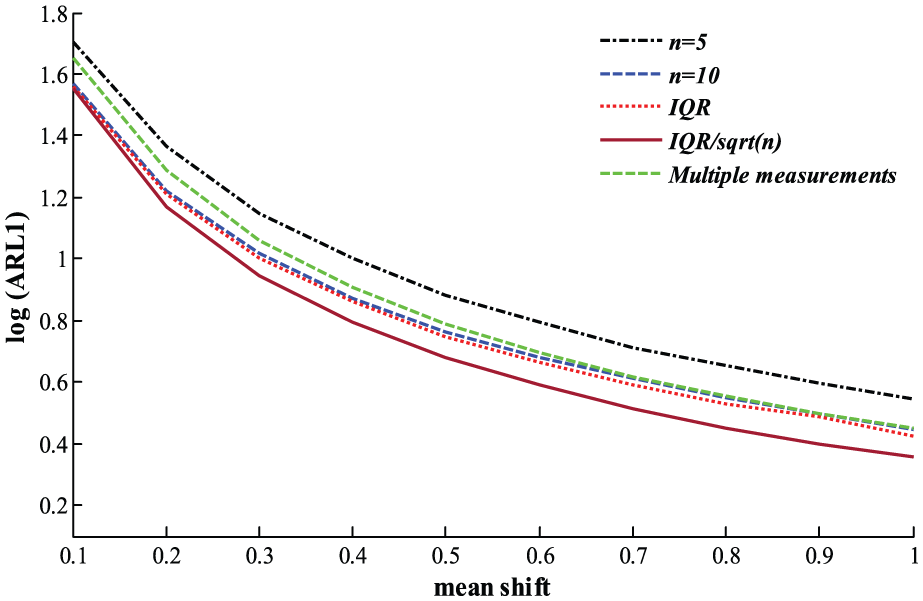
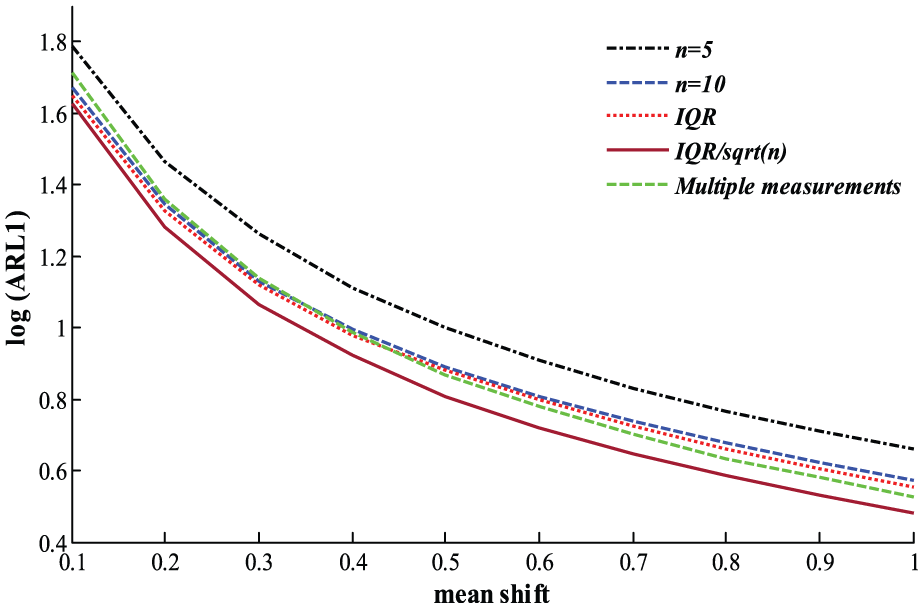
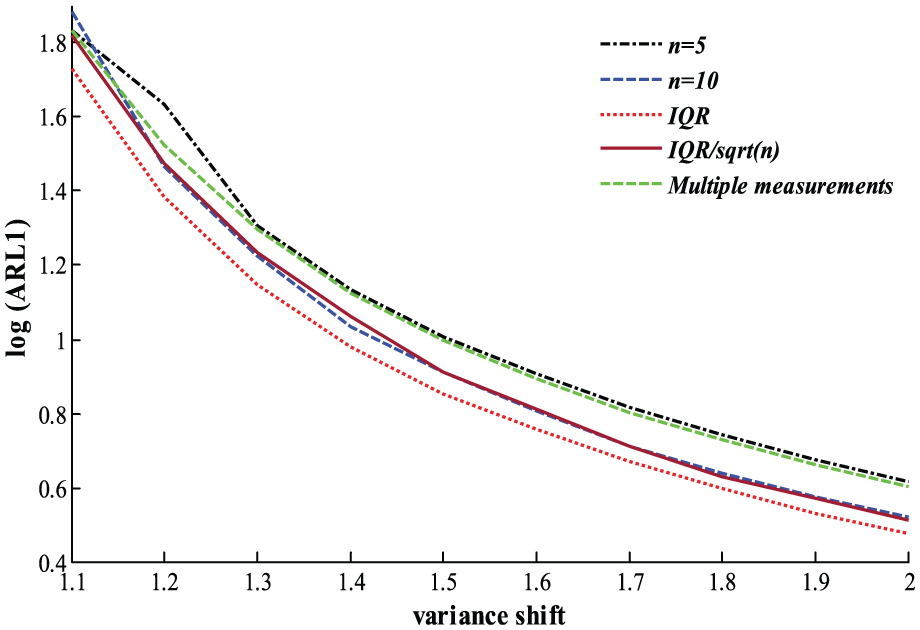
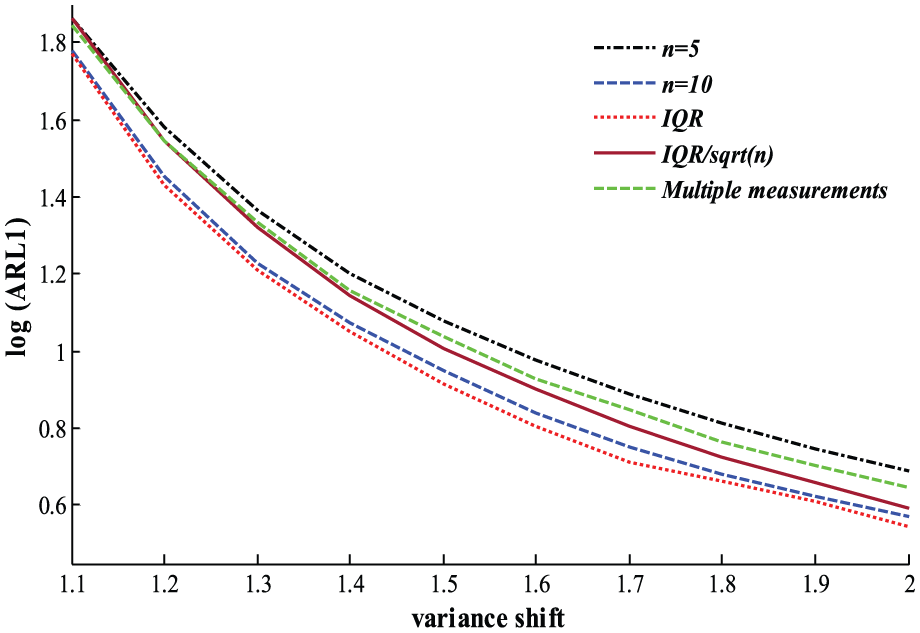
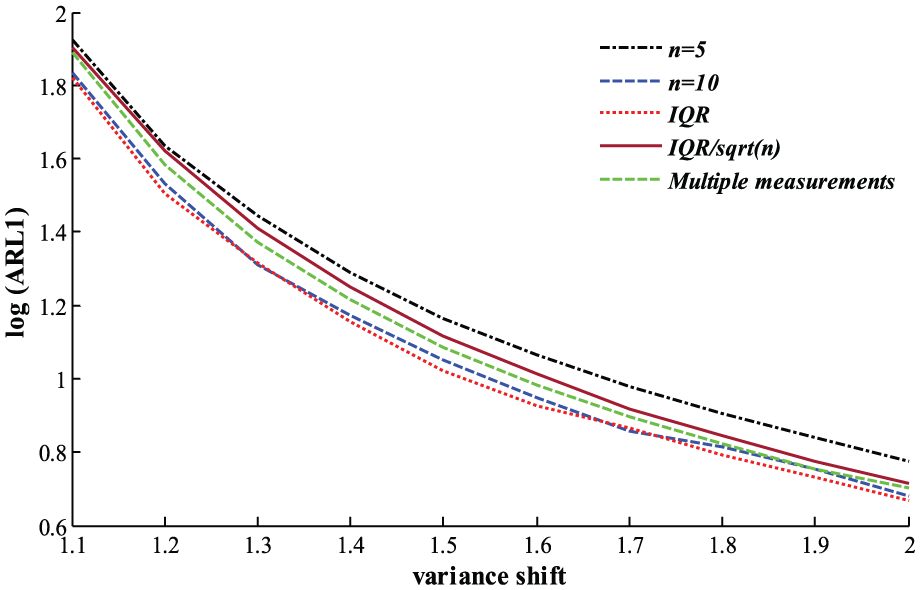
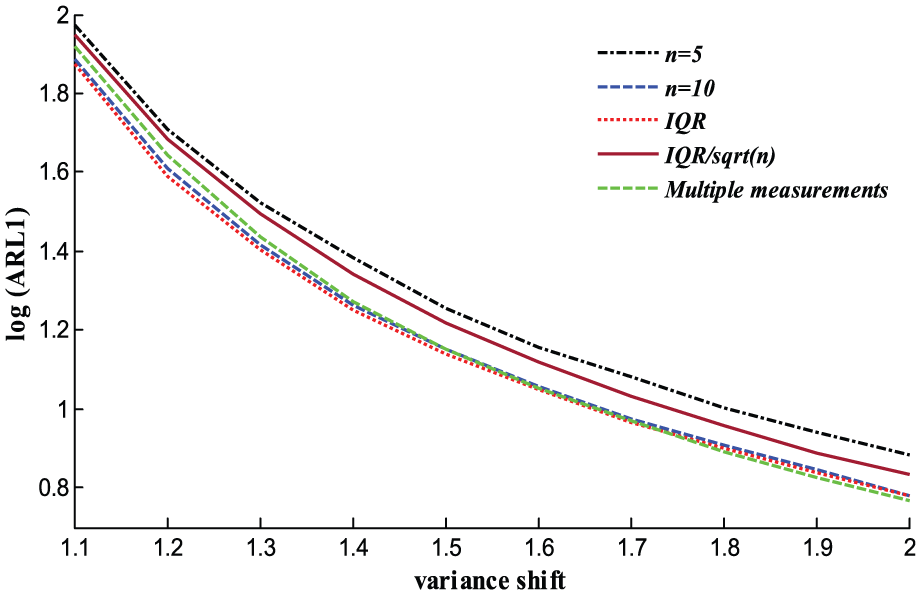
We use a log() curve to investigate which method performs better than the other methods. In addition, the results of comparison study considering different variance of error terms under various mean shifts are shown in Figures 2–5, whereas the ones under variance shifts are shown in Figures 6–9. Figures 2–5 confirm that all suggested methods can considerably decrease the effect of measurement errors under different out-of-control mean shifts in the process parameters. As seen, among the proposed remedial methods, the third one, i.e. the method outperforms the others when the shifts are occurred in the mean vector of the process. The results of Figures 6–9 show that the performance of the second method (IQR) is better than the others under almost all variance shifts. After that, the increasing sample size method has the best performance to detect out-of-control disturbances in the covariance matrix of the process. Generally, we can see that under almost all changes (either mean or variance shifts), the second and third remedial approaches have the most satisfactory performance to cover the undesired effects of the imprecise measurements. The superior performance of the second and third methods may be because the IQR-based methods eliminate the outliers (which would be due to the imprecise measurements) and substitute them by ordinary observations, whereas in the first method only the larger sample sizes are taken and the imprecise measurements are remained and not eliminated in chart interpretation. Note that the number of measurements considered is equal to two () for all simulation studies in the multiple measurements method.
Comparison of the remedial methods under mean shifts when .
Comparison of the remedial methods under mean shifts when .
Comparison of the remedial methods under mean shifts when .
Comparison of the remedial methods under mean shifts when .
Comparison of the remedial methods under variance shifts when .
Comparison of the remedial methods under variance shifts when .
Comparison of the remedial methods under variance shifts when .
Comparison of the remedial methods under variance shifts when .
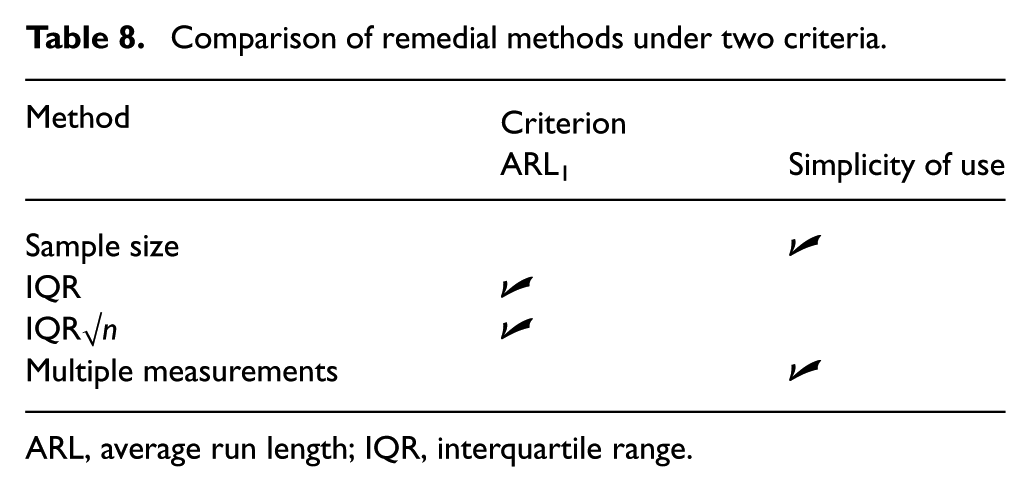
Table 8 shows the superiority of each remedial method under two criteria. As shown in this table, and IQR√n methods have better performance with respect to the other methods in terms of out-of-control ARL. This result is obtained based on the extensive simulation studies. Although the statistical performances of the sample size and multiple measurements methods are worse than the other proposed methods, the simplicity of use in practice is the main advantage of these methods.
Comparison of remedial methods under two criteria.
Criterion
Method
ARL1
Simplicity of use
Sample size
IQR
IQR√n
Multiple measurements
ARL, average run length; IQR, interquartile range.
A real data example
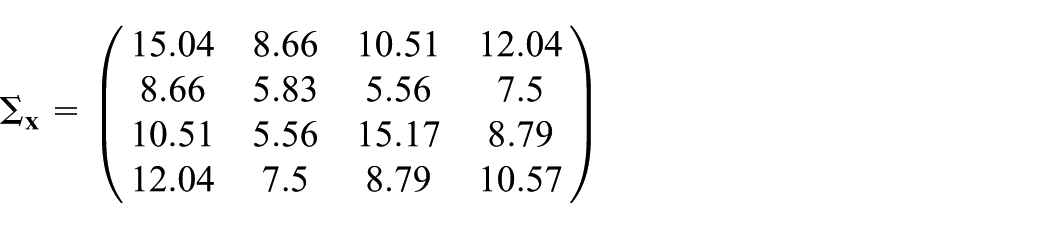
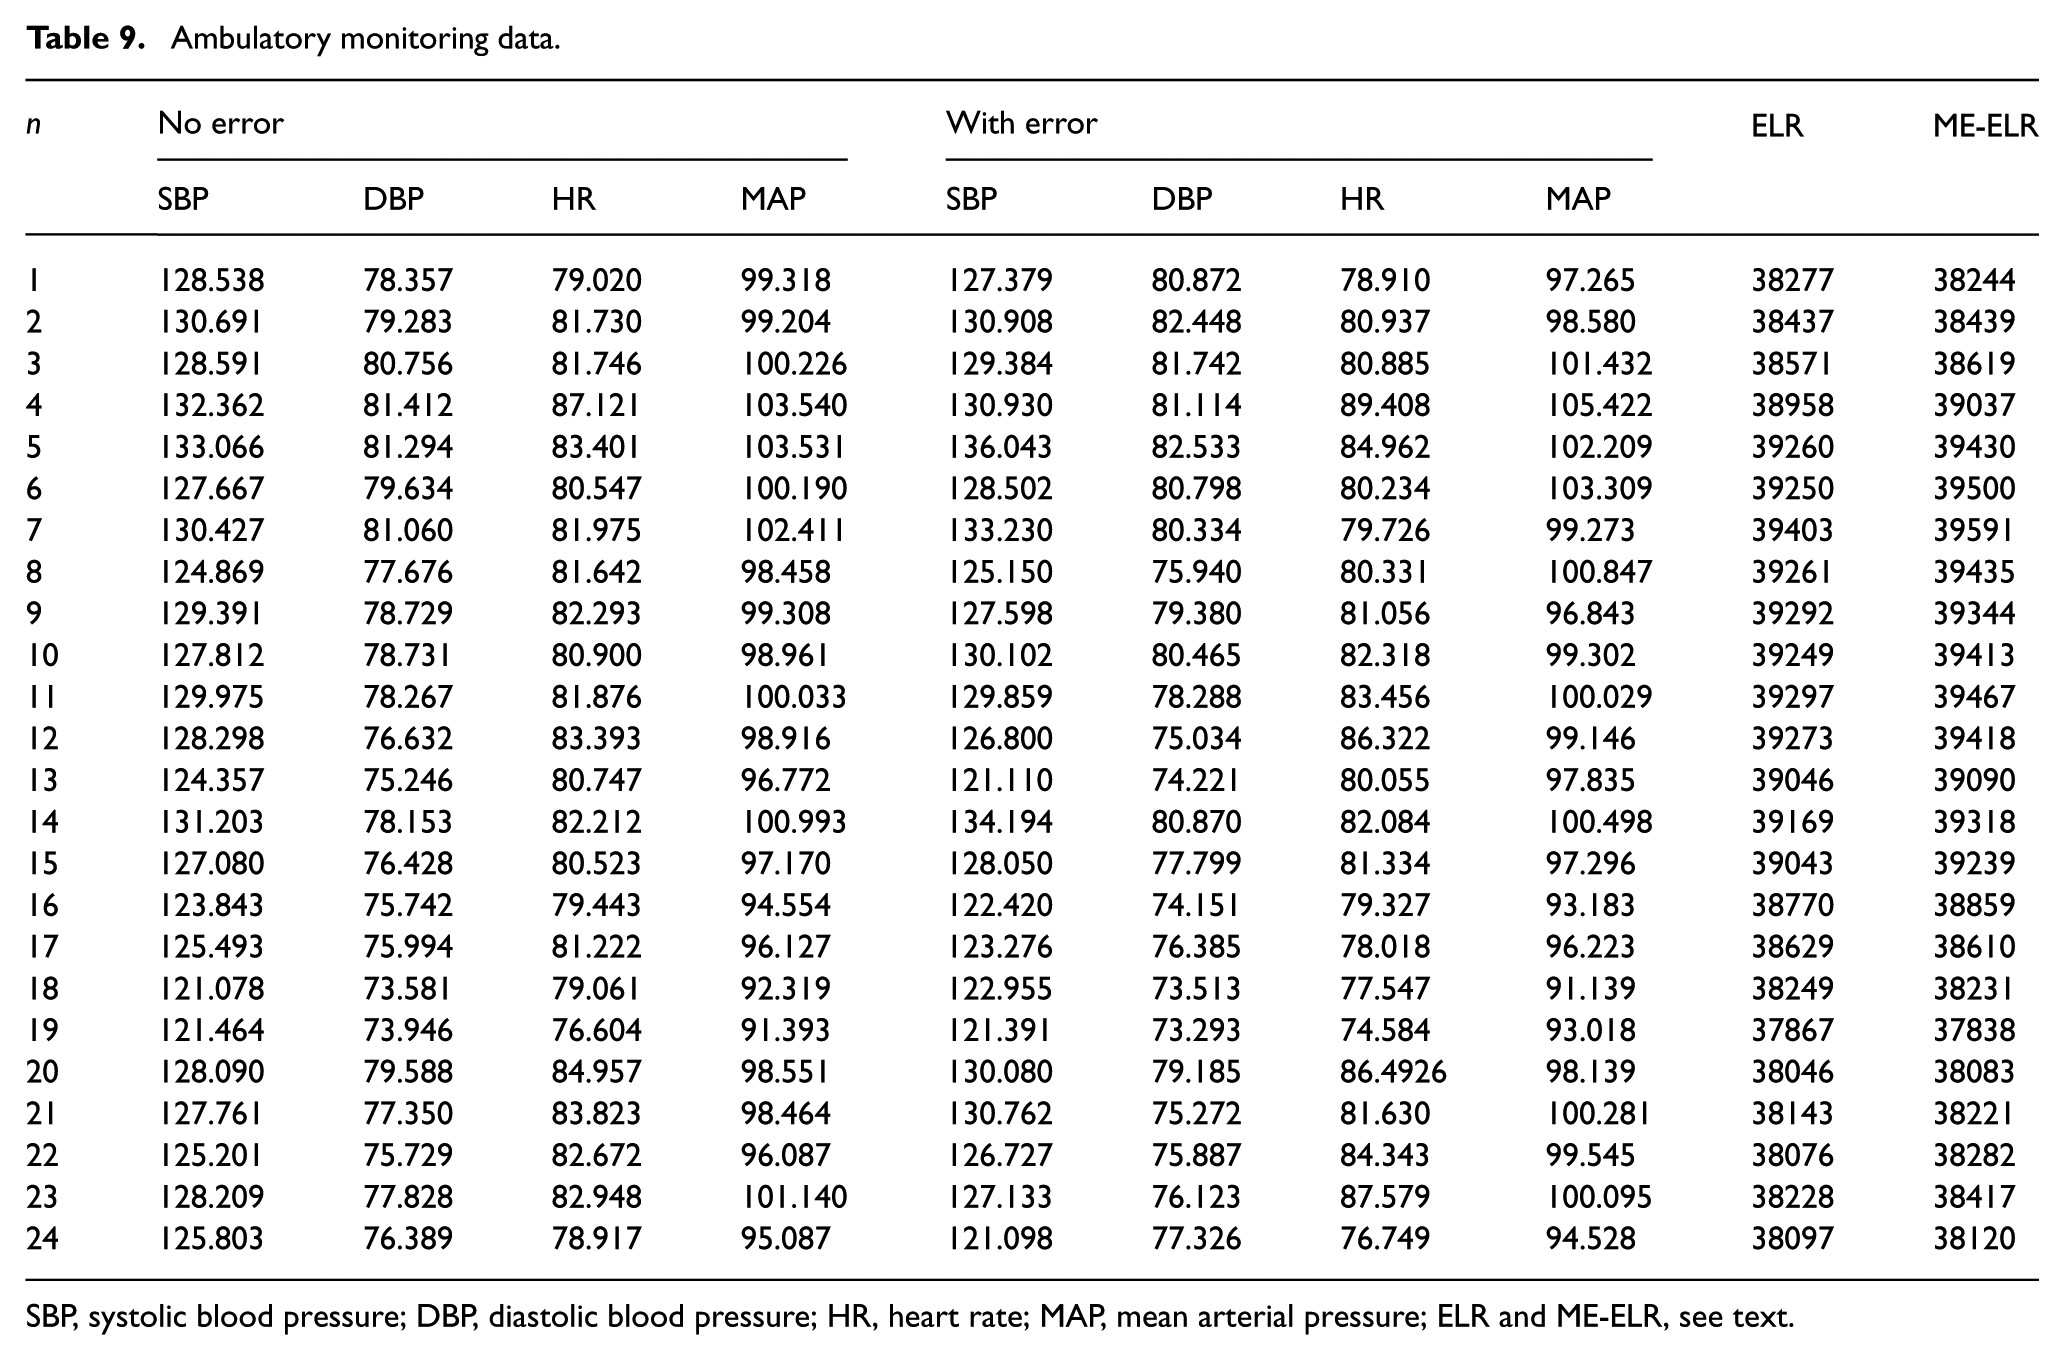
In this section, the application of our proposed ME-ELR control chart is illustrated by a real data set provided by Hawkins and Maboudou-Tchao (2008). The data set is from a long-standing research project in ambulatory monitoring. In this work, subjects were equipped with instruments that measure and record physiological variables. The wearer’s blood pressure and heart rate were measured and recorded every 15 min for 6 years. Before the analysis, using statistical process control (SPC) methods, each week’s raw data are condensed into weekly summary numbers, which include mean systolic blood pressure (SBP), mean diastolic blood pressure (DBP), mean heart rate (HR) and overall mean arterial pressure (MAP). Based on Hawkins and Maboudou-Tchao (2008), the vector of quality characteristics follows multivariate normal distribution with mean vector and the following covariance matrix:
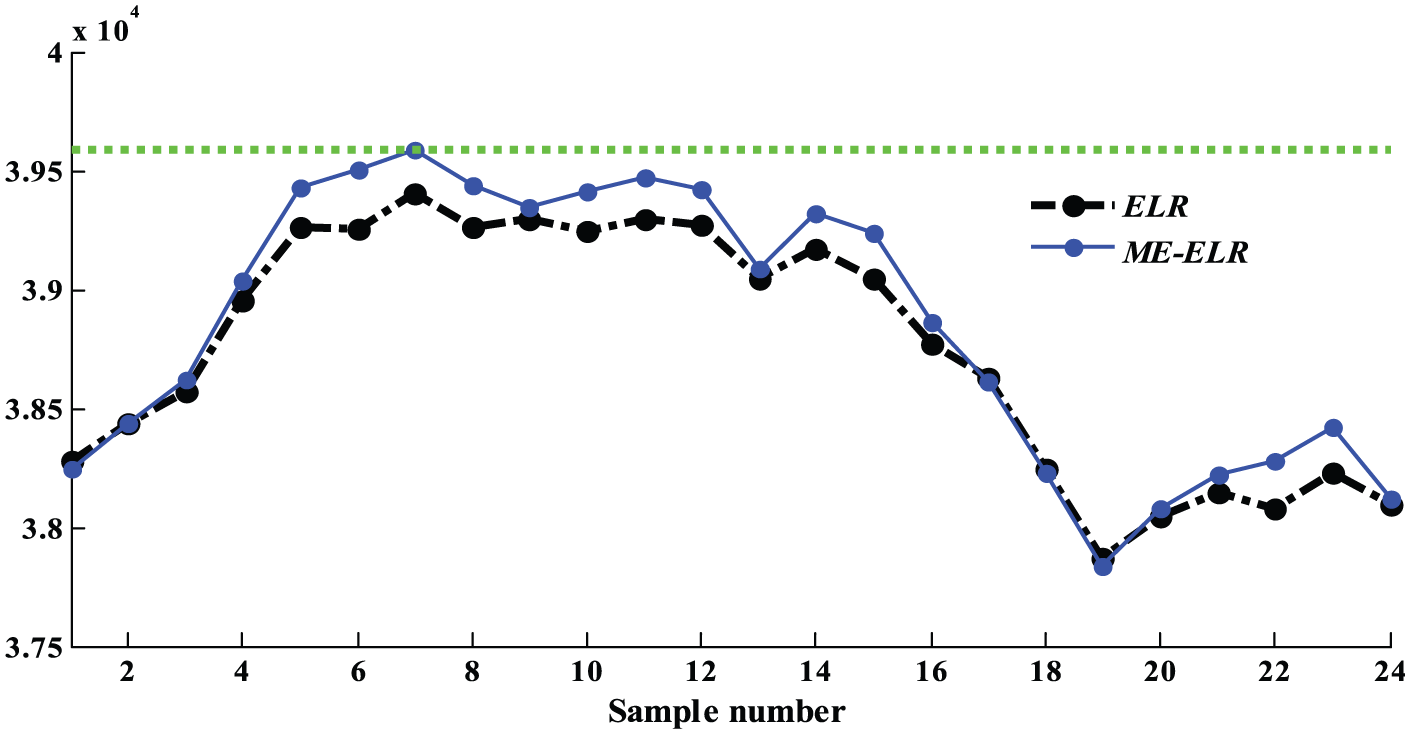
Interested readers are referred to Hawkins and Maboudou-Tchao (2008) for more details. In order to illustrate the effect of measurement error on the ELR control chart, we set and to obtain ARL0=200. Table 9 represents the data set of Hawkins and Maboudou-Tchao (2008) along with the corresponding ELR and ME-ELR statistics. The ELR and ME-ELLR statistics are also plotted in Figure 10. Figure 10 shows that all 24 samples are in control when there is no measurement errors, whereas in the presence of measurement errors the control chart triggers a false alarm in the seventh sample taken.
Ambulatory monitoring data.
n
No error
With error
SBP
DBP
HR
MAP
SBP
DBP
HR
MAP
ELR
ME-ELR
1
128.538
78.357
79.020
99.318
127.379
80.872
78.910
97.265
38277
38244
2
130.691
79.283
81.730
99.204
130.908
82.448
80.937
98.580
38437
38439
3
128.591
80.756
81.746
100.226
129.384
81.742
80.885
101.432
38571
38619
4
132.362
81.412
87.121
103.540
130.930
81.114
89.408
105.422
38958
39037
5
133.066
81.294
83.401
103.531
136.043
82.533
84.962
102.209
39260
39430
6
127.667
79.634
80.547
100.190
128.502
80.798
80.234
103.309
39250
39500
7
130.427
81.060
81.975
102.411
133.230
80.334
79.726
99.273
39403
39591
8
124.869
77.676
81.642
98.458
125.150
75.940
80.331
100.847
39261
39435
9
129.391
78.729
82.293
99.308
127.598
79.380
81.056
96.843
39292
39344
10
127.812
78.731
80.900
98.961
130.102
80.465
82.318
99.302
39249
39413
11
129.975
78.267
81.876
100.033
129.859
78.288
83.456
100.029
39297
39467
12
128.298
76.632
83.393
98.916
126.800
75.034
86.322
99.146
39273
39418
13
124.357
75.246
80.747
96.772
121.110
74.221
80.055
97.835
39046
39090
14
131.203
78.153
82.212
100.993
134.194
80.870
82.084
100.498
39169
39318
15
127.080
76.428
80.523
97.170
128.050
77.799
81.334
97.296
39043
39239
16
123.843
75.742
79.443
94.554
122.420
74.151
79.327
93.183
38770
38859
17
125.493
75.994
81.222
96.127
123.276
76.385
78.018
96.223
38629
38610
18
121.078
73.581
79.061
92.319
122.955
73.513
77.547
91.139
38249
38231
19
121.464
73.946
76.604
91.393
121.391
73.293
74.584
93.018
37867
37838
20
128.090
79.588
84.957
98.551
130.080
79.185
86.4926
98.139
38046
38083
21
127.761
77.350
83.823
98.464
130.762
75.272
81.630
100.281
38143
38221
22
125.201
75.729
82.672
96.087
126.727
75.887
84.343
99.545
38076
38282
23
128.209
77.828
82.948
101.140
127.133
76.123
87.579
100.095
38228
38417
24
125.803
76.389
78.917
95.087
121.098
77.326
76.749
94.528
38097
38120
SBP, systolic blood pressure; DBP, diastolic blood pressure; HR, heart rate; MAP, mean arterial pressure; ELR and ME-ELR, see text.
The effect of measurement errors on occurrence of false alarm.
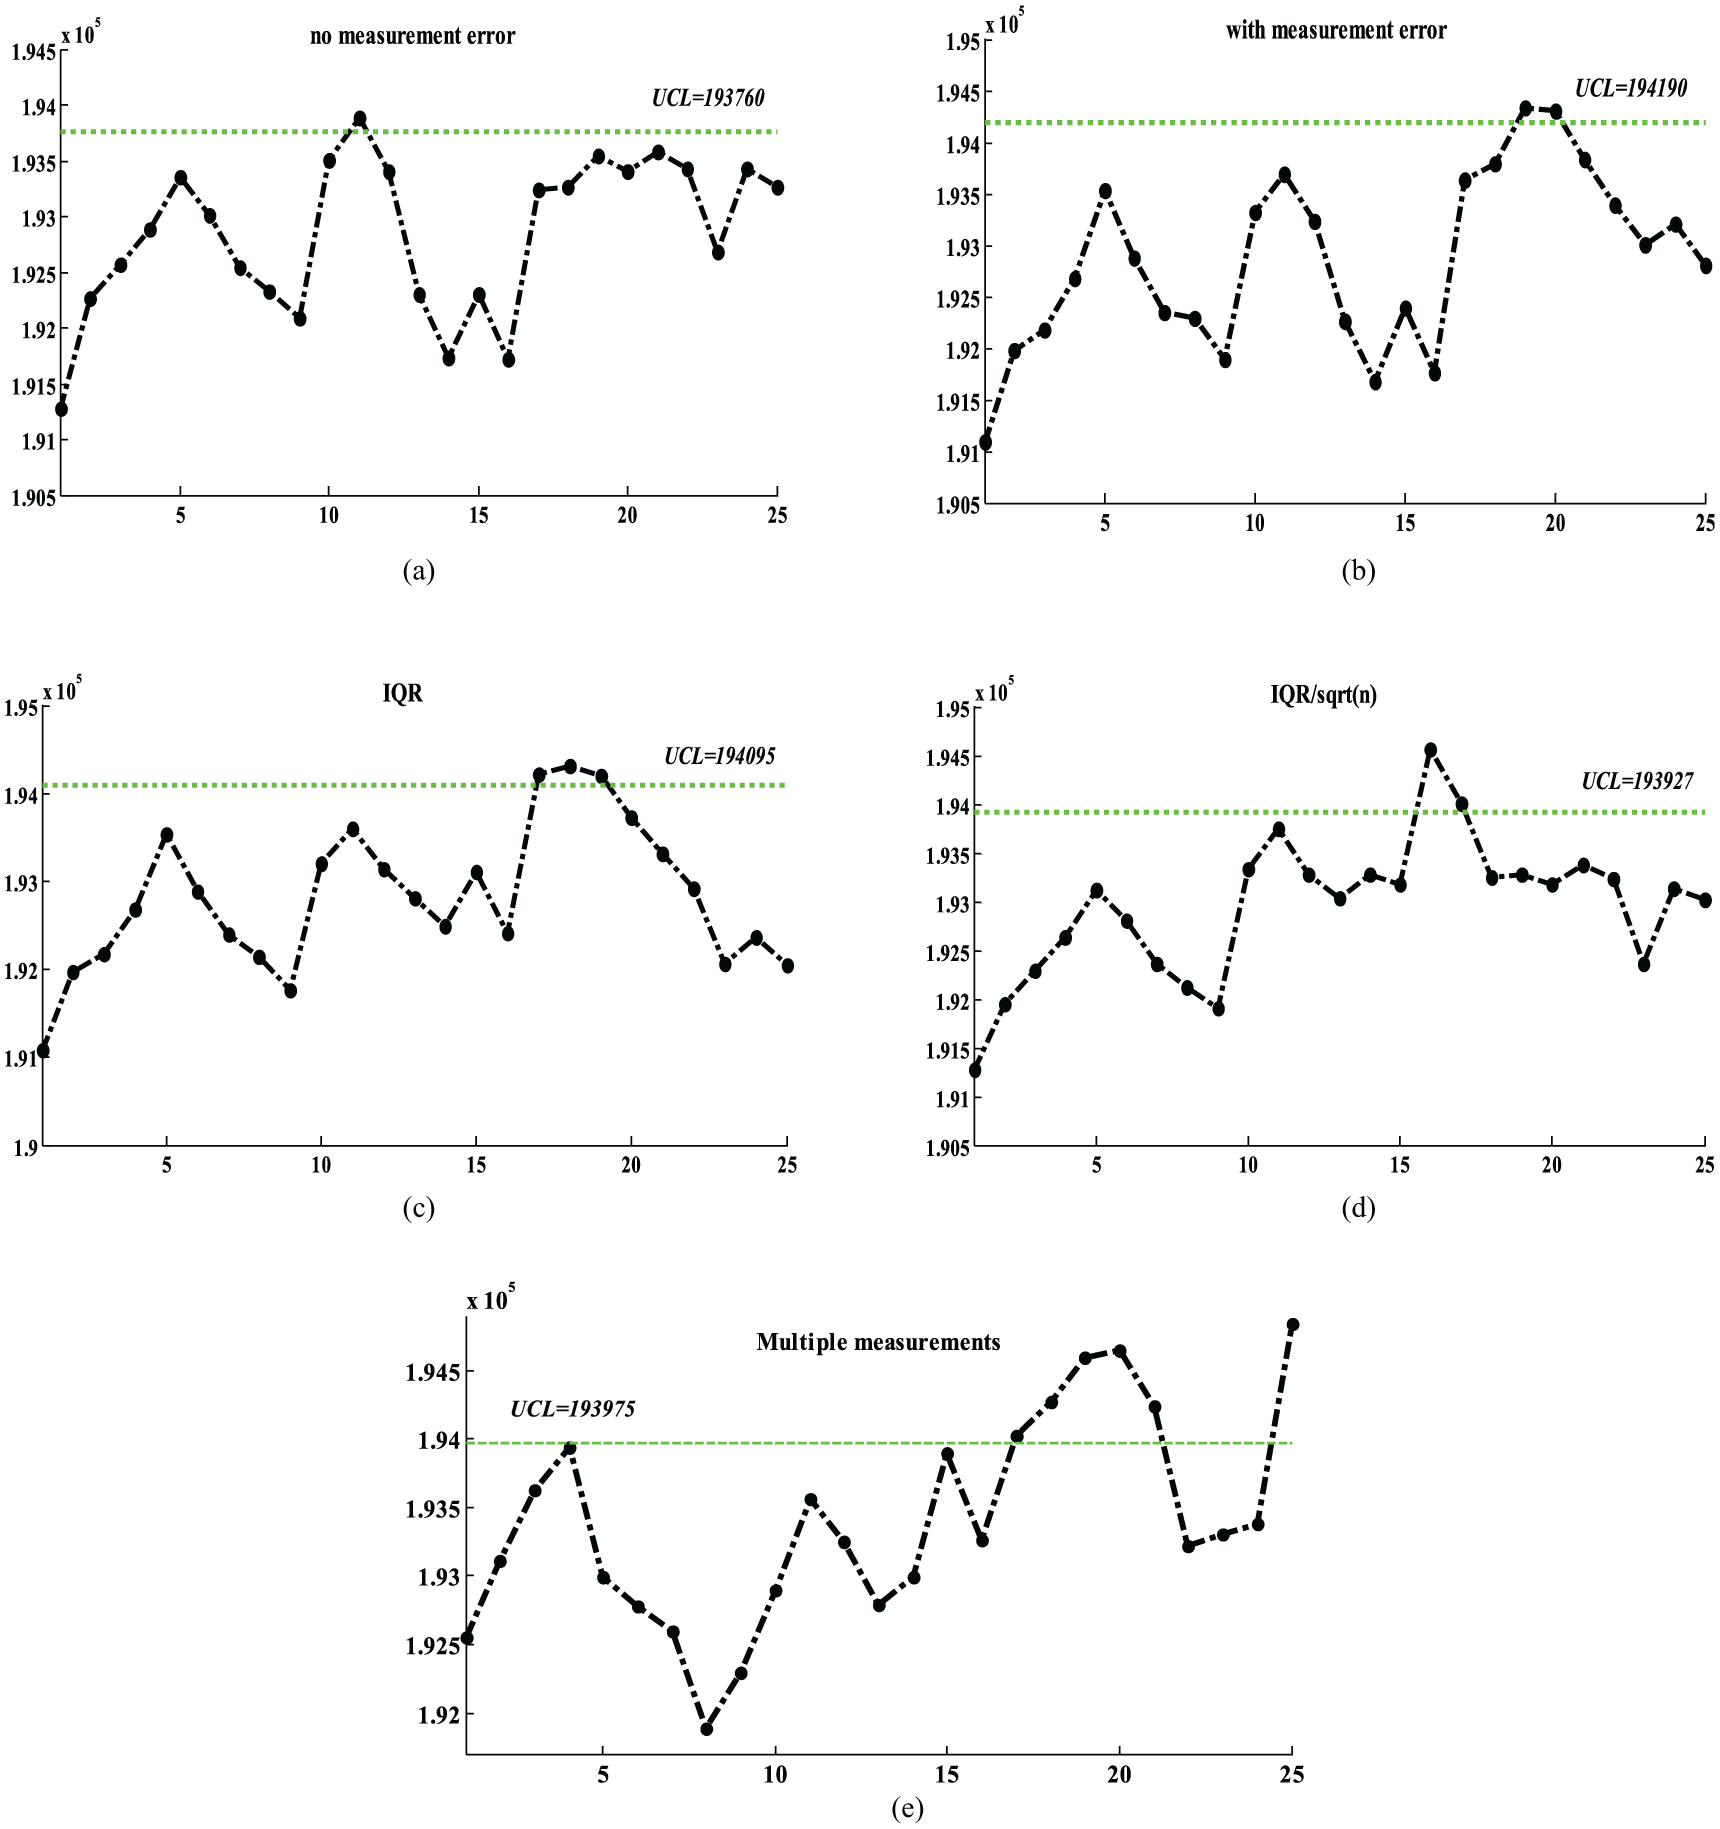
In Figure 11, the ELR, ME-ELR and ME-ELR control charts with four remedial approaches under a given step shift in the mean vector of quality characteristics in the mentioned long-standing research project are plotted and compared. Note that, in Figure 11 for each control chart the UCL is set such that ARL0 equals 200. In scenario a (no measurement error scenario), the ELR control chart detects the shift in the 11th sample taken. When there is measurement error in the measuring instrument (scenario b), the ME-ELR control chart signals in the 19th sample. Utilizing the remedial IQR-based methods can adequately decrease the effect of measurement errors. As shown in scenarios c and d (remedial methods), the ME-ELR control charts detect the out-of-control state in 17th and 16th samples, respectively. Also, the control chart equipped with multiple measurements method (scenario e) detects the out-of-control state in the 17th sample. In other words, the proposed IQR-based remedial approaches decrease the effect of measurement error and, as a result, the signals in the ME-ELR control chart approach those in the ELR control chart.
Comparison among the ELR (exponentially weighted moving average procedure with generalized likelihood ratio statistic), ME-ELR (measurement errors exponentially weighted moving average procedure with generalized likelihood ratio statistic), multiple measurements and interquartile range (IQR)-based ME-ELR control charts under a step shift in the mean vector of quality characteristics.
Conclusions and a future research
In this paper, first we proposed the ME-ELR control chart for simultaneous monitoring of mean vector and covariance matrix of multivariate processes in the presence of measurement errors. Through extensive simulation studies, we proved the undesirable effect of measurement errors to detect separate and simultaneous shifts in the mean vector and covariance matrix of multivariate processes. Then, we suggested four remedial approaches to decrease the effect of measurement errors on the detecting performance of the proposed ME-ELR control chart. A comparison analysis between the remedial methods is also conducted. The results showed that all the remedial approaches adequately decrease the undesirable effects of measurement errors. Finally, the application of the proposed ME-ELR control chart and the remedial methods was illustrated through a real data example. Considering the effect of measurement errors with linearly increasing variance error on monitoring the mean vector and the covariance matrix of multivariate normal processes can be a fruitful area for future research.
Footnotes
Acknowledgements
The authors are grateful to the anonymous referees for valuable comments that led to improvement in the quality of the paper.
Conflict of interest
The author(s) declared no potential conflicts of interest with respect to the research, authorship, and/or publication of this article.
Funding
The author(s) disclosed receipt of the following financial support for the research, authorship, and/or publication of this article: This research is supported by a grant from Shahed University in Iran.
References
1.
AbbasiSA (2010) On the performance of EWMA chart in the presence of two-component measurement error. Quality Engineering22: 199–213.
2.
AbbasiSA (2015) Exponentially weighted moving average chart and two-component measurement error. Quality and Reliability Engineering International. To appear.
3.
AbrahamB (1977) Control charts and measurement error. In: Annual Technical Conference of the American Society for Quality Control, vol. 31, pp. 370–374.
4.
ChambersJMClevelandWSKleinerBet al. (1983) Graphical Methods for Data Analysis. 1st ed.Boca Raton, FL: Chapman and Hall/CRC.
5.
ChenGChengSWXieH (2005) A new multivariate control chart for monitoring both location and dispersion. Communications in Statistics – Simulation and Computation34: 203–217.
6.
CostaAFRahimMA (2004a) Joint and R charts with two-stage samplings. Quality and Reliability Engineering International20: 699–708.
7.
CostaAFBRahimMA (2004b) Monitoring process mean and variability with one non-central chi-square chart. Journal of Applied Statistics3: 1171–1183.
8.
CostaAFBDe MagalhãesMSEpprechtEK (2009) Monitoring the process mean and variance using a synthetic control chart with two-stage testing. International Journal of Production Research47: 5067–5086.
9.
GhashghaeiRBashiriMAmiriAet al. (2016) Effect of measurement error on joint monitoring of process mean and variability under ranked set sampling. Quality and Reliability Engineering International. To appear.
10.
GuhRS (2010) Simultaneous process mean and variance monitoring using artificial neural networks. Computers & Industrial Engineering58: 739–753.
11.
HaqABrownJMoltchanovaEet al. (2015) Effect of measurement error on exponentially weighted moving average control charts under ranked set sampling schemes. Journal of Statistical Computation and Simulation85: 1224–1246.
HolanSSpinkaC (2007) Maximum likelihood estimation for joint mean–covariance models from unbalanced repeated-measures data. Statistics & Probability Letters77: 319–328.
14.
HuXCastagliolaPSunJet al. (2014) The Effect of measurement errors on the synthetic chart. Quality and Reliability Engineering International31: 1769–1778.
15.
KanazukaT (1986) The effect of measurement error on the power of -R charts. Journal of Quality Technology18: 91–95.
16.
Khati DizabadiAShahrokhiMMalekiMR (2016) On the effect of measurement error with linearly increasing-type variance on simultaneous monitoring of process mean and variability. Quality and Reliability Engineering International. To appear.
17.
KhooMB (2004) A new bivariate control chart to monitor the multivariate process mean and variance simultaneously. Quality Engineering17: 109–118.
18.
LinnaKWWoodallWH (2001) Effect of measurement error on Shewhart control charts. Journal of Quality Technology33: 213–222.
19.
LinnaKWWoodallWHBusbyKL (2001) The performance of multivariate control charts in the presence of measurement error. Journal of Quality Technology33: 349–355.
20.
MalekiMRAmiriA (2015) Simultaneous monitoring of multivariate-attribute process mean and variability using artificial neural networks. Journal of Quality Engineering and Production Optimization1: 43–54.
21.
MaravelakisPE (2012) Measurement error effect on the CUSUM control chart. Journal of Applied Statistics39: 323–336.
22.
MaravelakisPPanaretosJPsarakisS (2004) EWMA chart and measurement error. Journal of Applied Statistics31: 445–455.
23.
MittagHJ (1995) Measurement error effect on control chart performance. In: Annual Quality Congress Proceedings-American Society for Quality Control, pp. 66–73.
24.
MontgomeryDC (2007) Introduction to Statistical Quality Control. New York: John Wiley & Sons.
25.
NiakiSTAMemarAO (2009) A new statistical process control method to monitor and diagnose bivariate normal mean vectors and covariance matrices simultaneously. The International Journal of Advanced Manufacturing Technology43: 964–981.
26.
ReynoldsMRChoGY (2006) Multivariate control charts for monitoring the mean vector and covariance matrix. Journal of Quality Technology38: 230–253.
27.
SpiringFAChengSW (1998) An alternate variables control chart: the univariate and multivariate case. Statistica Sinica8: 273–287.
28.
TukeyJW (1977) Exploratory Data Analysis. 18th ed.Reading, PA: Addison-Wesley.
29.
WangKYehABLiB (2014) Simultaneous monitoring of process mean vector and covariance matrix via penalized likelihood estimation. Computational Statistics & Data Analysis78: 206–217.
30.
WhiteEMSchroederR (1987) A simultaneous control chart. Journal of Quality Technology19: 1–10.
31.
YangSFHoHWRahimMA (2007) Effects of measurement error on controlling two dependent process steps. Economic Quality Control22: 127–139.
32.
ZhangGChangSI (2008) Multivariate EWMA control charts using individual observations for process mean and variance monitoring and diagnosis. International Journal of Production Research46: 6855–6881.
33.
ZhangJLiZWangZ (2010) A multivariate control chart for simultaneously monitoring process mean and variability. Computational Statistics & Data Analysis54: 2244–2252.