






Abstract
The novel model predictive control with feedback correction designed in this paper aims to optimize the energy dispatch and minimize the operation costs of a microgrid, which contributes to the improvement of pollution emissions and economic growth. The microgrid communication is based on power line communication, thus more accurate prediction models of photovoltaic and wind power generations of a networked microgrid can be designed from weather forecast information transmitted by power line communication. The prediction model for micro gas turbines and the loads of a microgrid are also proposed for optimization of the model predictive control. The rolling optimization model is updated by the latest forecast information to get minimization costs and optimal energy dispatch. The feedback correction designs predictions of generation and loads prediction errors to give an adjustment of the prediction model. Then the energy optimization dispatch will be updated by the adjusted prediction, so the most optimal dispatch will be obtained. Finally, the data of a microgrid in the Zhejiang province is applied in simulation and the minimization costs are compared with ideal costs to verify the performance and effectiveness of the proposed model predictive control strategy.
Introduction
A microgrid is the integration of distributed generations including photovoltaic generation, wind turbine power, micro gas turbine, and so on, which provides effective methods for the improvement of pollution emissions and economic growth (Chen et al. 2017; Peng et al., 2016). As a new paradigm for the operation of distributed generation, microgrids play an important role in the management of renewable energy sources (RESs) (Peng and Zhang 2016; Shen et al., 2014; Zhang et al., 2013).
The changing weather brings uncertain facts to a microgrid, because RES generation mainly depends on the weather (Li et al., 2016; Sun et al., 2017). To overcome this kind of uncertainty, a networked microgrid which uses a power line communication (PLC) network is introduced in this paper. PLC takes advantage of electrical power networks and transmits information by high frequency signals (Yan et al., 2016b; Zhang et al., 2016, 2017). PLC makes the microgrid networked, because the microgrid not only obtains weather forecast information from PLC network, but also exchanges information with others by the PLC network. Furthermore, the PLC network improves the operation and stability of the microgrid (Wang et al., 2016; Yan et al., 2016a; Zhang et al., 2016).
Microgrid is in charge of many power generations and loads, so it is of considerable importance for the microgrid to have an optimal energy dispatch (Li et al., 2011). With an optimal energy schedule, the microgrid can make full use of microgrid. Therefore, some studies have focused on the energy management of a microgrid. The mixed-integer programming (MIP) and improved particle swarm optimization (IPSO) methods are proposed in microgrid energy scheduling, and the performance of these two methods are compared by Xu et al. (2013). A two-layer network and distributed control method are designed by Li et al. (2017) to guarantee supply-demand balance in an islanded microgrid. Pontryagin’s minimum principle is applied to an optimal control strategy to minimize the power flows among microgrids and making the storage system operate around a referenced value in the work by Dagdouguiet et al. (2014).
Although the above control strategies can improve the performance of microgrid energy dispatch, these strategies do not consider a prediction model for microgrid components. However, an accurate prediction for microgrid energy dispatch has a great contribution to the management of microgrid operation, so model predictive control (MPC) has been proposed to solve the energy dispatch problems in a microgrid. A two-layer MPC for islanded microgrid energy control is proposed by Sachset et al. (2016). The first layer is designed to get the optimal power dispatch by MPC and the second layer is for the adjustment of the optimal dispatch. However, the islanded microgrid cannot get weather forecast information from the network, and thus the RES prediction model by Sachset et al. (2016) is not accurate. Garcia-Torres et al. (2016) designed an MPC for optimal load sharing of a hydrogen-based microgrid, but feedback correction of the MPC was not considered by Garcia-Torres et al. (2016). Therefore, a MPC which takes advantage of weather forecast information transmitted by PLC and considers feedback correction needs to be designed.
In this paper, the networked microgrid is the microgrid based on the PLC network. The prediction model of photovoltaic and wind power generation is related to the forecasted temperature and wind speed information transmitted by the PLC network. The MPC with feedback correction is proposed to minimize the cost of the microgrid operation. The rolling optimization of MPC is to minimize microgrid operation costs with some constraints in each rolling horizon. The feedback correction part of MPC will give an estimation for prediction error, which serves as the adjustment of prediction model of generations and loads. The contributions of this paper are listed as follows.
A new prediction model for power generation by using weather forecast information in PLC network is proposed. Because the generation power of photovoltaic and wind power mainly depend on weather condition, the prediction model will be more accurate by using weather forecast information. Consequently, the new prediction model for power generation can be more accurate.
The novel energy optimization dispatch is proposed to minimize the costs of the microgrid.
A new idea of feedback correction is applied in MPC. Predicting error-prediction between predicted generation or loads and actual generation or loads are obtained in feedback correction. By adding the error-prediction into the prediction model, the deviation between predicted values and real values will be smaller and smaller. Therefore, a more optimal energy dispatch will be gained.
The rest of this paper is organized as follows. The ‘Prediction model of the microgrid system components’ section proposes the prediction model of photovoltaic, wind turbine power and micro gas turbine generation. The ‘Rolling optimization of the microgrid MPC’ section presents the rolling optimization part of MPC to minimize the costs of the microgrid. The feedback correction of MPC is designed in section ‘Feedback correction of the microgrid MPC’. The ‘Microgrid MPC strategy with network information’ section gives a conclusion of the proposed MPC strategy. The Zhejiang province microgrid is considered in the simulation part in the ‘Simulation results’ section. The ‘Conclusion’ section draws the conclusions.
Prediction model of the microgrid system components
The microgrid system considered in this paper incorporates wind power (WP), photovoltaic (PV), micro gas turbine, battery and load. As shown in Figure 1, the grid-connected microgrid can exchange electricity power and information with large power grids (LPGs). Furthermore, the weather forecast information including temperature and wind speed is transmitted by the PLC network. If the weather forecast information could be added into RES prediction, a more accurate RES prediction model could be built. What is more, the accurate RES model is an essential part of optimal energy dispatch, so the PV and WP model with the weather forecast incorporated will be presented in this section.
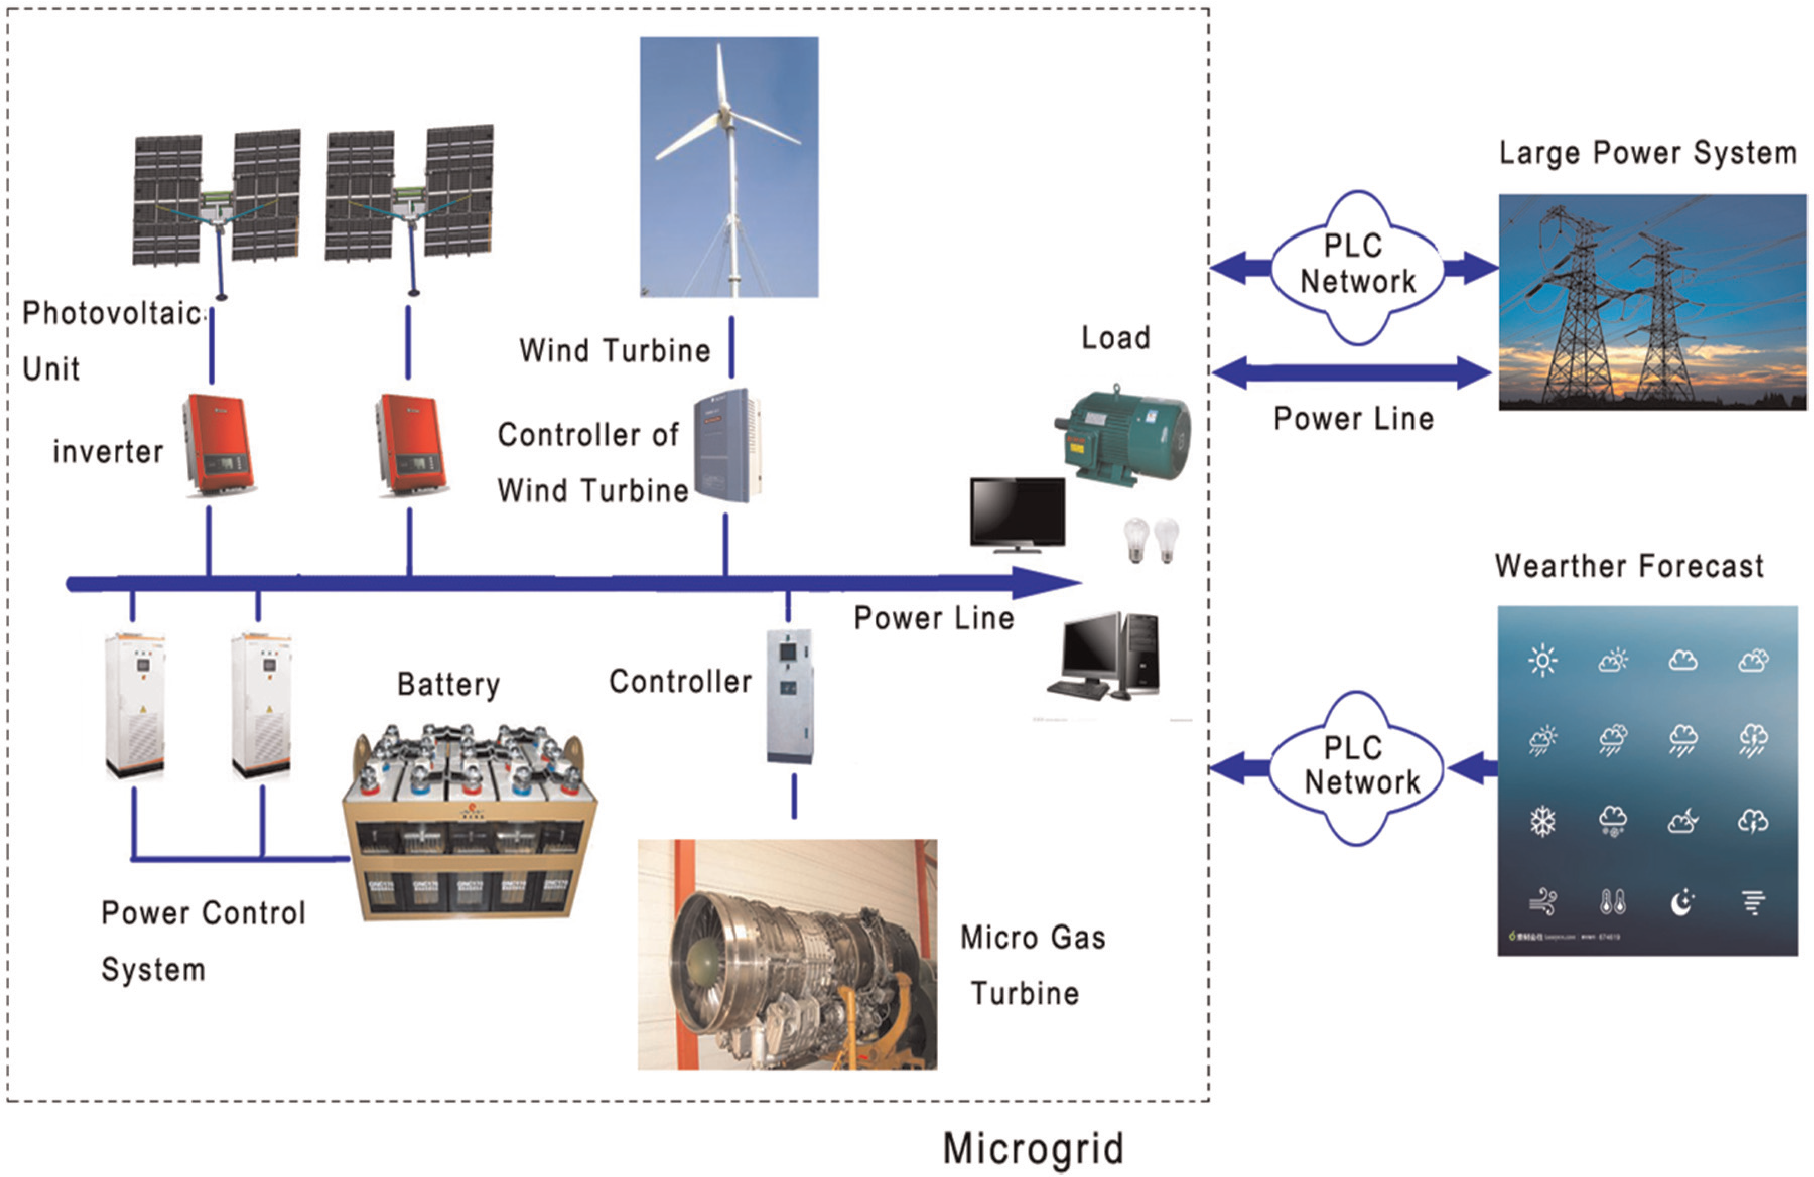
The component of networked microgrid system.
PV prediction model with weather forecast information
The power of PV generation depends on solar irradiation which is related to temperature. To get connected to the LPG, the inverter is an essential part of PV generation.
A PV inverter controlled by digital signal processing (DSP) is shown in Figure 2, which consists of a hardware circuit part and control signal part. In the hardware circuit, a boost circuit is designed to regulate the direct current (DC) voltage of the microgrid storage. The inductance-capacitance (LC) filter which is a filter consists of inductance and capacitor is used to get a filtered alternate current (AC) voltage. The H-bridge contains four insulated gate bipolar transistors (IGBTs) which are controlled by signal g from the DSP and the signal g is related to sinusoidal pulse width modulation (SPWM). The on and off status of the four IGBTs (

The photovoltaic inverter model in the networked microgrid.
The voltage of the microgrid needs to be synchronous with the LPG, so the voltage of PV generation should be the same as the LPG voltage

where
According to Kirchhoff’s voltage law, the equation of the output current

where
The output voltage of the PV module


where
To predict the photovoltaic generation of next interval k+1 by the information of current interval k, the derivation of PV power
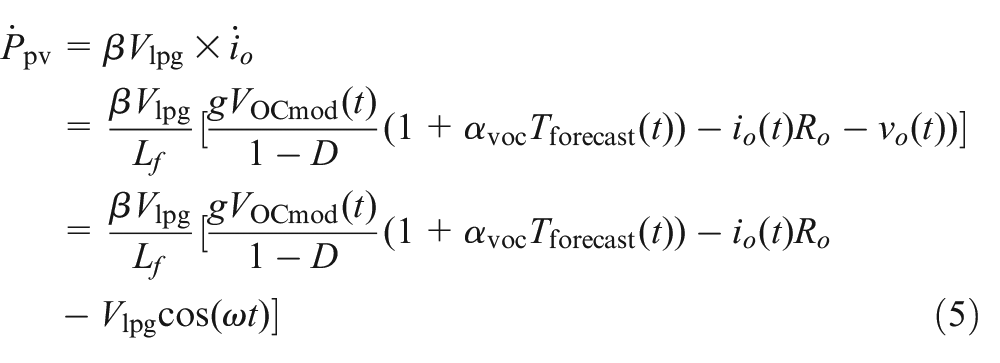
where the output voltage is
Discretize the power of PV generation by equation (6). In equation (6),


Wind power prediction model with weather forecast information
Wind speed is a critical factor for wind power generation. When the wind speed is smaller than the input speed of the or bigger than the output speed of wind turbine, the output wind power is zero. When the wind speed is bigger than the input speed of the wind turbine and smaller than the rated speed, the output wind power is a polynomial function. When the wind speed is bigger than the rated speed of wind turbine and smaller than the output speed, the output wind power is the rated power. Therefore, the model of wind can be given by

where the
Because the weather forecast can be obtained by the PLC network, the power of wind generation can be predicted by equation (8), which includes the forecasted wind speed.
Micro gas turbine generation model
The micro gas turbine is modelled by using continuous and discrete states. The start-up duration time of the ith micro gas turbine is

The start-up cost


Load prediction model
The loads in a microgrid usually include cooling, heating and electricity loads, which can be predicted by historical load data. The temporary loads can be big commercial activity, maintenance for roads, and so on. In a microgrid, the temporary loads can be informed by the PLC network. Therefore, the load prediction can be modelled by an autoregressive integrated moving average (ARIMA; Fard et al., 2014) according to the historical load data and prediction for temporary load information, shown as

where the
When the

Let

Therefore, the load prediction

that is,

Rolling optimization of the microgrid MPC
Based on the prediction model of photovoltaic and wind generation proposed in the ‘Prediction model of the microgrid system components’ section, the rolling optimization in this section aims to minimize the total operation cost. RES including wind power, photovoltaic energy, etc, are uncertain factors, because they depend on weather conditions. Hence, photovoltaic and energy generation are uncontrollable factors in power generation. The source of micro gas turbine generation is gas which is controllable. Furthermore, micro gas turbine generation is the only controllable generation in the microgrid of this study, so the control signal is the micro gas turbine generation. Supposing the number of the micro gas turbines to be N, the control signal will be

The exchanged power

The vectors are
Optimization objective
The objective of microgrid optimization is to minimize the total operation cost from the energy optimal dispatch. The cost of a microgrid system mainly contains a natural gas cost

The natural gas cost

where
The running and maintenance costs of a microgrid

where
The cost

where
The potential profit

where the
Constraints
As stated above, the optimization problem is to minimize the total operation costs of the microgrid. However, the microgrid system still has some constraints including power balance, micro gas turbine generation, exchanged power of microgrid and battery limitations.
The power balance constraint is presented by

The micro gas turbine generation constraint is given by

where
The limitation of the exchanged power between the microgrid and LPG is shown as

The battery constraints are presented by Wu et al. (2014)

where
In general, the rolling part of the microgrid MPC aims to find the optimal control signal
Feedback correction of the microgrid MPC
The feedback correction part aims to solve the deviation between the predicted and actual values of PV generation, wind power generation and loads. To get a better optimal energy dispatch, the Grey model first order one variable
The prediction errors of PV generation in the observed time n are shown as


where
Therefore,


Accumulation generation operation (AGO) is a technique for transforming the original set of data into a new set that is characterized by less noise and randomness. Applying the AGO to the prediction error of generations and loads, the series of prediction error will be


where equations (32) and (33) mean that
According to the Grey predictor model


The solution to equation (34) is generations prediction and loads prediction errors, which are shown as

The inverse accumulating generators operation (IAGO) is a method to get the original series. The IAGO selects the original first value as the first value of the new series, the original second value minus the first value as the second value of the new series and the original third value minus the second value as the third value of the new series.
The IAGO is applied to get the original prediction value of the prediction error

Therefore, if the predicting value of the prediction error

Microgrid MPC strategy with network information
In the previous section, the detailed microgrid MPC strategy has been stated. The general control strategy of MPC is going to be summarized in this section. As shown in Figure 3, the microgrid MPC control strategy proposed in this paper is based on the weather forecast information from the PLC network. The PV, wind turbine power generation and loads can be predicted by equations (7), (8) and (16). The generation and loads prediction can be modified by the prediction of their own prediction error. After the modified prediction of PV, wind turbine power generation and loads are obtained. The optimal control signal

MPC control strategy for microgrid energy optimal dispatch.
Simulation results
In this section, the performance and feasibility of the proposed MPC strategies are verified by the hypothetical microgrid island in Zhejiang, China. The area of this island is about 2,950,000 m2. The microgrid needs to supply power for residential electricity, tourist electricity and a 50 t desalted water system. The microgrid system consists of seven wind turbines (
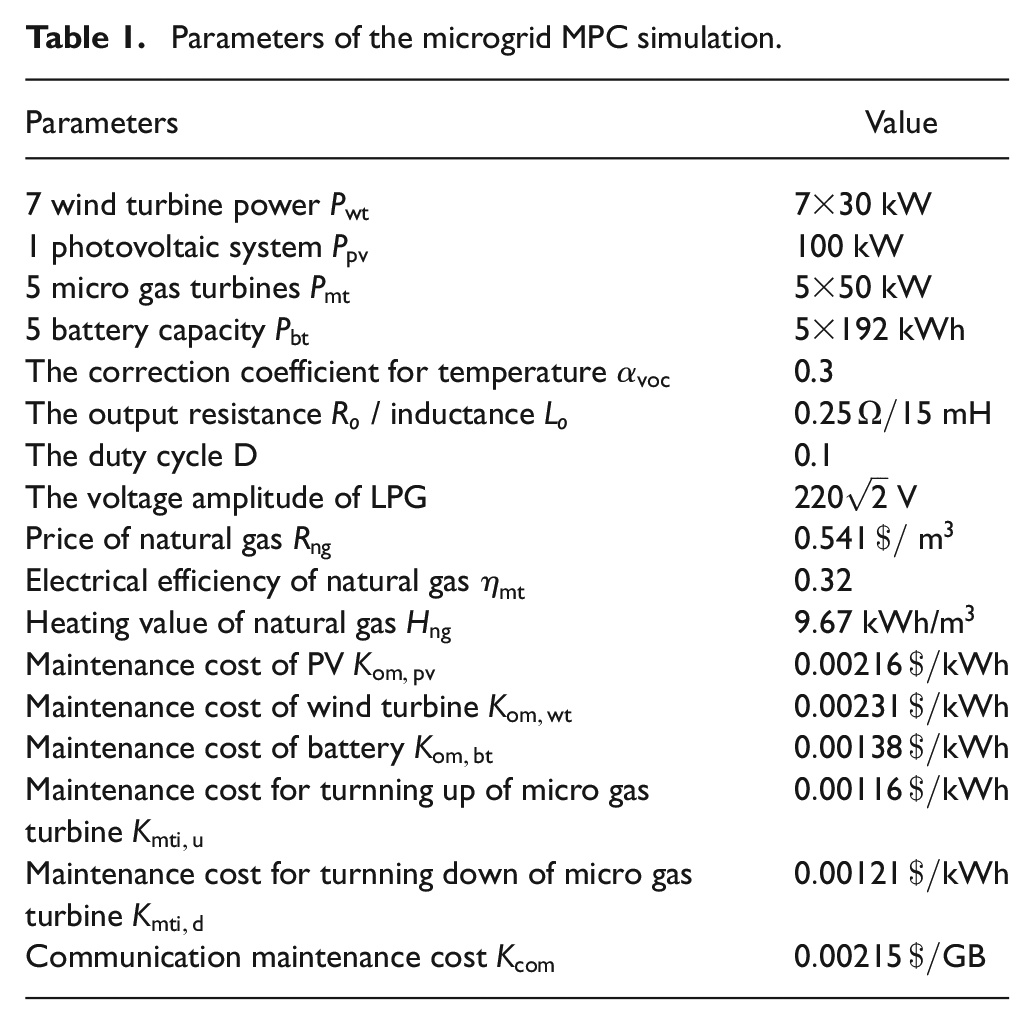
The simulation is coded by MATLAB R2014b and TOMLAB, which supplies well-known state-of-the-art optimization software packages which are used to test the MPC calculation performance. The simulation parameters are shown as in Table 1.
Parameters of the microgrid MPC simulation.
To verify the performance of the MPC energy optimization strategy, the MPC optimization of wind turbine power, PV generation and loads prediction, the simulation results of the microgrid MPC will be stated in detail in the following two subsections. The interval time of MPC rolling optimization
MPC optimization performance of PV generation prediction
Correct predictions for generation and loads are a critical part of MPC energy optimization dispatch. The primary prediction of wind turbine power and PV generation are related to the weather forecast from the PLC network. The primary prediction of loads are based on the historical loads data and the temporary loads information from PLC network. Primary predictions are operated in the rolling optimization part of MPC and modified by the error prediction provided by feedback correction.
PV generation power mainly depends on the temperature and solar radiation, so PV generation power varies in the four seasons. The prediction of PV generation is shown by equation (7). The temperature and solar radiation information are obtained from the PLC network. The PV power of spring, autumn, summer and winter are analyzed in this part and the real PV generation power in the four seasons is shown in Figures 4 to 6. As shown in Figures 4 to 6, the PV generation time in spring/autumn is from 6:15 to 17:20. Summer is from 5:30 to 19:40. Winter is from 7:00 to 17:00. Therefore, summer has the longest time for PV generation, which means generating more power.
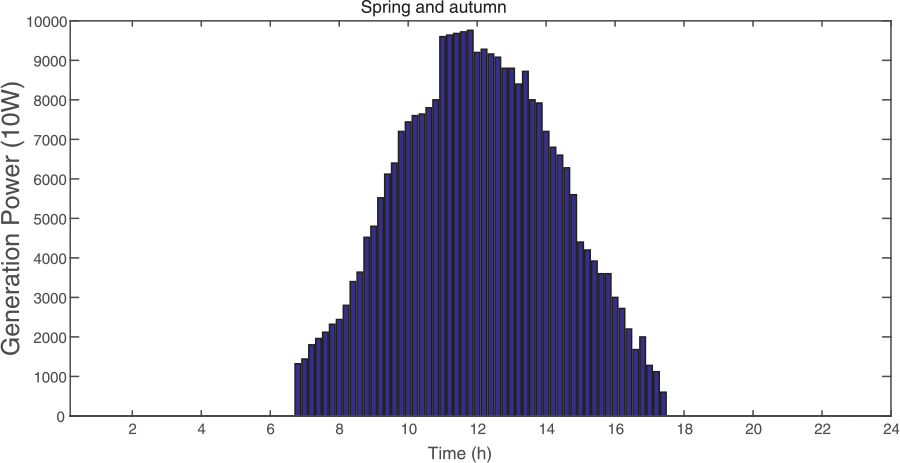
Real photovoltaic generation in spring and autumn.
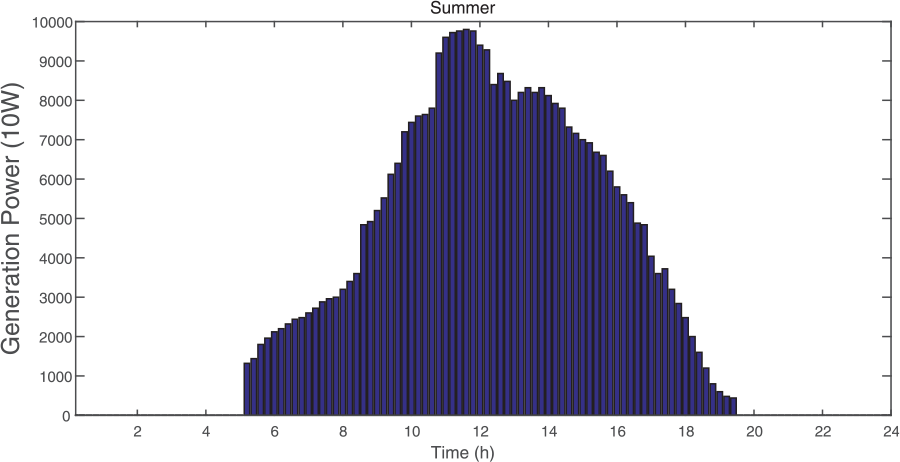
Real photovoltaic generation in summer.
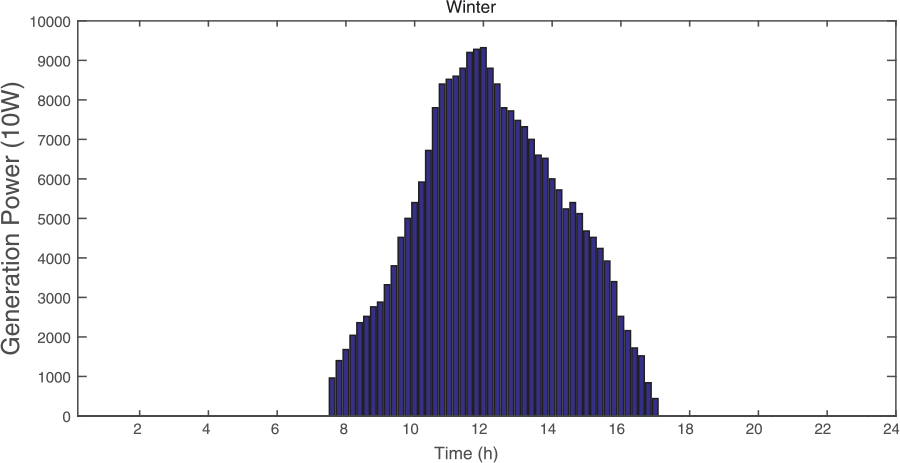
Real photovoltaic generation in winter.
The prediction performance of MPC optimization in PV generation is proved by the comparison between real PV generation and predicted PV generation by MPC. From Figures 7 to 12, the proposed MPC with feedback correction has a higher performance than the strategy without prediction. The MPC with feedback correction can approximate the real PV generation in the four seasons, so performance of the proposed MPC optimization is verified.
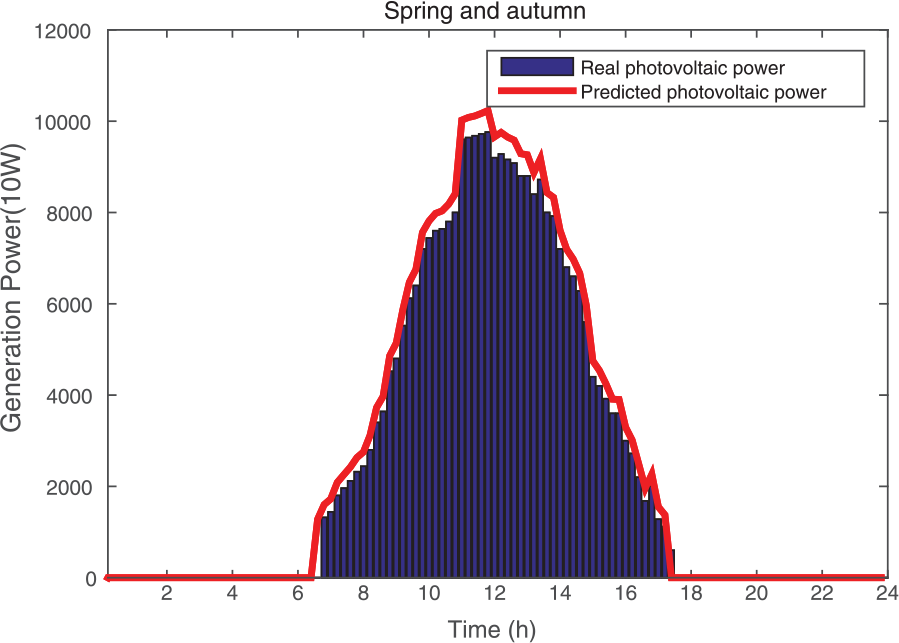
Performance of photovoltaic generation prediction without feedback correction in spring and autumn.
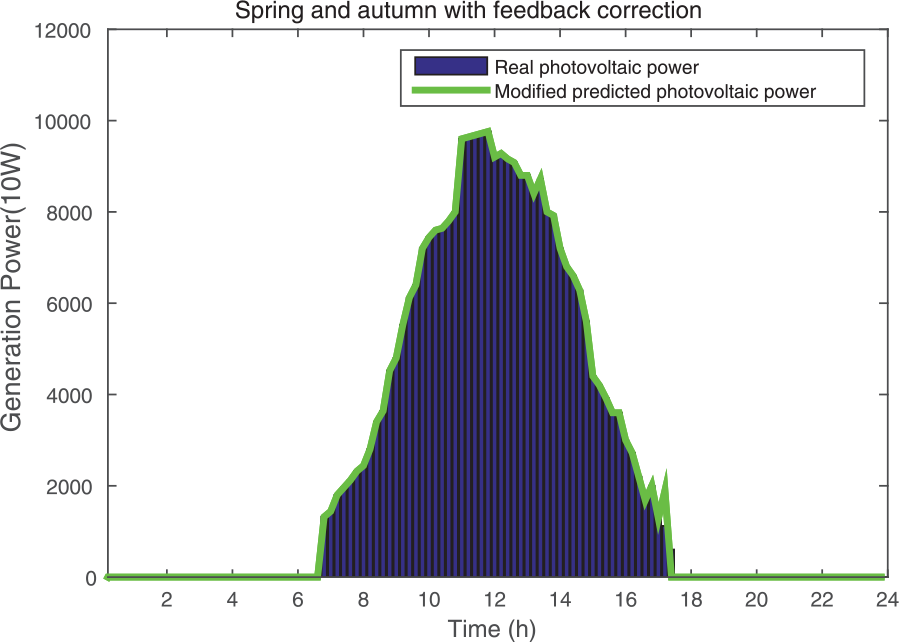
Performance of modified photovoltaic generation prediction with feedback correction in spring and autumn.
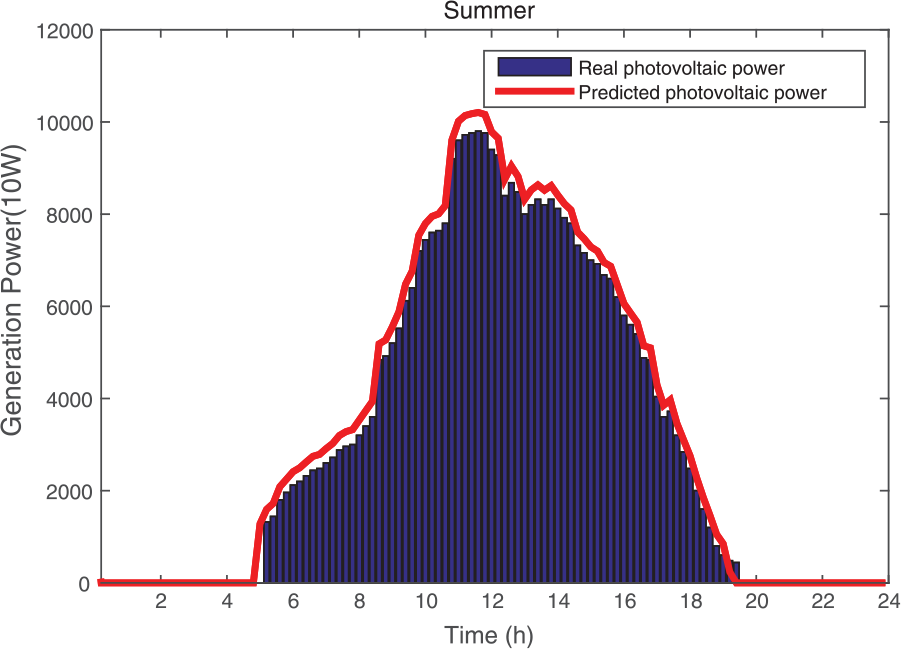
Performance of photovoltaic generation prediction without feedback correction in summer.
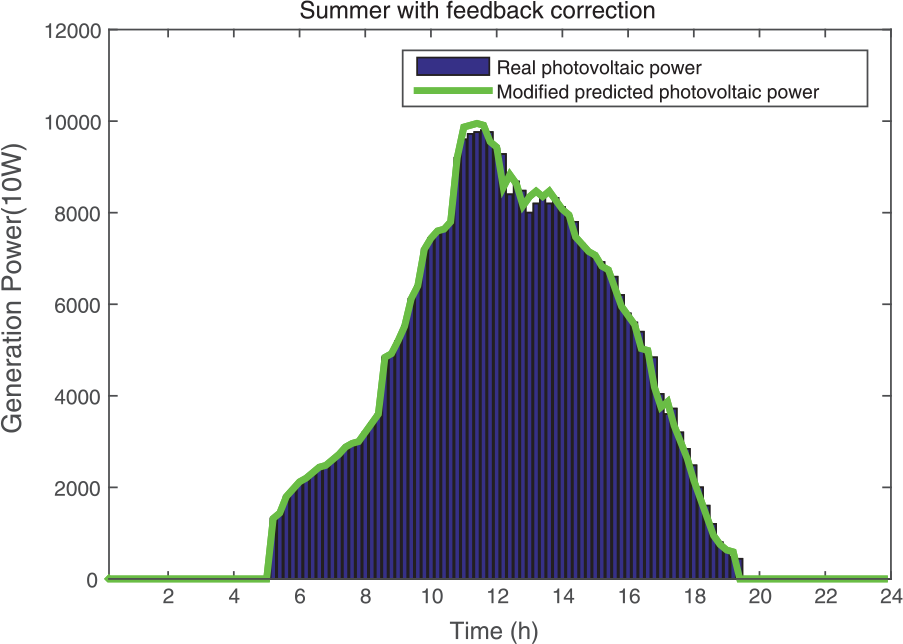
Performance of modified photovoltaic generation prediction with feedback correction in summer.
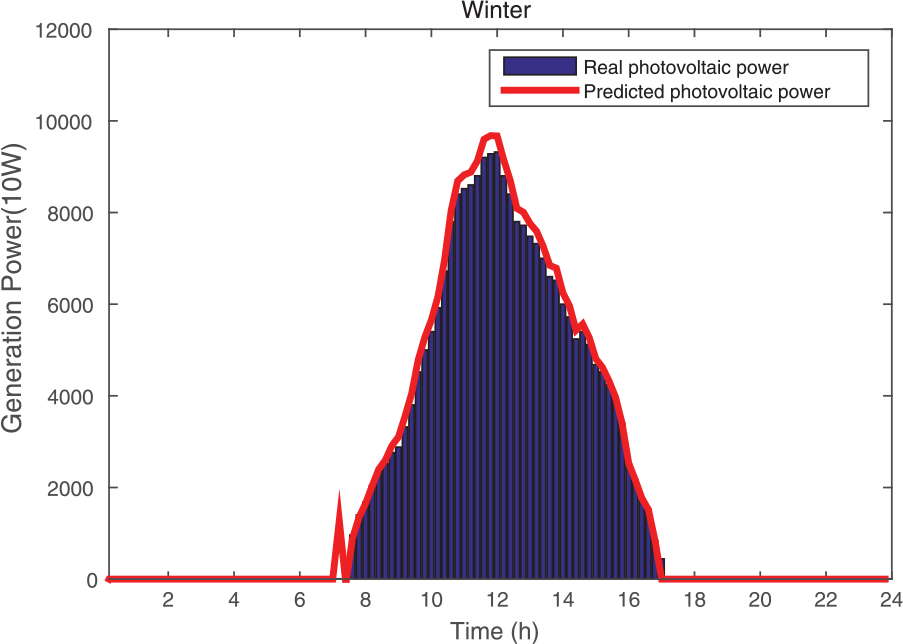
Performance of photovoltaic generation prediction without feedback correction in winter.

Performance of modified photovoltaic generation prediction with feedback correction in winter.
MPC optimization performance of wind turbine generation prediction
The wind turbine generation is related to the wind speed. The prediction of its generation is shown in equation (8). The predicted speed is obtained from the PLC network. The cut in speed, cut out speed and rated speed of the wind turbine are

The MPC optimization performance of wind turbine prediction is proven by figures that are from Figures 13 to 15. There are seven wind turbines in this simulation, and from Figures 13 to 15 only present the averaged power value of one wind turbine. The relationship between the power and speed of the wind turbine is shown as in Figure 13. The prediction performance of the MPC with feedback correction in Figure 15 is better than the one without feedback correction in Figure 14, so the proposed MPC optimization with feedback correction can make the prediction of wind turbine power follow the real wind power generation.
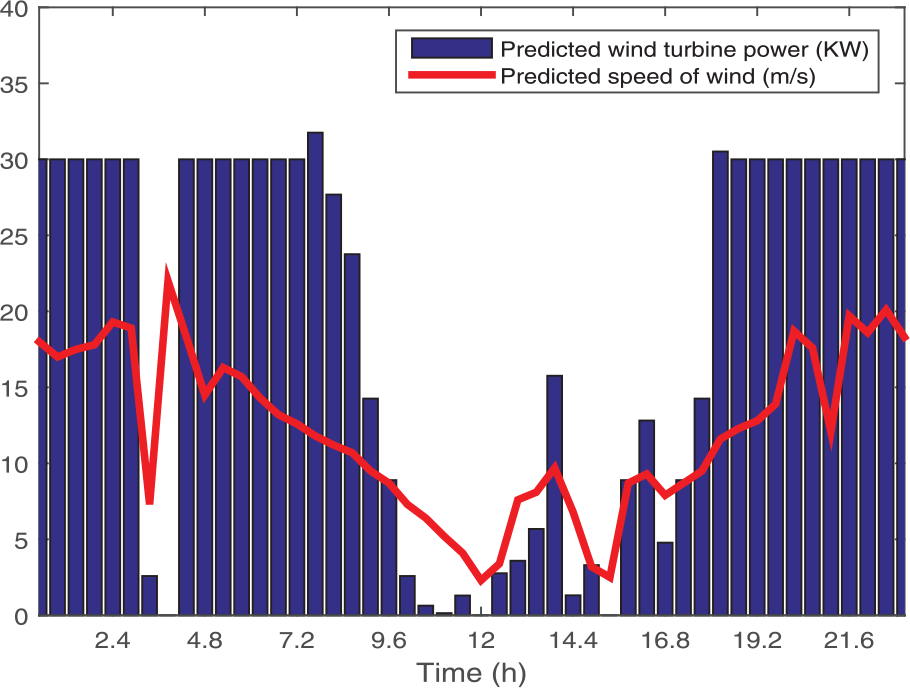
The relationship between predicted wind turbine generation and the predicted speed of the wind.
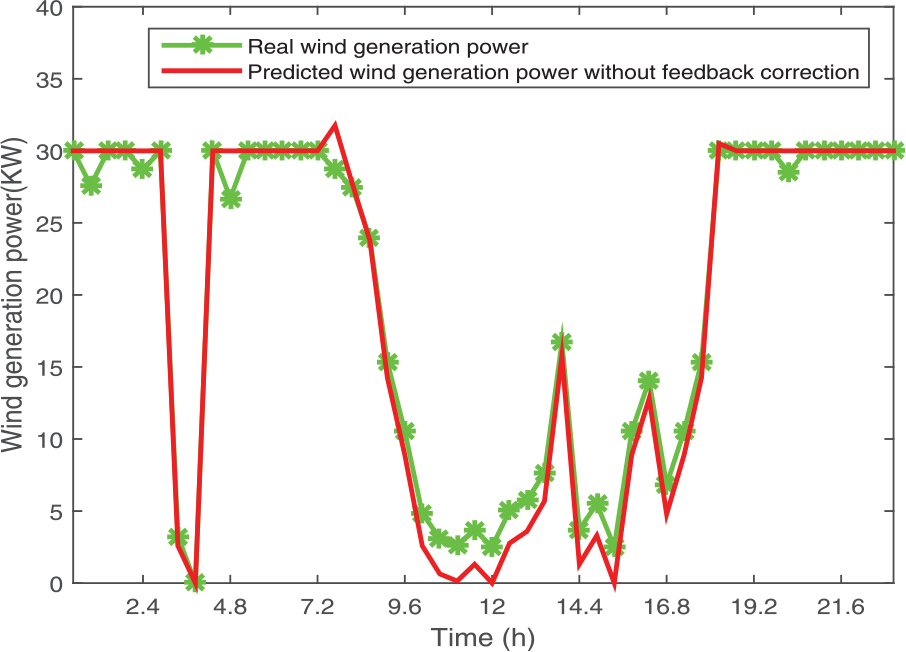
The comparison between the real value and predicted value of one wind turbine without feedback correction.

The comparison between the real value and predicted value of one wind turbine with feedback correction.
MPC optimization performance of load prediction
The loads considered in the microgrid simulation are residential electricity, tourist electricity and a 50 t desalted water system which can desalt 50 t water in 1 h. The period from 11:00 to 13:00 is the valley period of the LPG electricity and the photovoltaic generation usually has high values in this period, so the 50 t desalted water system should run from 11:00 to 12:00. The maximum loads in the period from 11:00 to 12:00 are supposed to be 1570 kW, because the 50 t desalted water system needs 1020 kW power. The permanent population in the island is about 50, so the residential electricity is about 250 kW. The tourist electricity is about 300 kW. The maximum loads in other periods are supposed to be 550 kW, which is shown as in Figure 16.
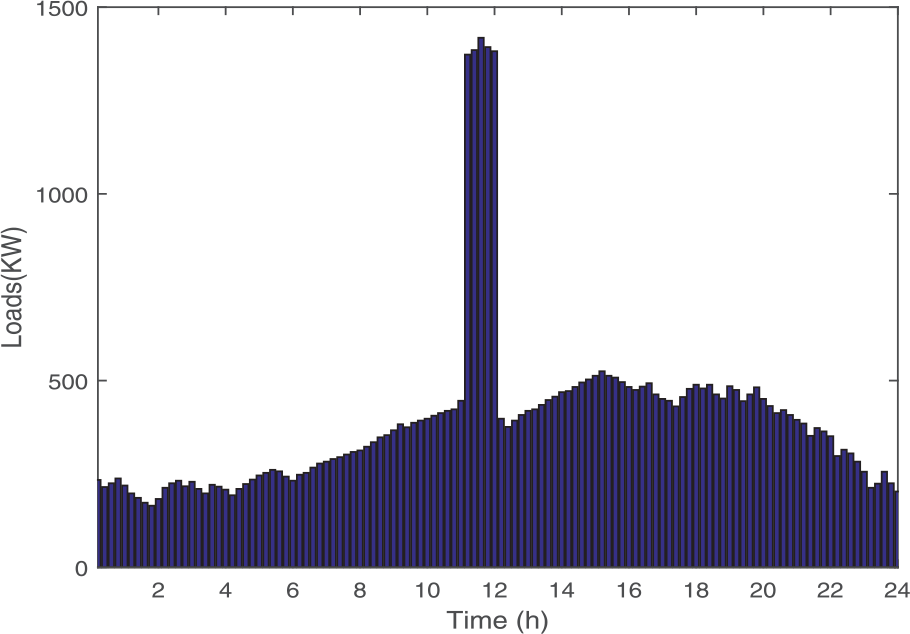
The real loads of the microgrid simulation with the 50 t desalted water system.
Because the power of the 50 t desalted water system almost has fixed power, the prediction of loads only need to estimate the loads without the 50 t desalted water system. Therefore, the performance of the simplified loads prediction without correction is shown in Figure 17. The MPC optimization performance of the load prediction is proven by Figures 17 and 18. The prediction performance of MPC with feedback correction in Figure 18 is better than the one without feedback correction in Figure 17, so the the proposed MPC optimization with feedback correction can make the prediction of loads approximate the real loads.
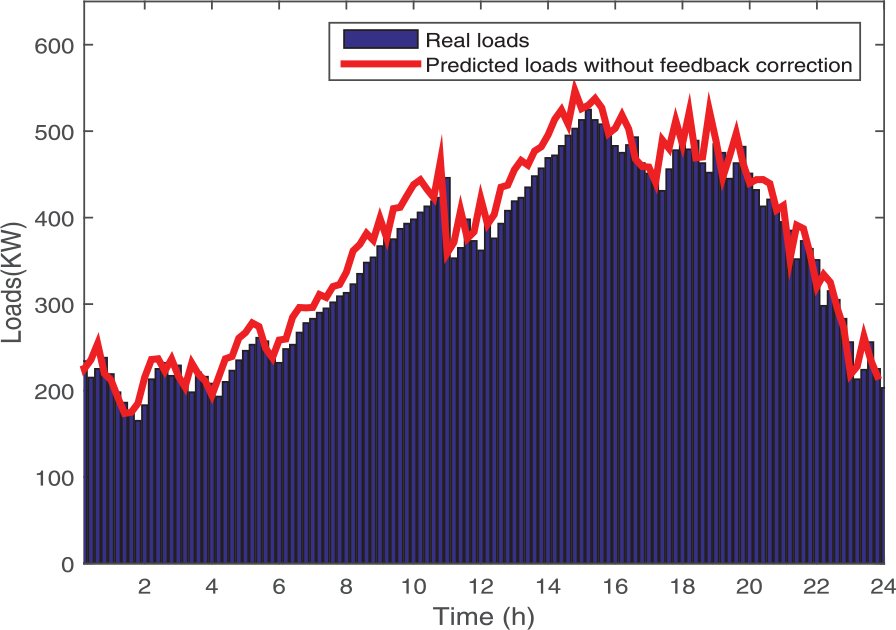
The comparison between the real value and predicted value of simplified loads without feedback correction.
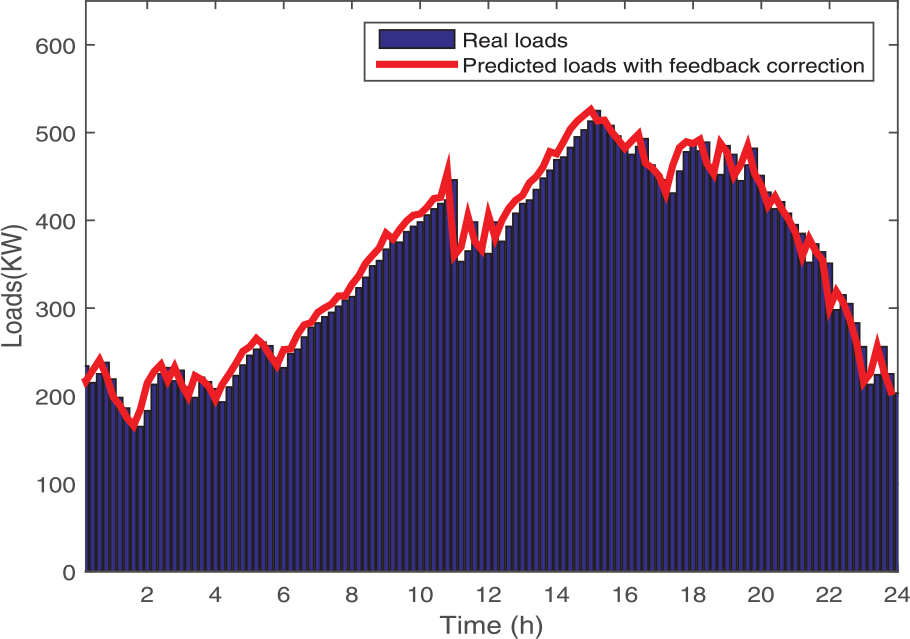
The comparison between the real value and predicted value of simplified loads with feedback correction.
Performance of the microgrid energy optimization dispatch by MPC
The energy optimization dispatch by MPC aims to minimize the cost of the microgrid system. The parameters of operation and maintenance for the microgrid are listed in Tables 2 and 3, respectively. Because RESs are uncontrollable, the optimization is mainly controlled by the control signal Pmt. The optimization dispatch is related to the plan for micro gas turbine generation power and the exchanged power from the LPG and battery.
Electricity price in the Zhejiang province (State administration of commodity prices, in Zhejiang province, January 8, 2016).

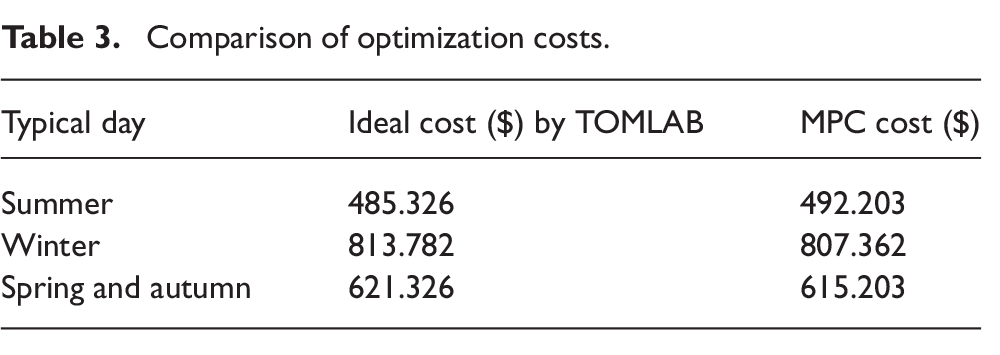
Comparison of optimization costs.
Supposing the best time for running the 50 t desalted water system is between 11:00 and 12:00 and the power of the 50 t desalted water system is fixed, the load of the desalted water system can be ignored in the energy optimization dispatch by MPC.
As shown in Figure 19, when the required energy is negative, the RES generation can provide enough power for microgrid operation and the extra power of RES generation is sent to the battery or the LPG. When the required energy is positive, the RES cannot supply enough power for microgrid operation and the microgrid needs to get power from the micro gas turbine, battery or LPG. The simulation results show that RES generation can provide enough power during midnight and the maximum requirements are from 14:00 to 19:00.
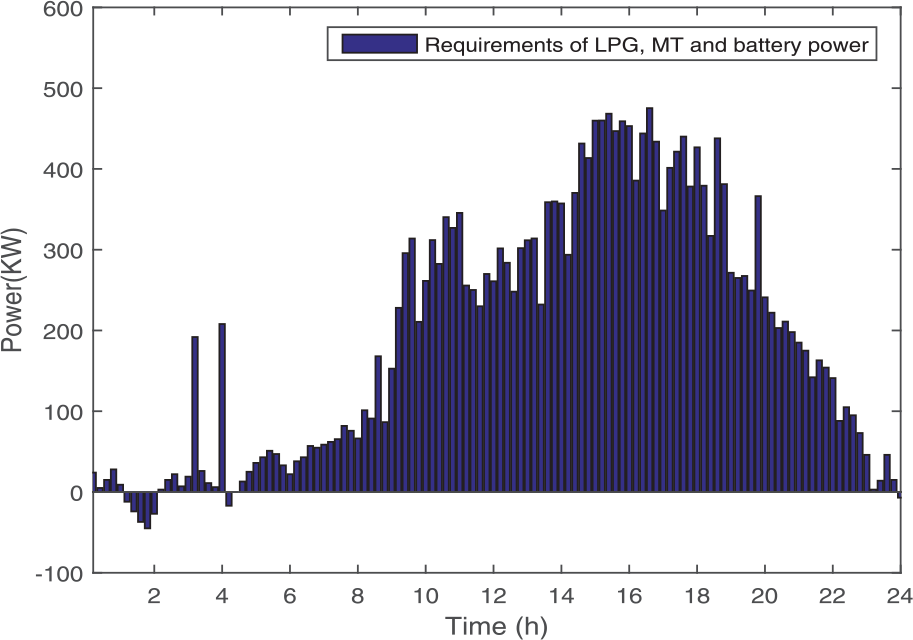
The power requirements of micro gas turbine power, battery and electricity power from the LPG.
The MPC optimal energy dispatch results are shown as in Figure 20 and Figure 21. To supply enough power for microgrid generation and have minimum costs, the electricity power from the LPG provides the most percentage power of the valley period in Table 2 and the micro gas turbine provides most power of the peak period in Table 2.
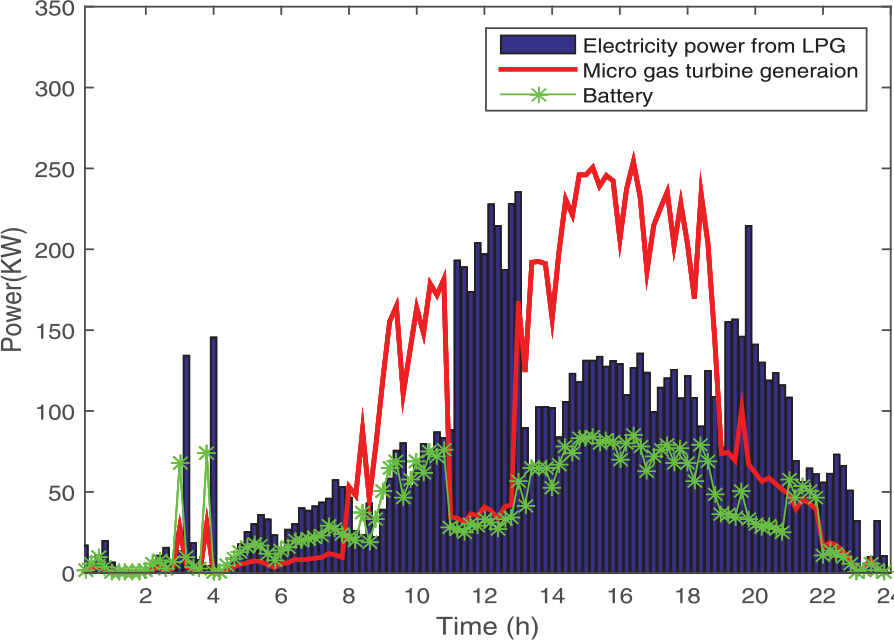
The results of MPC optimal energy dispatch.

The total optimal dispatch of microgrid energy and loads.
TOMALB is one of the most powerful optimization tools in MATLAB. The costs of the proposed MPC strategy is compared with the optimal costs calculated by TOMALB in Table 3, which proves the correction and performance of the proposed MPC optimal energy dispatch for the microgrid. The costs of the 50 t desalted water system are considered in Table 3.
Conclusion
An MPC strategy with feedback correction is proposed in this paper for the energy optimization dispatch of a networked microgrid. PLC serves as the communication network in a microgrid containing PV, wind turbine power and micro gas turbine generation. The prediction model of PV and wind power generation is based on weather forecast information transmitted by the PLC network. The loads in the microgrid are predicted by ARIMA. Based on the prediction models of generation and loads, the rolling optimization part of MPC aims to minimize the cost of the microgrid. As the only controllable generation in this microgrid, the control strategy of the micro gas turbine generation is important. Therefore, the dispatch strategy of the micro gas turbine, electricity power from the LPG system and battery, need to be iteratively optimized in the rolling optimization and feedback correction parts of the MPC. In the feedback correction part of the MPC, the prediction results are compared with the real value and the prediction errors of generation and loads are also predicted by the GM(1,1) model. The estimation of the prediction errors of the loads and generation is added into the prediction model to get a more accurate prediction value. With the feedback correction, the most optimal energy dispatch will be obtained. Finally, the simulation is applied in a hypothetical microgrid of the island in Zhejiang, China and the performance of MPC energy optimization dispatch is proven.
Footnotes
Declaration of conflicting interest
The author declares that there is no conflict of interest.
Funding
This work is supported by the National Natural Science Foundation of China (grant number 61673178, 61272064), Shanghai Shuguang Project (grant number 16SG28), Shanghai Natural Science Foundation (grant number 17ZR1444700, 17ZR1445800), and Shanghai International Science and Technology Cooperation Project (grant number 15220710700).