






Abstract
The tough space environment has a great influence on the reliability of the measurement results owing to the rapidly aging sensor. Also, the measurement uncertainty caused by the random factors seriously affects the accuracy of the sensor. Aiming at the multidimensional dynamic uncertainty problem of the six-axis force measurement, a six-axis force sensor for docking system is presented based on the piezoelectric force sensing element. The decoupling algorithm of the six-axis force sensor is proposed. Grey prediction model is employed to establish the dynamic uncertainty model in single channel. Residual test, correlation test and posterior error test are conducted to verify the reliability of the prediction model. The multidimensional dynamic uncertainty model of the six-axis force sensor is derived by combination of the decoupling algorithm and the dynamic uncertainty in single channel. The multidimensional dynamic uncertainty model of the six-axis force sensor can avoid the error signals for the force feedback control in the space environment, and the model can also be employed for the measurement of six-axis force in any other harsh conditions.
Keywords
Introduction
Peripheral type docking mechanism is usually used for spacecraft. And the docking mechanism may be damaged for large impact force. So, the six-axis force of the docking mechanism should be measured to release the impact force. Different types of six-axis force sensor have been developed in recent years. Yao et al. (2015, 2016) proposed a fully pre-stressed dual-layer parallel six-axis wrist force sensor, whose force isotropy index was analyzed. Yuan et al. (2015) developed a six-axis force sensor with using rectangular cross-sectional beams to measure forces and moments exerted on humanoid robot foot for controlling the robot. Sun et al. (2015) designed a six-axis force/moment sensor with through-hole beam for the space robot, and the nonlinearity, repeatability, stability, hysteresis, sensitivity and accuracy were analyzed. Wang et al. (2012) proposed a fully pre-stressed dual-layer six-axis force/moment sensor based on a modified Stewart platform architecture, and the measurement error in all the directions was discussed. Kang et al. (2014) presented the design optimization of a mechanically decoupled six-axis force/moment (F/T) sensor by minimization of cross coupling error. Mastinu et al. (2011) and Gobbi et al. (2011) presented a high precision six-axis load cell with a three spoke structure, the error analysis including linearity, sensitivity, accuracy and repeatability was conducted. Wang (2013) developed a novel six-axis force sensor combined parallel plate structures and one-block structure for wind tunnel model test, and the sensitivity design error, the relative measurement error and the interference error were given. Shi et al. (2012) proposed a new large range flexible joints 6-UPUR six-axis force sensor. The influences of system noise, calibration matrix errors, processing and installation errors, structural deformation on the platform, hydraulic loading system and data acquisition system errors were discussed. As above, researches on the six-axis force sensor were always focused on the structure and the deterministic error. The multi-dimensional dynamic uncertainty of the six-axis force sensor has been lacking investigation. However, the space environment is so bad that the reliability of the measurement results will be reduced. The measurement uncertainty caused by the random factors seriously affects the accuracy of the six-axis force sensor. Therefore, the multi-dimensional dynamic measurement uncertainty of the six-axis force sensor should be considered.
In this paper, a piezoelectric six-axis force sensor for the docking system is presented. Also, the decoupling algorithm of the six-axis force sensor is proposed. Grey system model is employed to predict the dynamic uncertainty of each channel. Residual test, correlation test and posterior error test are conducted to verify the reliability of the prediction model. Combining the decoupling algorithm with the dynamic uncertainty in single channel, the multidimensional dynamic uncertainty of six-axis force sensor is deduced.
Establishment of the measurement system
Peripheral docking mechanism is shown in Figure 1, and four three-axis force sensors are arranged in the docking ring. The six-axis force can be calculated according to the decoupling algorithm by the measurement values of the four three-axis force sensors.
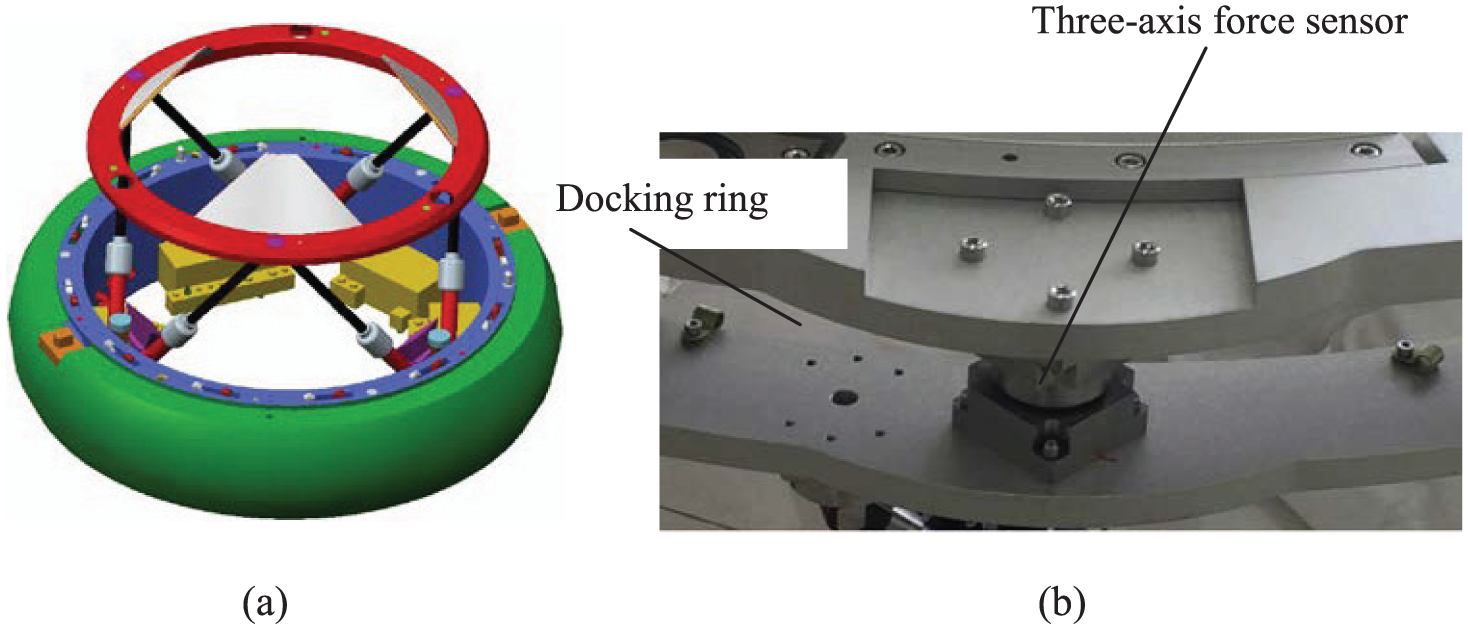
Structure of docking ring with force sensors. (a) Peripheral docking mechanism; (b) Local enlarged drawing of the docking ring.
The entire measurement system architecture is shown in Figure 2. The charge signals in 12 channels are amplified and converted to voltage signals by the charge amplifier. Also, the voltage signals are received by the data acquisition card.
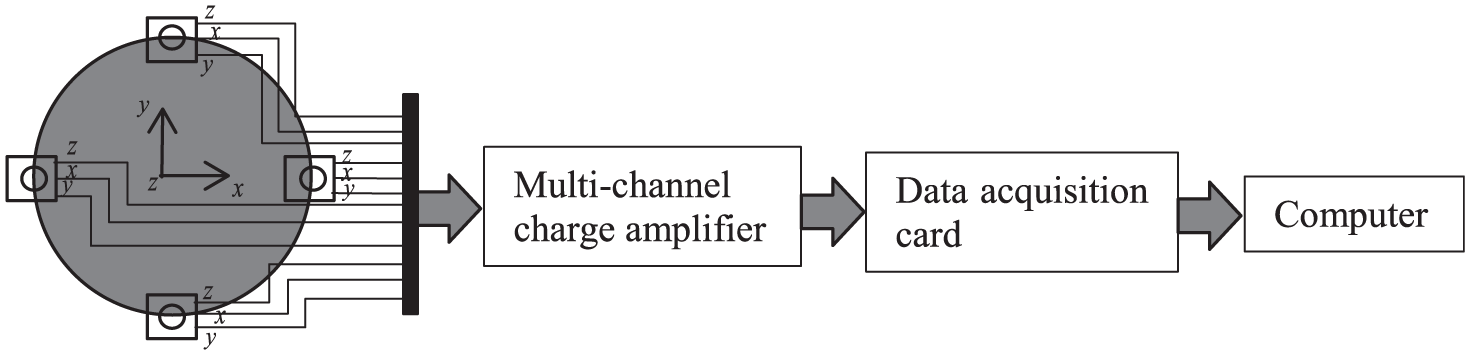
The entire measurement system architecture.
Multidimensional dynamic uncertainty of the six-axis force sensor
Piezoelectric type six-axis force sensor is a complex dynamic measurement system, and it is difficult to establish an accurate mathematical model of multidimensional dynamic measurement uncertainty. Therefore, the complex modeling process of the multidimensional dynamic measurement uncertainty can be completed by three steps:
The relationship between the six-axis force and the forces in 12 channels is presented by the decoupling algorithm.
The measurement uncertainty in single channel is deduced by grey prediction model.
Combining the decoupling algorithm of the six-axis force with the grey prediction model of single channel, the multidimensional dynamic measurement uncertainty can be evaluated.
The decoupling algorithm of the six-axis force sensor with spatial layout
The six-axis force sensor is composed of four three-axis force sensors, whose spatial layout are shown in Figure 3. O-XYZ is the coordinate system of the six-axis force sensor center. Also, four three-axis force sensors are evenly distributed around the center axis of the six-axis force sensor.
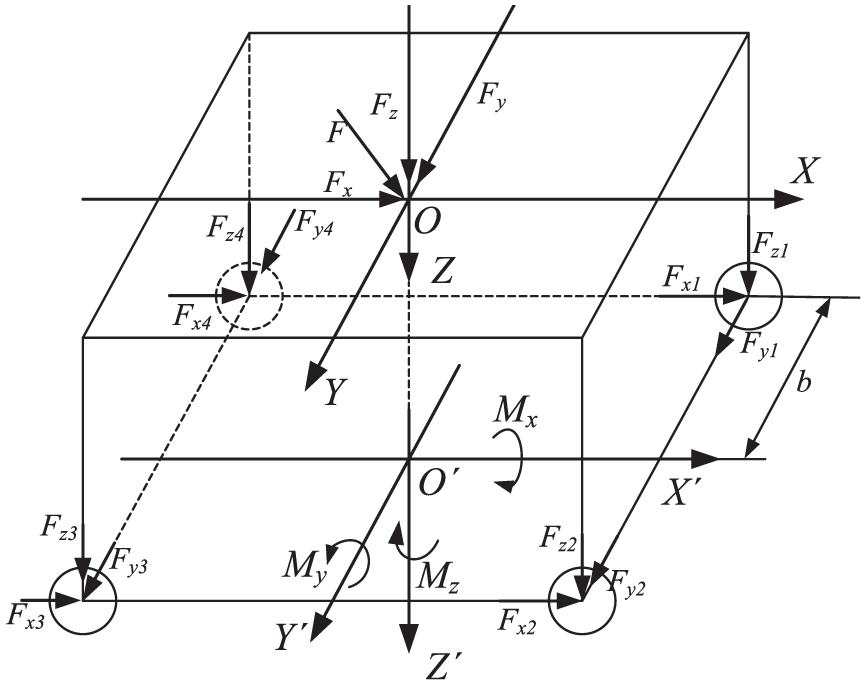
Four points layout of the three-axis force sensor.
If the force vector
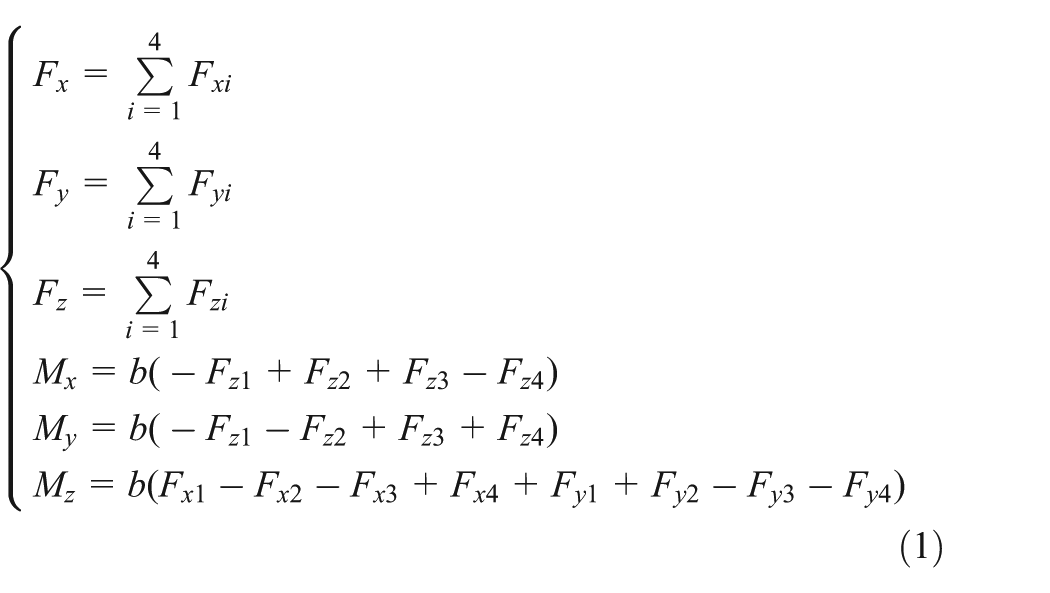
where, b is the projection distance between the center of the three-axis force sensor and the X or Y axis.
Dynamic measurement uncertainty model of single channel in the six-axis force sensor
All the data are acquired without load on the six-axis force sensor because the measurement value drift of the force sensing element is only considered, and other errors will be taken if the sensor is loaded. However, the drift value may be positive or negative. And GM(1,1) model employed to predict the measurement uncertainty is not suitable for the data less than zero. Then the constant 100 is added to each measurement value for the convenient calculation. Also, the constant 100 will be subtracted during the process of obtaining the uncertainty. Each channel is measured once every minute in 10 minutes. The 12 channels signal can be denoted as
10 Groups measurement data in 12 channels.

Establishment of grey prediction model GM(1,1)
(1) Generation of the accumulative sequence and verification of the applicability
Suppose the number of the measurement value is n before time t, and the data sequence is denoted as

Resample data sequence

where,

where,
According to the GM(1,1) model, the accumulated sequence of resampling data sequence

where,
If
For the six-axis force sensor, the resampling data series of the measurement value of
Data sequence of

Test formulas for quasi-smooth property and quasi-exponential law are used to test the fitness of

Substitute
Test formula of quasi-exponential law is as follows

Substitute
Then
In order to smooth the data sequence, consecutive neighbor sequences of

where,
The differential equation of GM (1,1) grey prediction model is as follows

Equation (9) is discretized, and then the discretized grey prediction model can be expressed as

Set

According to the principle of least residual square sum, parameters a and u can be obtained as follows

Substitute a and u into equation (10), the discretized grey prediction model is as follows

According to equation (13), data sequence
Then predicted value of

According to equation (14), the predicted value of
Test of the prediction accuracy
The precision test should be conducted before the grey prediction model is used to predict the data sequence. The most common test methods for prediction precision are the residual difference test, correlation test and posterior-variance-test.
(1) Residual test
Relative residual and average relative residual of the prediction model can be expressed as


where,
Substitute the data sequence
Residual test.

Table 3 shows that the maximum of relative residual is 0.0008%, and the average relative residual is 0.00029%.
(2) Test of correlation
Grey relational analysis is the similarity comparison of the predicted data sequence curve and the original data sequence curve. The correlation between the corresponding sequences is large if the two curves are close.
The resampling data sequence is denoted as

And the prediction data sequence is denoted as


where,
Then the grey correlation degree is as follows

The greater the correlation degree, the higher the prediction accuracy.
In equation (19), the parameter
Grey correlation coefficient.

According to equation (20), the grey correlation degree
(3) Test of posterior error
Test of posterior error includes standard deviation ratio C and probability of small deviation p, which can be expressed as


where,
Then the standard deviation ratio C of the two data sequences can be obtained as follows

Values
Value of

According to Table 5, all the value of
The accuracy of the model.

The above precision tests show that the grey prediction model
Dynamic drift prediction model of single channel

The uncertainty prediction sequence can be obtained from the measurement value prediction sequence as follows


Under the confidence level P, the estimation interval can be denoted as

where,
Then the extended uncertainty of the measurement value can be expressed as

Comparison of the grey prediction model with the bootstrap sample method
To verify the feasibility of the grey prediction model for the dynamic uncertainty, the traditional bootstrap sample method is used to obtain the uncertainty in single channel. Then the result is compared with the grey bootstrap model.
The measurement value sequence in any channel can be expressed as

where,
Resampling is conducted with putting back in equal probability, and the number of measurement values is n in each resampling sample. And B groups bootstrap samples are obtained after resampling in B times, and then the bth bootstrap sample can be expressed as Efron (1979)

The mean value of the bootstrap sample can be calculated as

Then a bootstrap sample with B groups of samples can be obtained as

The following process of calculating the uncertainty is the same as equations (26) to (28). Then the uncertainties with different confidence levels can be obtained in Table 7.
Uncertainties of 12 channels with bootstrap sample method.

To compare with the results of bootstrap sample method, B group data can be obtained from the grey prediction model at time k, which is expressed as

According to equations (26) to (28), the uncertainty of the 12 channels will be calculated. And then the uncertainties from the two different methods are compared. Figure 4 shows the relationship of confidence interval and uncertainty with bootstrap sample and grey prediction model method. Results show that the uncertainties obtained from the two methods are closed. However, the greatest advantage of the grey prediction method is the ability of prediction, which is not provided by the bootstrap method.
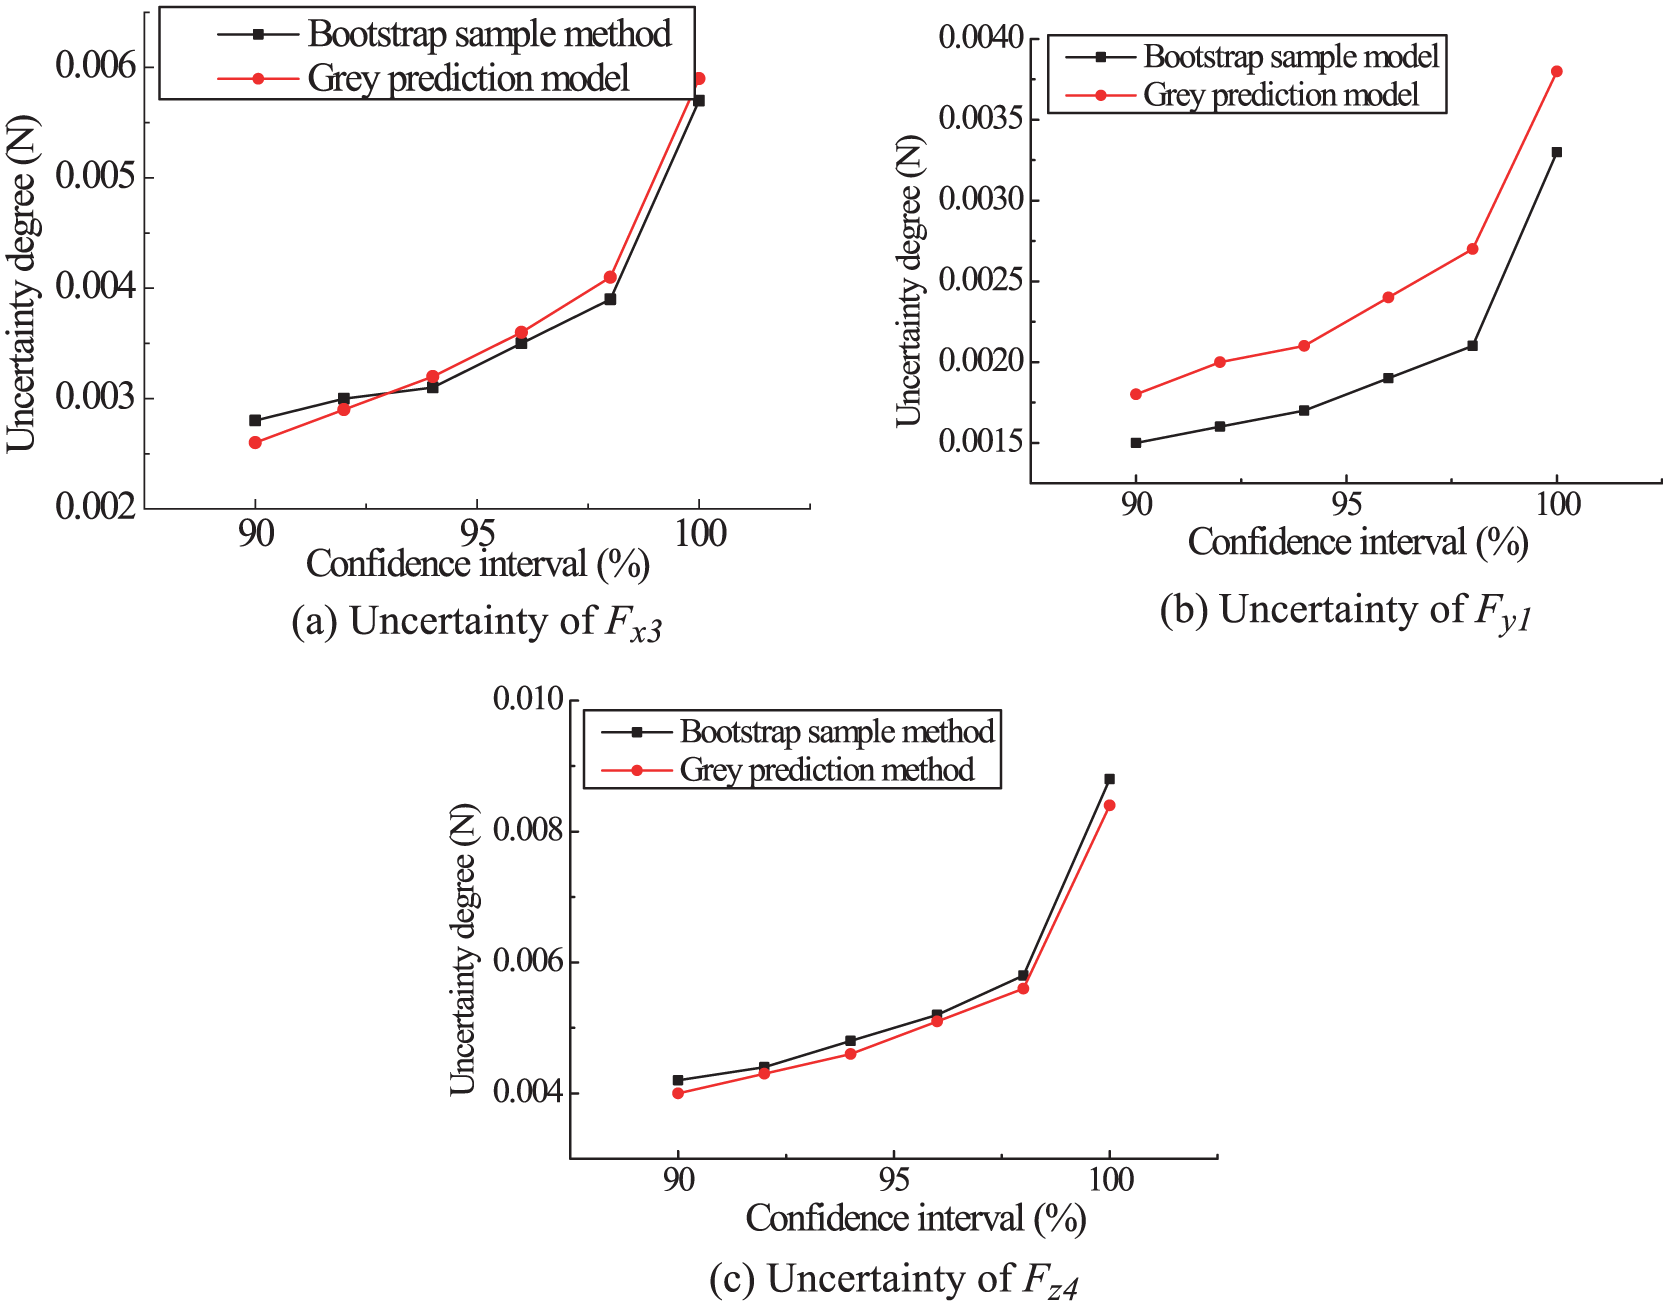
Comparison of the bootstrap and GBM method.
Dynamic measurement uncertainty model of single channel
According to the comprehensive analysis of the measurement system error sources, the dynamic error model of the measurement system is obtained as Xie (2003)

where,
According to the synthesis principle of measurement uncertainty, the dynamic uncertainty of the measurement system is expressed as

where,
The six-axis force is composed of signals in 12 channels in this measurement system. So, the combined uncertainty of the six-axis force sensor can be obtained by combination of the uncertainty in each channel. The uncertainty in the ith


The prediction uncertainty of the 12 channels.

Resolution of the piezoelectric six-axis force sensor is
Substitute
Combination of the multidimensional dynamic uncertainty
A major problem of the measurement uncertainty is propagation of the uncertainty. The multidimensional uncertainty propagation type is more complex than one dimension. The multidimensional uncertainty can be expressed as

where,
For the six-axis force sensor, the output vector is

The relationship between
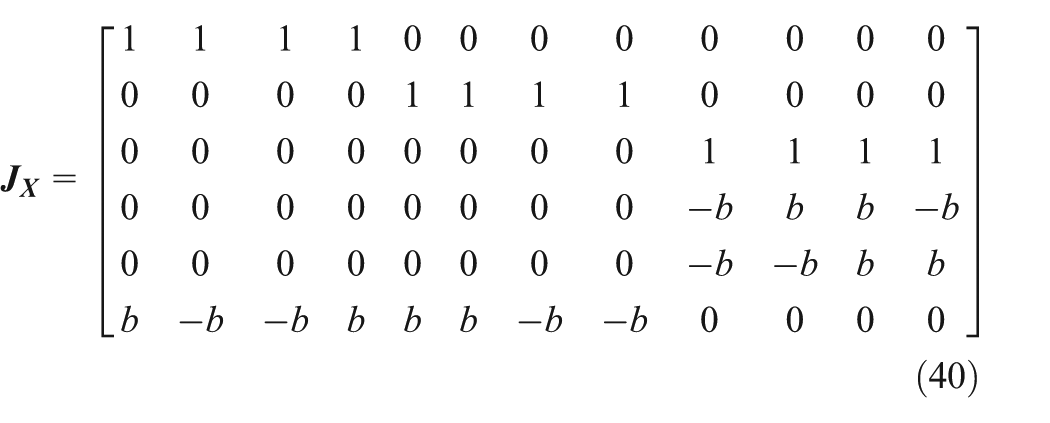
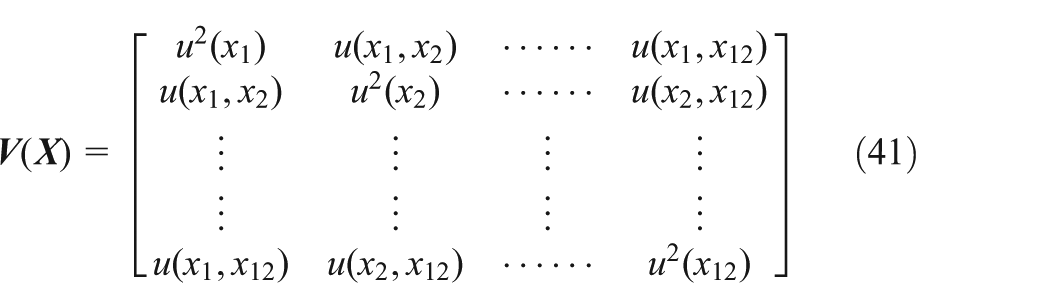
Then the uncertainty covariance matrix of 12 channels can be expressed as
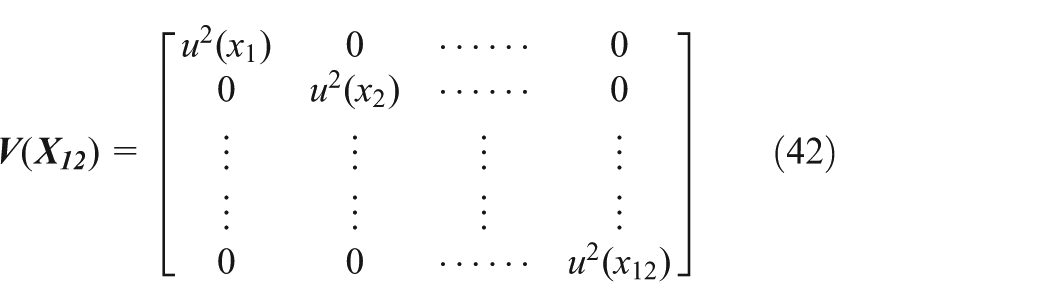
The measurement signals in 12 channels are independent of each other, so the covariance between them is 0. Then the uncertainty of the covariance matrix can be simplified as
Substitute equation (39) and equation (42) into equation (38), the multidimensional measurement uncertainty of the piezoelectric six-axis force sensor can be calculated as follows
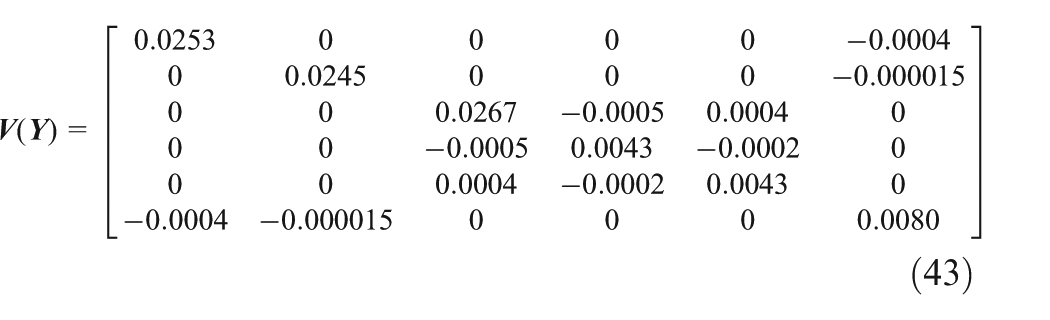
The diagonal elements mean the auto-uncertainty of force and moment, and the non-diagonal elements mean the cross-uncertainty of the force and moment.
Conclusions
A piezoelectric six-axis force sensor for docking system is proposed. The relationship between the six-axis force and the forces in 12 channels is presented by the decoupling algorithm. Also, a single channel dynamic uncertainty prediction model based on the grey theory is established. The reliability of the prediction model is verified by the residual test, correlation test and posterior error test. Comparison between traditional bootstrap samples method and the grey prediction model is conducted, which verifies the feasibility of the grey prediction model. Finally, multidimensional dynamic uncertainty of six-axis force sensor is obtained by the combination of the decoupling algorithm and the dynamic uncertainty components in each channel. This will provide an important reference for the future development of the six-axis force sensor used under harsh conditions.
Footnotes
Declaration of conflicting interest
The authors declare that there is no conflict of interest.
Funding
This work was financially supported in part by National Natural Science Foundation of China (No.51105050) and Scientific research project of Liaoning education department (JDL2016027).