
Abstract
This paper sums up the developments and achievements of optical methods in the field of dissolved carbon dioxide measurement based on past work. The dissolved CO2 measurement in optical methods is highly applied owing to high sensitivity, fast response and greater versatility with more attention people paid to greenhouse effect. In this article, the measuring is mainly partitioned into fluorescent methods, spectrometric methods and specific optical methods like evanescent field method. Principles, characteristics and structures in previous research are described in detail and our own ideas and perspectives in tendency of dissolved carbon dioxide sensing are emphasized lastly.
Introduction
Carbon dioxide plays an extremely significant role in the balance of ecosystems, cycle of marine biochemistry, and regulation of ambient temperature (Park and Day, 2007; Sabine et al., 2004; Taro et al., 2002). At the same time, the dissolved carbon dioxide in oceans and lakes regulates not only the pH value of seawater, but also the carbon cycle among the biosphere, lithosphere, atmosphere and ocean, as shown in Figure 1.
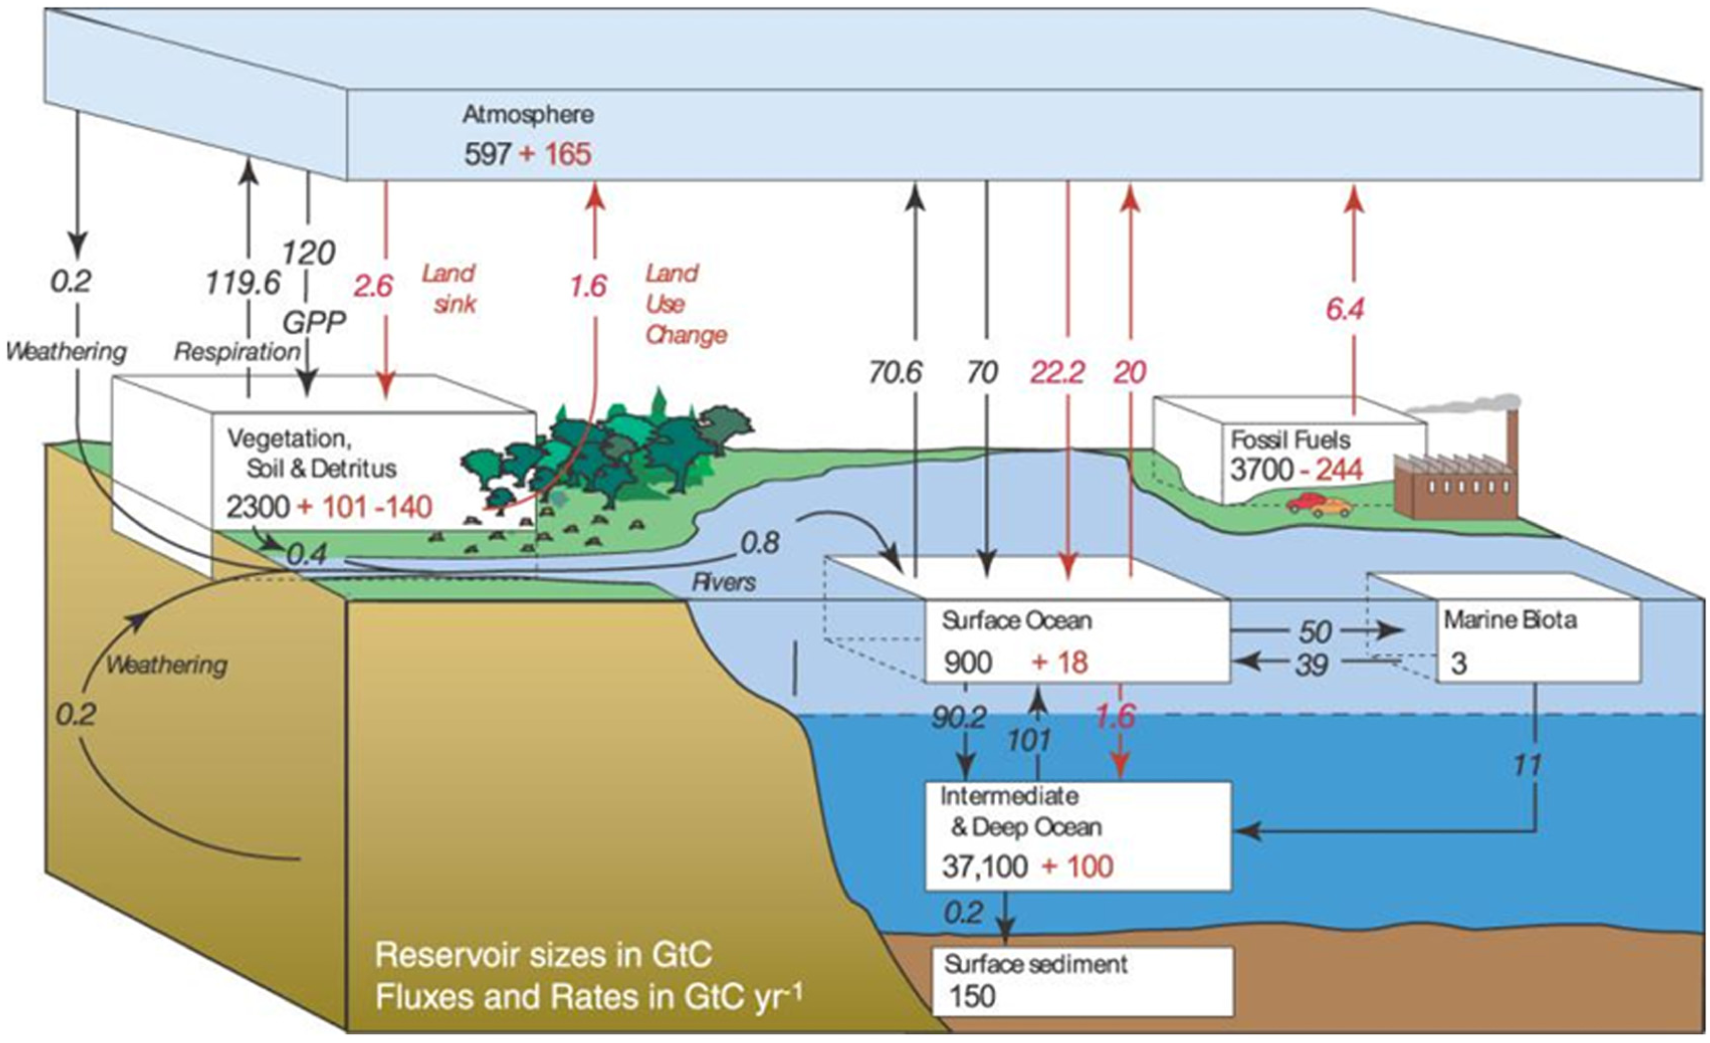
Schematic diagram of carbon cycle (http://uzone.univs.cn/school_2119.html).
The main forms of carbon dioxide consist of dissolved carbon dioxide (dCO2) and gaseous carbon dioxide. Dissolved carbon dioxide exists in the oceans, lakes, industrial production and even the human body (Cheng et al., 2013; Shimoda et al., 2001). It is essential to plants photosynthesis and growth of animals, and efficient to industry productivity related to the biochemical process. Furthermore, dissolved carbon dioxide in blood institutes can reflect physical health status of respiratory system and metabolism (Cheng et al., 2011; Qiu et al., 2015). However, ecology of the planet is severely chewed up by fossil fuels burning and illegal logging since the industrial revolution. According to recent reports, the marine pH has declined from 8.2 to 7.9 owing to excessive dissolution of carbon dioxide in water, and marine life is facing the danger of becoming extinct owing to severe corrosion by sour seawater (Silverman et al., 2009; Taro et al., 2014). Therefore, it is so urgent to clarify the current development of dissolved carbon dioxide monitoring technology, then we can develop an efficient way that applies to the global condition.
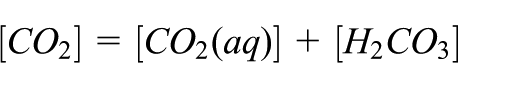
After CO2 is dissolved in water, there are four forms of inorganic carbon that exist: CO2(aq), H2CO3, HCO3- and CO32-. CO2(aq) and H2CO3 are chemically separated (Dickson et al., 2003), their sum constitutes the “free carbon dioxide”, that is dissolved carbon dioxide [CO2]. The concentration is expressed as
In previous detections of dissolved carbon dioxide concentration, the measurements are frequently calculated indirectly by pH of the solution, acid-base strength and some other parameters.
When the pH value of solution is kept in the range of 4.4-8.2, the equilibrium between carbon dioxide and carbonate ions is maintained. When the pH value is 4.4, all the alkaline substances are carbon dioxide. When the pH value is 8.2, the alkaline substances are bicarbonate (Takahashi et al., 2014). The pH online tester or pH test paper can be used to directly obtain the solution pH. This method is easy to operate, which just needs basic experimental conditions. However, the lack caused by environmental factors like large temperature drift, long measuring period and poor instance limit the application of this method when precision request is high (Beuvier et al., 2014).
Electrode method is a kind of early method to measure the concentration of dissolved carbon dioxide directly. Electrode sensors are primarily modified by pH sensors. The most primitive dCO2 electrode emerged around the year of 1950, it was made of borosilicate glass fiber with poor performance and short life which led to inevitable errors. Severinghaus was typical electrode applied in dCO2 measurement (Ge et al., 2003; Severinghaus, 2004). To conquer these shortcomings, the work uses aluminum-silica glasses to replace borosilicate glass. Besides, the addition of Ag/AgCl reference electrode had greatly enhanced the detection accuracy of the electrode sensor (Cai and Sayles, 1996). In recent years, the research on electrode sensor has been carried out around such approaches.
Today, a variety of metal oxides are used as sensing electrodes, including ZnO electrodes, Al/Ag2S electrodes, Ir/IrO2 pH electrodes and inert metals (Shuk et al., 1996). Xie and Bakker (2013) proposed a new dCO2 sensor based on a tweezers-based selective membrane electrode for carbonate ionophores; the representation can be seen in Figure 2. A large number of reference materials based on liquid junctions were used. The experiment demonstrates that the sensor is faster than conventional dCO2 sensor, and the measurement results fluctuate around 0.8 mmol/L lower than the Severinghaus probe.
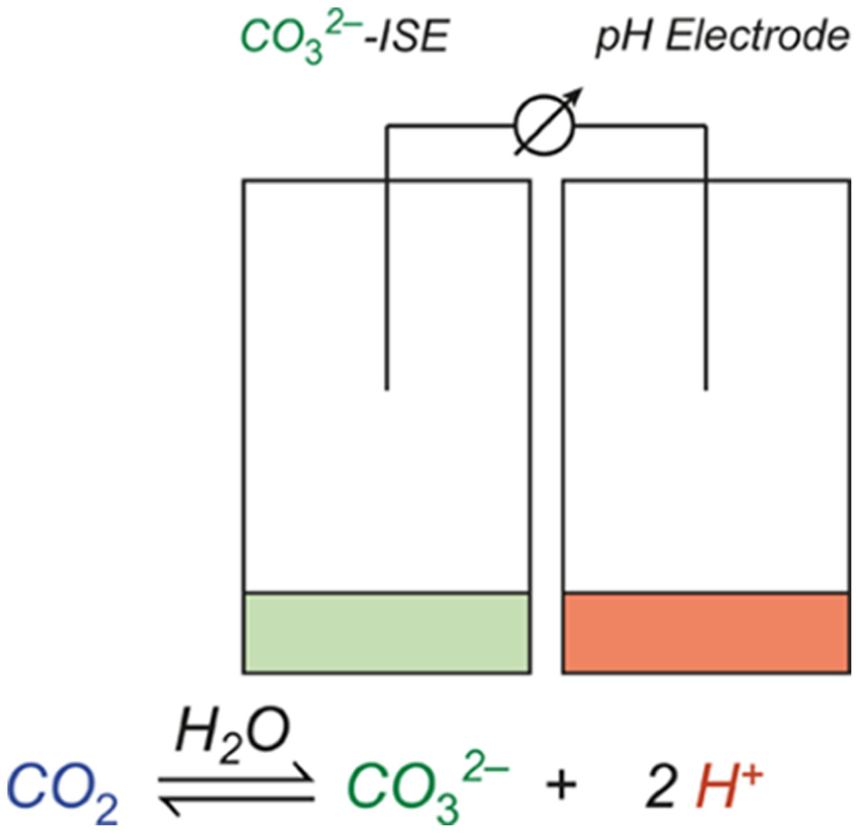
Representation of the ion-selective CO2 sensor and its working principle (from Xie and Bakker, 2013).
The dCO2 sensor based on electrochemistry has such excellent performance, simple structure, low technological capability and relatively high sensitivity. However, short electrolyte life and restricted range of concentration make it only suitable for a short-term test.
With the development of optical technology (Wang and Zhao, 2018a), more high-precision technologies such as chemical sensors based on pH, infrared-based spectral analysis of optical sensors have been applied to the monitoring of dissolved carbon dioxide, which realize the direct measurement of CO2 in system. The use of fiber optic technology also takes the measurement performance to a new level. Furthermore, the application of evanescent wave, plasma resonance and some other principles broaden the reach of optical measurement methods (Peterson et al., 1980).
The dCO2 measurement based on fluorescent methods
In light of the rapid development of optical technology, optical sensors have replaced the dominant position of electrical sensors gradually in the field of dCO2 detection (Zhang and Seitz, 1984). Since the low loss and more stable lasting signals in conduction of optical fiber, it is suitable for in situ long-distance dissolved carbon dioxide measurement (Byrne and Kaltenbacher, 2001).
Optical fiber chemical sensor is also referred to as the pH fiber chemical sensor, which has been developed for the first time since the late 1970s by combining fiber-optic sensing and chemical reaction (Baldini et al., 1995). The pH fiber chemical sensor based on the fluorescence is the most typical application. The fluorescence method is based on the different fluorescence intensity or fluorescent lifetime reacted by sensitive fluorescent reagent in different pH environment to determine the dissolved carbon dioxide concentration (Byrne and Kaltenbacher, 2001).
Generally, the fluorescent dCO2 sensing system is mainly composed of light source, sensing probe, fiber liquid core tube, detector and signal processing system; maybe different measurement methods have subtle differences. Neon, amalgam and tungsten halogen lamps are commonly used as light sources in measurement system owing to their continuous wavelength and high beam intensity (Kun et al., 2005). Sensor probe is the core of entire system that is typically fabricated by attaching the CO2-sensitive indicator to fiber tip. Both liquid core tubes made of optical fibers and test strips can be used where the probe contact solution. The optical fiber liquid core tube is a great innovation in liquid detection, which is considered the successful combination of optical transmission device and circulation piping (Dasgupta et al., 2015). Similar to electrochemical sensors, the outer surface of the fiber optic sensor is also surrounded by an ion selective membrane.
The sensitivity of fluorescence measurement is high, and it is easy to make a distinction between excitation wavelength and emission wavelength. The accuracy and sensitivity of measurement greatly depend on the choice of fluorescent indicators (Jie, 2002). Phthalocyanine was the original indicator used in fluorescence sensors. Furthermore, 5,6-alkyl naphthalene, Neutral bing Huang, set orange yellow fluorescein and metal complexes emerge with increasing frequency in recent years. Different indicators are chosen in accordance with different accuracy, measurement range and reaction occasions (Wang and Zhao, 2018a). Table 1 summarizes the characteristics of several kinds of fluorescent indicators.
Main characteristics of fluorescence indicators be sensitive to pH (from Szmacinski and Lakowicz 1993).
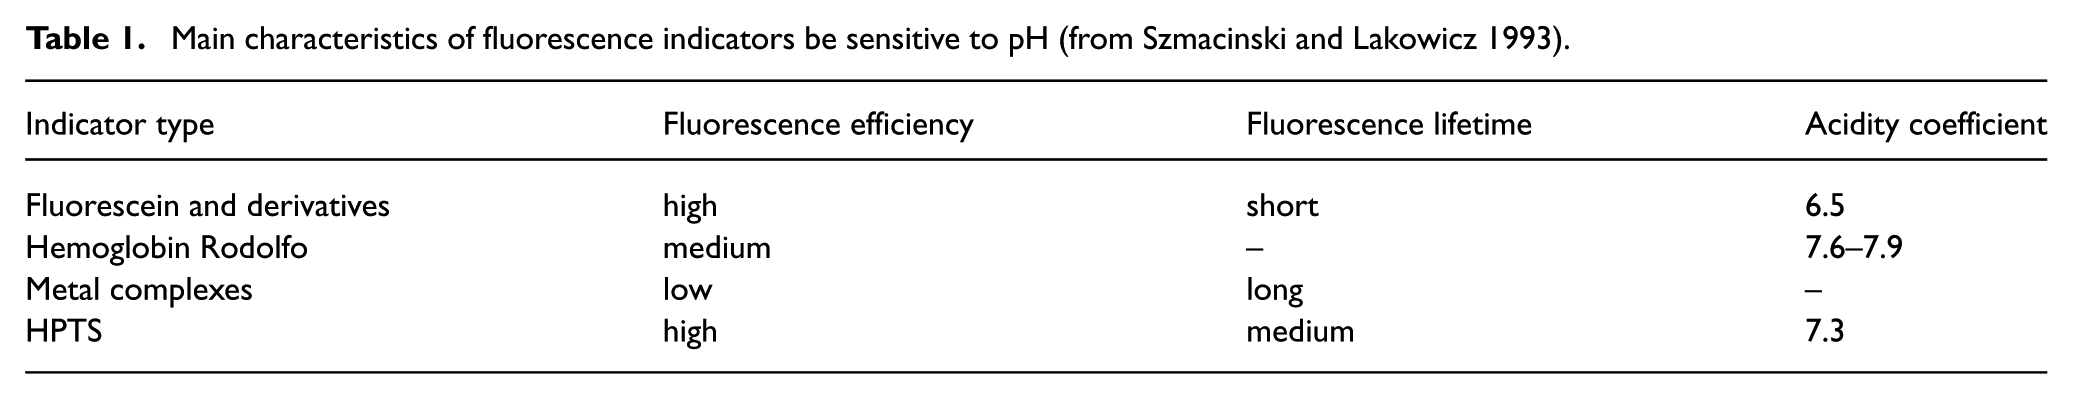
Among the several popular fluorescence indicators sensitive to pH, HPTS is used frequently because of high fluorescence efficiency, moderate fluorescence lifetime and neutral setting. Metal complexes also have important applications in biosensing and pharmaceutical industry that use the property of long fluorescence lifetime; nevertheless, some characteristics not yet established seriously limit its scope of application and fields.
Owing to the water-soluble property of fluorescent indicators, they cannot touch the solution directly. Fluorescent indicators must be fixed on the optical fiber probes in a specific way to maintain the stability and original characteristic of indicators. The former fixed methods consist of absorption, entrapment and covalent binding methods (Xing-Jiu and Yang-Kyu, 2007; Zhang and Zhang, 1986).
In recent years, the Csol-gel is the focus of research on the carrier material of the indicator, which forms a gel by hydrolyzing a mixed solution of organic or inorganic substance and indicator, and then forms a sensitive film through operations such as polymerization and evaporation. The film made by Csol-gel method with high sensitivity, simple production process and high strength is extensively used for chemical sensing (Nivens et al., 2002). Rovati et al. (2011) plated the tip of a big core plastic optical fiber with mixture of phenol red-containing materials to measure the pH in range of 5-8. The sensor with a response time of less than 2 s and high precision demonstrates the effectiveness of the Csol-gel method.
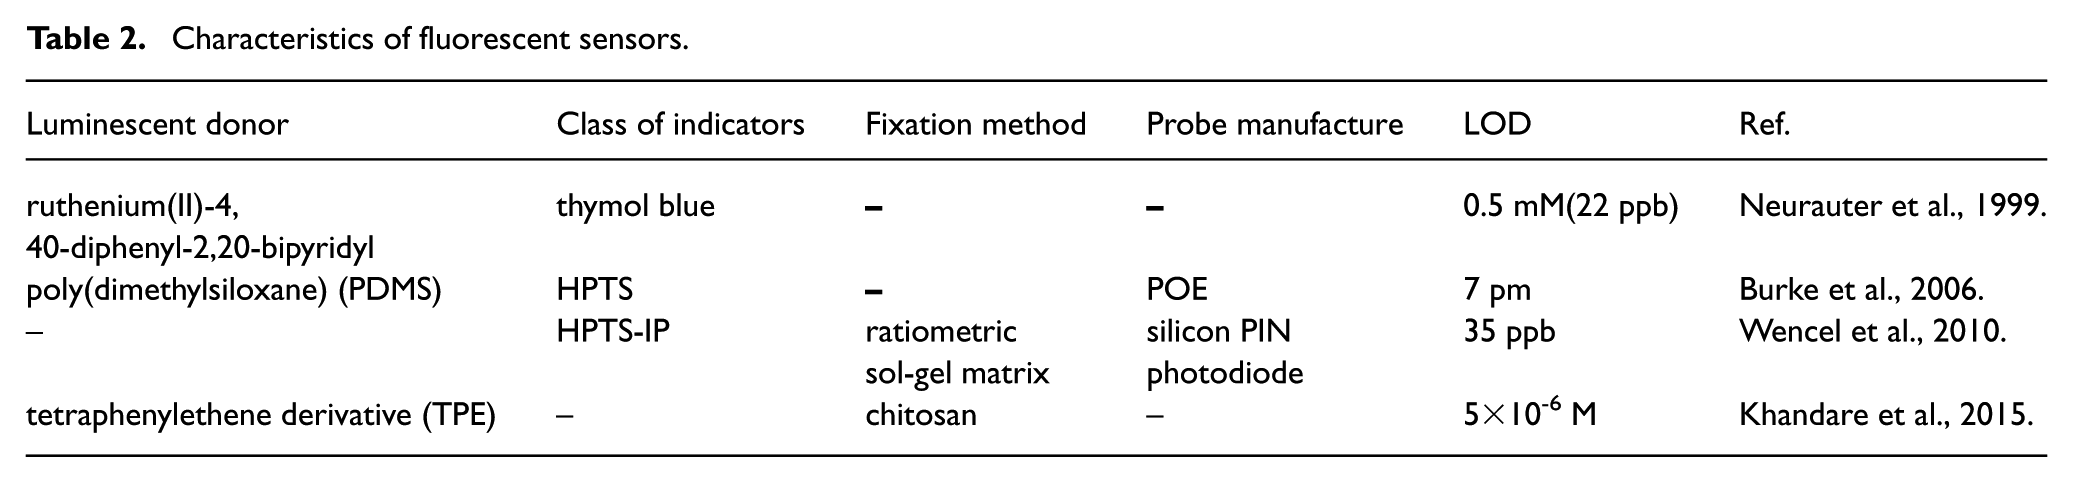
Neurauter et al. (1999) used ruthenium(II)-4,4’-diphenyl-2,2’-bipyridyl to produce fluorescence and thymol blue to absorb the energy without radiation. Dissolved carbon dioxide concentration was determined from the decay time of the luminescent donor. The detection limit of sensor was 0.5 μM (22 ppb) and the response time was about 15 s. Burke et al. (2006) made an optical sensor probe for dissolved CO2 measurement using a custom designed polymer optical element (POE) as the main part of sensor. The probe took use of dimethyl siloxane (PDMS) sensor film doped hydroxypyrene tri sulfonic acid (HPTS) to excite fluorescence. Concentration of dCO2 can be measured by testing fluorescence intensity of hydroxypyrene tri sulfonic acid (HPTS). The detection limit of experiment reached 7 μm. Wencel et al. (2010) employed a pH fluorescent dye 1-hydroxypyrene-3,6,8-tri sulfonic acid that paired with cetyltrimethylammonium bromide (HPTS-IP). In order to obtain the concentration of dissolved carbon dioxide, both dual-LED excitation and silicon PIN photodiode were employed in the probe fabrication to detect fluorescence intensity, seen in Figure 3. The sensor showed enhanced stability and sensitivity with a detection limit of 35 ppb.
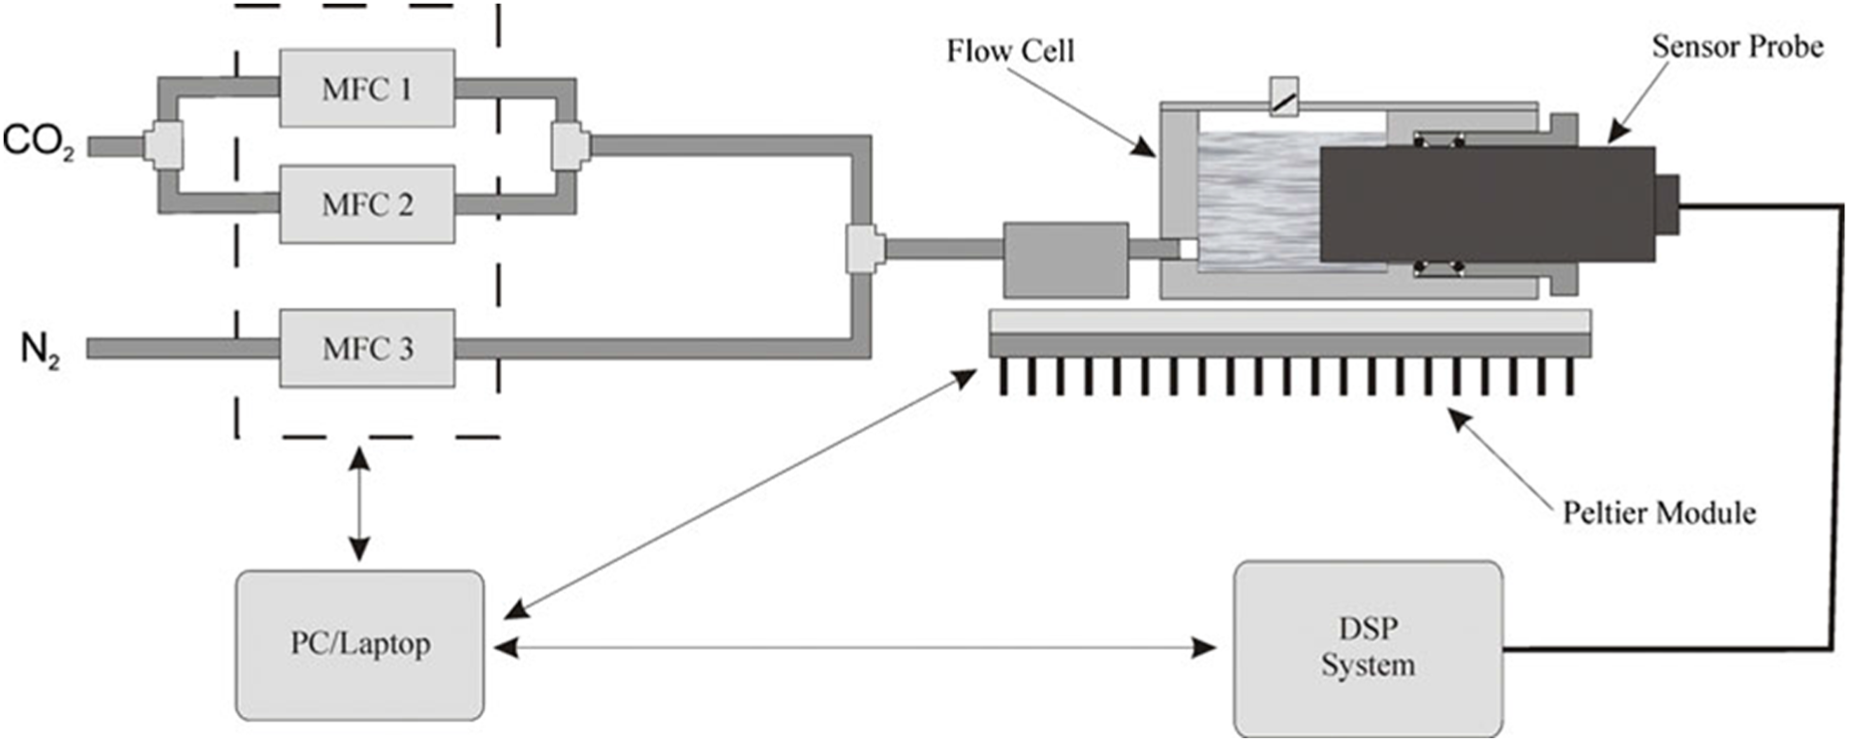
Schematic representation of the ratiometric dCO2 experimental system (from Wencel et al., 2010).
Zilberman et al. (2014) developed a novel microfluidic optoelectronic cross-reaction sensor full off ionexchange polymeric microbeads mixed by halochromic dyes that paired to quaternary ammonium cations, seen in Figure 4. The sensor can contact with the solution directly without hydrophobic coating and transform between gas and liquid detection. Khandare et al. (2015) presented a dCO2 sensor based on the aggregate-induced emission (AIE) property of the tetraethylene derivative (Probe 1). Fluorescence intensity is the main parameter to determine the dissolved carbon dioxide content. The experimental results showed that this method had high sensitivity with the detection limit of 5×10⁻⁶ M (0.00127 hPa). Furthermore, it is the first to apply the AIE to detection of carbon dioxide. Kermis et al. (2002) developed a fluorescent excitation-ratiometric, noninvasive pH sensor for continuous on-line fermentation monitoring, seen in Figure 5. The fluorescent dye 8-hydroxy-1,3,6-pyrene trisulfonic acid was immobilized onto Dowex strongly basic anion-exchange resin. The sensor responded rapidly (<9min) and reversibly to changes in the solution pH with high precision.
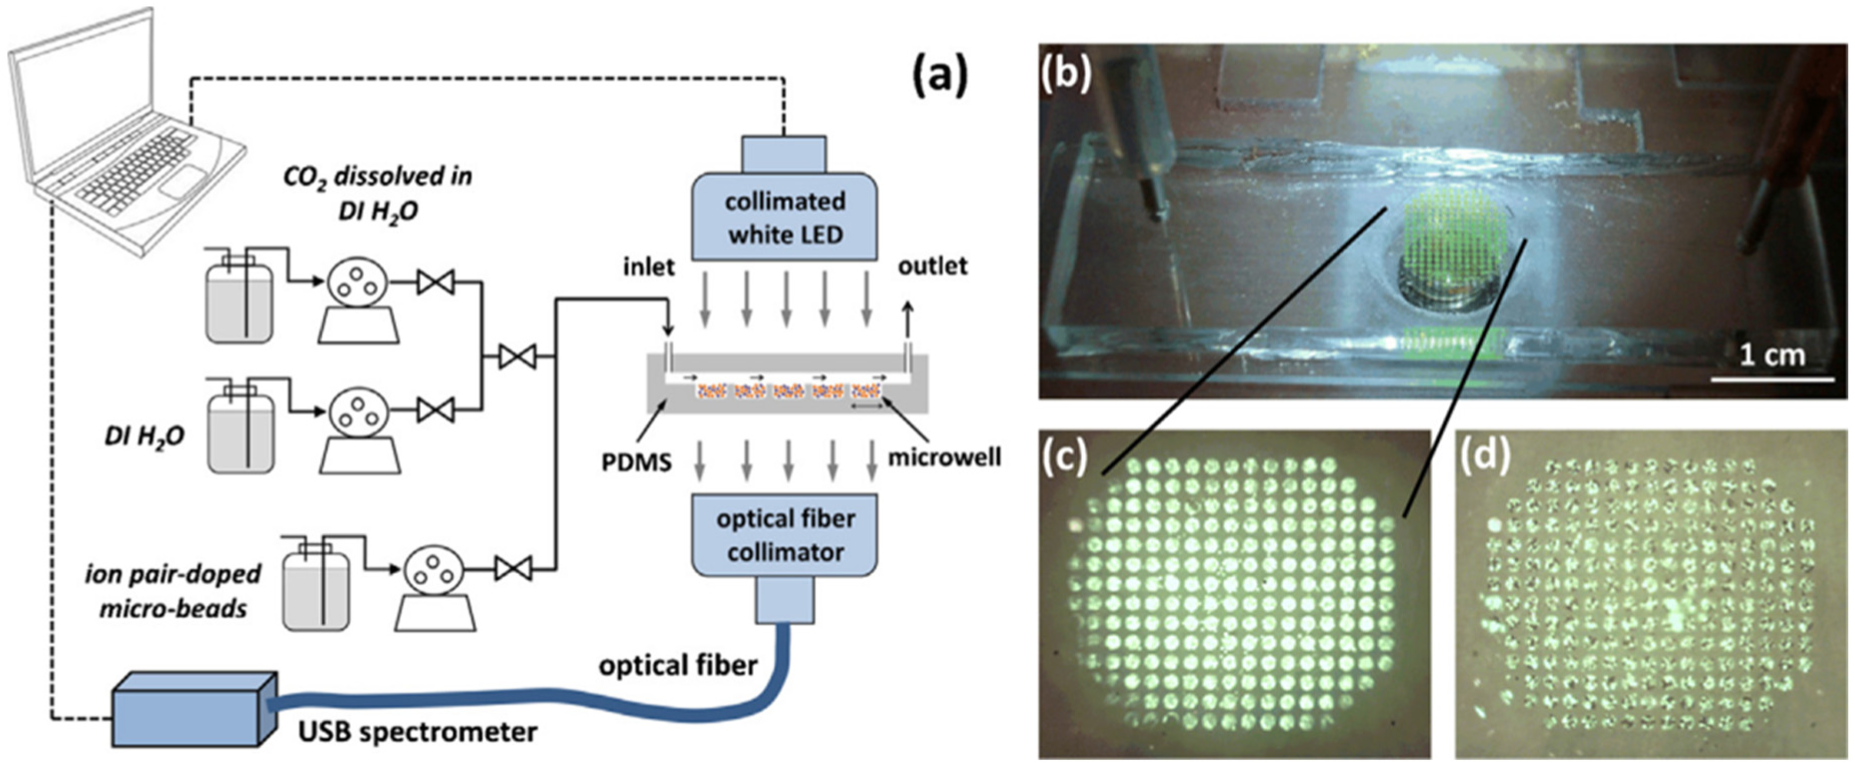
Experimental setup: (a) schematic representation of the sensor array of microwells embedded in a microfluidic device; optoelectronic setup is also shown. Microfluidic optoelectronic sensor: (b) array of ion pair-doped microbeads embedded on the microfluidic device with inlet and outlet channels; (c) array composed of pyranine-basedion pair doped microbeads; and (d) mixed array composed of microbeads doped with either pyranine or cresol red-based ion-pair. Micrographs were taken under green LED irradiation (from Zilberman et al., 2014)
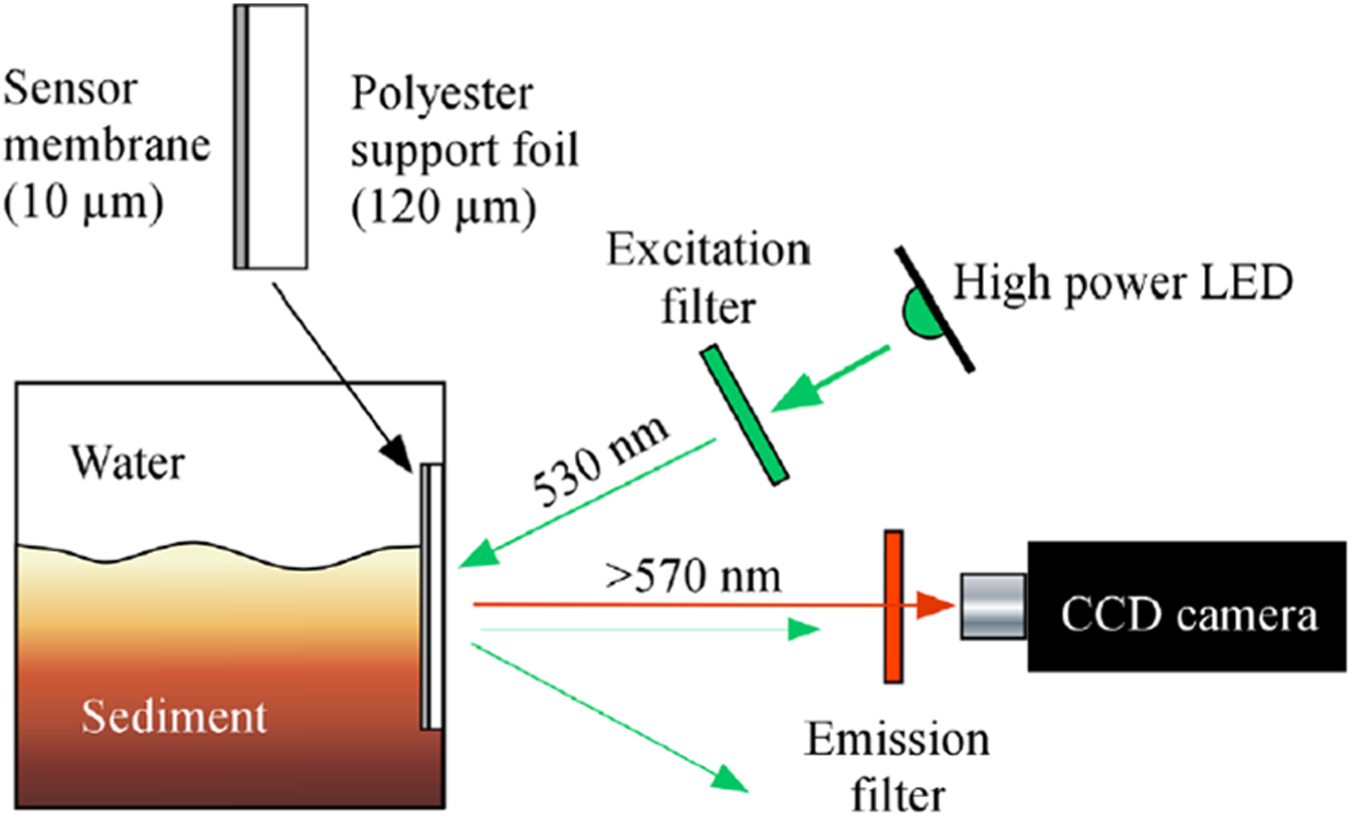
Illustration of the laboratory setup (modified from Glud et al., 1996; from Kermis et al., 2002).
Planar optode is an optical sensing technique that emerged in recent years, also based on fluorescence sensing. The difference is that fluorescence image of sensing film is collected to obtain two-dimensional quantitative distribution maps of samples to be measured. Stahl et al. (2006) presented a planar optode using fluorescent pH indicator 2’,7’-dihexyl-5(6)-N-octadecyl-carboxamidofluorescein ethyl ester (DHFAE) and phosphorescent ruthenium(II)-Tris-4,7-diphenyl-1,10-phenanthroline incorporated in nanoparticles. This planar optode was employed to investigate the effect of benthic disturbances on solution of carbon dioxide at the interface of seawater and sediment. Table 2 summarizes the characteristics of several kinds of fluorescent sensors. It is noticeable that the sensors make use of HPTS have better properties than others.
Characteristics of fluorescent sensors.
From the above summary, we find out that the current focus is on developments mainly aimed at improving sensitivity of dCO2 sensor, applicable environment and measurement range based on fluorescence technology assisting novel chemical reagents, fixing methods, advanced optical fiber technologies and data analysis. Although the research on dissolved carbon dioxide based on fluorescence has advantages of high sensitivity, more innovations of sensors employing optical principles like evanescent wave gradually weaken the dominance of fluorescence technology.
The dCO2 measurement based on spectrometric methods
The dCO2 measurement based on spectroscopy is the most primitive measurement approach. Spectrometric can be divided into light absorption employed acid-base indicator, light reflection or refraction, infrared and Raman spectroscopy (Zhu et al., 2006). The acid-base indicator based sensor is also under the principle of pH sensor. Spectrometer is an essential experimental facility to detect pH changes in the spectrum for solution pH. Spectrometry-based method is one of the most commonly practiced dCO2 detection method currently (Wang et al., 2009).
Acid base indicator based spectrometric methods
Generally, the optical probe is made by coating the optical fiber end face with an acid-base indicator sensitive film to detect the change of light absorption or reflection. Simple acid-base indicators consist of bromothymol blue, bromo cresol green, cresol red, p-nitrophenol and so on. Table 3 summarizes the characteristics of acid-base indicators sensitive to pH.
Main characteristics of acid-base indicators be sensitive to pH.
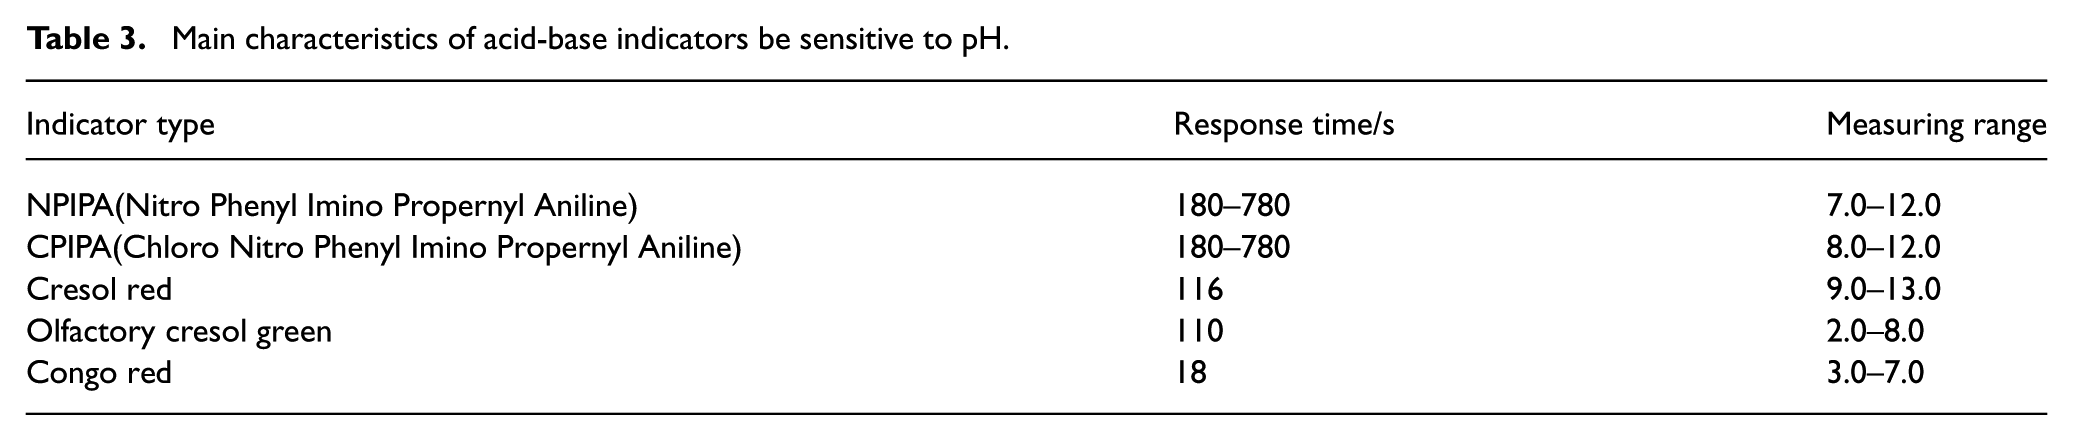
Depending on the measurement point required, the correct acid-base indicator must be selected in order to have a precise colour change during the range of pH values being observed. (Wang and Zhao 2018). Commonly, the color of acid-base indicator changes as small as possible. In acid-base titration, the end point of titration has to be limited in a very narrow pH range, then mixed indicator can be used. Recently, several types of synthetically made dye and natural pigment are used to optimize the sensing optimize or reduce pollution.
Vargas-Sansalvador et al. (2017) proposed a water-based carbon dioxide sensor for food industry that applied a Hewlett Packarddiode array spectrophotometer for absorption spectrum. Furthermore, this paper employed images from a digital camera to assay for data calibration, seen in Figure 6. The detection limits were 0.36% for dissolved carbon dioxide and quantification limits were 0.37% CO2 for CO2 instrumentation (LOQ = R0+ 10s0).
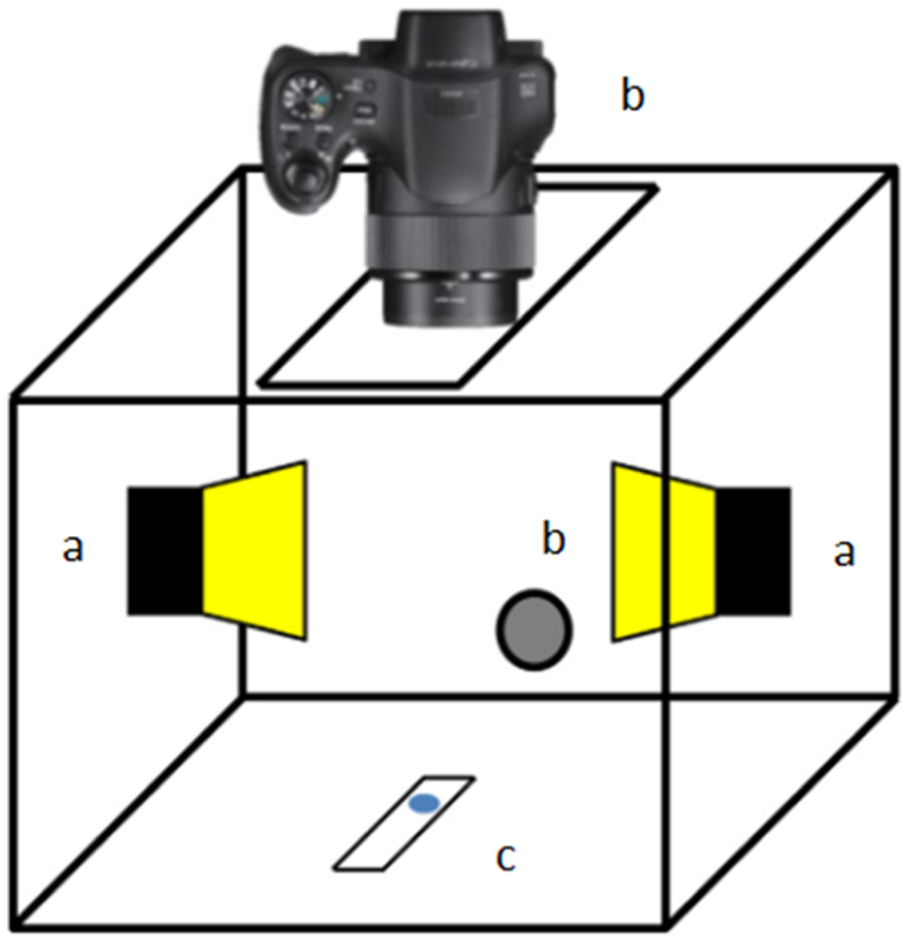
Homemade light box used to digitalize the membranes. (a) LED-lamps; (b) gasinlet; (c) membrane and (d) digital camera (from Vargas-Sansalvador et al., 2017).
Infrared spectroscopy methods
Infrared spectroscopy is the earliest approach to detect dissolved carbon dioxide (Xu et al., 2000). Regularly, the concentration of CO2 is obtained through the infrared spectrum of gaseous carbon dioxide recorded by spectrophotometer. The principle of infrared spectroscopy is attenuation of light owing to energy transitions. Carbon dioxide gas has the specific absorption spectra at wavelength of 2600 nm and 4300 nm, and absorption intensity obeys the Beer-Lambert theorem (Dong et al., 2017).
The general infrared measurement system consists of light source, reaction cell, infrared detection device and signal processing system (Meng et al., 2018). In order to eliminate the influence of optical interference on sensitivity, the non-dispersive infrared (NDIR) analysis technique has been widely used in CO2 detection (Martin et al., 2017). The key technique is to add reference wavelength selected to narrow band at other peaks near the detected wavelength in an optical path. By comparing two intensities, interference can be eliminated (Kim and Lee, 2017).
In addition to the direct measurement of dCO2 mentioned above, the method of measuring the pressure of carbon dioxide (pCO2) is favored by research institutes (Demarty et al., 2010; Van and Olson, 2017). CO2 pressure stands for content of carbon dioxide gas in the solution that uses symbol pCO2 (μatm). It is noted that pCO2 refers to the partial pressure of CO2 gas when solution reaches equilibrium. Henry’s Law converts pCO2 to dissolved carbon dioxide concentration (Ghaslani et al., 2017).
Abril et al. (2016) combined vapor-liquid balancer and infrared gas acoustic analyzer to detect the pressures of CO2 and CH4 in dam and reservoir. The results obtained were consistent with conventional GC analysis of F15% (CO2: 50-400 Amol/L and CH4: 0.5-350 Amol/L, the corresponding gas partial pressure were 1700-13,000 and 12-8800 μatm), which brought a new vision for dCO2 monitoring in highly dynamic system. Webb et al. (2016) bind a vapor-liquid balancer with an in-situ expandable cavity enhanced laser absorption spectrometer (CELAS) to develop a high-resolution, accurate measurement system for dCO2, seen in Figure 7 (Abril et al., 2006). Furthermore, the comparison in response time of six kinds vapor-liquid balancers was worked for maximum performance.
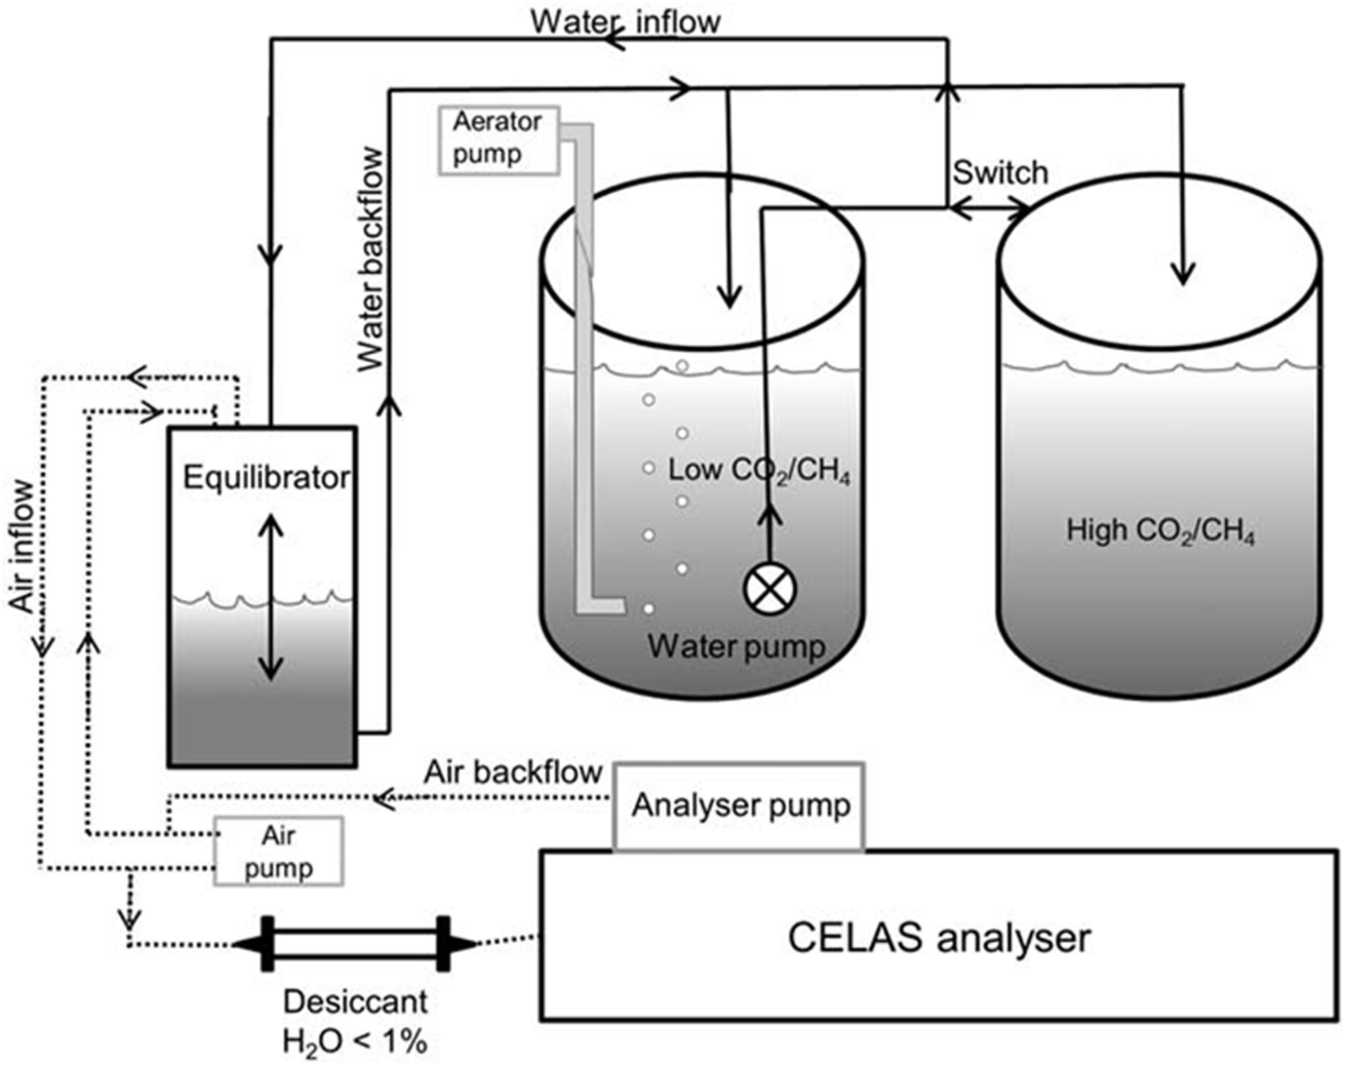
Schematic diagram of the laboratory setup of the air-water equilibration system involving a CELAS analyser for dissolved CO2, CH4, d13C-CO2, and d13C-CH4 values during step experiments. Solid arrows indicate liquid flow and dotted arrows indicate gas flow (from Webb et al., 2016).
The dCO2 sensor based on infrared spectroscopy is characterized by low cost and good stability. But great bulk and low accuracy limit the application in demanding occasions. Although it can be compensated by establishing a model followed algorithm such as least-square method, the status gradually shakes in the dCO2 measurement field.
Raman spectroscopy methods
The dCO2 sensor employed Raman scattering has become trendy for a few years. The sensor with higher performance, wider scope of application is still under development (Komai et al., 2002). When a beam illuminates up the sample, Rayleigh scattering and Raman scattering occur. Raman scattering light maintains a certain difference of frequency between incident light, that is Raman shift. Similar to the infrared spectroscopy, Raman scattering method also follows the Beer-Lambert theorem.
A laser Raman spectroscopy system generally includes three basic parts, laser source, spectrophotometer and detector, functions to excite the sample, receive and distinguish the different frequencies of scattered light, identify the light intensity of distinguished light, respectively (Walrafen et al., 1996).
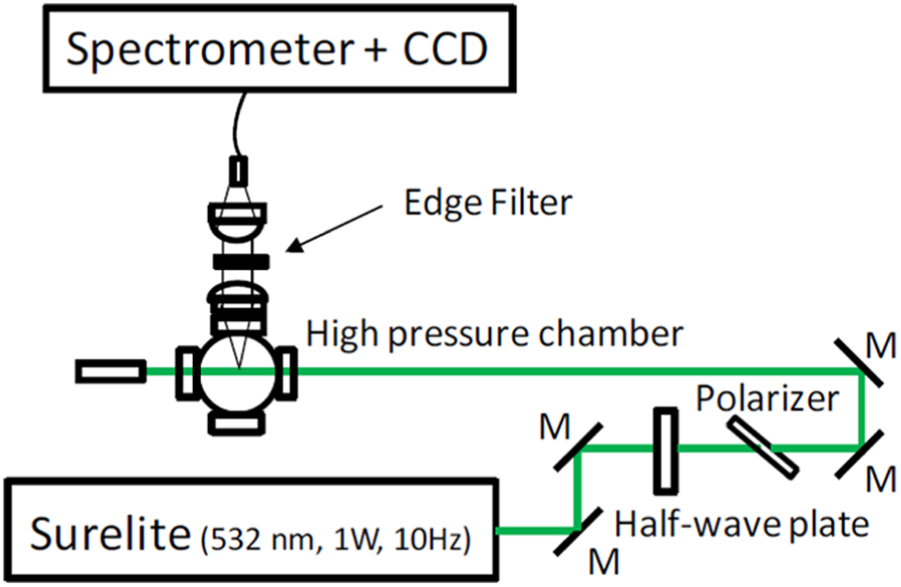
There is an advantage of Raman method in distinguishing different chemicals on account of weak Raman scattering and small overlap of components spectra coincidence. Dunk et al. (2015) developed an in situ laser Raman spectrometer (LRS) system to detect dissolved carbon dioxide in deep ocean. Two chambers fitted with pH electrode, the optical probe and dissolved carbon dioxide are structured in system. The detection limit is 10 mM and the acquisition time of spectral is 150s. Beuvier et al. (2014) applied Raman spectroscopy to replace traditional ways that cannot be used under high CO2 pressure, seen in Figure 8. The sensor realized to monitor three main components of dCO2 solution (CO2(aq), HCO3- and CO32-) for the first time. Experimental results are intensely consistent with direct spectrophotometric signals using indicators. This approach shows a great advantage over traditional high-pressure measurement.
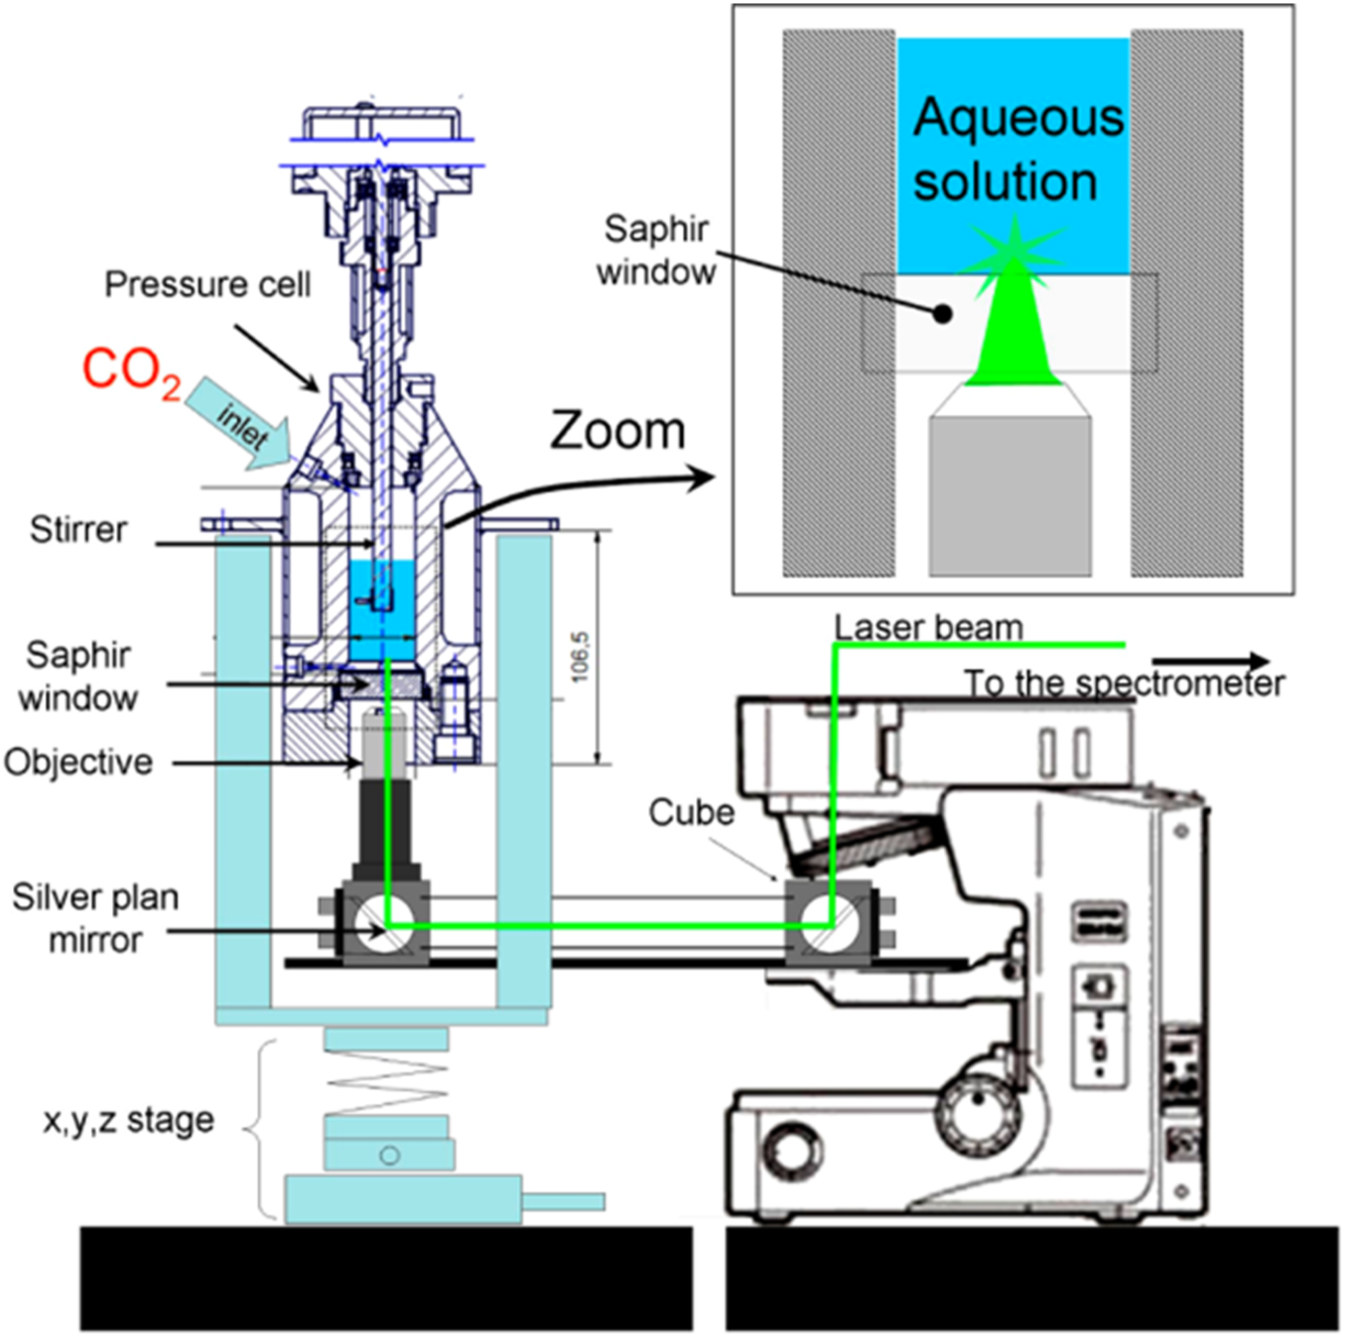
Schematic diagram of experimental setup for in situ micro-Raman measurements of aqueous solutions in contact with CO2 at elevated pressure. The pathway of the laser beam is shown in green (from Beuvier et al., 2014).
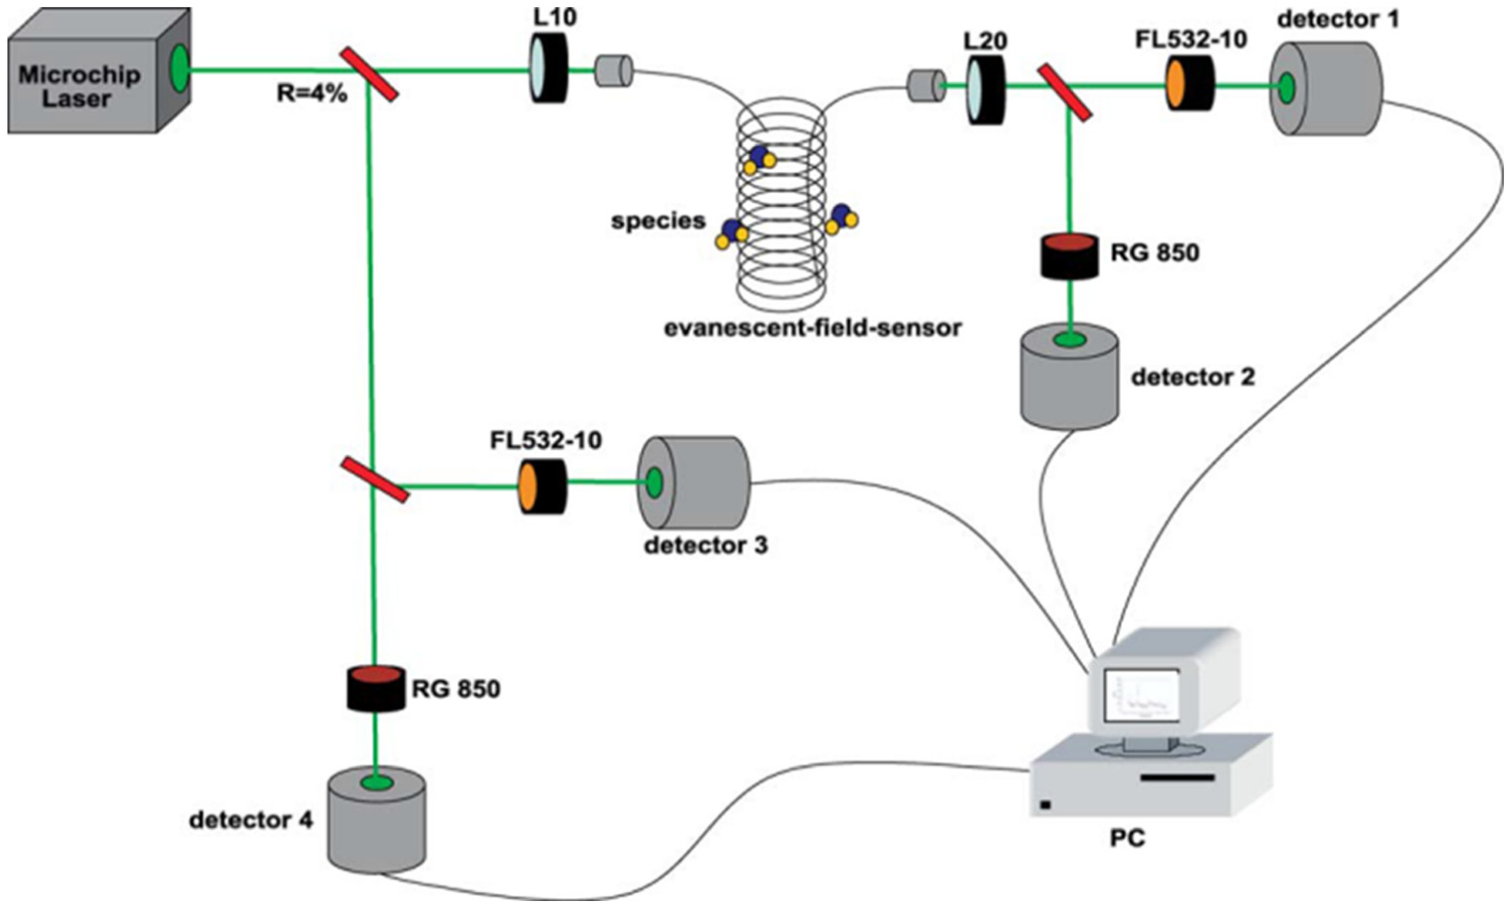
Somekawa et al. (2016) set up a Raman LIDAR system and was employed to detect Raman spectra of dCO2 solution at a concentration of 10 mmol/kg, seen in Figure 9. Eventually, the applicability of laser remote sensing and Raman spectroscopy detection in water were verified.
Schematic diagram of Raman spectroscopy experimental setup (from Somekawa et al., 2016).
Owing to high transmittance of traditional infrared spectroscopy and weak absorption in water, Raman spectroscopy method has a far-reaching application in the field of dCO2 measurement. However, the detection for weak Raman light requires high concentration and expensive equipment. There are more improvement and innovation needed in these respects (Renming et al., 2009). Raman scattering theory in dCO2 measurement also means non-linear optical phenomena have drawn more attention of community.
The dCO2 measurement based on photonic methods
With the profound research in light propagation modes and principles, the dCO2 measurement mode is no longer confined to the traditional fluorescence spectroscopy and infrared spectroscopy detection. Attention has been diverted to evanescent wave, colorimetric signal and so on. In addition, the sensing work strives for full optimization on performance of dCO2 sensor. This section will mainly introduce the research status of optical detection methods that have made great progress in recent years.
Evanescent field measurement methods
Evanescent spectroscopy is a technique that can be used for hazardous or absorbable analyses in extreme environment (Orghici et al., 2008). The dCO2 detection based on evanescent principle has a bright prospect in military, marine and other fields because of its simple structure and characteristic of distributed measurement (Vijayan et al., 2009).
Total reflection occurs at the interface between fiber core and cladding when the incident angle of light is greater than the critical angle. Although the incident light energy is totally reflected back, there is an exponential decaying surface wave near interfaces of cladding, namely the evanescent wave (Butt et al., 2018). In recent years, the evanescent wave sensor mainly focuses on exposed type of core like D-shaped, cone-shaped and some other shape (Nampoori, 1992; Wu et al., 2010). Orghici et al. (2008) presented an optical fiber evanescent field sensor used in gas CO2, dCO2 and explosives detection. A quartz glass multimode fiber with exposed core was used with characteristic, seen in Figure 10. The attenuation of light intensity can be detected to monitor content, besides, the final measurement data is consistent with calculated result. Wu et al. (2010) applied a pH-sensitive indicator with exposed core fiber to develop a pH sensor based on evanescent wave. Maybe this method can be referred to in future work.
Experimental setup of the sensor device for detecting the explosive TNT (from Orghici et al., 2008).
The evanescent wave sensor has high sensitivity and simple structure in dCO2 monitor, and possesses great potentiality in the construction of distributed or multi-point measurement. The complicated manufacturing process and high cost are the crisis that must be conquered afterwards.
SPR measurement methods
Plasmon resonance sensing is a highly sensitive, label-free and real-time measurement method (Zienkiewicz et al., 1992). Surface plasmon resonance (SPR) is a physical phenomenon that incident light causes free electrons of metal surface to coherent oscillat at the interface between metal and dielectric. After metal surface is excited, the SPR signal changes owing to the change in refractive index of sample on metal surface (Beck et al., 2011). The concentration information of analyse can be obtained by analyzing SPR signals.
A general SPR system consists of light source, metallic film, CO2-sensitive film and spectrum detector. Herminjard et al. (2009) developed the first SPR CO2 optical sensor operated in mid-infrared range. The experiment was set up with Kretschmann geometry with Ti/Au layers deposited on a CaF2 prism. Experimental data of the sensor has nearly five times the sensitivity of other SPR sensors in the visible range. Lang et al. (2012) plated a metal thin film on a glass slide and took use of the polymer that can fully react with CO2 to make sensing diaphragm, seen in Figure 11. The change in SPR signal was analyzed to obtain the dCO2 concentration. The detection limit of the sensor is 10 ppm. The plasma resonance sensor has the advantages of simple structure and high specificity, but the sensitivity needs to be improved.
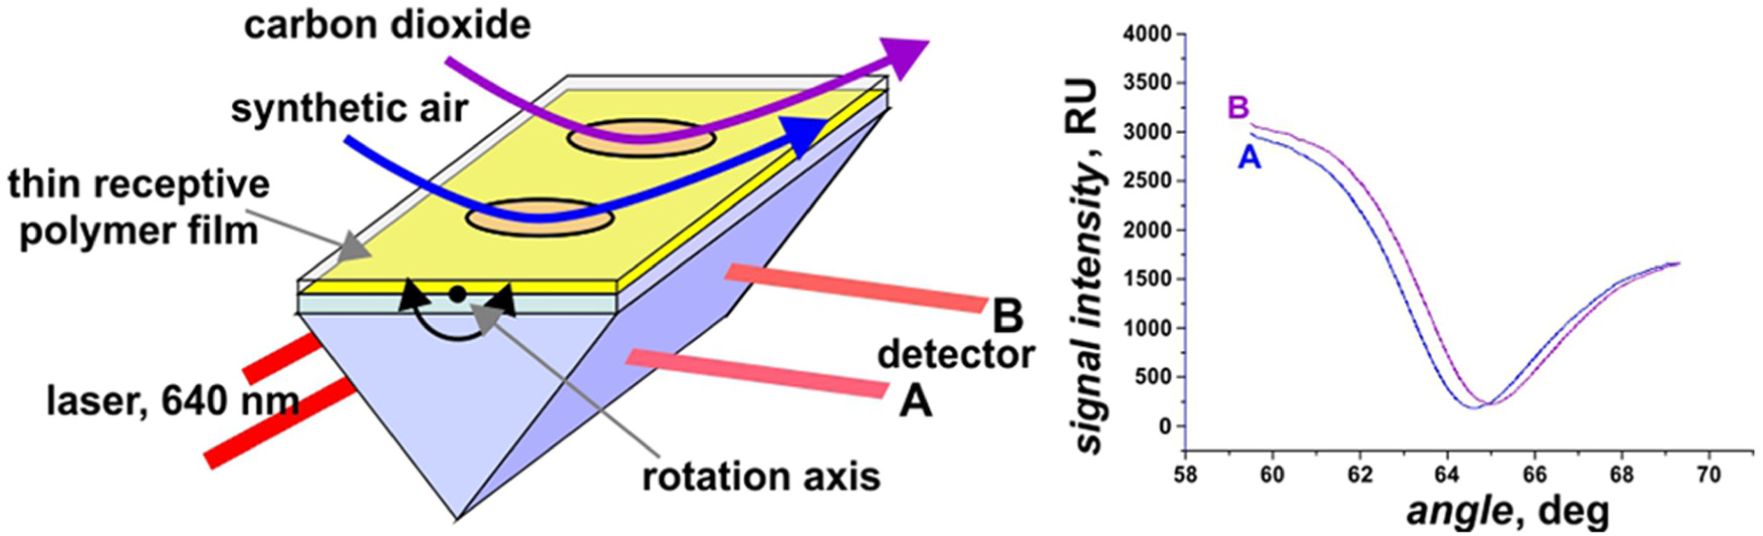
SPR measurements were performed with a 2-channel device (from Lang et al., 2012).
In the past 10 years, surface ion resonance technology has developed rapidly thanks to the unique advantages (Kobori et al., 2004). However, there is still a great gap compared with the traditional dCO2 measurement methods, such as limit resolution, complicated manufacturing process and expensive equipment.
Colorimetric measurement method
Colorimetry is a method of determining the content of constituents by measuring and comparing darkness of the colored solution (Sivakumar et al., 2010). The colorimetric method is operated in the range of visible light (wavelength range of 380-780 nm), generally go through two stages: visual colorimetry and photoelectric colorimetry. Photoelectric colorimeter is applied to measure the absorbance of standard solution at first. Then, plot and analyse the line of absorbance changed in concentration.
A general dCO2 optical fiber sensor is more easily influenced by excitation source, fading of indicator and detector drift, and so forth. Dissolved carbon dioxide sensors based of colorimetric show high accuracy, less error, and can make up the impact of equipment and external environment.
Study on colorimetric dCO2 sensor has currently made considerable progress at home and around the world. Chen et al. (2015) proposed a paper-based microfluidic device based on colorimetric method to detect dissolved NH3 and CO2. The halogen dyes with different sensitivity to NH3 and CO2 was used. Employing MATLAB to analyze the images of the reaction took by camera enables the selective detection of dissolved NH3 and CO2. The research took advantage of environmentally friendly technique in experiment but sensitivity was limited by images. Mills and Yusufu, (2016) presented a plastic sensitive film sensing using colorimetric for dCO2 and CO2 measurement. Polyethylene (LDPE) coated with pH sensitive dye thymol blue (TB) was formed into sensitive film by extrusion, seen in Figure 12. The CO2 concentration information is obtained by measuring the absorbance of plastic film. The detection limit of the dCO2 is 0.01% (0.01%=100 μatm) in HS water. In the high-acid environment or water bodies (lakes, etc.), the detection accuracy is high, nevertheless, it is low in the ocean (about 0.18%). Chen et al. (2010) prepared a colorimetric pH optical fiber sensor containing fluorescence indicator. The dCO2 sensor can be further developed in dCO2 sensing.
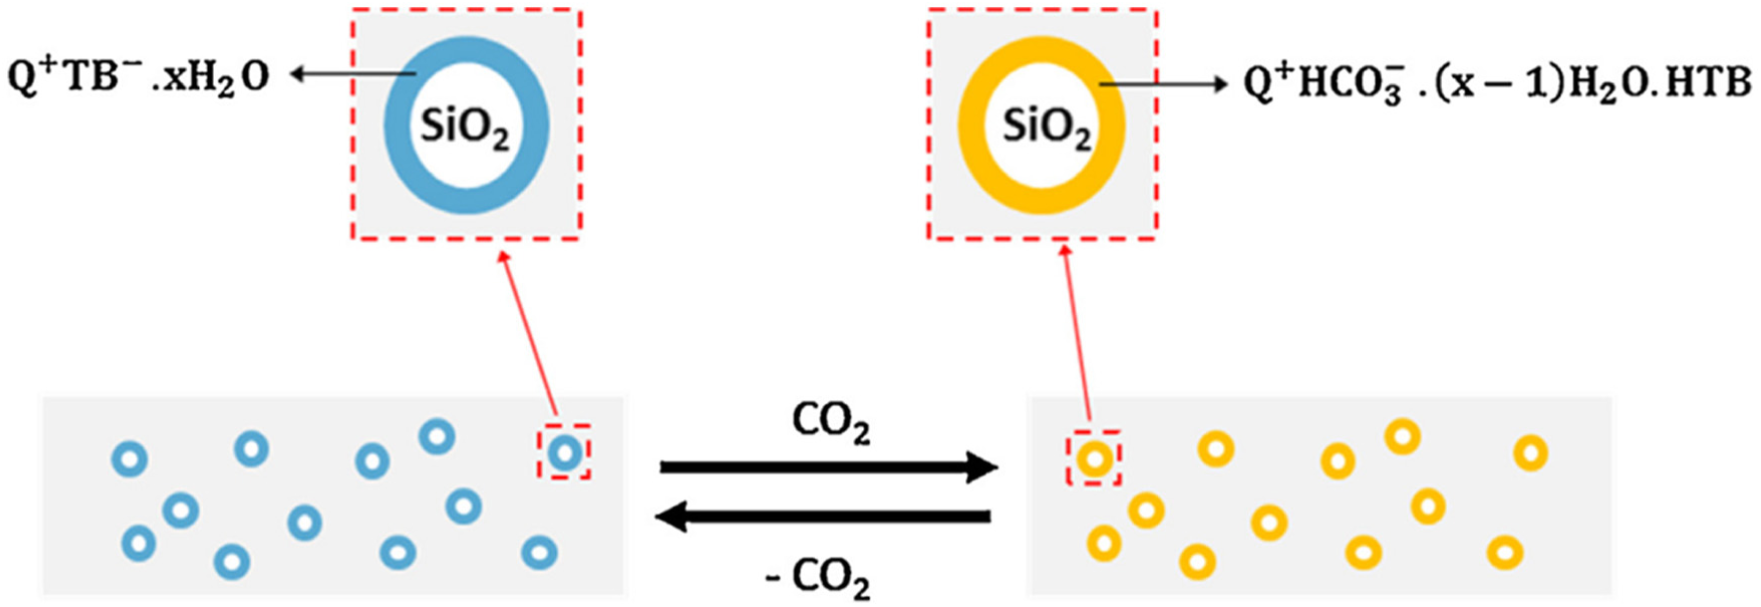
Schematic of the key features and reactions of a naked (from Mills et al., 2016).
There are not complicated data reading and processing in colorimetric, the experimental equipment is simple as well. However, the sensitivity is still significantly lower than traditional infrared spectroscopy method. Further research is needed to achieve practical application of colorimetric dCO2 sensor.
Prospect
The dCO2 concentration measurement is a globally focused topic because of greenhouse effect. Combined with the analysis of this review, the dCO2 concentration measurement trends can be divided into the following aspects.
General dCO2 sensors such as fluorescence sensors, indicator spectroscopy sensors include the configuration of CO2-sensitive films and the immobilization of indicators. The research took advantage of different materials to prepare sensitive films or improve response time, sensitivity, repeatability and stability of sensors. A growing number of pH-sensitive indicators like tea phthalimide, Schiff base are employed in the manufacture of fiber optic probes (Ma, 2010). The application of derivatives such as coumarin derivatives and polyethylene derivatives also broadens the choices of reagents. “Environmentally-friendly” matrix such as ionic liquids is considered as development trend.
The signal detected in dCO2 sensors is diverse according to different optical principles. There are a few optical principles such as mode filter that have progressed in related fields, most of them are innovation in pH sensing (Capel-Cuevas et al., 2011). The sensing technology based on mode coupling and neural network also provides more accurate and efficient measurement way to detect dCO2.
Common fiber grating and thin-core optical fiber (CTCF) partly optimize the performance in dCO2 sensing (Zhang et al., 2018). Such innovations in relevant technology establish foundation to promote the dCO2 sensing development. In addition, treatment techniques in optical fibers or sensitive films employing nanotechnology allow multi-parameter sensitivity and multi-functional implementation (Li et al., 2018; Zhang et al., 2018). Distributed optical network technology has very bright prospects in the multi-point CO2 concentration measurement, ocean, and other areas as well.
Summary
The concentrations of dissolved carbon dioxide in oceans and lakes reflect the balance of carbon cycle in the ecosystem, and also show the status of global environment indirectly. Therefore, to clarify the current situation and trend is significant for development and optimization of dCO2 monitoring. This article is written based on previous studies to introduce the background and significance in detail, and briefly review the dCO2 measurement development course, including indirect dCO2 measurement method and the reasons of being replaced. This paper divides the existing dCO2 measurement methods into three categories, namely, fluorescence method, spectroscopy method and methods in developing stages like colorimetry. After that, the innovative part and characteristic of each typical method were analysed in table format. This review sums up the development of dCO2 measurement methods over nearly a decade and forecasts the future trend of sensing. We hope that it can provide a practical reference for research breakthroughs in related fields and present dCO2 concentration sensors with better performance and a broader scope of application.
Footnotes
Declaration of conflicting interest
The authors declare that there is no conflict of interest.
Funding
The author(s) disclosed receipt of the following financial support for the research, authorship, and/or publication of this article: This work was supported by the Natural Science Foundation of Liaoning Province under Grant 201602262, the Fundamental Research Funds for the Central Universities under Grant N160405001 and N170407005, the National Natural Science Foundation of China under Grant 61405106, the Shandong provincial key research and development program under Grant GG201703130110 and 2016GGH4501, the Qingdao applied basic research program under Grant 17-1-1-99-jch, the Youth Science Funds of Shandong Academy of Sciences under Grant 2014QN029.