
Abstract
In recent years, with the development of artificial intelligence, data-driven methodologies have been widely studied in fault diagnosis and detection, since an increasing number of complexities of modern complex systems make the mechanism model information difficult to obtain. Especially in people’s health monitoring, it is very difficult to achieve the mechanism model. The existing challenges, such as huge amount of data, high data dimension, large noise interference, and so forth, make the applications of data-driven approaches more suitable. For the sake of solving the problems above, we present principal component analysis-support vector machine (PCA-SVM) method with different kernels to reduce data dimension, and two sets of breast-cancer data are utilized to verify the method. Additionally, support vector machine-recursive feature elimination (SVM-RFE), the original SVM with different kernels, PCA and modified PCA (MPCA) methods are also applied to diagnose malignant cancer in comparison with PCA-SVM. In experiments, PCA-SVM via radial basis function (RBF) kernel shows better performance than other methods, with the two breast cancer datasets obtained from the University of Wisconsin Hospital. Finally, PCA-SVM in this study uses only six principal components and obtains better accuracy (97.19%) than most of the previous studies.
Introduction
In recent years, monitoring and detection methods based on the mechanism model have been developed rapidly, with the development of artificial intelligence. However, an increasing number of complexities of modern complex systems make the mechanism model information of the system difficult to obtain. For the sake of solving the problems, data are utilized by a growing number of researchers for fault diagnosis and detection (Costas-Perez and Rodriguez-Andina, 2009; Yin and Huang, 2015), and data-driven methodologies have been widely studied (Li et al., 2018; Yin et al., 2014a; Zhang et al., 2018). In the meanwhile, many detection methods were presented and applied in various fields to provide timely diagnosis. For instance, Yang et al. (2016) proposed a fast search method based on principal component analysis (PCA) to search codewords using vector quantization codebooks, which is obtained by PCA with Linde-Buzo-Gray algorithms. Yin et al. (2014b) constructed a fault detection scheme based on the proposed robust 1-class support vector machine (SVM), and the simulation example showed that the robust 1-class SVM was superior to the general 1-class SVM, especially when the training data set is corrupted by outliers. Yang and Hou (2016) used support vector machine-recursive feature elimination (SVM-RFE) method to reduce the dimension of variables to diagnose the faults in the benchmark of fed-batch fermentation penicillin process. Jiang and Yin (2018) proposed a recursive total principle component regression based design and implementation approach for efficient data-driven fault detection, and carried out the simulation tests on the Carsim to compare the proposed approach with multiple existing methods.
The mechanism of human body involves the influence of chemical, physical and physiological factors, therefore it’s very difficult to obtain the mechanism model in people’s health monitoring. With the development of modern medicine, more and more advanced testing instruments have been applied in clinical practice, and a large amount of data can be generated. But there exist many challenges, such as huge amount of data, high data dimension, large noise interference, and so forth, the applications of data-driven approaches seem quite suitable in this field. Medical data is a very wide range, it can be images, audio, video or text. The amount of medical data produced every day is considerable, and if there are appropriate data mining methods, it can greatly reduce the labor of doctors.
Lots of researchers have obtained many fruitful achievements on health monitoring or diagnosis based on data-driven methodologies. Gutta et al. (2018) proposed a likelihood ratio test to detect obstructive sleep apnea (OSA) using the widely available heart rate and peripheral oxygen saturation measurement signals, by conducting experiments on both synthetic and real data to show the effectiveness of the proposed OSA detection framework compared to purely data-driven approaches. Lee et al. (2012) used empirical mode decomposition and statistical approaches to detect motion and noise artifacts in electrocardiograph data. Yang et al. (2019) proposed a multilevel feature extraction method based on wavelet transform and used SVM-RFE method to select the most relevant features for atrial fibrillation detection. Jaganathan and Kuppuchamy (2013) presented the measurement of feature relevance based on fuzzy entropy, tested with a radial basis function (RBF) network classifier, and five benchmarked datasets from the UCI Machine Learning Repository have been used to evaluate the classifier.
Cancer is considered to be one of the leading causes of human death. Early detection can greatly improve the chances of cure, but there are no obvious symptoms at the early stage. In recent years, there has been a lot of data driven early diagnosis of cancer. Wu and Zhou (2017) proposed cervical cancer diagnosis based on SVM, unlike others, cervical cancer data were represented by 32 risk factors and four target variables. Breast density on mammograms may affect the accuracy of breast cancer diagnosis; Haque et al. (2017) developed a system to identify fat and cancer. Two-dimensional discrete cosine transform and principal component analysis were used to extract features, multi-layer perceptron (MLP), SVM and k-nearest neighbor (kNN) were adopted as classifier. Rustam and Maghfirah (2018) considered the presence of related oncogenes. They used SVM-RFE as feature selection and classification method for cancer microarray dataset. In Tan et al. (2011), RFE was modified as a two-stage feature elimination scheme, and the effectiveness of the model was evaluated using a multi-category lung cancer problem. In order to develop an intelligent remote system for detection and diagnosis of breast cancer on the basis of cytological images, George et al. (2014) proposed an algorithm for cell nuclei detection and segmentation. Based on previous work summary, most existing data-based diagnostic methods can be divided into two parts, namely feature selection and classifier design. Feature selection can select some representative data from the original data, or generate new features from the original data by some dimensionality reduction methods. The design of classifier mainly considers its generalization performance, and different samples can be distinguished by features learning, common classifiers include SVM, kNN, decision tree, and so forth (Cheng et al., 2019; Han et al., 2017).
Medical data usually have the character of high dimension, large noise and redundancy. Take the breast cancer dataset used in this paper as example, each patient is represented by a 30-dimensional vector. This 30-dimensional vector contains the nucleus radius, smoothness, cell size uniformity, and so forth. Even for an experienced professional physician, it is difficult to make a diagnosis with these 30 data at the same time. For the sake of solving these problems, this paper presents PCA-SVM with different kernels to reduce dimension of data and diagnose breast cancer. In addition, SVM-RFE, the original SVM with different kernels, PCA and MPCA methods are also applied to diagnose malignant cancer in comparison with PCA-SVM. There are some theoretical assumptions and application limitations about this work. The used datasets come from real patients in hospital, some errors cannot be avoided in the process of data collection, these errors are not considered in the experiment. Also, we assume that real data has large variance, noise has small variance. As for application limitations, the attribues of the newly collected data should be consistent with the dataset used in this article, and the diagnosis result is only for physicians reference. The contributions of this paper can be summarized as follows. Firstly, we put more emphasis on the actual demand of cancer diagnosis and want to find a concise but reliable data-driven breast diagnosis method, PCA-SVM is such a method, which can guarantee high accuracy without using too much computation. Secondly, MPCA is the first time to be used in cancer diagnosis. MPCA can calculate the diagnostic threshold of malignant tumor, which is a completely new idea for malignant tumor diagnosis. Thirdly, in addition to the previous researches, we also applied a variety of machine learning methods for comparative studies, including decision tree, random forest and neural networks. The results of these comparative studies also prove the superiority of PCA-SVM.
The remaining parts of the paper are organized as follows. The fundamentals of SVM and evaluation criteria are briefly reviewed in Section 2. Section 3 introduces the methodologies used in this paper, and discusses PCA-SVM, SVM-RFE, and MPCA approaches. Two sets of experiments are presented and discussed in Section4, to show the validity and practical applicability of the presented method. Finally, Section 5 gives a brief summary.
Background
SVM
As mentioned in Section 1, data-driven approaches are quite suitable for breast cancer diagnosis. The remarkable generalization ability of SVM makes it one of the most popular types of classification algorithms. SVM was presented on the basis of the Vapnik-Chervonenkis Dimension theory and structural risk minimization principle according to statistical learning theory (Vapnik, 2013). Therefore, the classification result is not related with the sample dimension.
Evaluation criteria for diagnosis performance
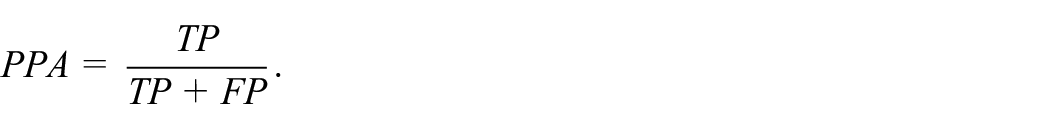
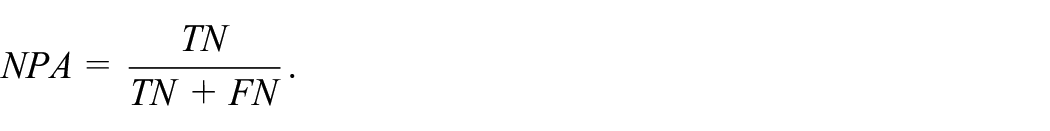
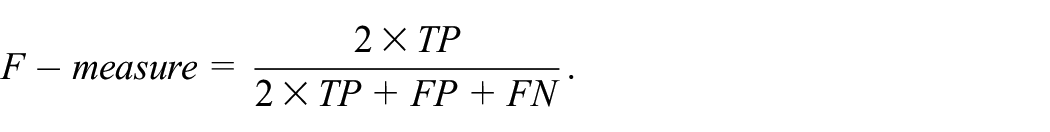
The effectiveness of different attributes should be evaluated by suitable metrics based on the true / false positive / negative classification results. True positives (TP) and true negatives (TN) represent the cases that the predicted classes match the actual (true) classes of the instances, and false positives (FP) and false negatives (FN) correspond to the opposite cases. The most common metrics are accuracy, sensitivity, specificity, positive predictive accuracy (PPA), negative predictive accuracy (NPA), F-measure, Kappa statistics, and they are introduced as follows.
The classification accuracy can be calculated as

The sensitivity, which also means true positive rate, can be defined as

The specificity or true negative rate, is calculated by

Precision is also called PPA, and it can be calculated as
NPA is computed by
F-measure also means F-Score, it is defined as
Kappa statistics can be computed by
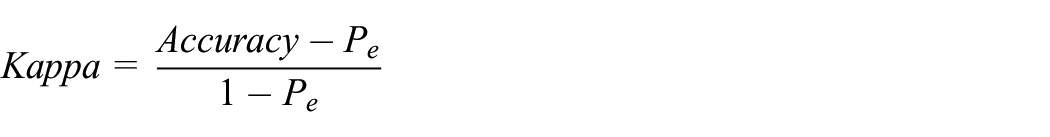
where
Algorithm
PCA-SVM
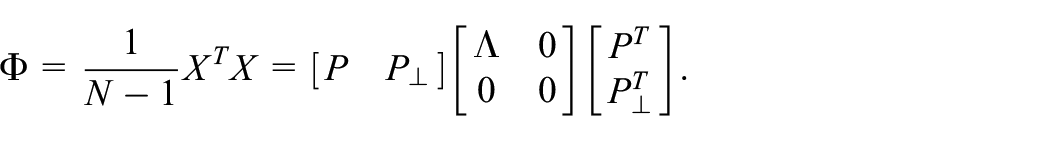
PCA has been widely studied in many fields (Li et al., 2011; Yin et al., 2012). It converts multiple relative variables into a few irrelevant ones, namely principal components. In the meanwhile, the information of data is preserved after the dimension is reduced. Cancer diagnosis using PCA-SVM method can be considered as a two-stage process, PCA projects high-dimensional input data into low-dimensional principal components, then the selected principal components are used as the input of SVM for classification. Therefore, how to select the principal component is the key point of this method.
The original cancer data

where

In order to compute

meanwhile
In this way,


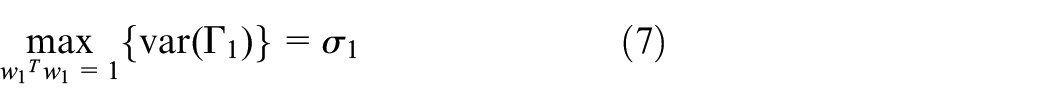
It can be seen, when the constraints are
Let

where

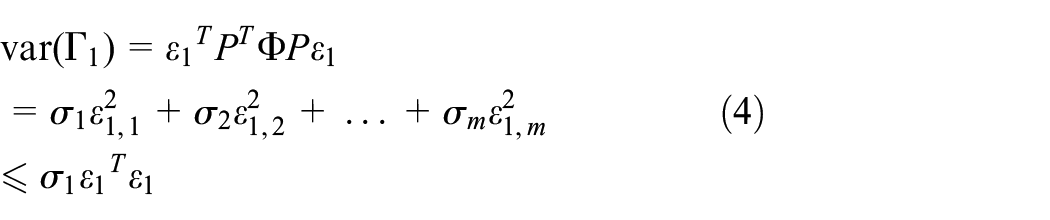
Therefore, the variance
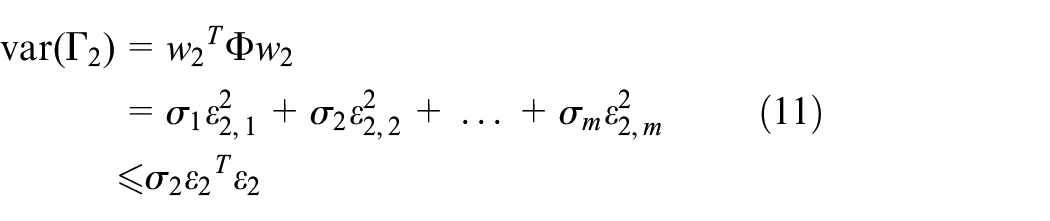
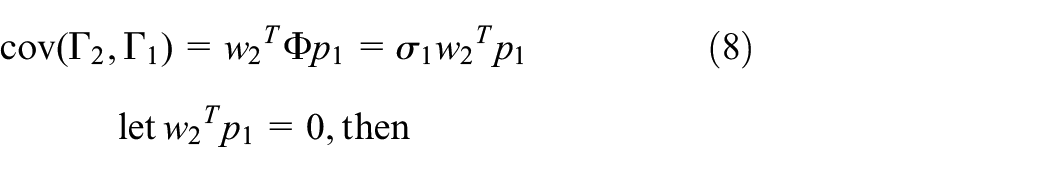
Similar to the first principal component, under the conditions of
PCA-SVM is a method combining dimension-reduction and classification. The purpose of PCA is dimension-reduction, so the input is the original data, namely X, and the output is the feature after dimension reduction, namely principal component
SVM-RFE
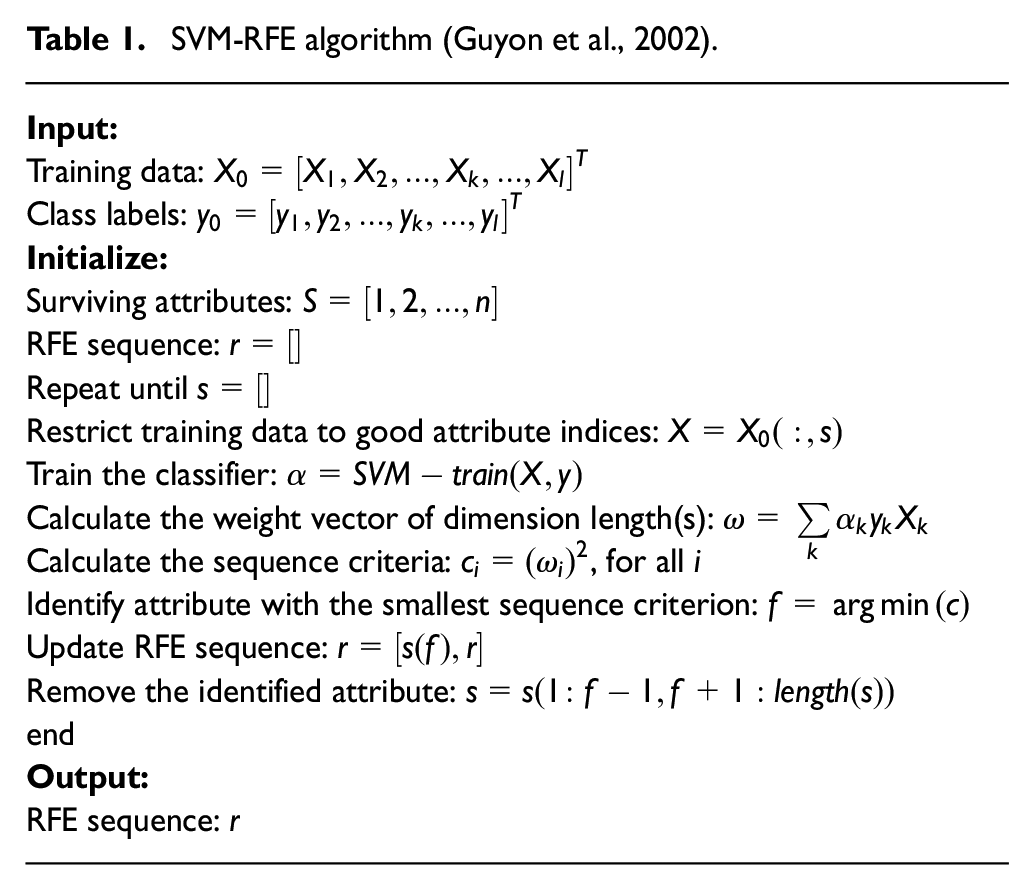
In order to reduce the dimension of the breast cancer database and obtain the most relevant attributes, SVM-RFE method (Table 1), which was proposed by Guyon et al. (2002) in dealing with colon cancer classification. The purpose is selecting the minimum set of attributes to achieve the optimal accuracy (John et al., 1994). Attributes will be listed in descending order of contribution to diagnosis accuracy (what is called RFE sequence) by using SVM-RFE. Each iteration will eliminate the most irrelevant attribute, until the RFE sequence is obtained. The irrelevant attribute eliminated at the beginning of iterations may typically be noisy or redundant. The process is finished when classification accuracy decreases after elimination of the last feature on the RFE sequence. Hence, the best diagnosis accuracy can be achieved with the minimum number of (relevant) attributes.
SVM-RFE algorithm (Guyon et al., 2002).
Modified PCA
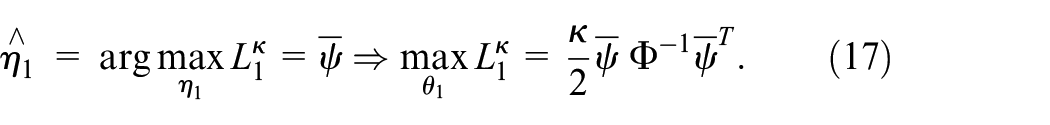
Modified PCA (MPCA) method aims at combining squared prediction error (SPE) and
The likelihood ratio approach is widely utilized in diagnosis and detection, and the system model is

where
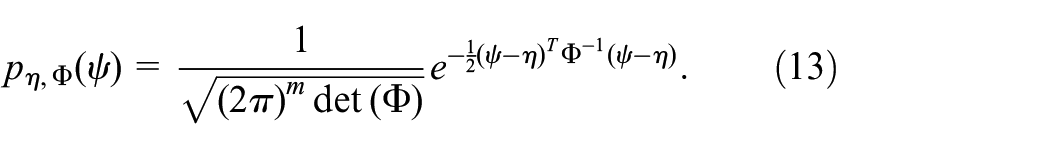
With the Gaussian vector
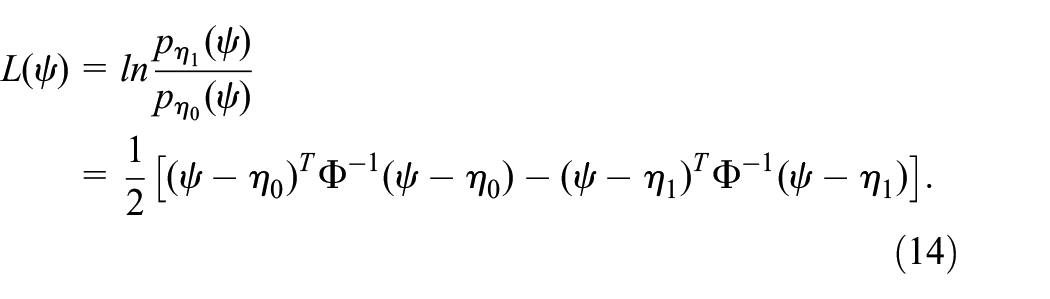
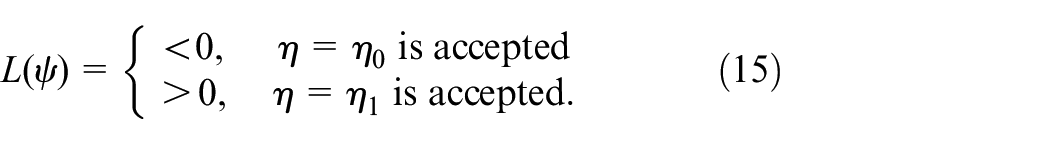
According to the decision rule, the core of likelihood ratio approach is represented as
Assume that
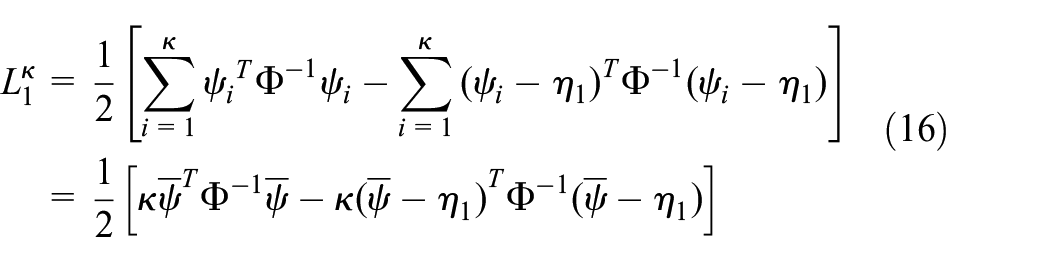
where
Noticing that
Set the threshold
Define test statistic

where
Define detection logic
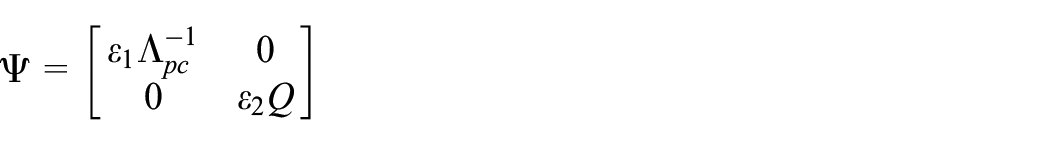
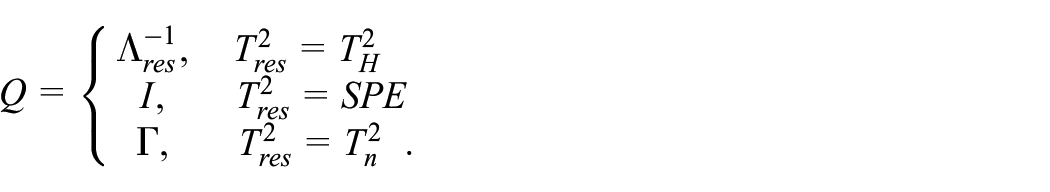
According to standard PCA statistics approach,
As for monitoring the residual subspace, in order to avert the possible problem of
Define
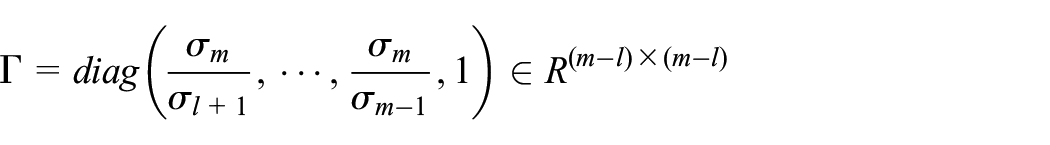
Then

and

where x is the normalized samples,


The diagnosis performance can be improved with
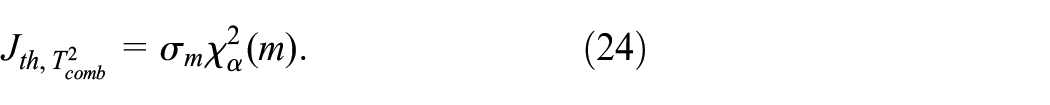
In order to ensure a high diagnosis accuracy, the linear combination of two statistics is applied for diagnosis.

where

where

where
Covariance matrix
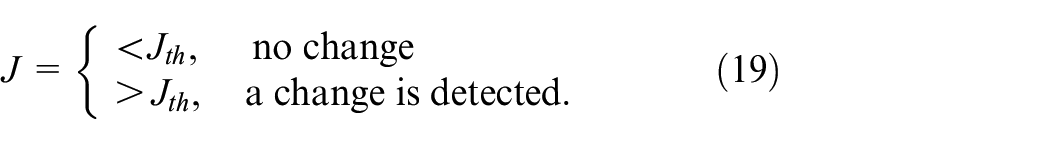
Abnormal situation can be diagnosed by utilizing the combined statistic from equation (23) with the related threshold in equation (24) and the parity examination

In this paper, if
Experiments
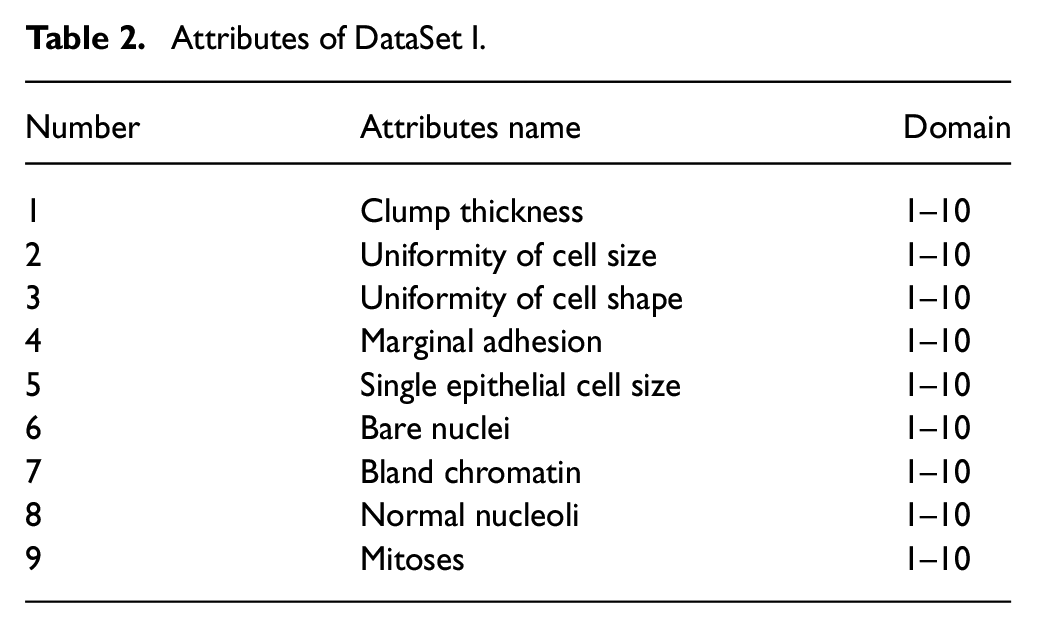
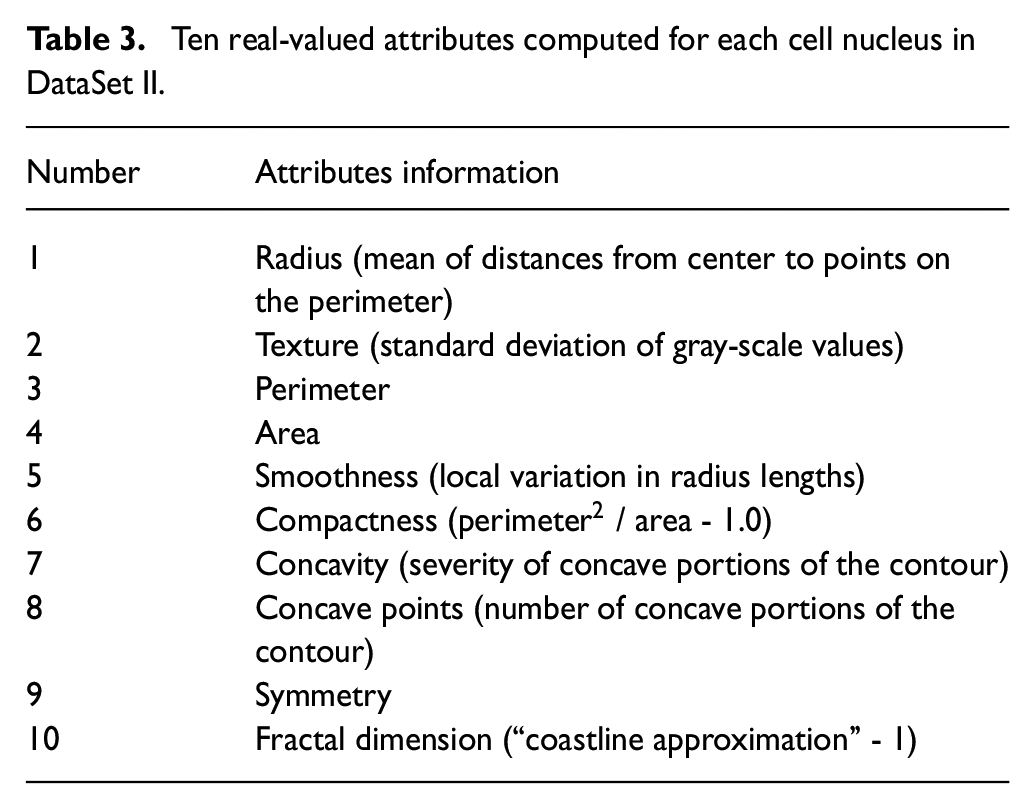
In order to verify the effectiveness of the presented algorithm in health monitoring, two breast cancer datasets are used in the experiments which are both from the University of Wisconsin Hospital (Mangasarian et al., 1995; Wolberg and Mangasarian, 1990). One dataset is a small set contains nine attributes, and the other one is a high dimension dataset with 30 attributes. In the first one, there are totally 699 groups of data from 699 patients, and 458 (65.5%) of them are benign and malignant data are in 241 (34.5%) groups. Since there exist missing attribute values in 16 groups, these groups of data are removed, in order to avoid deviations in the diagnostic results. Finally, 683 groups (444 benign and 239 malignant groups, respectively) are employed in the experiments. The attributes of the dataset (DataSet I) are shown in Table 2. There are totally 357 benign (62.7%) and 212 malignant data (37.3%), respectively, in the second dataset (DataSet II), and the attribute information is shown in Table 3. It can be observed that the data scales of the DataSet I and DataSet II, are both large enough for the diagnosis performance considered for evaluation criteria (Section II-C) to be valid in this context.
Attributes of DataSet I.
Ten real-valued attributes computed for each cell nucleus in DataSet II.
Firstly, 10-fold cross-validation method is used to split training and testing data for both of the two breast cancer datasets. After that, two kinds of dimension reduction algorithms, PCA-SVM and SVM-RFE are employed to compare with original SVM classifier with different kernels on the basis of DataSet I, and the methods are also used to diagnose malignant cancer on DataSet II. Secondly, two statistic methods, PCA and MPCA are used to compare the diagnosis performances on DataSet I. Then, the optimal statistic method is also utilized to diagnose malignant cancer of DataSet II to compare the results with other previous studies using the same dataset.
The experiments based on DataSet I
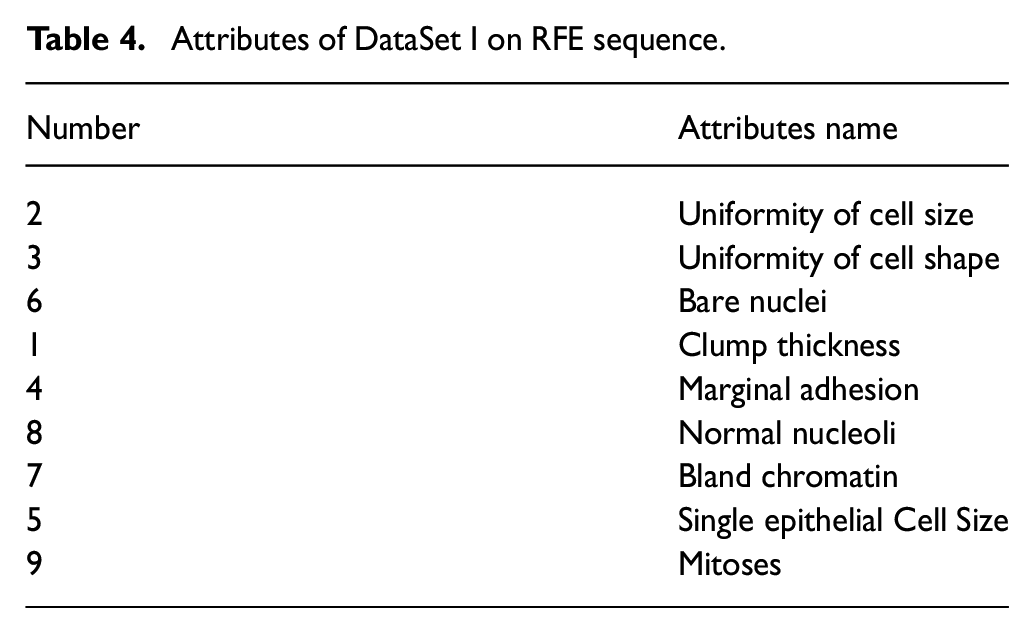
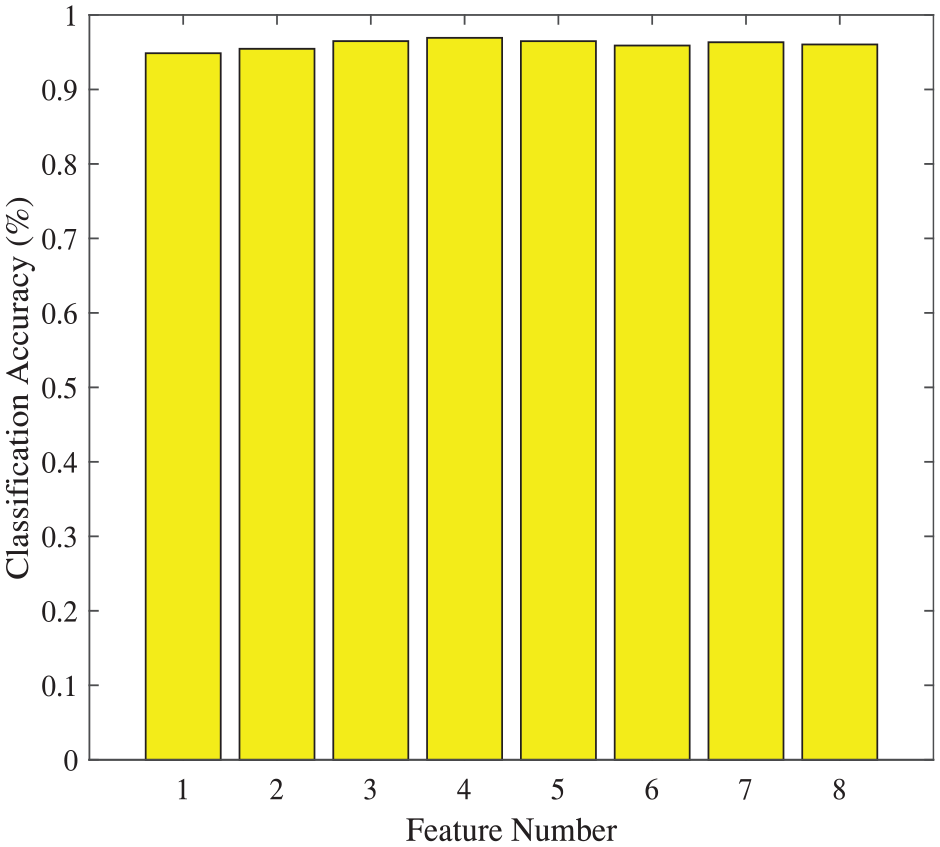
Firstly, SVM-RFE algorithm is employed to reduce the data dimension of DataSet I, and to obtain RFE sequence after iterations. As shown in Table 4, the “uniformity of Cell Size” is the most relevant attribute of all, and the most irrelevant attribute is “mitoses”. On the basis of the RFE sequence, different numbers of attributes are chosen to feed the linear and RBF kernel SVM classifiers, respectively. As shown in Figure 1, the best classification accuracy 96.78% is obtained with the first six sets of attributes in the RFE sequence. In comparison, Figure 2 shows that the best result 96.93% obtained by RBF kernel SVM is better, with four of the most relevant attributes.
Attributes of DataSet I on RFE sequence.
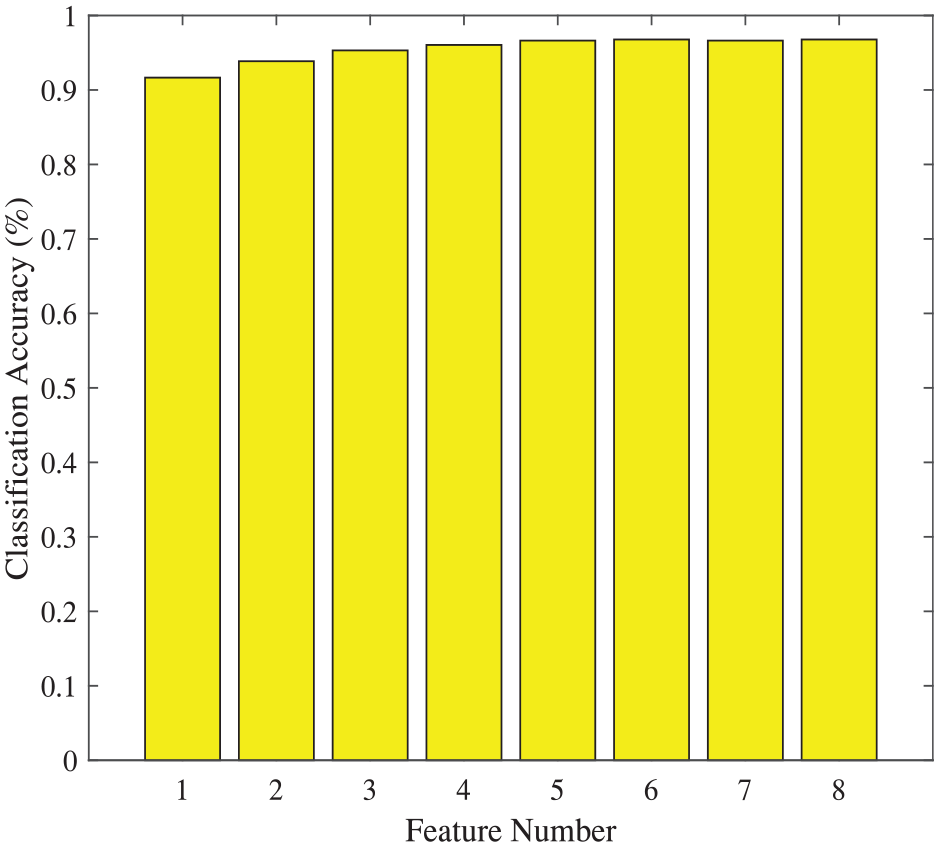
Classification accuracies based on DataSet I via SVM-RFE method (linear kernel).
Classification accuracies based on DataSet I via SVM-RFE method (RBF kernel).
Secondly, the training and testing data of Dataset I are introduced into PCA-SVM algorithm, and two kinds of SVMs, linear and RBF kernal SVMs are used in this experiment. As the results shown in Figure 3 and Figure 4, the best classification accuracy 97.21% obtained by RBF kernel is better, 1.61% higher than the 95.60% obtained on the basis of linear kernel SVM with the same five principal components.
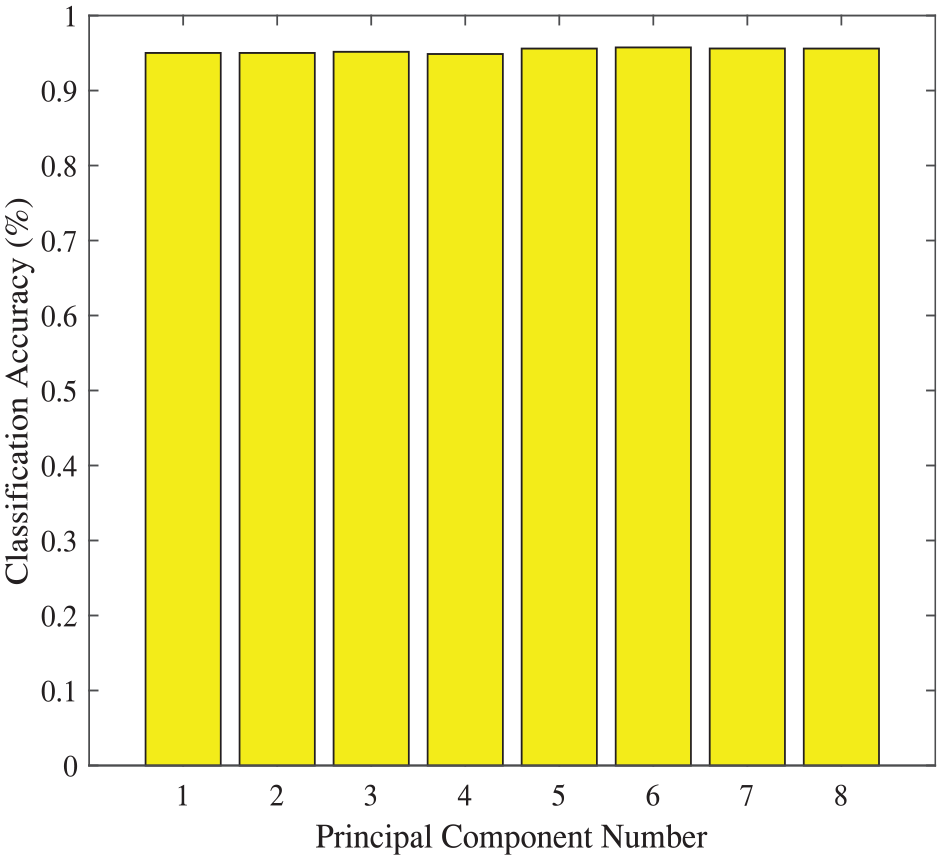
Classification accuracies based on DataSet I via PCA-SVM method (linear kernel).
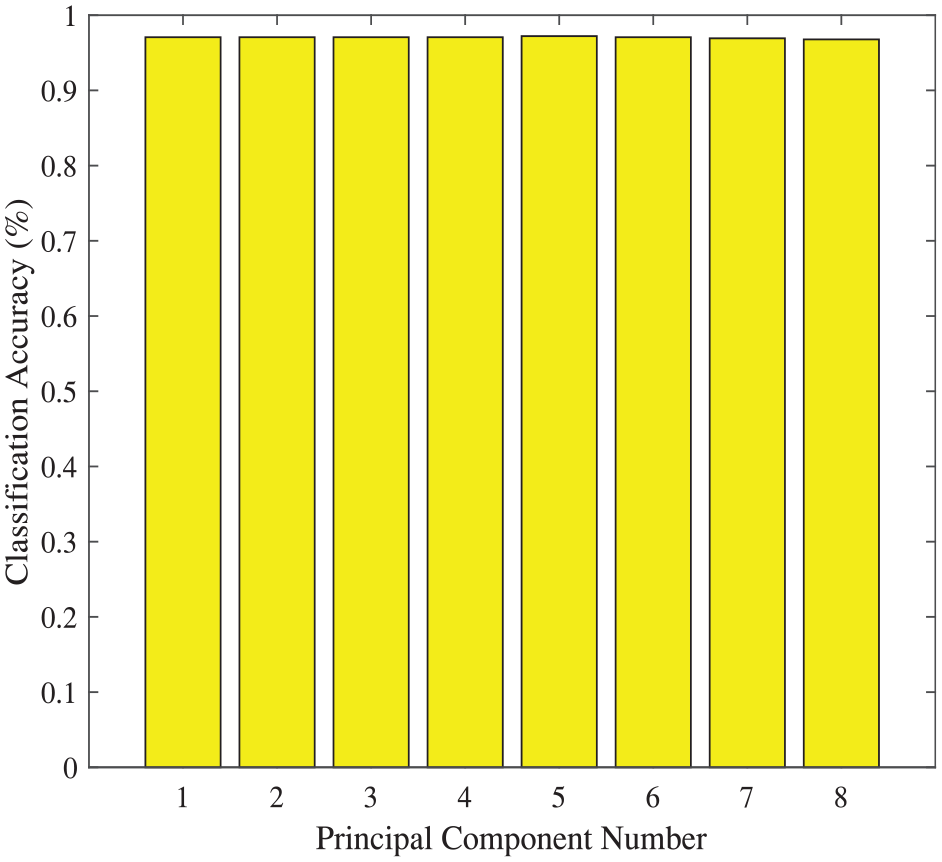
Classification accuracies based on DataSet I via PCA-SVM method (RBF kernel).
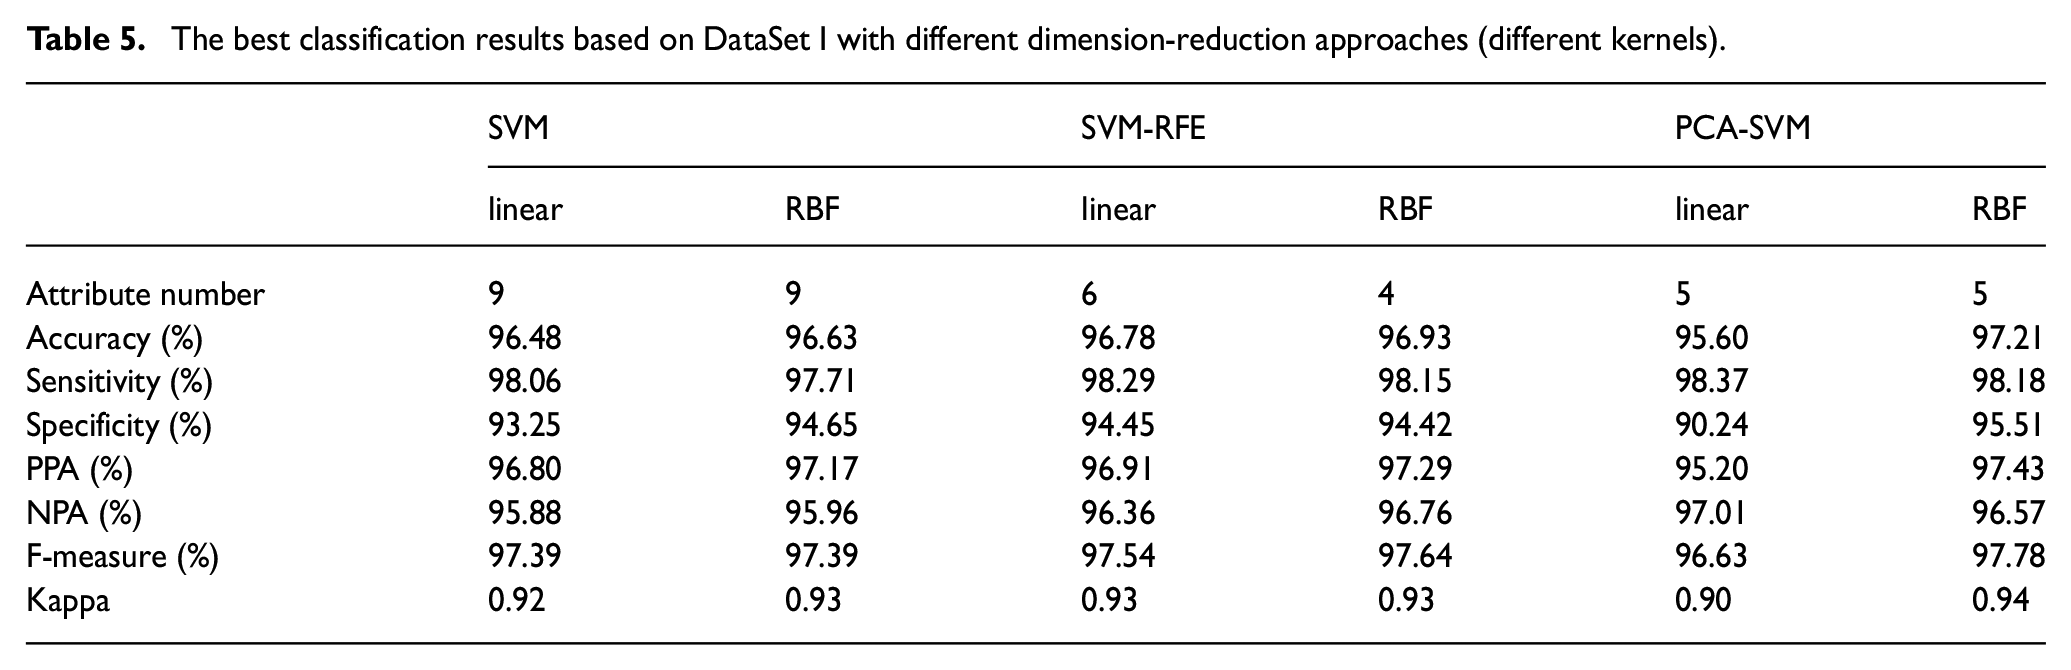
Table 5 shows the classification results obtained by SVM, SVM-RFE, PCA-SVM with different kernels based on DataSet I. Both SVM-RFE and PCA-SVM methods show better diagnosis performance than original SVMs with RBF kernel. The best result of all is 97.21% obtained by PCA-SVM method based on RBF kernel with five principal components.
The best classification results based on DataSet I with different dimension-reduction approaches (different kernels).
PCA has two traditional statistical indicators:
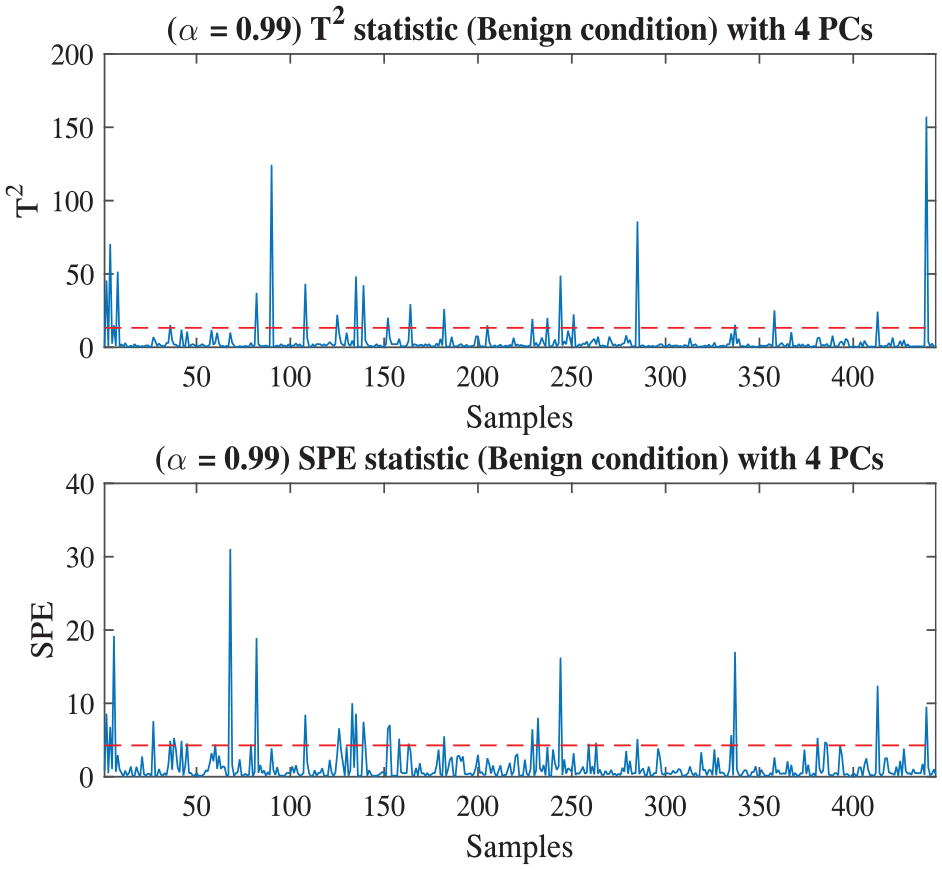
PCA statistics under benign conditions of DataSet I.
The diagnosis result obtained on the basis of PCA statistics is shown in Figure 6, and the accuracy is 94.59%. Almost all of the malignant data are exceeding the threshold, indicating that the data are diagnosed accurately except for a few samples. However, compared with the results in Table 5, the accuracy obtained by PCA statistics is still a little worse than those of SVM-RFE, PCA-SVM, and even SVM classifier.
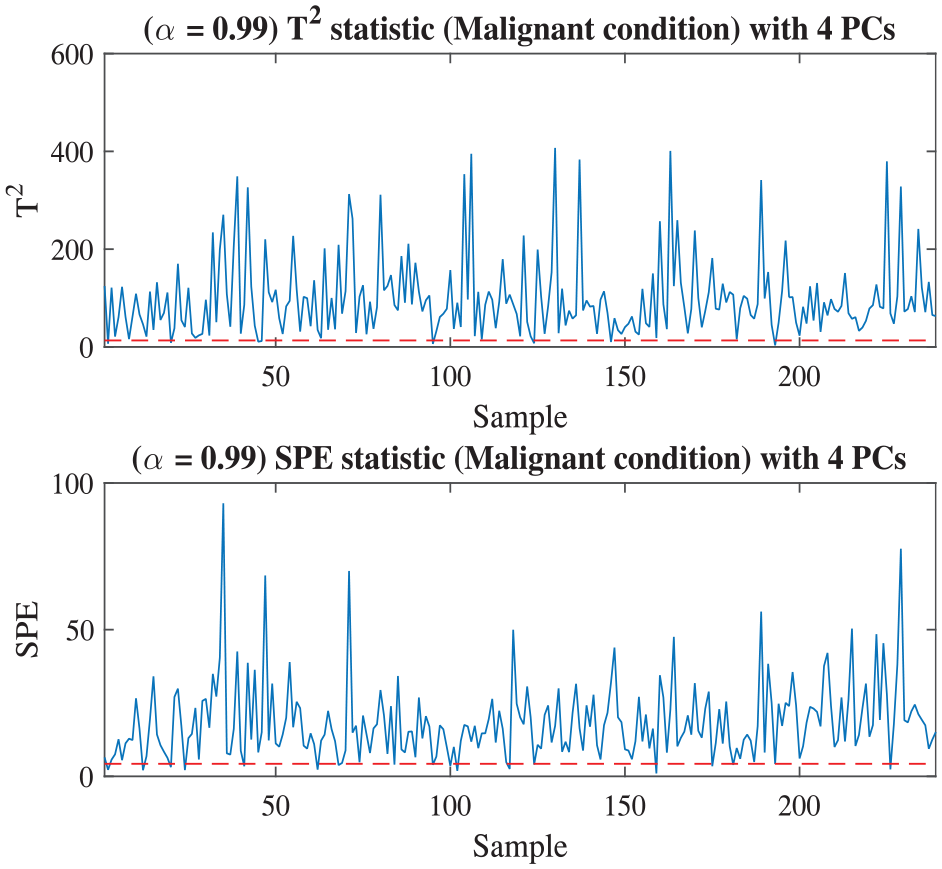
Malignant diagnosis based on DataSet I via PCA statistics.
The benign and malignant data of DataSet I are also introduced into MPCA to compare with the accuracy obtained by PCA statistics. As shown in Figure 7, the threshold is 6.1337 and the accuracy is 98.70%, 4.11% higher than the result on PCA statistics. Compared with the results in Table 5, MPCA shows very good performance on diagnosing malignant cancer, and its accuracy is better than all the other methods.
Malignant cancer diagnosis based on DataSet I via MPCA.
The experiments based on DataSet II
In Table 5, it can be found that all of the dimension-reduction approaches with RBF kernel function have better results than those with linear kernel function. Therefore, the approaches with RBF kernel function are employed to analysis the DataSet II in this set of experiments. In Table 6, RBF kernel SVM classifier uses all the 30 attributes to reach 89.63% accuracy. An accuracy 92.45% is achieved by SVM-RFE method with 12 relevant attributes, as shown in Figure 8. The best classification accuracy 97.19% is obtained on the basis of PCA-SVM with RBF kernel fuction (in Figure 9), using only six principal components. It is 4.74% and 7.56% higher than the accuracies obtained by SVM-RFE and SVM with RBF function, respectively.
The classification results based on DataSet II with dimension-reduction approaches (RBF kernel) and machine learning methods.
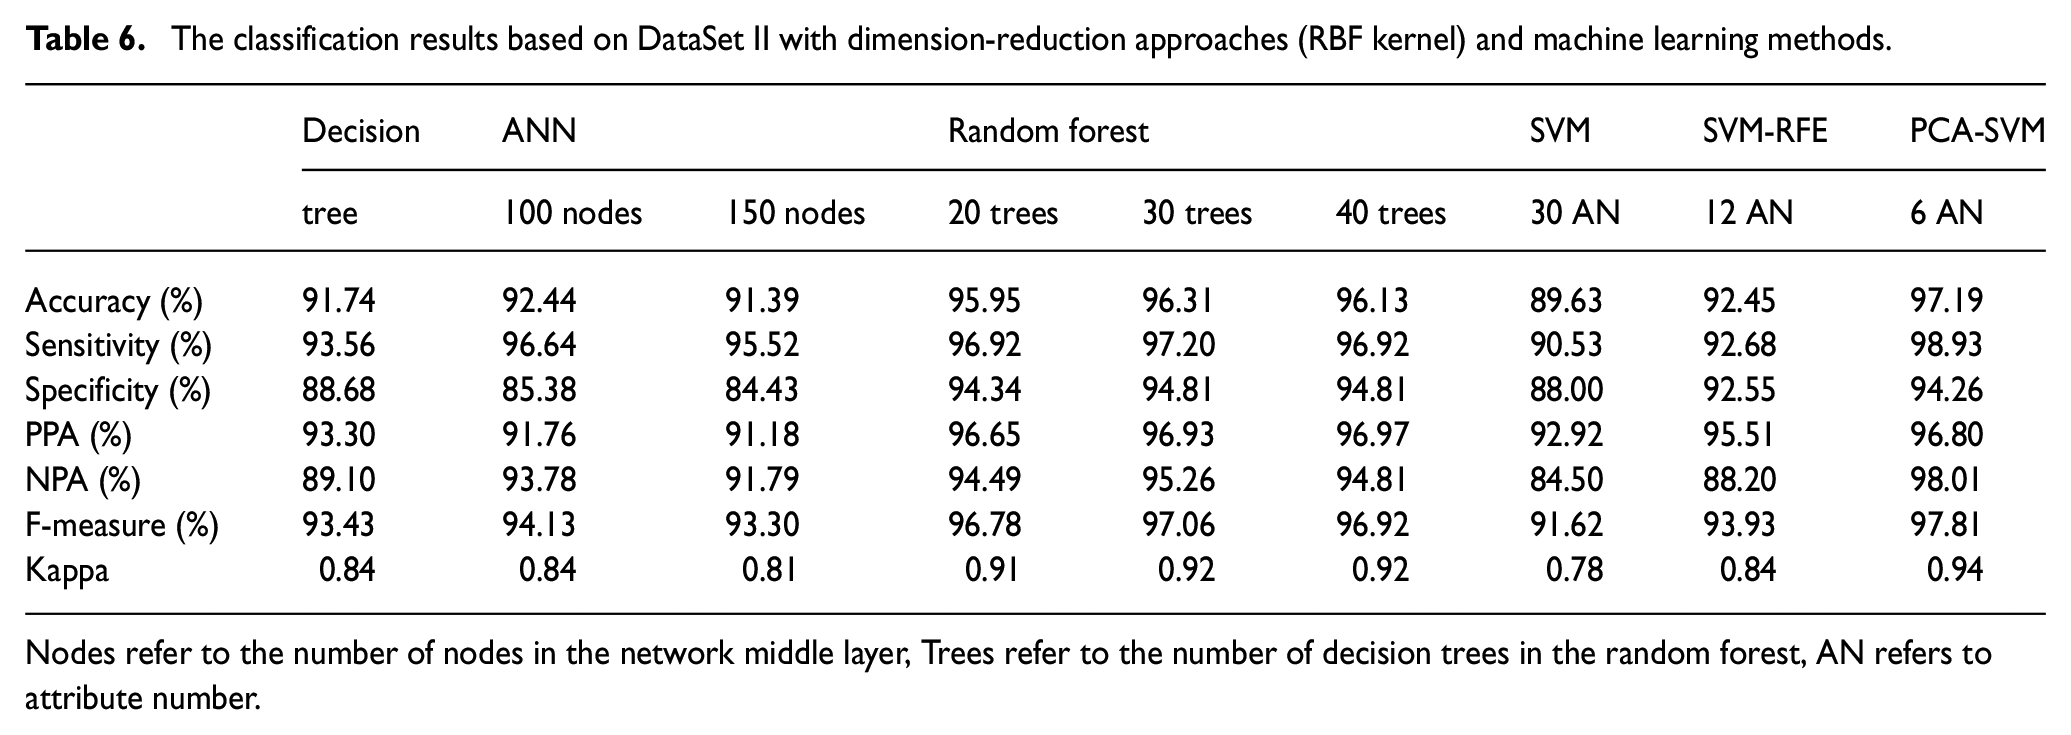
Nodes refer to the number of nodes in the network middle layer, Trees refer to the number of decision trees in the random forest, AN refers to attribute number.
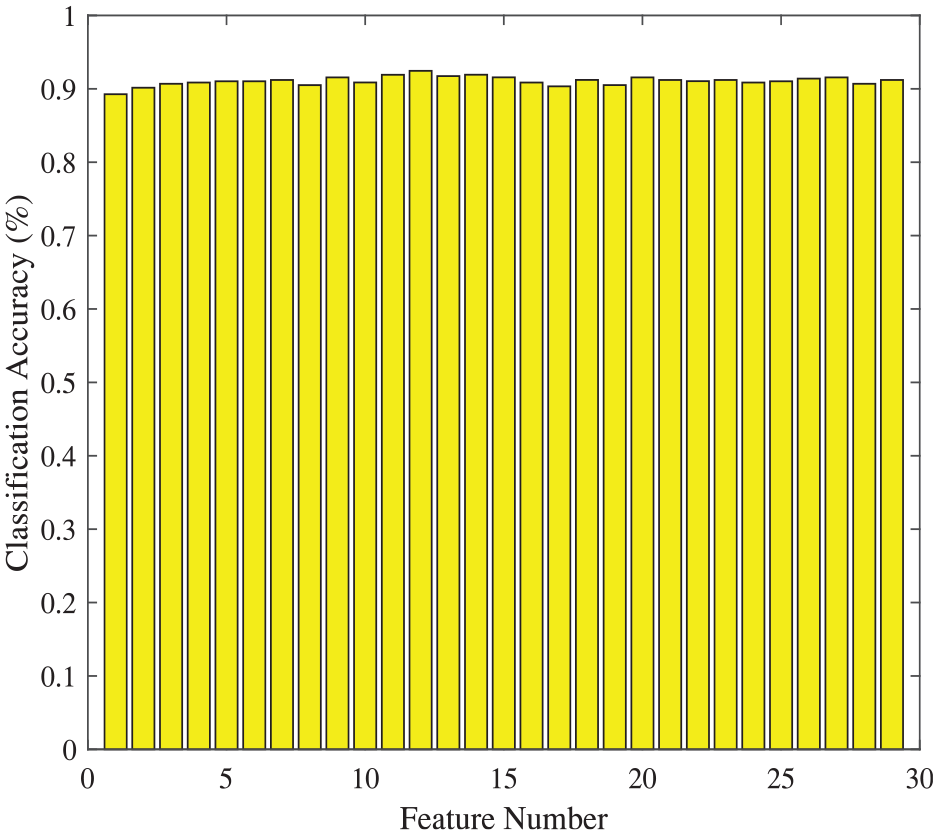
Classification accuracies based on DataSet II via SVM-RFE method (RBF kernel).
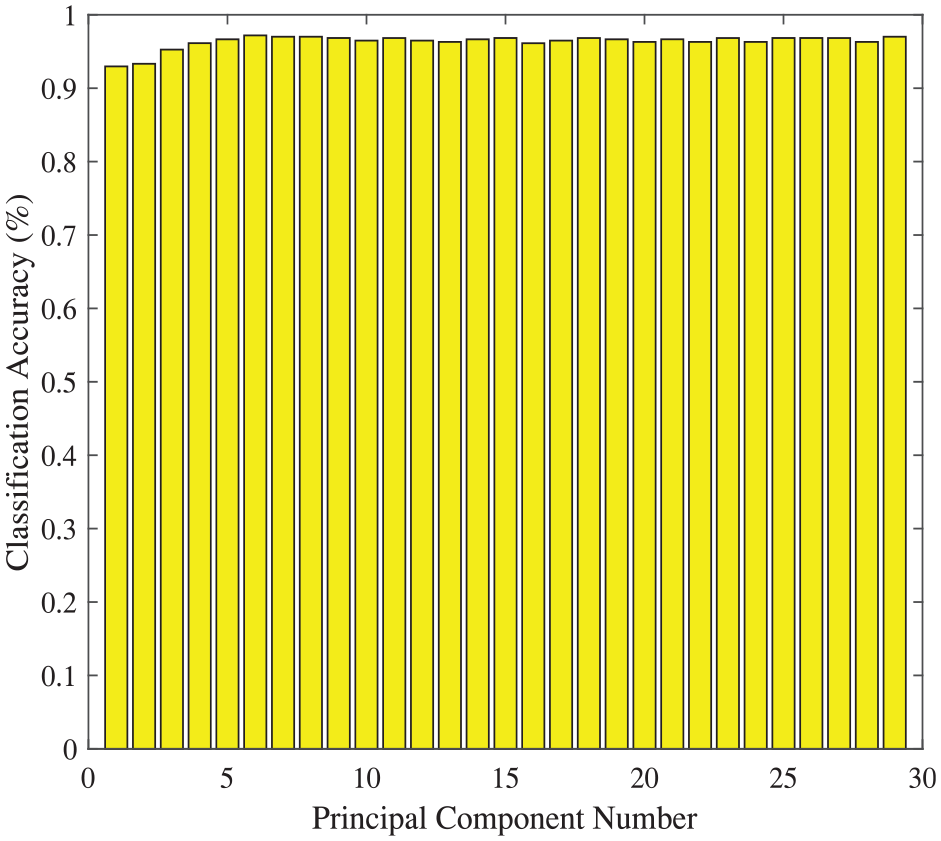
Classification accuracies based on DataSet II via PCA-SVM method (RBF kernel).
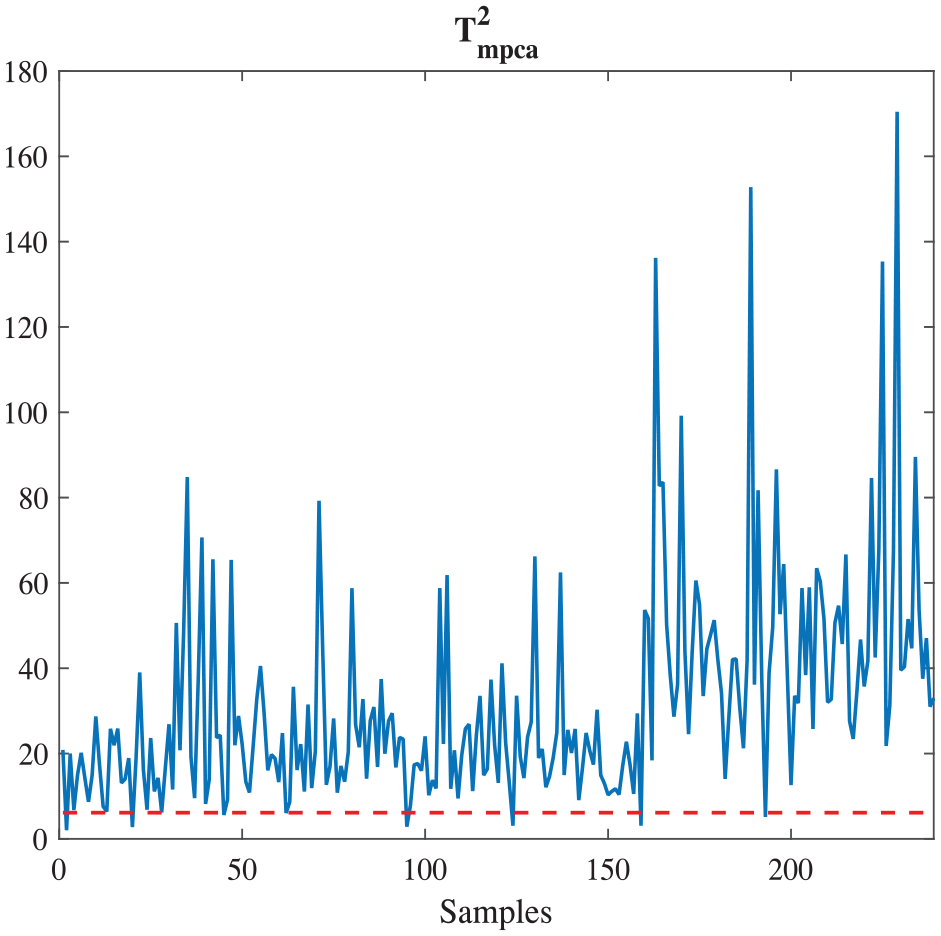
From Figure 6 and Figure 7, MPCA has better accuracy, 4.11% higher than PCA, when they are employed to classify the DataSet I. Similarity, MPCA is applied to analysis DataSet II. In Figure 10, the threshold is 0.0038 and the accuracy is 96.00%. Compared with the results in Table 6, the accuracy obtained by MPCA is 3.55% and 6.37% higher than the ones by using SVM-RFE and SVM, and 1.19% lower than the accuracy achieved by PCA-SVM.
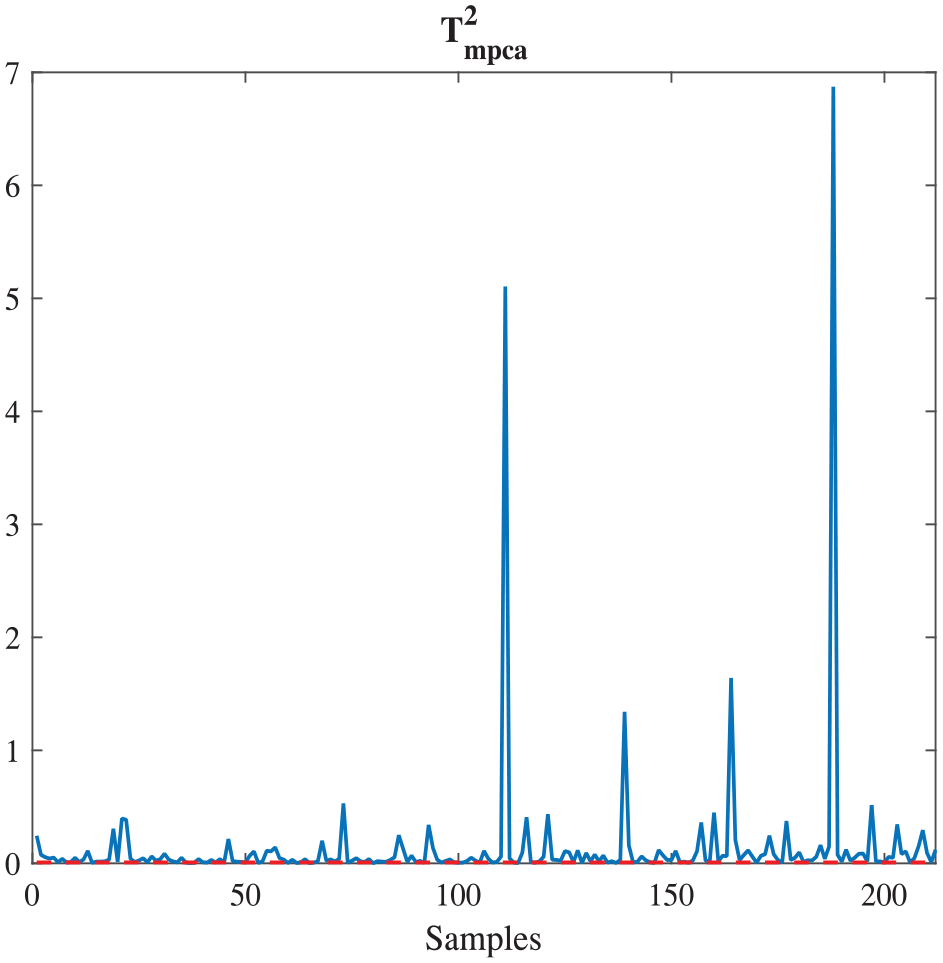
Malignant cancer diagnosis based on DataSet II via MPCA.
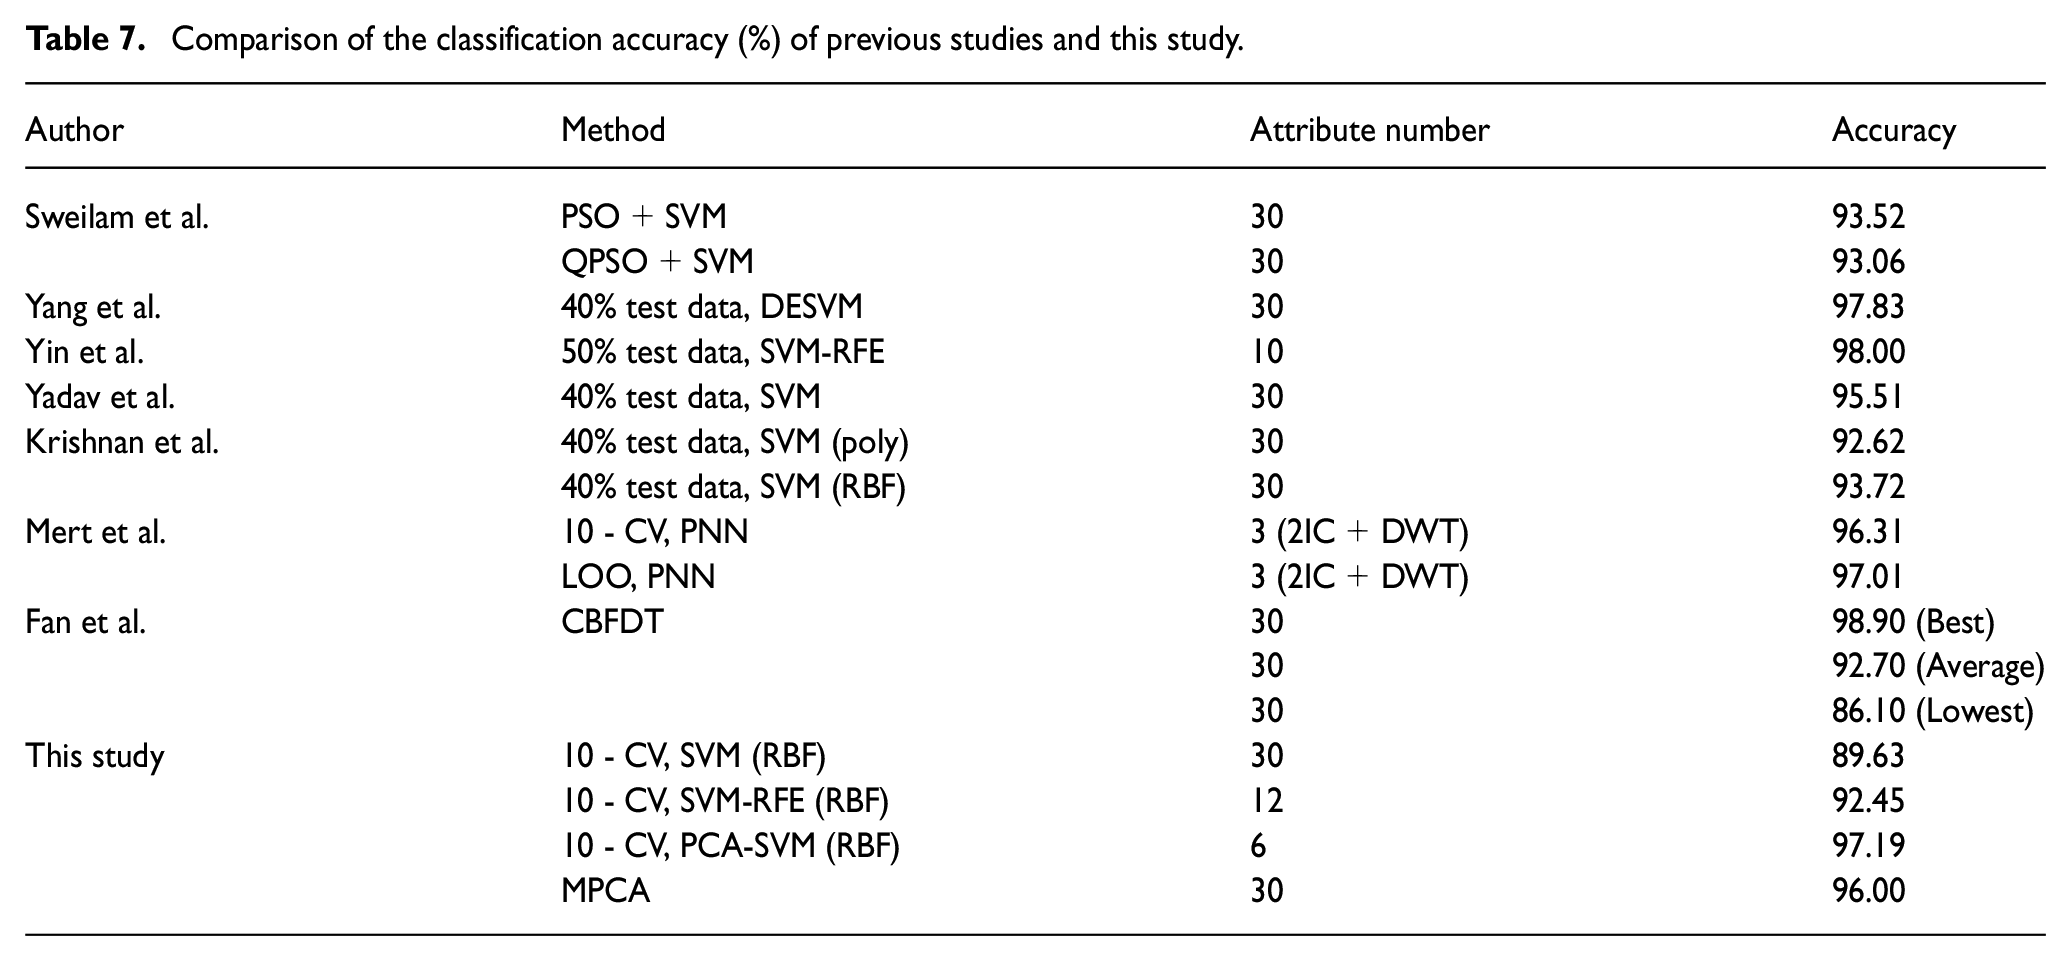
With the comparison of the results between previous studies (Fan et al., 2011; Krishnan et al., 2010; Mert et al., 2014; Sweilam et al., 2010; Yadav et al., 2019; Yang et al., 2019) and this study in Table 7, it can be found that the 10-CV, PCA-SVM (RBF) used in this study has the highest accuracy (97.19%) except the best result (98.90%) of CBFDT, which was proposed by Fan et al. (2011). They used all the attributes, while the results obtained in this paper is based on PCA-SVM using six principal components only. The results for Yang and Xu (2019) and Yin et al. (2016) are also slightly better than our results, because they do not use cross-validation and simply group some datasets into testsets, potentially making test dataset easier to distinguish. Yadav et al. (2019) also used SVM classifier whose result is different from ours, it is also because of the partition of test dateset, they used 40% data as test dataset. We used 10-fold cross-validation, and the results are less random and more reliable.
Comparison of the classification accuracy (%) of previous studies and this study.
In addition, in order to show our results are more convincing, it is compared with the common used statistical machine learning methods such as decision tree (Quinlan, 1986), artificial neural network (ANN) (Rumelhart et al., 1986) and random forest (Vladimir et al., 2003). The designed decision tree is a tree structure with a depth of four, which adopts pruning algorithm, and the tree structure is shown in the Figure 11. The neural network is a common three layer classification neural network, which adopts cross entropy loss function, and the optimizer is Adam (Kingma and Ba, 2014). The number of nodes in the middle layer is taken as the variable to explore. Random forest is an ensemble algorithm based on decision tree, so the number of decision trees is taken as the variable to explore. 10-fold cross-validation was also used in all the experiments, all the experimental results are shown in the Table 6. It can be seen that among these algorithms, random forest has the best performance when there are 30 trees, but it is still lower than 10-CV, PCA-SVM (RBF). What is more, these methods have no dimensionality reduction process, so 30 attributes are directly used for classification.
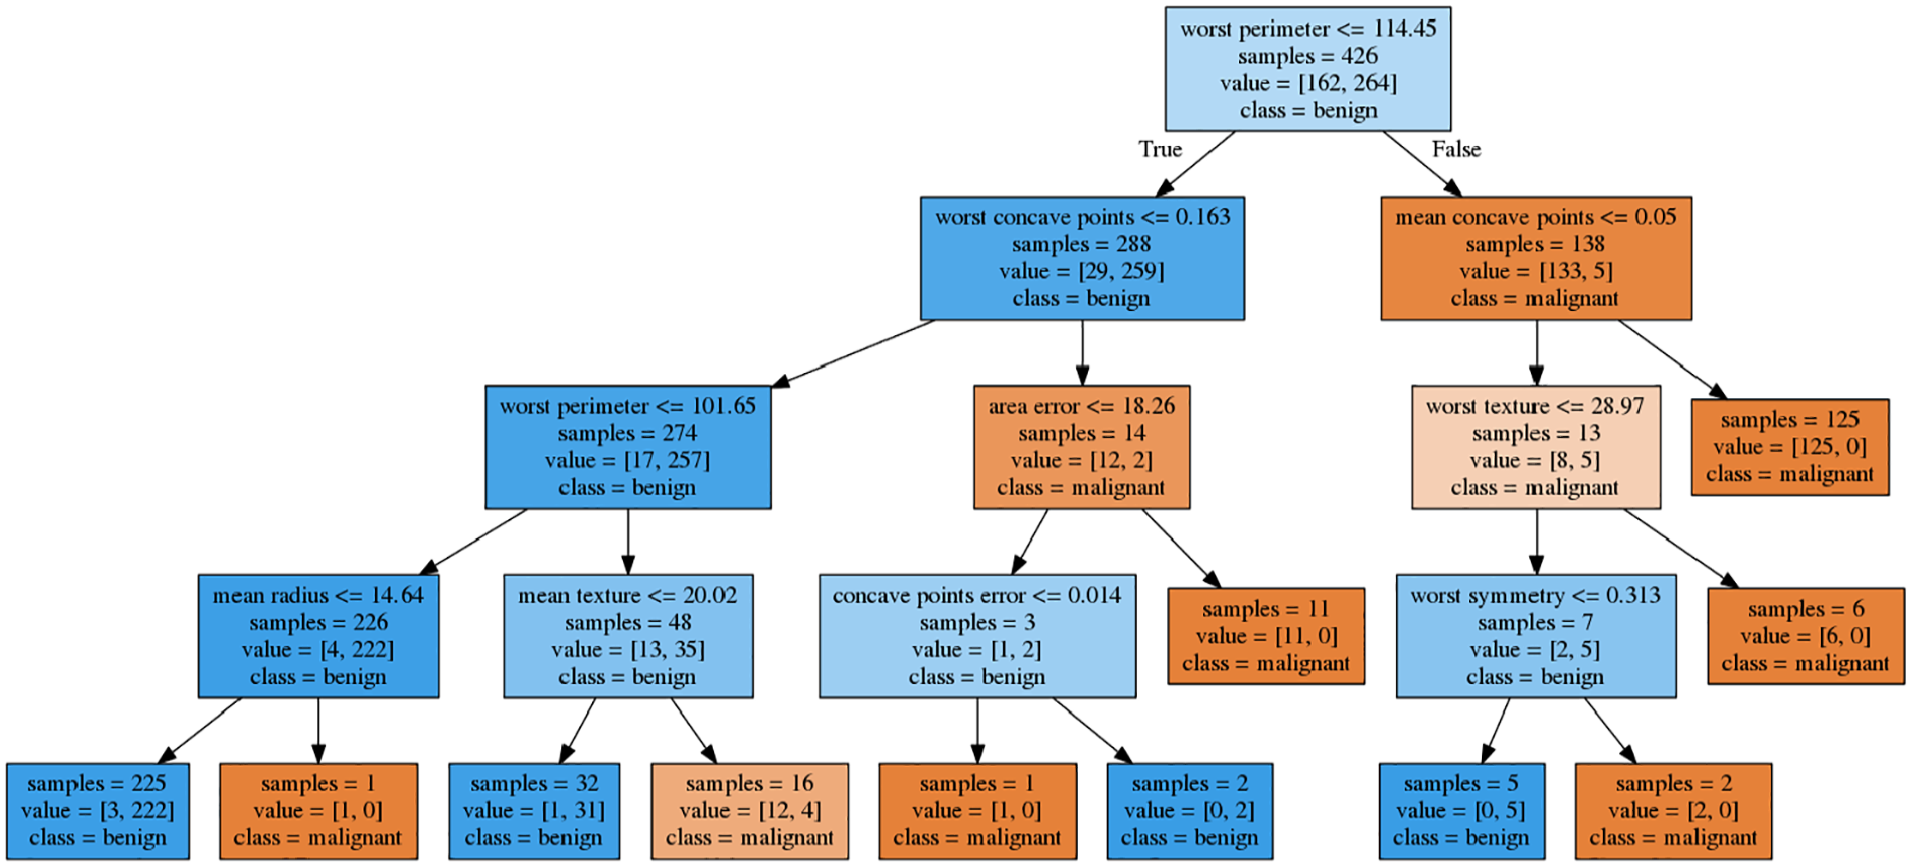
Decision tree structure.
Conclusion
In this paper, PCA-SVM is presented for health monitoring. In order to verify the method, two sets of experiments are conducted to compare the performance of different methodologies on two breast cancer datasets. PCA-SVM and SVM-RFE with different kernels are respectively employed to analysis the DataSet I in the first set of experiments. With the optimal numbers of attributes (four of nine attributes totally) on RFE sequence, SVM-RFE method with RBF kernel shows better performance than the one via linear kernel. The diagnosis accuracy (96.93%) is better than those of original SVMs, no matter the SVM classifiers are based on linear (96.48%) or RBF kernel (96.63). However, PCA-SVM with RBF kernel shows the best performance and it reaches an accuracy 97.21%. Then, PCA statistics and MPCA approach are also utilized to diagnose the malignant cancer of the DataSet I. The accuracy on MPCA approach is 98.70%, 4.11% higher than the one achieved by PCA statistics, and also 1.49% higher than the result based on PCA-SVM with RBF kernel. In the second set of experiments, dimension-reduction approaches with RBF kernel and MPCA method are used to diagnose malignant cancer of DataSet II. The accuracy obtained by PCA-SVM with RBF kernel is 97.19%, it is 1.19%, 3.55% and 6.37% higher than the ones by using MPCA, SVM-RFE and SVM via RBF kernel, respectively.
As the work in the paper shows, the diagnosis based on PCA-SVM via RBF kernel obtains a good performance with a small set of attributes, even with a high dimension dataset. On the DataSet I, although the result obtained on the basis of PCA-SVM is a little lower than the one based on MPCA, the presented method could diagnose malignant cancer effectively after reducing the data dimension of DataSet II, and it shows very good performance on solving high data dimension, large noise interference problems. Compared with the results of other previous studies, 10-CV, PCA-SVM (RBF) used in this study shows better performance than most of other methods in previous studies by using six principal components only.
Footnotes
Declaration of conflicting interests
The author(s) declared no potential conflicts of interest with respect to the research, authorship, and/or publication of this article.
Funding
The author(s) received no financial support for the research, authorship, and/or publication of this article.