






Abstract
For the characteristics of nonlinear and multi-phase in the batch process, a self-adaptive multi-phase batch process fault diagnosis method is proposed in this paper. Firstly, kernel entropy component analysis (KECA) method is used to achieve multi-phase partition adaptively, which makes the process data mapped into the high-dimensional feature space and then constructs the core entropy and the angular structure similarity. Then a multi-phase KECA failure monitoring model is developed by using the angular structure similarity as the statistic, which is based on the partitioned phases and the effective failure features by the KECA feature extraction method. A multi-phase batch process fault diagnosis method, which applies the multi-class support vector machines (MSVM) and fireworks algorithm (FWA), is proposed to recognize each sub-phase fault diagnosis automatically. The effectiveness and advantages of the proposed multi-phase fault diagnosis method are illustrated with a case study on a fed-batch penicillin fermentation process.
Keywords
Introduction
Batch processing is extensively utilized in modern production fields such as food, materials, chemicals, and pharmaceuticals (Luo et al., 2018; Meng et al., 2013). For the characteristics of batch process like multi-phase production process, the high repetitiveness of the operation process, and the rapid change of the internal dynamic and so on, those inevitably lead to the problems of production reliability and safety (Kerkhof et al., 2012; Spooner and Kulahci, 2018). The multi-phase characteristic of batch process makes it more difficult to monitor the batch process effectively and detect the potential safety threats timely.
Many multivariate statistical methods have been increasingly studied to deal with the multi-phase fault problem in the past decades. In multi-phase fault diagnosis methods, two critical issues are how to achieve an effective phase division and how to build the online accurate local fault diagnosis models. The first step is to divide the batch process into different phases reasonably and effectively. Numerous phase partition methods were developed as surveyed (Ge et al., 2013; Lu et al., 2004; Guo et al., 2018; Liu et al., 2016; Tang and Li, 2019; Yongyong and Xiaoqiang, 2018; Zhang et al., 2017; Zhao et al., 2010; Zhao et al., 2016). The K-means partitioning algorithm is used to divide the batch process and classify it into several stable sub-phases (Lu et al., 2004; Zhao et al., 2010). But the effectiveness of K-means phase partition method is unstable, which depends on the parameter selection. Guo et al. (2018) developed a novel two-step phase partition idea based on improved affinity propagation (AP) clustering and sub-phase similarity diminishing scan (PSDS) method. Tang and Li (2019) established an online quality prediction model by accumulating the prediction results from different phases and transitions. However, these approaches do not suitable for solving nonlinear problems. Kernel principal component analysis (KPCA) uses certain principal component similarity to realize the phase division. But, the principality similarity relationship after KPCA processing is not obvious, and its effect is not stable (Zhang et al., 2017). Zhao et al. (2016) proposed a fault detection and diagnosis method based on phase division of faulty features. The method divides the production process into several stable phases according to certain clustering rules, but it ignores the influence of the transition phase on the monitoring results, which increases the false alarm rate. Liu et al. (2016) proposed a window-based step-wise sequential phase partition method to improve monitoring performance for nonlinear batch processes. However, the kernel parameters in the sliding window technology have a significant impact on the results, and the calculation amount is relatively large. Kernel entropy component analysis (KECA) was proposed as a nonlinear feature extraction method in recent years (Jenssen, 2010). It can solve the data nonlinearity problem by transforming the process data and realize the phase division by using its kernel entropy and cluster structure information.
In recent years, multivariate statistical methods play an important role in the online fault monitoring of batch process. Principal component analysis (PCA) and its improved methods have used to research batch production process monitoring (Jiang and Yan, 2018; Sales et al., 2016). Yao et al. (2015) present KPCA to the field of batch process monitoring, which shows better monitoring results compared with the PCA algorithm. However, KPCA is to calculate the variance of data and does not consider the influence of eigenvector changes on the monitoring results. The traditional Hotelling-T2 and SPE statistics of KPCA need to assume that the process variable obeys the Gaussian distribution, but the actual complex batch production process is not satisfied. KECA method extracts data information from kernel entropy features and has been initially used to realize online fault monitoring, which has good angular structure information and the angular structure similarity.
When the faults of the batch process are detected, it needs to diagnose the fault patterns. Currently, common diagnostic methods mainly include contribution graph and support vector machine (SVM). SVM has increased attention in fault diagnosis of the batch process because it can obtain remarkable results (Hamideh et al., 2018; Kim, 2005; Monroy et al., 2018). Ding et al. (2012) combined the sliding time window with SVM to realize the fault diagnosis of the batch process, but the length of the sliding window needs to be specified in advance and the model needs updates frequently. Ji et al. (2018) put forward an algorithm based on ensemble empirical mode decomposition and the SVM in the sensor fault detection and classification, but it cannot deal with multi-phase fault diagnosis problem. To solve the sub-phase fault diagnosis problem, a multi-class support vector machine (MSVM) classifier is established by combining several binary classifiers. The kernel function and parameter values of the MSVM model play a very significant role in the MSVM classifier. Numerous researches have focused on the optimization technique for parameter extraction of MSVM kernel function. Genetic algorithm (GA) method and particle swarm optimization (PSO) method are widely used; however, the results show a relatively high percentage of errors and suffer from premature convergence problems (Alba et al., 2007; Wei et al., 2017). Fireworks algorithm (FWA), which can solve non-linear and complex numerical computation with high accuracy, is implemented in parameter optimization for MSVM kernel function parameters. Further numerous studies on solving practical optimization problems using the FWA method can be found (Goswami and Chakraborty, 2015; Tan and Zhu, 2010; Reddy et al., 2016; Zhang et al., 2016).
This paper proposes a batch process fault diagnosis method, which uses KECA to adaptive multi-phase partitioning and online fault monitoring, and then constructs a diagnostic model by applying the MSVMs and FWA. Firstly, three-dimensional data is unfolded along time slices to obtain two-dimensional data, then substitute into the KECA clustering model to achieve phase partition. Then, the KECA monitoring model is constructed in each phase, in which three-dimensional data is unfolded along the batch-variable and angular structure similarity is utilized as a statistical variable. FWA-MSVM diagnostic model is developed by KECA dimensionality reduction data. Finally, simulation results of a fed-batch penicillin fermentation process show that it is feasible and effective.
The remaining chapters of this paper are organized as follows. In the next section, some preliminaries and problem formulation are given. The proposed multi-phase batch process fault diagnosis scheme is presented in Section 3. Experimental simulation results are studied in Section 4. Conclusions and some future works are discussed in Section 5.
Theoretical approaches
KECA method
KECA was proposed by Jenssen, R. Jenssen in 2010; the original idea of the KECA method is introduced in detail (Jenssen, 2010). If there are n events or data sets

The logarithmic function is a monotonic function, we may focus on the quantity

V(p) needs to be estimated and calculated before Renyi entropy can be obtained. In this paper, a parzen probability density operator is introduced. According to the Gaussian function convolution theory combined with the monotonicity of the function, equation (2) is obtained


where
The kernel matrix representation of Renyi entropy is implemented by equation (5), and the nuclear matrix is decomposed and expressed as

where
Therefore, equation (3) can be further expressed as

Mapping n-dimensional data through Ф onto a subspace

The information entropy is as shown in equation (8)

The core of the KECA algorithm is to make the difference between the squared Euclidean distance of the nuclear space data mean vector and the squared Euclidean distance of the transformed data mean vector as small as possible. To retain more information about the original data, the entropy contribution rate is used to determine the number of selected principal elements in the data dimensionality reduction process.
The KECA method is mainly applied to three aspects: phase partition, online fault monitoring and dimension reduction in this paper. The three-dimensional data are unfolded along the time slice to obtain two-dimensional data, and then substitute two-dimensional data into the KECA partition model. This paper uses the angular distance dispersion to achieve the phase partition by selecting the number of clusters adaptively. Then establish online fault monitoring of the batch process by using angular structural similarity as the statistic.
MSVMs
SVM was proposed for the binary classification problem, the original idea is based on the VC dimension theory and structural risk minimization theory. In recent years, many researchers developed SVM extended to solve multi-class problems. MSVMs mainly have two widely used styles: one-against-all (OAA) and one-against-one (OAO) (Du et al., 2013; Wei et al., 2017). OAO method is used for multi-phase batch process fault classification. Its main idea is to establish an SVM between any two types of samples, M samples need design
The kernel function is applied to solve non-linear problems using an optimal linear separating hyperplane, which can be got by transforming the input samples from a low-dimensional space into a higher dimensional feature space. There are several types of kernel functions proposed by many researchers, however, radial basis functions (RBF) is the most widely used, which is defined as

In the MSVM classifier, the kernel function and parameter values play a very significant role in the MSVM classifier.
FWA
FWA, which can solve non-linear and complex numerical computation with high accuracy, is implemented in parameter optimization for MSVM kernel function parameters. It can search an optimal solution by mimicking the fireworks explosion, and more details on FWA methodology can be found in Jenssen, Tan and Zhu (2010); Reddy et al. (2016)Zhang et al., 2016; Goswami et al. (2015).
Suppose a system with n fireworks, the initial n positions are randomly generated within the solution space. The number of sparks and the explosion amplitude of


where m is the control parameter for spark generation,
To avoid the problems in the explosion spark, like excessive, little fitness value, or inferior fitness value, this paper limits the number of sparks as follows

For a d-dimensional problem, the location of each spark

To make the spark particles more diverse, each dimension of the spark particles is Gaussian mutated by equation (14), and if it exceeds the boundary, it is mapped back to the search space by equation (15)


The FWA uses the Euclidean distance to calculate the distance between two pairs of fireworks particles in equation (16)

where K is the starting point of the current position of both fireworks and sparks. To select the optimal individual, the probability of each individual being selected is calculated by equation (17)

The FWA mainly covers the explosion spark, Gaussian variation, boundary mapping and selection strategy, which can achieve good local and global search results. The algorithm flow is shown in Figure 1.

Flowchart for FWA.
Proposed multi-phase batch process fault diagnosis scheme
Multi-phase partition
Three-dimensional data unfold
In the phase partition of the batch process, all related process data should be taken into account. Unfold three-dimensional data along with the sampling point is proposed in this paper. Batch process data is a three-dimensional data set, like batch, sampling point, and variable. The three-dimensional data is represented as X (I×J×K), where I represents the number of batches, J represents the number of variables, and K represents the number of sampling points. The data set X (I×J×K) is preprocessed to unfold three-dimensional data along the sampling point. As shown in Figure 2, the preprocessing procedure consists of four steps: (1) unfold the three-dimensional data set X (I×J×K) along the batch direction to form a matrix X (I×JK); (2) normalize elements in each column of the matrix X (I×JK) to zero mean and unit variance; (3) refold the normalized matrix

Where

Unfolding method along with the sampling point.
Phase partition by KECA
When the KECA algorithm is used for the clustering, it needs to set the number of initial classification groups in advance, and the number of initial cluster groups has a significant influence on the results of phase partition. To select and classify the various phases of the batch process reasonably, this paper chooses the angular distance dispersion to select the number of cluster groups by the KECA method.
The intra-class dispersion is as follows (Schölkopf et al., 2006)

Where C is the number of cluster groups.
The inter-class dispersion is as follows

Where

Multi-phase fault detection
Three-dimensional data expansion
The sub-models are constructed after the batch process divided, which needs to expand the normal data from three-dimensional to two dimensions. This paper develops a multi-phase KECA monitoring model, in which the three-dimensional data unfold along with batch-variable. The three-dimensional data is first unfolded along the batch and normalized by the column to get X (I×JK), then get a two-dimensional matrix X (KI×J) through unfolding along with the variable. The detail definition is shown in equation (22)

As shown in Figure 3, the preprocessing procedure consists of four steps: (1) unfold the three-dimensional data set X (I×J×K) along the batch direction to form a matrix X (I×JK); (2) normalize elements in each column of the matrix X (I×JK) to zero mean and unit variance; (3) refold the normalized matrix

Unfolding method along with batch-variable.
This batch-variable unfolded method combines the advantages of the batch and variable unfolded method. It can highlight the batch information without estimating the future data and monitor the process more efficient. The three-dimensional data expansion method is applied to fault monitoring and has no relationship with the data expansion method divided in the above stage, it is an independent expansion process.
KECA fault detection
The three-dimensional data of the batch process is unfolded along batch-variable, and then the data matrix has a valuable angular structure by KECA. Angular structure similarity statistics CV is introduced as a new statistic of online monitoring, the definition is as follows

In equation (23),
The statistical CV is actually to calculate the similarity of two matrices. To see the relationship between statistics and control limits more clearly, (1 - CV) is used to get statistics. In normal operating conditions, the statistical value is lower than the control limit. When the fault occurs, it shows that the statistical value rises above the control limit, so the fault can be detected.
In this paper, the control limit (CK) of CV statistics is calculated by kernel density estimation, which is not necessary to assume that the process variable obeys Gaussian distribution. The kernel density estimation method is to study the distribution characteristics of the data, which does not use the prior knowledge of the data distribution and does not need any assumptions.
Assume

where

It is assumed from the hypothesis that the kernel density estimation
Multi-phase fault classification based on FWA-MSVM
The batch process is divided into several sub-phases by the KECA algorithm, then develops the KECA monitoring model in each sub-phase. A fault diagnosis model is proposed in this paper, which uses MSVM with FWA to optimize the parameters. The specific principle of MSVM and the principle of the FWA algorithm are introduced in Section 2. The FWA has the advantages of robust global search capability and short iteration time. The detail steps of the multi-phase batch process fault classification are as follows:
Step1: Setting the MSVM parameter range. Determine the scope of the penalty parameter C and the kernel function
Step2: Initializing the number of fireworks populations. Define the number of firework populations, number of child algebra, Gaussian operator, and the maximum number of iterations.
Step3: Using KECA to reduce fault data. Decrease the dimension of each sub-phase of fault data using KECA, and then substituting them into the model can diagnose the faults efficiently.
Step4: Training the FWA-MSVM model. Substitute the fault data into their sub-phase FWA-MSVM model.
Step5: Outputting the optimal parameters. After satisfying the iteration conditions, each sub-phase model outputs the optimal parameters for later fault diagnosis.
Multi-phase fault diagnosis based on KECA and FWA-MSVM
In this paper, the multi-phase batch process fault diagnosis method consists of three main parts: multi-phase division, KECA fault monitoring, and FWA-MSVM fault classification. In the multi-phase division stage, the normal three-dimensional data X(I×J×K) of the batch process is unfolded along with the time slice, then substitute into the KECA clustering model, achieve the phase partition using the nuclear entropy and the angular structure information. In the KECA fault monitoring stage, normal three-dimensional data is unfolded along with batch – variable, and the angular structure similarity is selected as a statistical variable. The KECA monitoring model is constructed to perform on-line fault monitoring and fault data information as the outputs in each sub-phase. In the FWA-MSVM fault classification stage, KECA is used to extract useful information by reducing the dimensionality of fault datasets. Search for the best MSVM parameters using the FWA algorithm. The fault data set after dimensionality reduction is to train in the FWA-MSVM model, and the best MSVM diagnostic model is constructed. The detail flow chart of online fault monitoring and fault diagnosis in the batch process is shown in Figure 4.
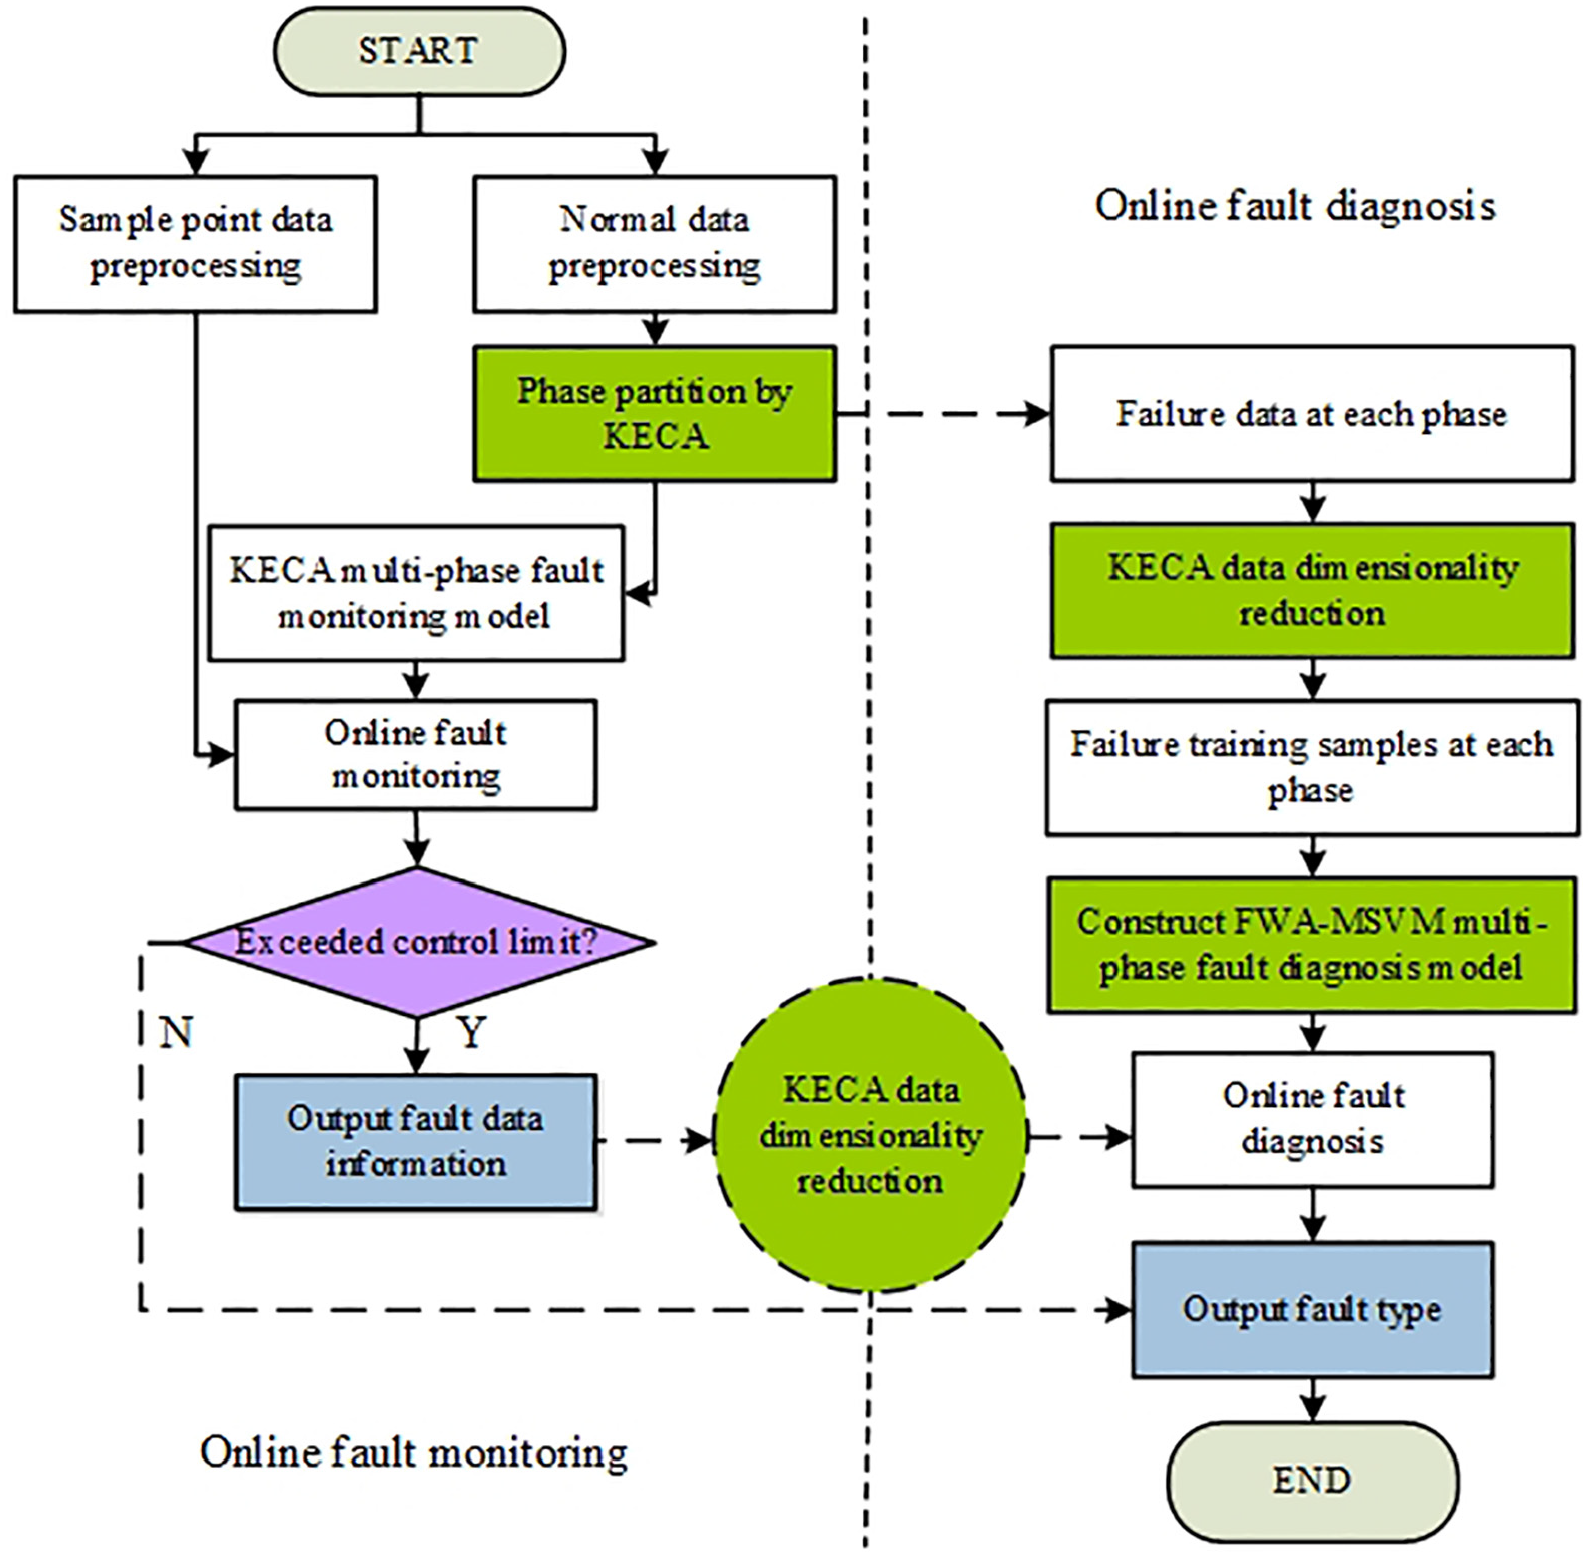
Online fault monitoring and online fault diagnosis in the batch process.
Experimental simulation
The penicillin fermentation process is a typical batch process, which is developed by the monitoring and control group of the Illinois Institute of Technology in 2002 and often used as a benchmark. Pensim 2.0 is utilized to generate experimental data in this paper, it can simulate the process variables under various conditions and provide a standard platform for batch process monitoring and fault diagnosis. Pensim not only simulates the penicillin fermentation process under normal operating conditions but also can acquire abnormal conditions by setting faults parameters.
Pensim usually generates three common faults: air flow, bottom flow rate, and agitation power. There are two main fault types: step and ramp, and Pensim can further set the fault introduction, cutoff time and the amplitude of the disturbance, the specific operation flow is shown in Figure 5 and the process variables can be seen in Table 1. Pensim 2.0 provides a practical and effective simulation platform for penicillin fermentation process for related research and has become a powerful simulation verification tool.
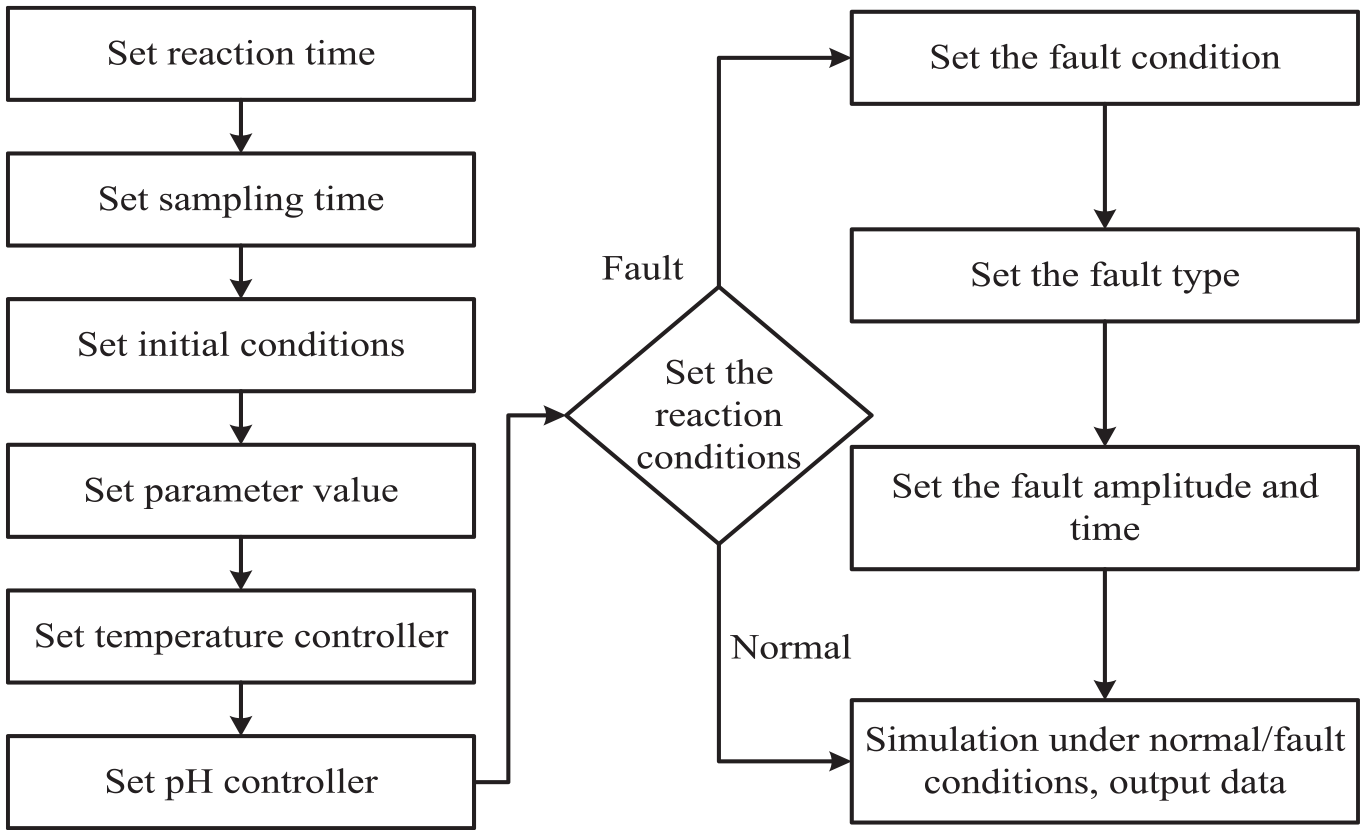
Pensim simulation platform operation diagram.
Process variables in the fed-batch fermentation process.

Phase partition of batch process
In this study, 45 normal batches data are generated by Pensim 2.0, which defines the fermentation time as 400h and the sampling interval as 1h. Ten variables, which reflect the penicillin fermentation process, are selected as listed in Table 2. Three-dimensional data X (45×10×400) of the batch process is divided into two-dimensional data X (400×450) along with the sampling point, substitute it into the KECA clustering algorithm and divide the phase in the high-dimensional space. In the KECA clustering stage, the number of clusters needs to be set in advance and the number of clusters is sensitive to the results of the segmentation. Therefore, the angular distance dispersion is used to select the cluster group number in this paper.
Variables parameters.

The partition results are shown in Figure 6 and Figure 7, respectively. When the penicillin fermentation simulation experiment is divided into four sub-phases, the criterion function value reaches the highest, and the four sub-phases include 0–38h, 39–169h, 170–280h, and 281–400h. The growth cycle of penicillin microorganisms is divided into four phases: the stagnation period of bacteria, the growth period of bacteria, the synthesis period of penicillin, and the self-dissolution period.
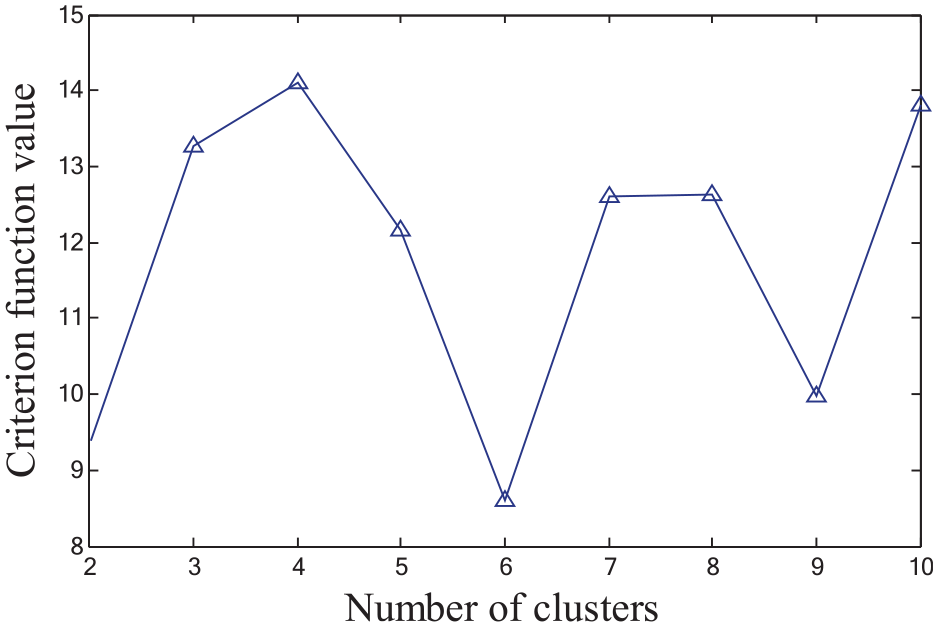
Metric function value of cluster number.
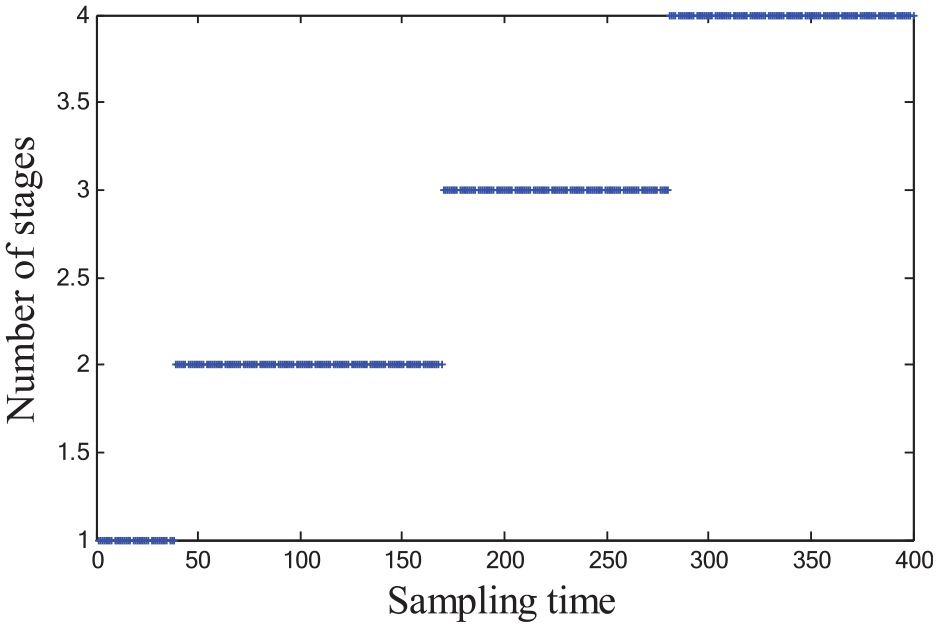
Results of sub-phase partition.
Fault monitoring research for batch process
A multi-phase KECA failure monitoring model is developed by using the angular structure similarity as the statistic, which is based on the partitioned phases and the effective failure features by the KECA feature extraction method. This paper chooses three faults, like air flow (Fault 1), agitation power (Fault 2), and bottom flow rate (Fault 3), which are under a slope of 0.15 in the 150–350h phase of the penicillin fermentation simulation.
Comparative study of monitoring effects under phased and whole methods
This paper constructs an MKECA fault monitoring under phased and whole methods to compare the different monitoring performance fault monitoring in the penicillin fermentation process, the false alarm rate and the underreport rate are used to evaluate. Figure 8 and Figure 9 show the monitoring results of Fault 1 under the whole and phased methods, and Table 3 shows the results of the false alarm rate and the underreport rate. The false alarm rate is the probability that the normal data is falsely reported as fault data, in which the normal data exceeds the control limit. The false underreport rate is the probability that the fault data misses the fault information, in which the fault data does not exceed the control limit.
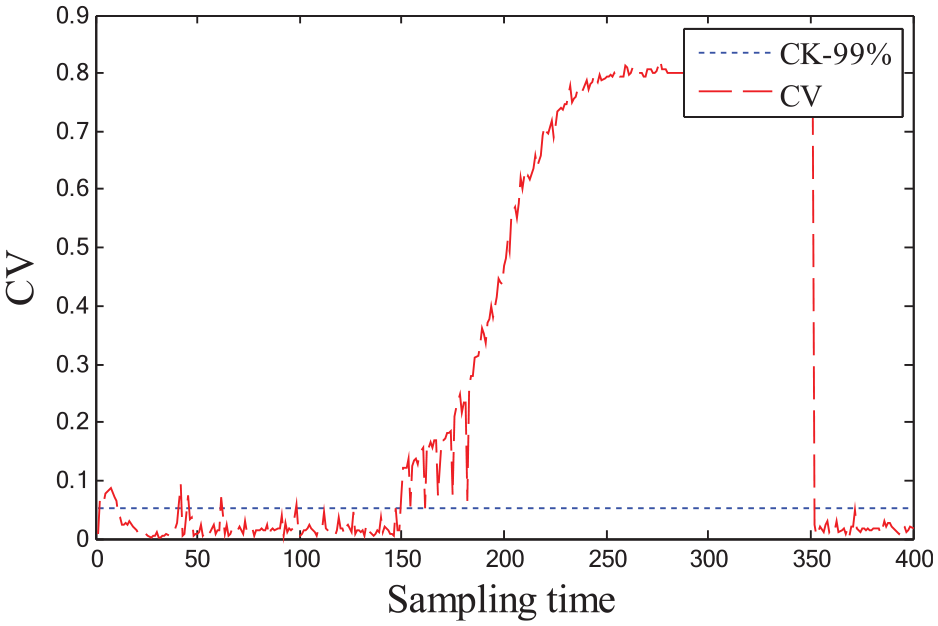
Result of Fault 1 under the whole method.
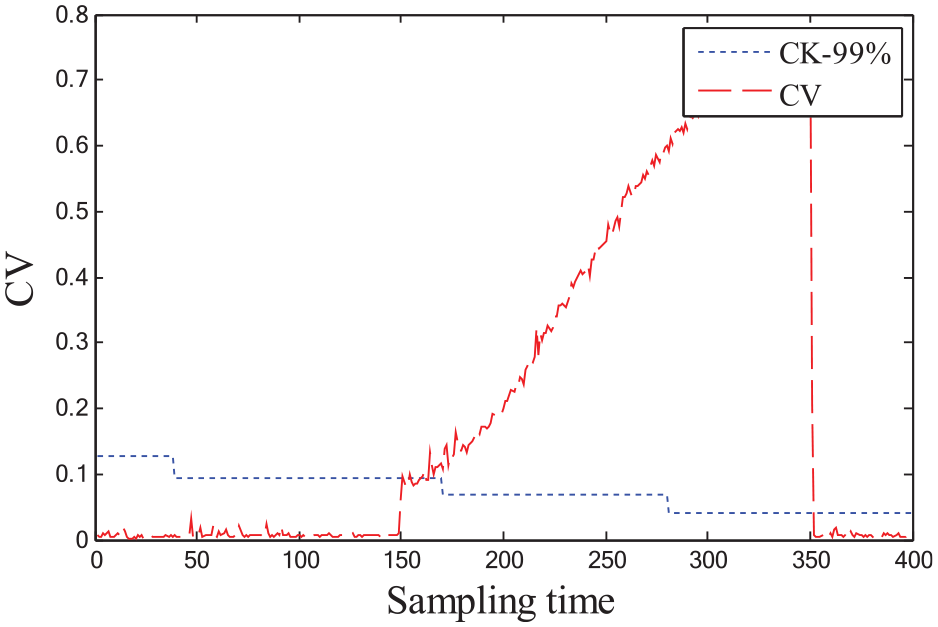
Result of Fault 1 under the phased method.
Comparison of monitoring results between phased and whole.

From the results of Figure 8, Figure 9 and Table 3, it can be seen that the effect of the whole model is not good and unstable, which has large false alarm rates in three faults and the difference between the three faults is large. However, the false alarm rate of three faults are 0.5 and has better results in the phased fault monitoring model. The faults occur in the 150–350h phase, in the whole model the Fault 1 is lower than the phased model, but the Fault 2 and Fault 3 are much higher. Besides, it can be seen that the whole model has large fluctuations and instability in the initial stage. But the phased model is a steady rise beyond the control limit. Although the failure rate of Fault 1 is slightly higher, the phased model is better and more stable from the false alarm rate, underreport rate and statistical stability. It verifies the effectiveness and rationality of the phased model for batch process fault monitoring.
Comparative study of monitoring statistics
To reflect the monitoring effect of MKECA using the angular structure similarity statistic for online fault monitoring, the MKECA monitoring method with statistics T2 and SPE and the traditional MKPCA monitoring method with statistics T2 and SPE are used to compare. Three faults (air flow (Fault 1), agitation power (Fault 2), and bottom flow rate (Fault 3)) are under a slope of 0.15 in the 150–350h phase of the penicillin fermentation simulation, and the results are shown in Table 4. The results in fault 3 with different statistics in KECA are shown in Figure 10 and Figure 11.
Comparison of monitoring effects of three methods.


MKECA phased Fault 3 monitoring diagram.

The CV of Fault 3 under phased model.
Table 4 shows the results of the three faults under different monitoring statistics, MKECA with statistics of CV, MKECA and MKPCA with statistics of T2 and SPE, respectively. It can be seen that the MKECA monitoring method using the angular structure similarity statistic (CV) is the lower fault underreport rate. The MKPCA method is the worst in the complex batch process, because KPCA needs to assume that the process data obeys Gaussian distribution when performing data feature mapping. The MKECA with T2 and SPE as the statistics respond to the fault alarm at 177 and 178, respectively. The MKECA with CV as the statistic responds to the fault alarm at 156. The MKECA with CV is more sensitive to fault response, while the MKECA with T2 and SPE statistics is seriously lagging behind. However, the underreport rate for Fault 3 in MKECA using the CV method is larger than some others in the same group. The possible reasons may be the random original data and the reduced effective parameter information of fault 3. Due to the characteristics of the bottom velocity (Fault 3), the difference caused by the influence of the experimental data is not obvious. This results in a highly similar angular structure between the fault data and the normal data, and it is more likely that the underreport rate is below the control limit. In summary, the MKECA with the CV method is not necessary to assume that the process data obeys Gaussian distribution, which is more sensitive and better.
Research on fault diagnosis simulation experiment
The KECA phased monitoring model is established to output the faulty data and artificially generate fault batches in each sub-phase. If the process is monitored as a fault, it is necessary to achieve the fault diagnosis. As we know, three faults include air flow (Fault 1), agitation power (Fault 2), and bottom flow rate (Fault 3) occur in this paper, which are under a slope of 0.15 in the 150–350h phase of the penicillin fermentation simulation. The FWA-SVM diagnostic model is trained by using three types of faults known at each stage as training sets, the details are listed in Table 5.
Phases and groups of different types of three faults.

Data dimensionality method study
Data processing plays a very important part and its quality is the key to the speed and effectiveness for fault diagnosis. To investigate the effectiveness of the KECA data dimension reduction, two other methods PCA and KPCA are used to compare. The fault diagnosis model is constructed by using GA optimization SVM parameters, and the 281–400h sub-phase data are used. The average accuracies of five repetitions in the three data processing models are presented in Figure 12.

Comparison of data processing methods.
It can be seen from Figure 12 that the average accuracies of KECA always has the highest correct rate compared with the KPCA and the PCA methods. It is illustrated that the KECA plays an important role in improving accuracy. And when the penicillin simulation data dimension is 8, the accuracy is the highest (96.38%). 8-dimensional data is selected for subsequent simulation analysis in this paper.
Comparative study of parameters optimization algorithms
To investigate the effectiveness of the proposed FWA optimization method (FWA-MSVM), we have used two other methods: the PSO-MSVM and the GA-MSVM. The initial parameters of each algorithm are listed in Table 6. The iteration time, standard deviation and average accuracies of the three optimization models are presented in Table 7.
Initial parameter setting table for each algorithm.

Three models for three fault diagnosis efficiencies.

As reported in Table 7, the average accuracies in three optimization methods—PSO-MSVM, GA-MSVM, and FWA-MSVM—are 89.81%, 94.97%, and 95.62%, respectively. The proposed FWA-MSVM model has better accuracy, which the recognition accuracy has arrived at 95.62%. The efficiency and standard deviation of each fault are better than PSO and GA, although Fault 1 is slightly lower than GA. Therefore, the effectiveness and superiority of FWA in constructing the fault diagnosis model of the batch process are verified. It also can be seen that the FWA-MSVM model is much better iteration time than GA and PSO. The diagnosis time of each fault is basically stable. The diagnostic efficiency of Fault 1 and Fault 3 is significantly higher, Fault 2 is relatively low. At the same time, Fault 2 has a higher standard deviation, which explains that the fault is more volatile and uncertain.
Comparative study of diagnosis effects under phased and whole methods
To study the phased issues, the FWA-MSVM fault diagnosis models of each sub-phase and whole are established in this paper. The results are shown in Table 8, Figure 13 and Figure 14.
Comparison of phase effects.


0–400h sub-phase fault diagnosis.

0–400h whole fault diagnosis.
The average accuracy of fault diagnosis in phases is 96.29%, which is about 3% higher than the whole accuracy. The average accuracy in four phases is higher than the whole accuracy, the proposed method has better recognition performance for the multi-phase batch process. The 281–400h phase has the highest accuracy, while the 170–280h phase has the lowest accuracy. Therefore, the fault diagnosis of the batch process should analyze the phase and divided into several sub-phase, then carry out fault diagnosis, which can improve the diagnostic efficiency.
Conclusion
This paper describes a self-adaptive unique multi-phase fault diagnosis method for batch process. The scheme components of the proposed method include a multi-phase division module, a KECA fault monitoring module, and an FWA-MSVM fault classification module. Most of the difficulties in reliable fault diagnosis of batch process can be attributed to the characteristics of nonlinear and multi-phase and the current inability to rapidly identify the fault. The proposed method establishes the phased models to overcome this issue of the multi-phase batch process.
The simulation results of a fed-batch penicillin fermentation process, the proposed scheme is quite effective in recognizing multi-phase faults of batch process. Our specific findings can be described in three aspects. First, the criterion function value is used to determine the number of stages, and achieve the phase partition using the nuclear entropy and the angular structure information of KECA in the multi-phase division stage. Secondly, our studies show that the phased monitoring method has better effects than the whole method, then the angular structure similarity statistics CV by the KECA applied as monitoring statistic can significantly improve the recognition accuracy. Third, by comparing with the methods of using PSO and the GA parameters method, we identified that the proposed FWA-MSVM algorithm can improve the recognition rate efficiently. Besides, our study also shows that the proposed KECA method is good at data processing, and verified the phased diagnosis method has better effects than the whole method.
Currently, the proposed scheme is quite effective in detecting and recognizing multi-phase faults of batch process. An enhancement would be to analyze the specific failure causes and predict fault in a few time steps in advance. More works will be contributed to promoting the widespread use of the proposed algorithm in the actual batch production process.
Footnotes
Declaration of conflicting interests
The author(s) declared no potential conflicts of interest with respect to the research, authorship, and/or publication of this article.
Funding
The author(s) disclosed receipt of the following financial support for the research, authorship, and/or publication of this article: This work is partially supported by the National Natural Science Foundation of China (NSFC) under Grant No. 51675450 and MOE (Ministry of Education in China) Project of Humanities and Social Sciences (No. 18YJC630255).
