
Abstract
It is difficult to obtain the damage information on large slewing bearings only from vibration signals. In addition, deep learning models trained on old samples do not achieve high accuracy in new tasks. Therefore, this paper uses vibration, temperature, and torque signals of slewing bearings to build a model. Meanwhile, we add attention mechanism to capture internal correlation of them to consider the related factors of remaining useful life (RUL) from multiple angles. The multivariable gated recurrent unit (GRU) based on attention mechanism gated recurrent unit (attention-MGRU) model is adopted to improve the prediction performance. On this foundation, a fine-tuning strategy is introduced to improve the generalization ability of the model. A full-life accelerated test is carried out on the slewing bearing test bench. The model proposed in this paper is compared with GRU prediction model, which utilizes vibration signals and multivariable GRU prediction model. Mean absolute error (MAE) and root-mean-square error (RMSE) are used as measurement indicators. Among different methods, three indicators generated by attention-MGRU show significant superiority. Moreover, the fine-tuned model performs better in new tasks compared with the original model.
Introduction
Slewing bearings are used to connect the rotators in a machine, similar to joints. Once they break down or fail, it will cause safety hazards and great economic losses. Therefore, it is very important to improve the reliability of slewing bearings to ensure the operation safe and stable. Active operation and maintenance are effective ways to improve the operational reliability of slewing bearings, but the premise is to accurately evaluate the life state of them. Accurate prediction of remaining useful life (RUL) and timely failure warning can avoid unnecessary losses.
Scholars have studied the life evaluation of slewing bearings to some extent. Data-driven methods do not depend on the damage mechanism of slewing bearings, so using reliable data to build model has become widely used. Data-driven methods mainly include two major steps: signal preprocessing and establishment of prediction model (Lei et al., 2018). Signal denoising is the first step of preprocessing. Common methods to reduce noise include wavelet domain denoising (Caesarendra et al., 2016), ensemble empirical mode decomposition (EEMD) (Žvokelj et al., 2016), local mean decomposition (LMD) (Du et al., 2017), and singular value decomposition (SVD) (Dong et al., 2021).
Feature extraction of signals can reduce the calculated amount and help to highlight the variation trend of signals. Researchers propose a deep autoencoder (DAE)-based joint feature compression method (Ren et al., 2018). This way can retain effective information without increasing the scale of neural network. Improved convolutional deep belief network (CDBN) with compressed sensing (Shao et al., 2018) and normalized conditional variational autoencoder (NCVAE) model (Zhao et al., 2022) are put forward to enhance the feature learning ability. Zhu et al. (2019) proposed a deep feature learning method based on time–frequency representation (TFR) and multi-scale convolutional neural network (MSCNN). This model keeps the synchronization of global and local information. A stacked wavelet autoencoder structure is applied to provide more reliable results with a more complete data set (Shao et al., 2021).
Establishing reasonable and effective health indicator (HI) of slewing bearings is the most valid way to supervise the operating state and reliability of slewing bearings. Main applied methods include support vector domain description (SVDD) (Jiao et al., 2020), hidden Markov model (HMM) (José et al., 2020), and Kolmogorov–Smirnov (K–S) test (Singleton et al., 2015). Dimensionality reduction is a commonly used way to fuse various features and characterize the operating state of equipment. Based on manifold learning, isometric mapping (ISOMAP) is selected to gain HI of signals to obtain a good evaluation effect (Bao et al., 2020). Nguyen and Medjaher (2021) put forward an evaluation criterion for HI, so as to create the most appropriate HI. Ahmad et al. (2018) proposed a linear revision technique (LRT) to deal with fake fluctuations in HI, which improved the accuracy of regression models.
To sum up, there are still problems needing further discussion about preprocessing. Feature extraction of signals should satisfy the requirement of comprehensiveness and avoid the influence made by feature redundancy. So, it is necessary to extract features in multiple domains and screen the features effectively considering actual degradation law.
RUL prediction results of slewing bearings are also depended on the accuracy of the prediction model. Subrata et al. (2019) proposed gene expression programming based on the population diversity (PD-GEP) algorithm, which improves the model’s prediction accuracy and convergence speed. Ding et al. (2019) constructed a new prediction model based on the hybrid genetic programming-model structure adaptive method (HYGP-MSAM), which realizes visual modeling of slewing bearings’ life prediction. Temporal cascade broad learning system is applied in bearings’ life prediction, solving the problem that network can only be updated by retraining when adding newly acquired data (Cao et al., 2022). Pan et al. (2020) suggested a two-stage prediction method based on extreme learning machine to predict RUL of bearings quickly and accurately. However, traditional machine learning methods show insufficient processing capacity because of the complex interrelationships in degradation process. In addition, the inflexibility of models’ structure limits their development. To settle these issues, recurrent neural network (RNN) is applied due to its advantages in time series problems (Guo et al., 2017). Zhang et al. (2018) introduced a life prediction model based on long and short-term memory (LSTM), an improved version of RNN. Using RNNs for modeling merely will result in a lack of accuracy and information capture capability, so scholars make modifications on this basis. She and Jia (2021) proposed bidirectional gated recurrent unit (BiGRU), which allows the predictions to take prior and subsequent information into account. Self-attention ConvLSTM (SA-ConvLSTM) neural network is put forward, and this model can better learn the importance of different time steps (Li et al., 2021).
Due to the lack of generalization ability, numerous models perform poorly in cross-domain prediction. Sun et al. (2019) proposed a deep transfer learning network based on sparse autoencoder (SAE). Analogously, Zou et al. (2021) predicted RUL of bearings through a transfer prediction model based on the dynamic benchmark. Also, an effective method named deep residual LSTM with domain invariance (DIDRLSTM) is applied (Fu et al., 2021). These methods really improve the prognostic performance of cross-domain RUL prediction, but the issues of domain adaptation are not fully considered.
Life prediction tasks are often accompanied by the problem of few shot. To address the lack of sample data, Zan et al. (2021) proposed a method based on the joint approximative diagonalization of eigen matrices (JADE) and particle swarm optimization support vector machine (PSO-SVM), which can offer high accuracy under small sample sizes. Li et al. (2022) proposed a self-data-driven method, which relies on its own state monitoring data for RUL prediction rather than fault data. A novel model named meta-attention RNN is provided by Ding et al. (2022), and the generalization of it is proved. These methods optimize the precision under few shot to some extent, but the ability to capture information is relatively weak and hyperparameter optimization in deep learning algorithm are still challenging (Thoppil et al., 2021).
As can be seen in these articles, three problems of prediction models need to be worked out:
In existing methods, it is difficult to obtain the damage information on slewing bearings comprehensively only from vibration signals.
Building effective HI can improve the accuracy of life assessment. Therefore, it is significant to develop suitable schemes of feature extraction, screening, and fusion.
Models are limited in accuracy or learning ability in cross-domain tasks. Domain adaptation is suffering from many challenges.
Improving any step of RUL prediction can let the results more satisfactory. This paper extracts information from multiple sensors and applied attention mechanism to develop the model. Main contributions of this paper are as follows:
To upgrade the quality of HI, a novel and reasonable method is created to screen compelling features. Also, we make improvements in the establishment of HIs based on ISOMAP and maximum likelihood estimation (MLE).
On the basis of the traditional gated recurrent unit (GRU) model, attention mechanism gated recurrent unit (attention-MGRU) prediction model is proposed to excavate the correlation between multi-physical signals and slewing bearings’ RUL. It helps to excavate damage information deeply and improves accuracy and robustness of the model.
To strengthen the generalization ability of the model, this paper adds a fine-tune strategy which can modify parameters and improve precision on new tasks. Attention mechanism ensures the ability to capture information after fine-tuning.
Preprocessing of signals
This section explores the preprocessing in detail. Signals’ preprocessing includes denoising original signals, extracting features, screening features, and establishing HI. The process of it is shown as follows:
Step 1. The original signals are represented as
Step 2. To comprehensively reflect the degradation trend of slewing bearings, this paper uses the features in Table 1 as the extraction objects. As shown in the table, 1 to 10 are the features of the time domain, 11 and 12 are the features of the frequency domain, and 13 is feature of time–frequency domain.
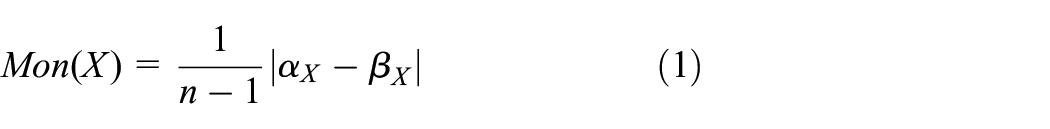
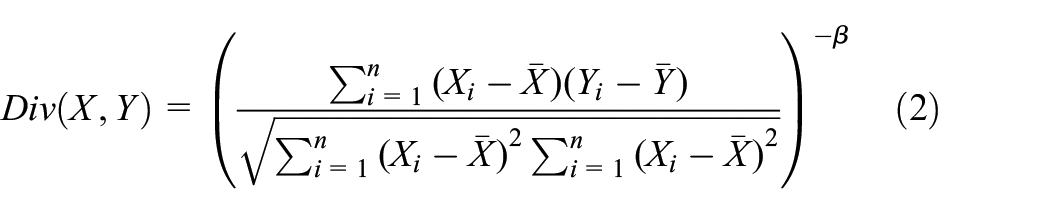
Step 3. This paper proposes a hybrid evaluation method based on the linear superposition of the monotonicity indicator (equation (1)) and trajectory difference indicator (equation (2)) to screen features of physical signals. The score is a comprehensive evaluation indicator, and the calculation formula is shown in equation (3). Before linear superposition, normalization (equation (4)) is performed uniformly. Among them, Mon and Div represent monotonicity indicator and trajectory difference indicator, respectively

Multi-domain candidate features.

X and Y are two distinct feature vectors, and
Step 4. In this paper, ISOMAP algorithm is used to set up the HIs of vibration, temperature, and torque signals. This method embeds high-dimensional data to low-dimensional space through multidimension scaling (MDS). It is indispensable to estimate the intrinsic dimension before reducing dimension. MLE is used to complete this mission in this process. The calculation process is as follows: establishing likelihood equation, taking the logarithm of the likelihood function, and solving the equation. Finally, matrix A is obtained and utilized to reduce the dimension of feature matrix

Build life prediction model
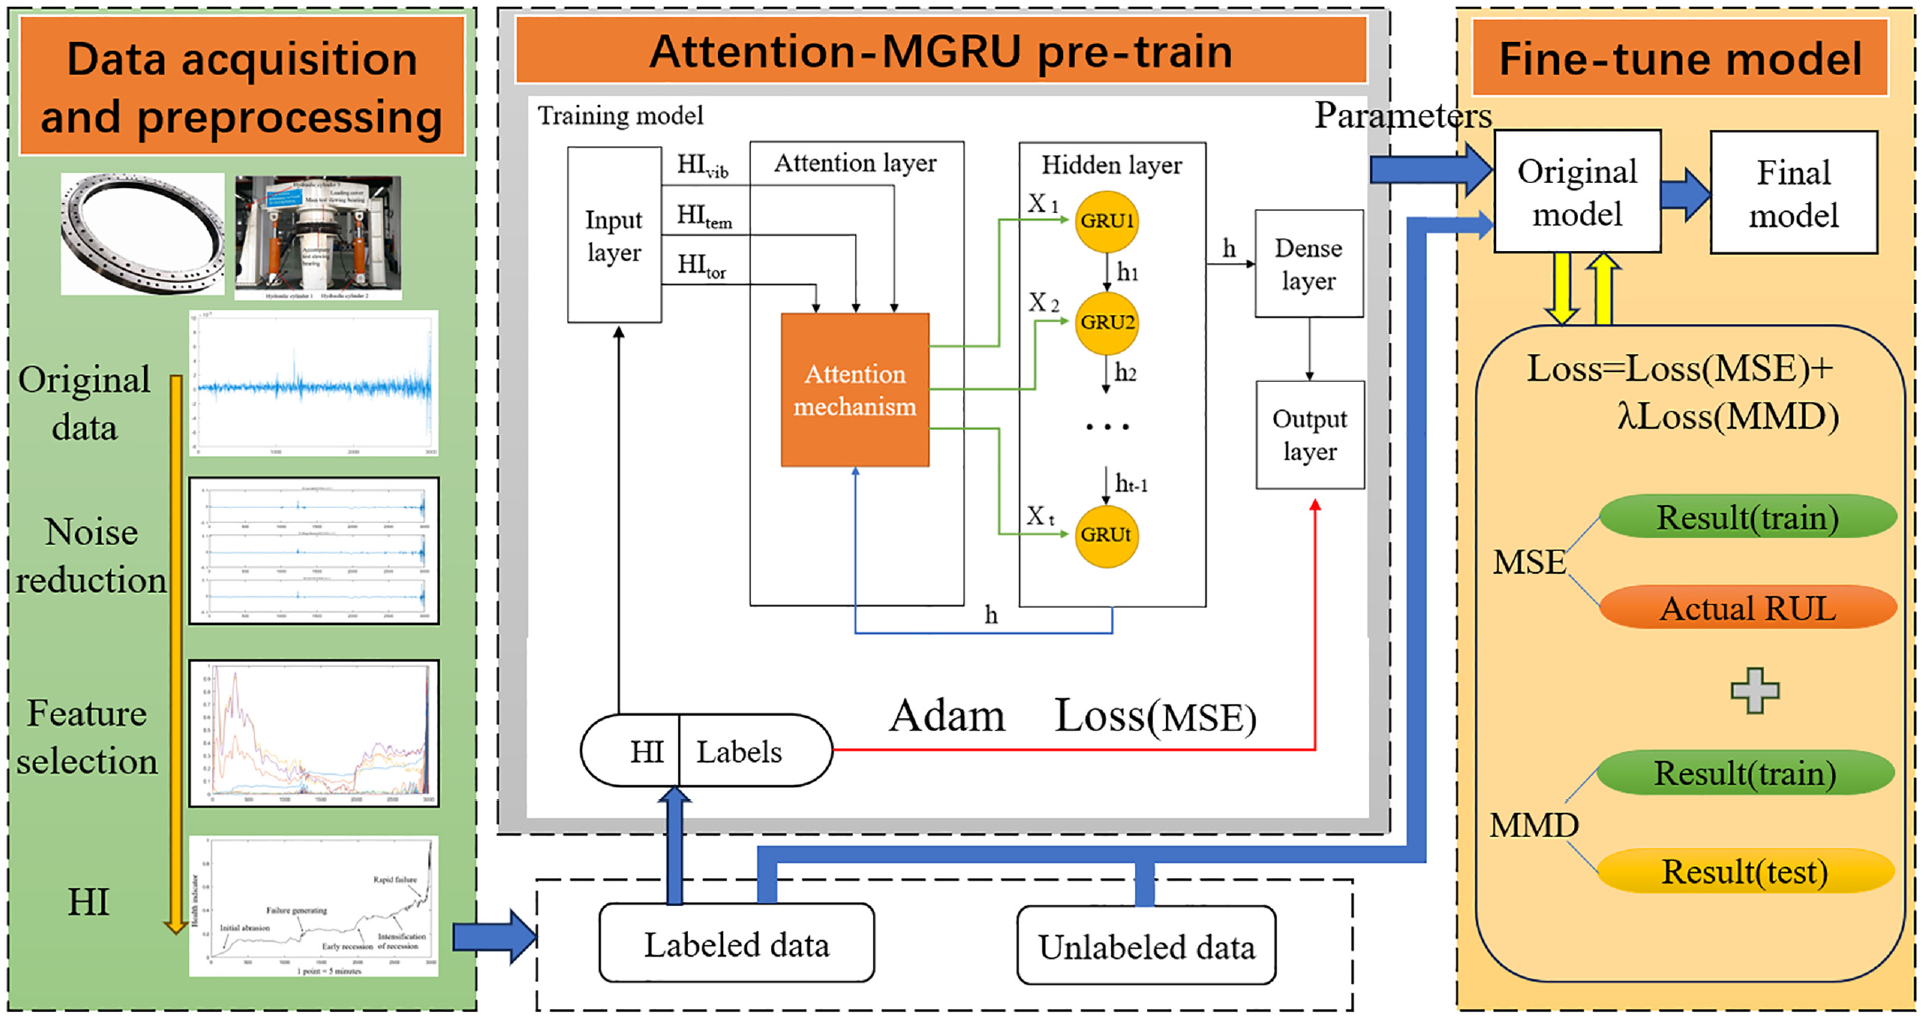
The attention-MGRU model proposed in this paper is a RUL prediction method combining GRU and attention mechanism. Figure 1 demonstrates the forecasting process. In neural networks, RNN is well suited for tasks of time series prediction. GRU and LSTM are the evolution of RNN, and they work out the problem of gradient disappearance. Compared with LSTM, the structure of GRU is simpler and easier to realize. When multiple physical variables are utilized as inputs, it is improper that each variable possesses the same effect on the predicted results. Attention mechanism is capable of assigning weights to each variable based on the output of previous GRU. This will help to capture variables’ internal correlations and enhance the robustness of model. Attention layer’s inputs are HIs and the hidden layer’s latest output. Furthermore, the output is time series modified by weighting. The hidden layer is composed of GRU network structure, and the output layer generates final prediction results. After that, original model is fine-tuned through transforming the loss function.
Prediction process of attention-MGRU.
Construction of GRU module in hidden layer
Figure 2 shows the network structure of GRU at the hidden layer. In the figure,


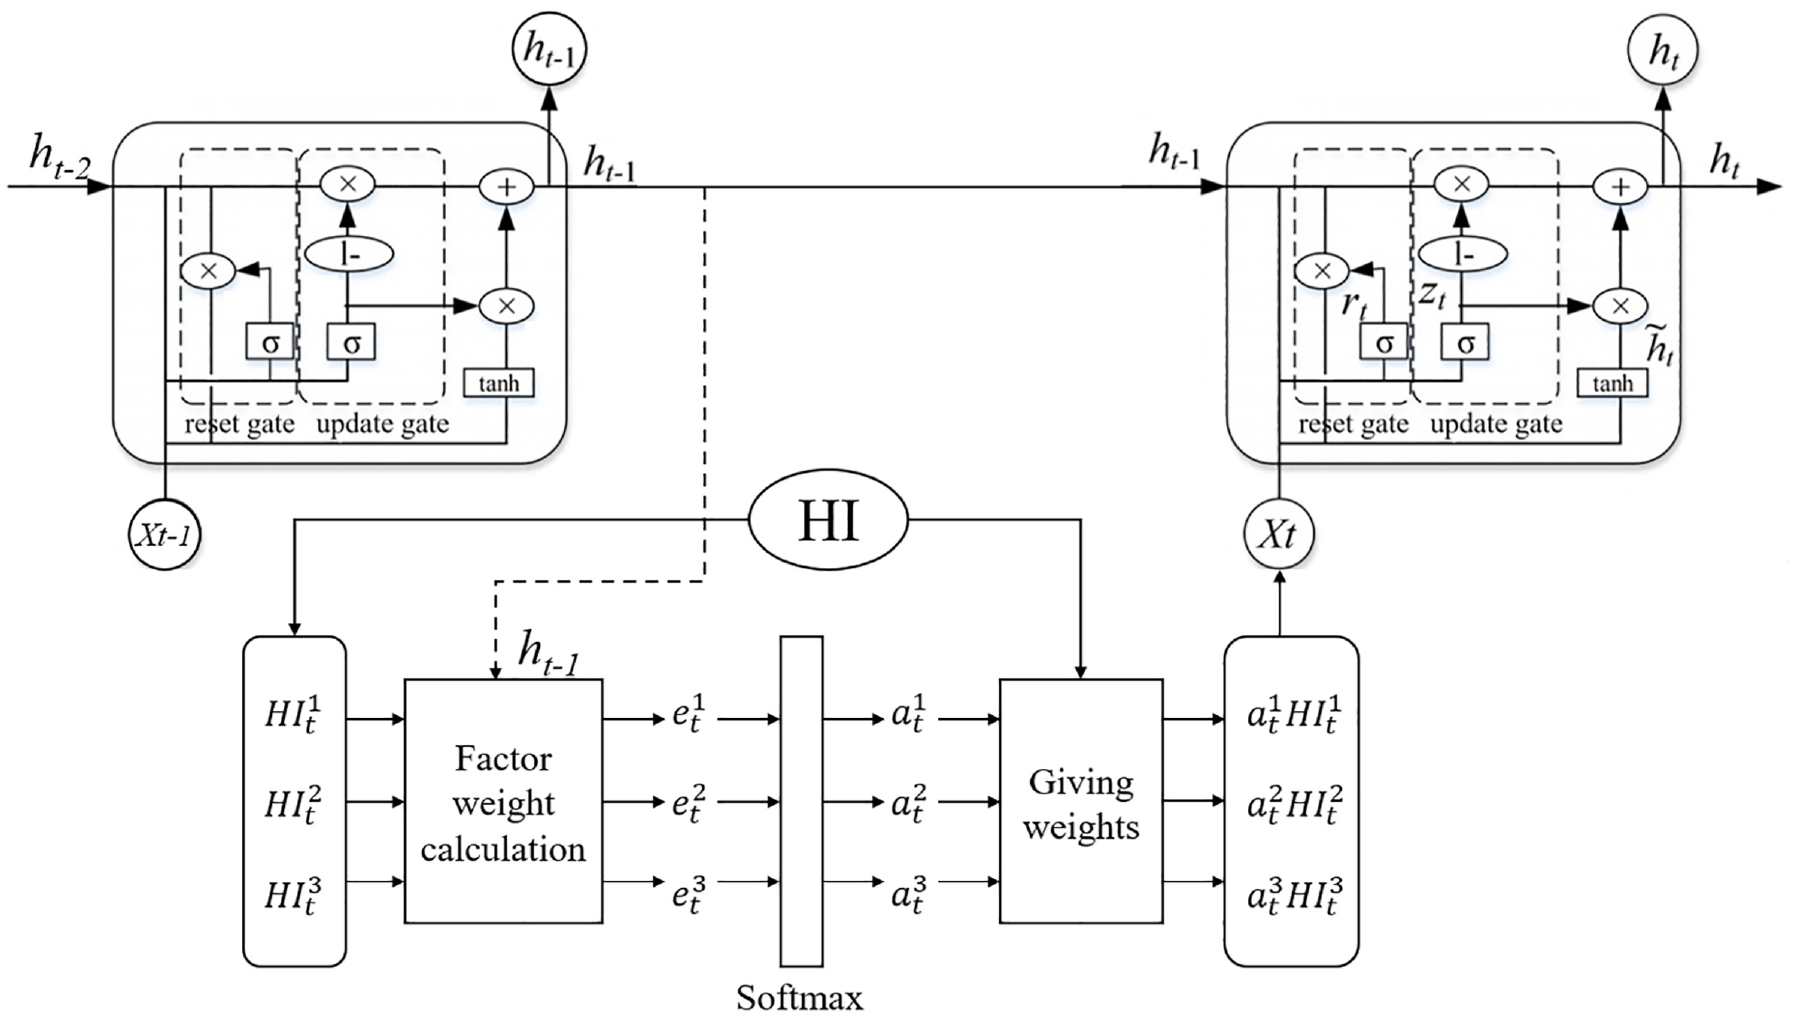
Structure of attention mechanism and GRU network.
In these formulae,


Loss function
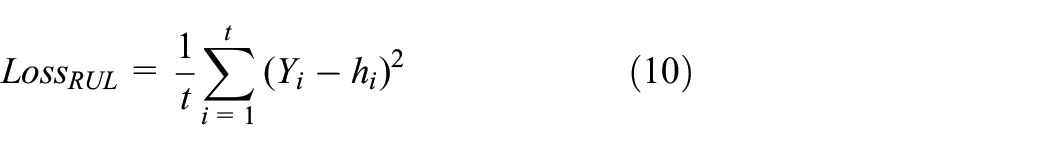
where Y is the actual life series. BPTT (back-propagation through time) algorithm is used in backward training, and
Addition of attention mechanism
Attention mechanism introduced in this paper is shown in Figure 2. Weights are calculated by multilayer perceptron. HIs at time

To quantify the influence degree of different factors on RUL at the current moment, normalization should be carried out. In this paper, SoftMax function is applied to normalize the weights and calculate the final output of the attention mechanism. The calculation formula is shown in equation (12)
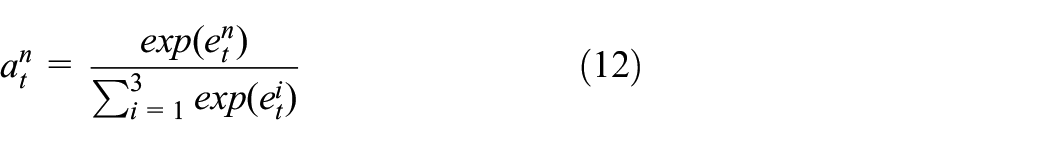
The importance of each variable can be enhanced or weakened according to the weights. After that, the new series

After training, parameters

Fine-tuning in new tasks
In traditional artificial intelligence (AI)-based prediction approaches, models trained on old data tend to show poor performance on new tasks. For models which only utilize vibration signals to achieve the results of RUL, diverse feature distribution of data will lead to large deviation between the outputs and actual values. Combination of three categories of physical signals can attenuate the effect caused by excessive disparity of one certain variable’s feature distribution to some degree. To further improve the generalization ability of the proposed method and let it adapt to slewing bearings with various physical structures and degradation information, we come up with a fine-tuning strategy.
This strategy divides the model construction into two steps as demonstrated in Figure 1. The initial model trained with labeled data can be regarded as a pre-trained model. This measure can effectively reduce the training cost and obtain excellent prediction model in a short time. Modifying the loss function in training process is the critical part of fine-tuning strategy. Maximum mean discrepancy (MMD) is a novel kernel learning method in domain adaptation (Cao et al., 2021; Dong et al., 2023). The original data of the two domains are mapped to a regenerated Hilbert space, and the distance between them will be calculated after that. As a loss function, MMD is calculated by the following formula
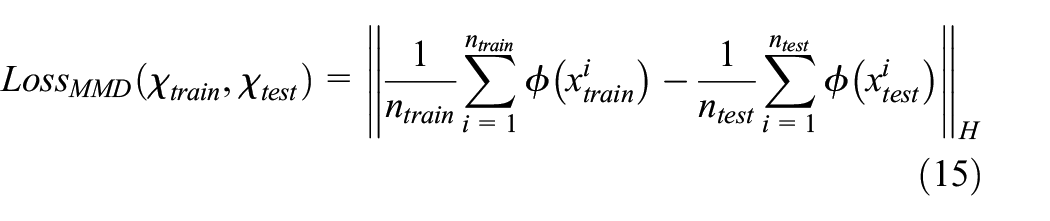
where

It is worth explaining that the learning rate in this process requires to be reduced up to 0.1 times. The model is already convergent before fine-tuning, so a small learning rate does not take too much time. In addition, this action can bring the point closer to the local minimum when fine-tuning the model, which improves the model’s performance.
Experimental verification and discussion
In this section, raw data of three physical variables are provided by a run-to-fail experiment and HIs are constructed through the methods. Superiority and generalization of the proposed model will be deeply studied. The training environment is 12th Gen Intel (R) Core (TM) i7-12700 H @ 2.30 GHz, RAM 16.0 GB, NVIDIA RTX 3060, and pytorch 2.0.1.
Accelerated run-to-fail experiment of large slewing bearings
Actual life of slewing bearings can be more than 20 years, so traditional life experiment will consume too much time and cannot be completed in the laboratory. Accelerated experiment employs greater stress to speed up the process of failure and degradation without changing the failure mechanism, which can help to shorten the life cycle.
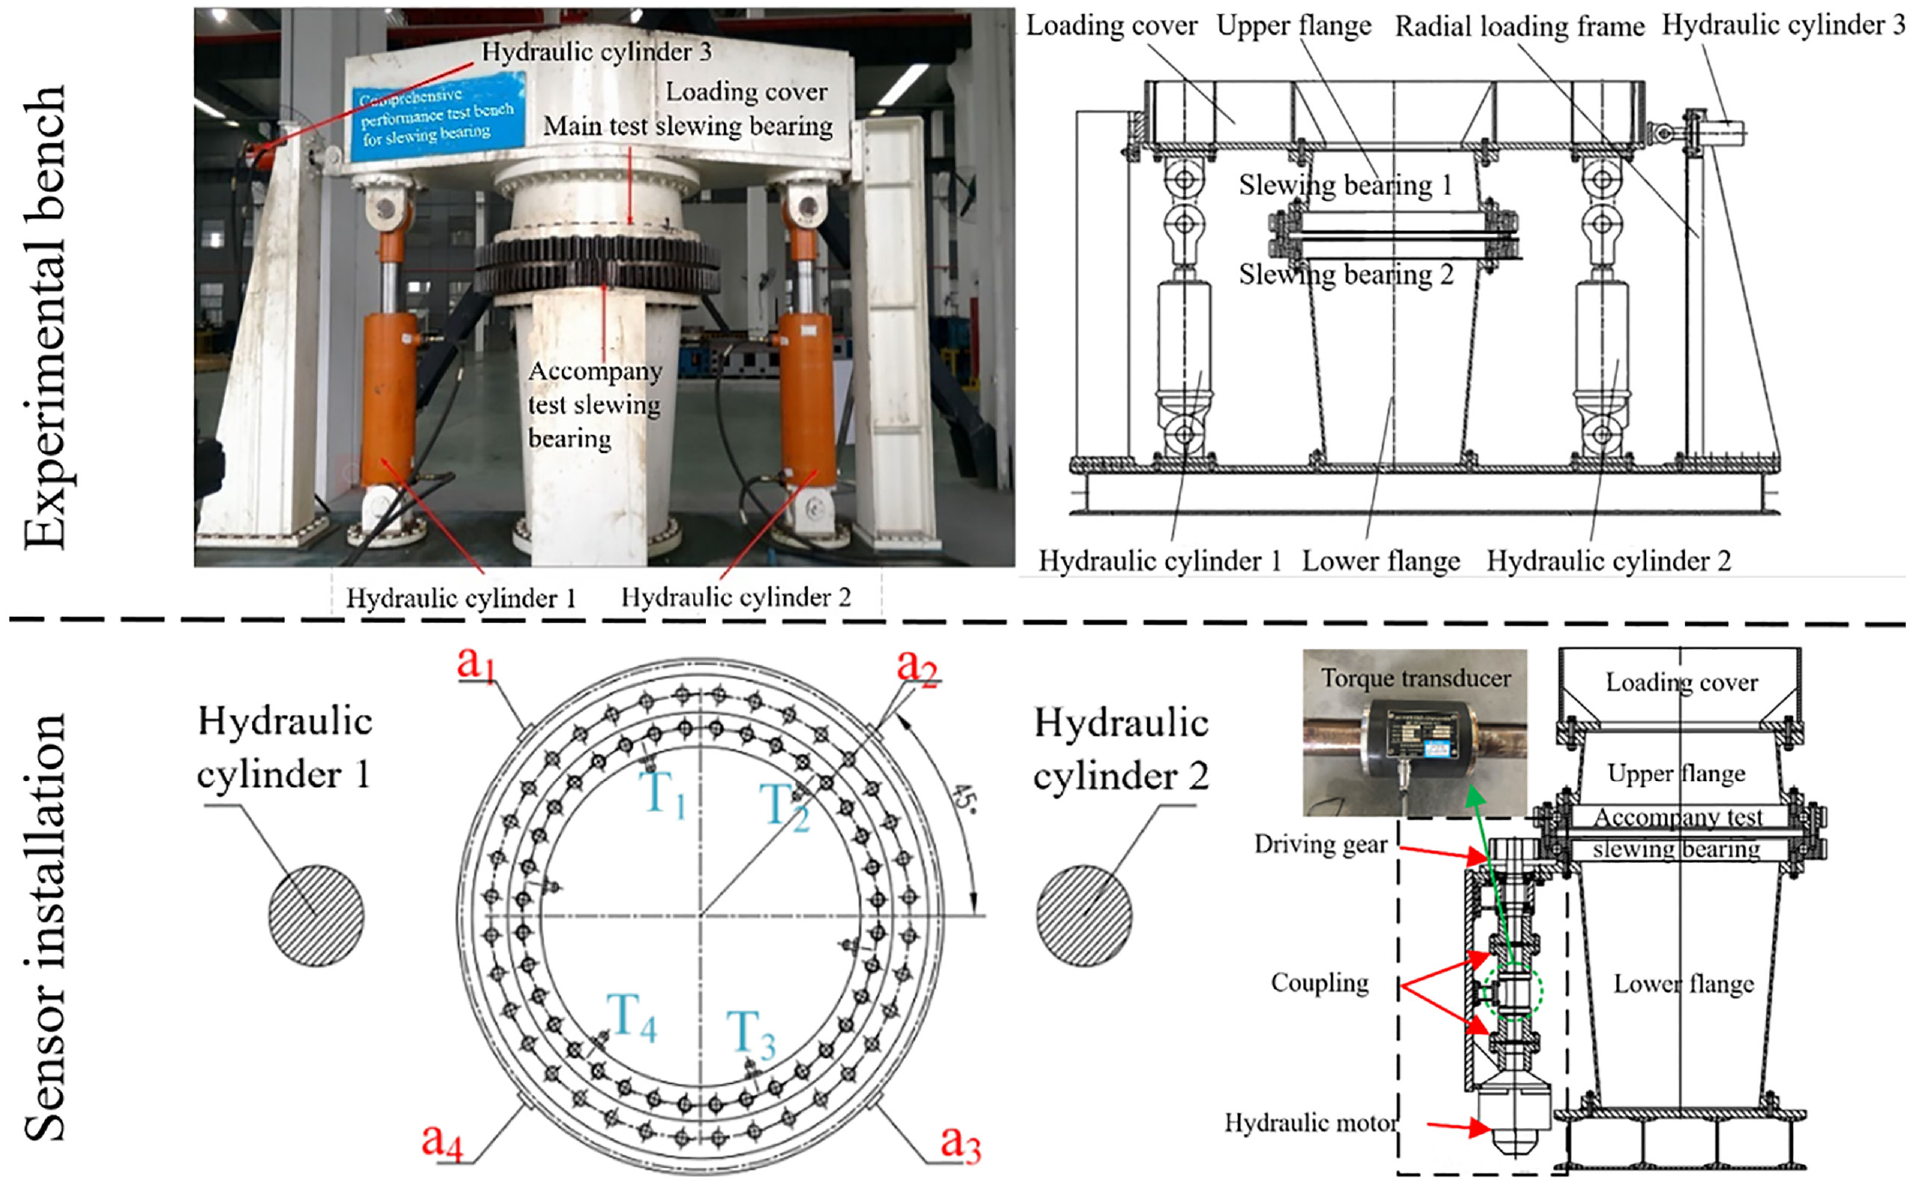
This accelerated run-to-fail experiment utilized a test bench independently developed by our group to examine the comprehensive performance of slewing bearings. The test bench mainly includes three parts: mechanical system, hydraulic system, and measurement and control system. The structure is shown in Figure 3. Hydraulic cylinders 1 and 2 provide axial force and overturning moment, while hydraulic cylinder 3 provides radial force.
Information on the slewing bearing experiment.
The quality of signals collected by sensors is the premise to ensure the reliability of subsequent data analysis. Therefore, selection of sensors, number of measuring points, and the layout mode are significant. Figure 3 shows the installation of multiple types of sensors. To collect comprehensively, method of multi-measuring points is applied. a1–a4 are 4 capacitive vibration acceleration sensors with 90° of separation Angle. T1–T4 are four PT100 temperature sensors installed in the oil injection hole to monitor the temperature rise of lubricating oil. The sensors to measure vibration and temperature are mounted on a four-point contact slewing bearing. With the aggravation of the faults, the friction of the slewing bearings is increasing. So, one torque sensor is installed between the couplings to measure friction torque of the slewing bearing.
Test 1: Utilizing a group of experimental data for detailed analysis and discussion
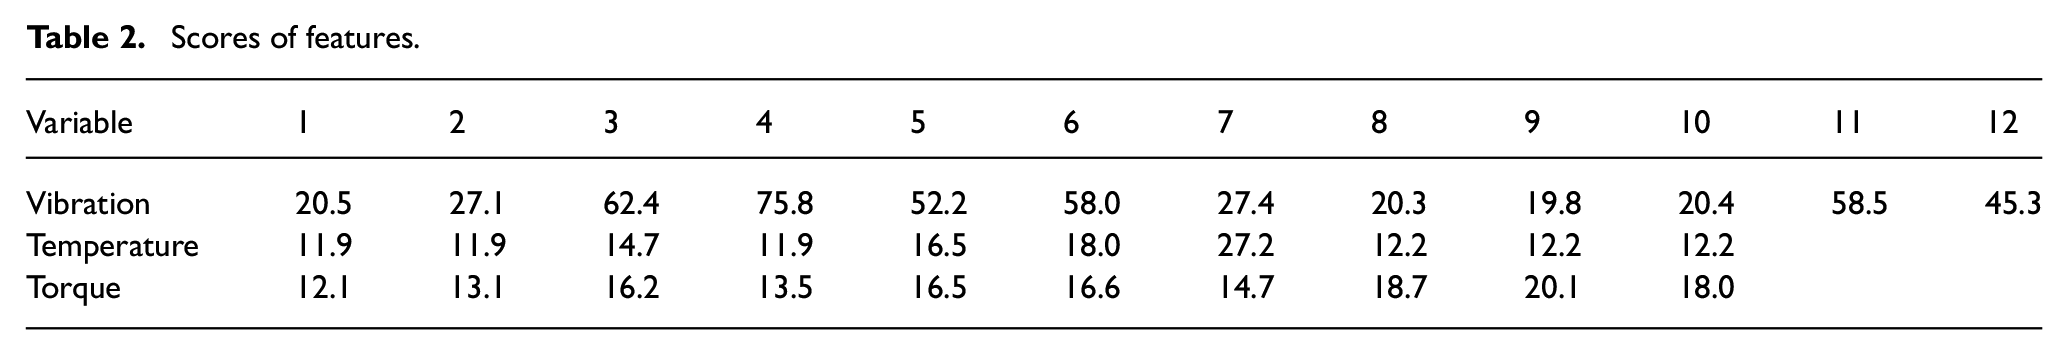
The signals utilized in test 1 are shown in Figure 4(a)–(c). The horizontal coordinate in the figure represents time, and one period represents 1 day. The experiment provides data for the preprocessing of multiple physical signals. After feature screening, scores of each feature are shown in Table 2. Only vibration signals are analyzed in frequency and time–frequency domains. Superior features of vibration are as follows:
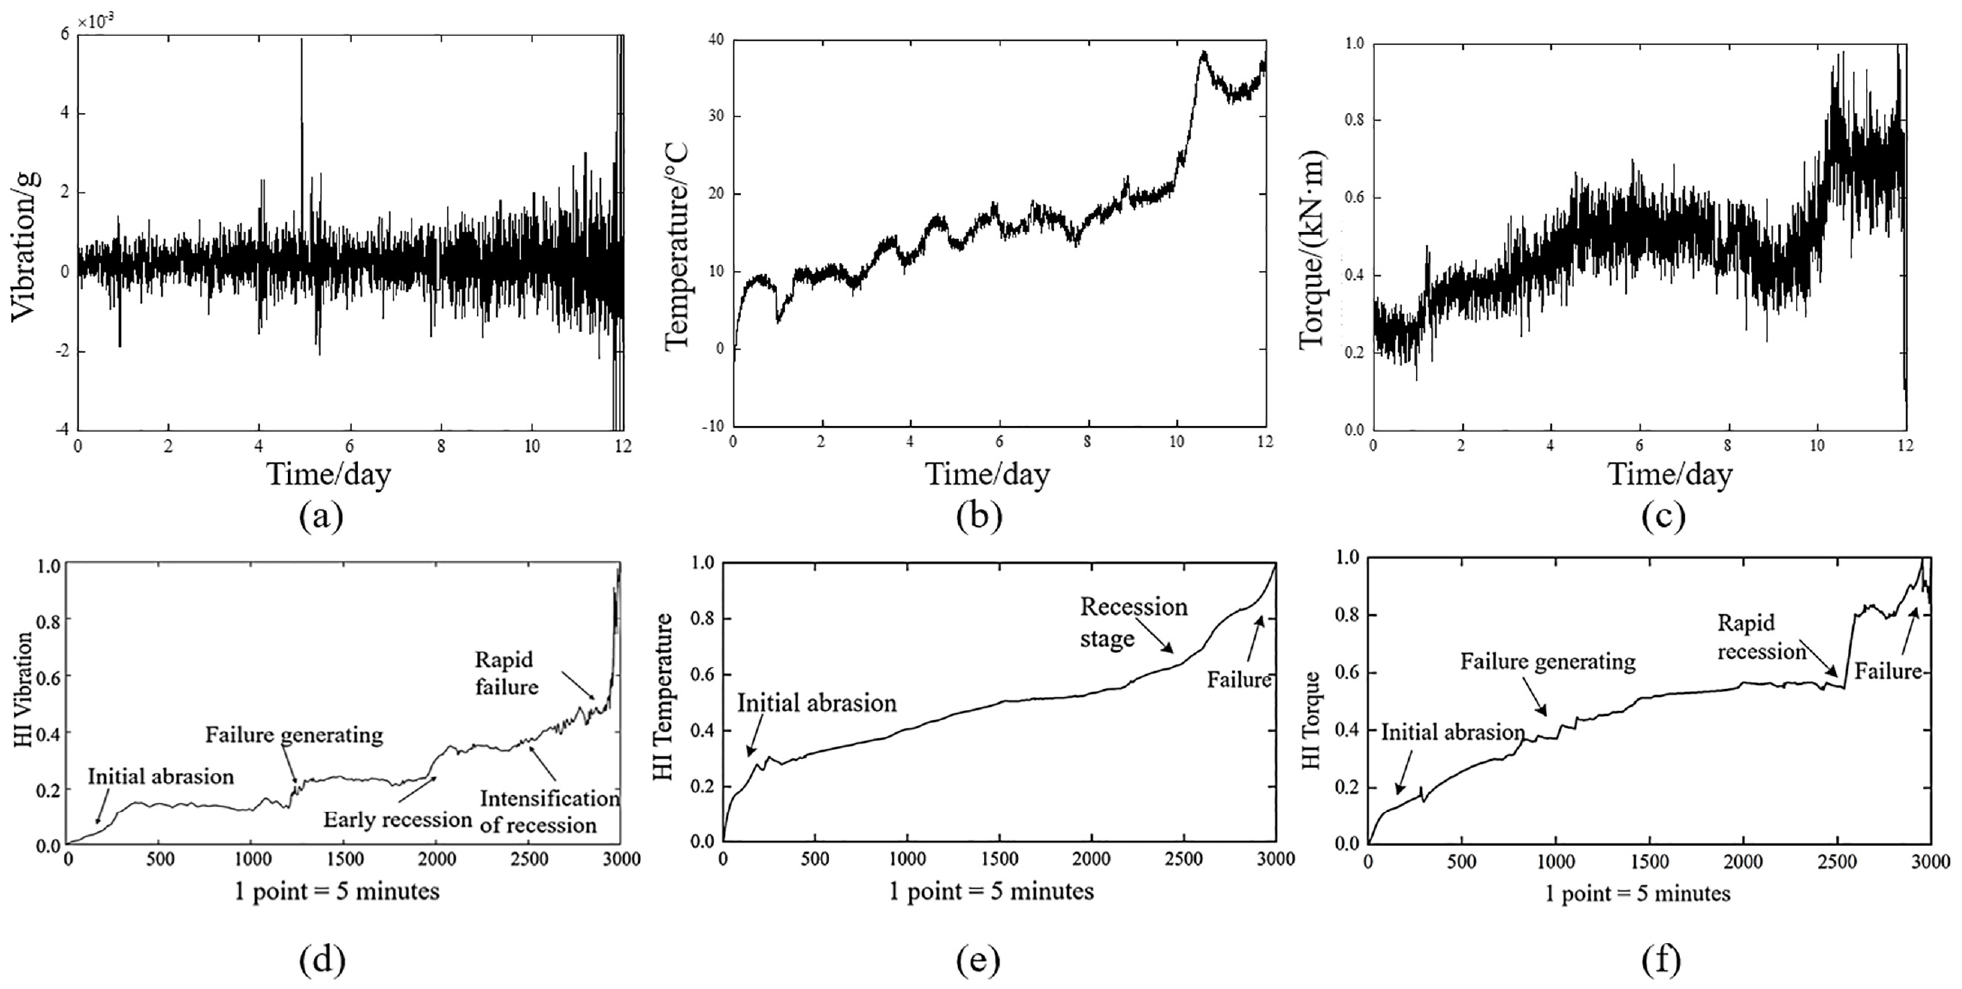
Raw data and HIs of slewing bearings: (a) Vibration signal, (b) Temperature signal, (c) Torque signal, (d) HI of vibration (e) HI of temperature and (f) HI of torque.
Scores of features.
Compared with the original vibration signals,
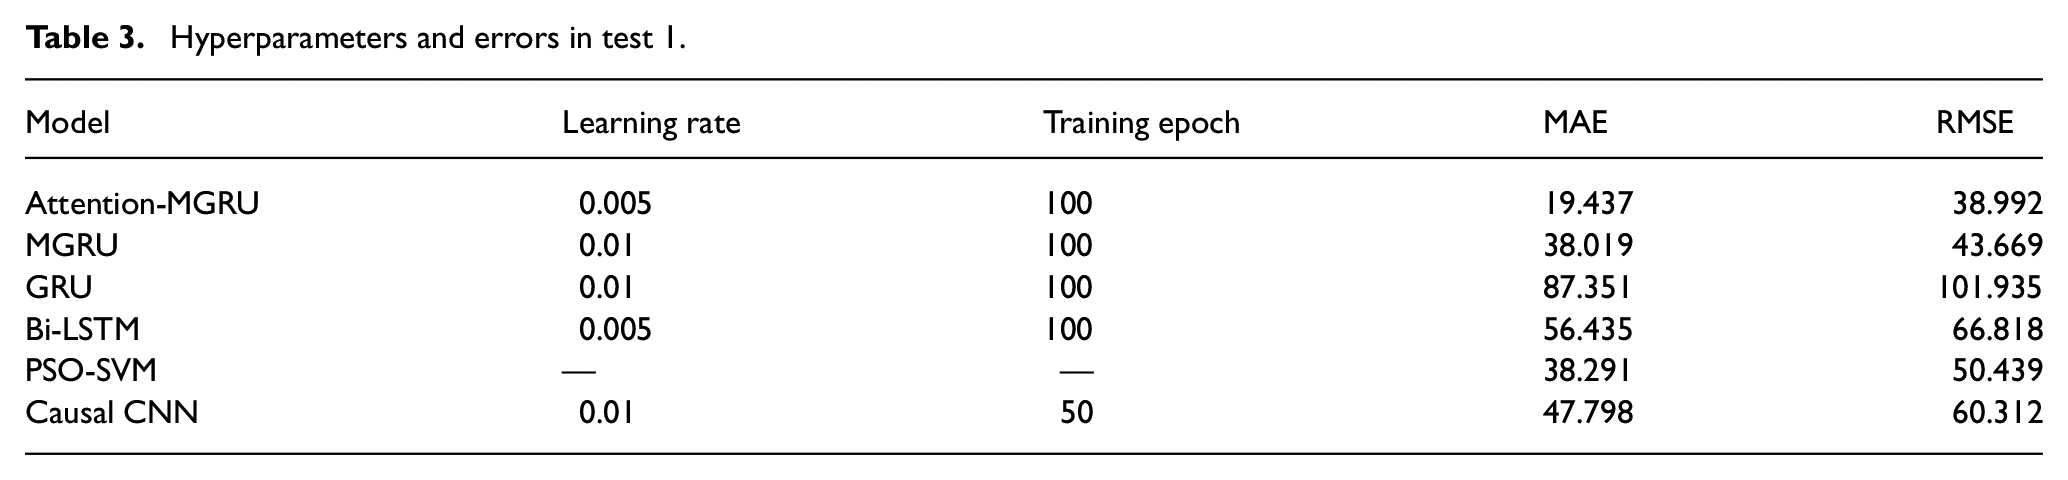
To verify the superiority of the proposed model, this section compares the results of attention-MGRU with other methods, including GRU model based on vibration signal, GRU based on multiple physical signals (MGRU), bidirectional LSTM (Bi-LSTM), PSO-SVM, and causal convolutional neural network (CNN). Considering the comparison of degradation stages in Figure 4(d)–(f), it can be seen that points 2601–3000 show rapid degradation until failure. The values of HIs in this period are relatively high, and the growth rates have increased significantly. Therefore, the last 400 points of data are used as the test set to verify the predictive accuracy of the model. Table 3 gives the values of hyperparameters in this test. Reasonable hyperparameters can ensure the fairness of comparison. The sample size of training set is not large, so dropout ratio, window length, and batch size are equal to 0.1, 2, and 32, respectively, in each model. Learning rate is set to 0.01, but it should be reduced to half for attention-MGRU and Bi-LSTM. With more parameters, reducing the learning rate can avoid the drastic fluctuation of the loss function. After trials, models converge within 100 epochs. Therefore, training epoch for most models is 100. Causal CNN converges faster so its epoch is 50 to avoid overfitting. Figure 5 describes the methods’ results. Blue line shows the predicted results, and the red line shows the actual RUL.
Hyperparameters and errors in test 1.
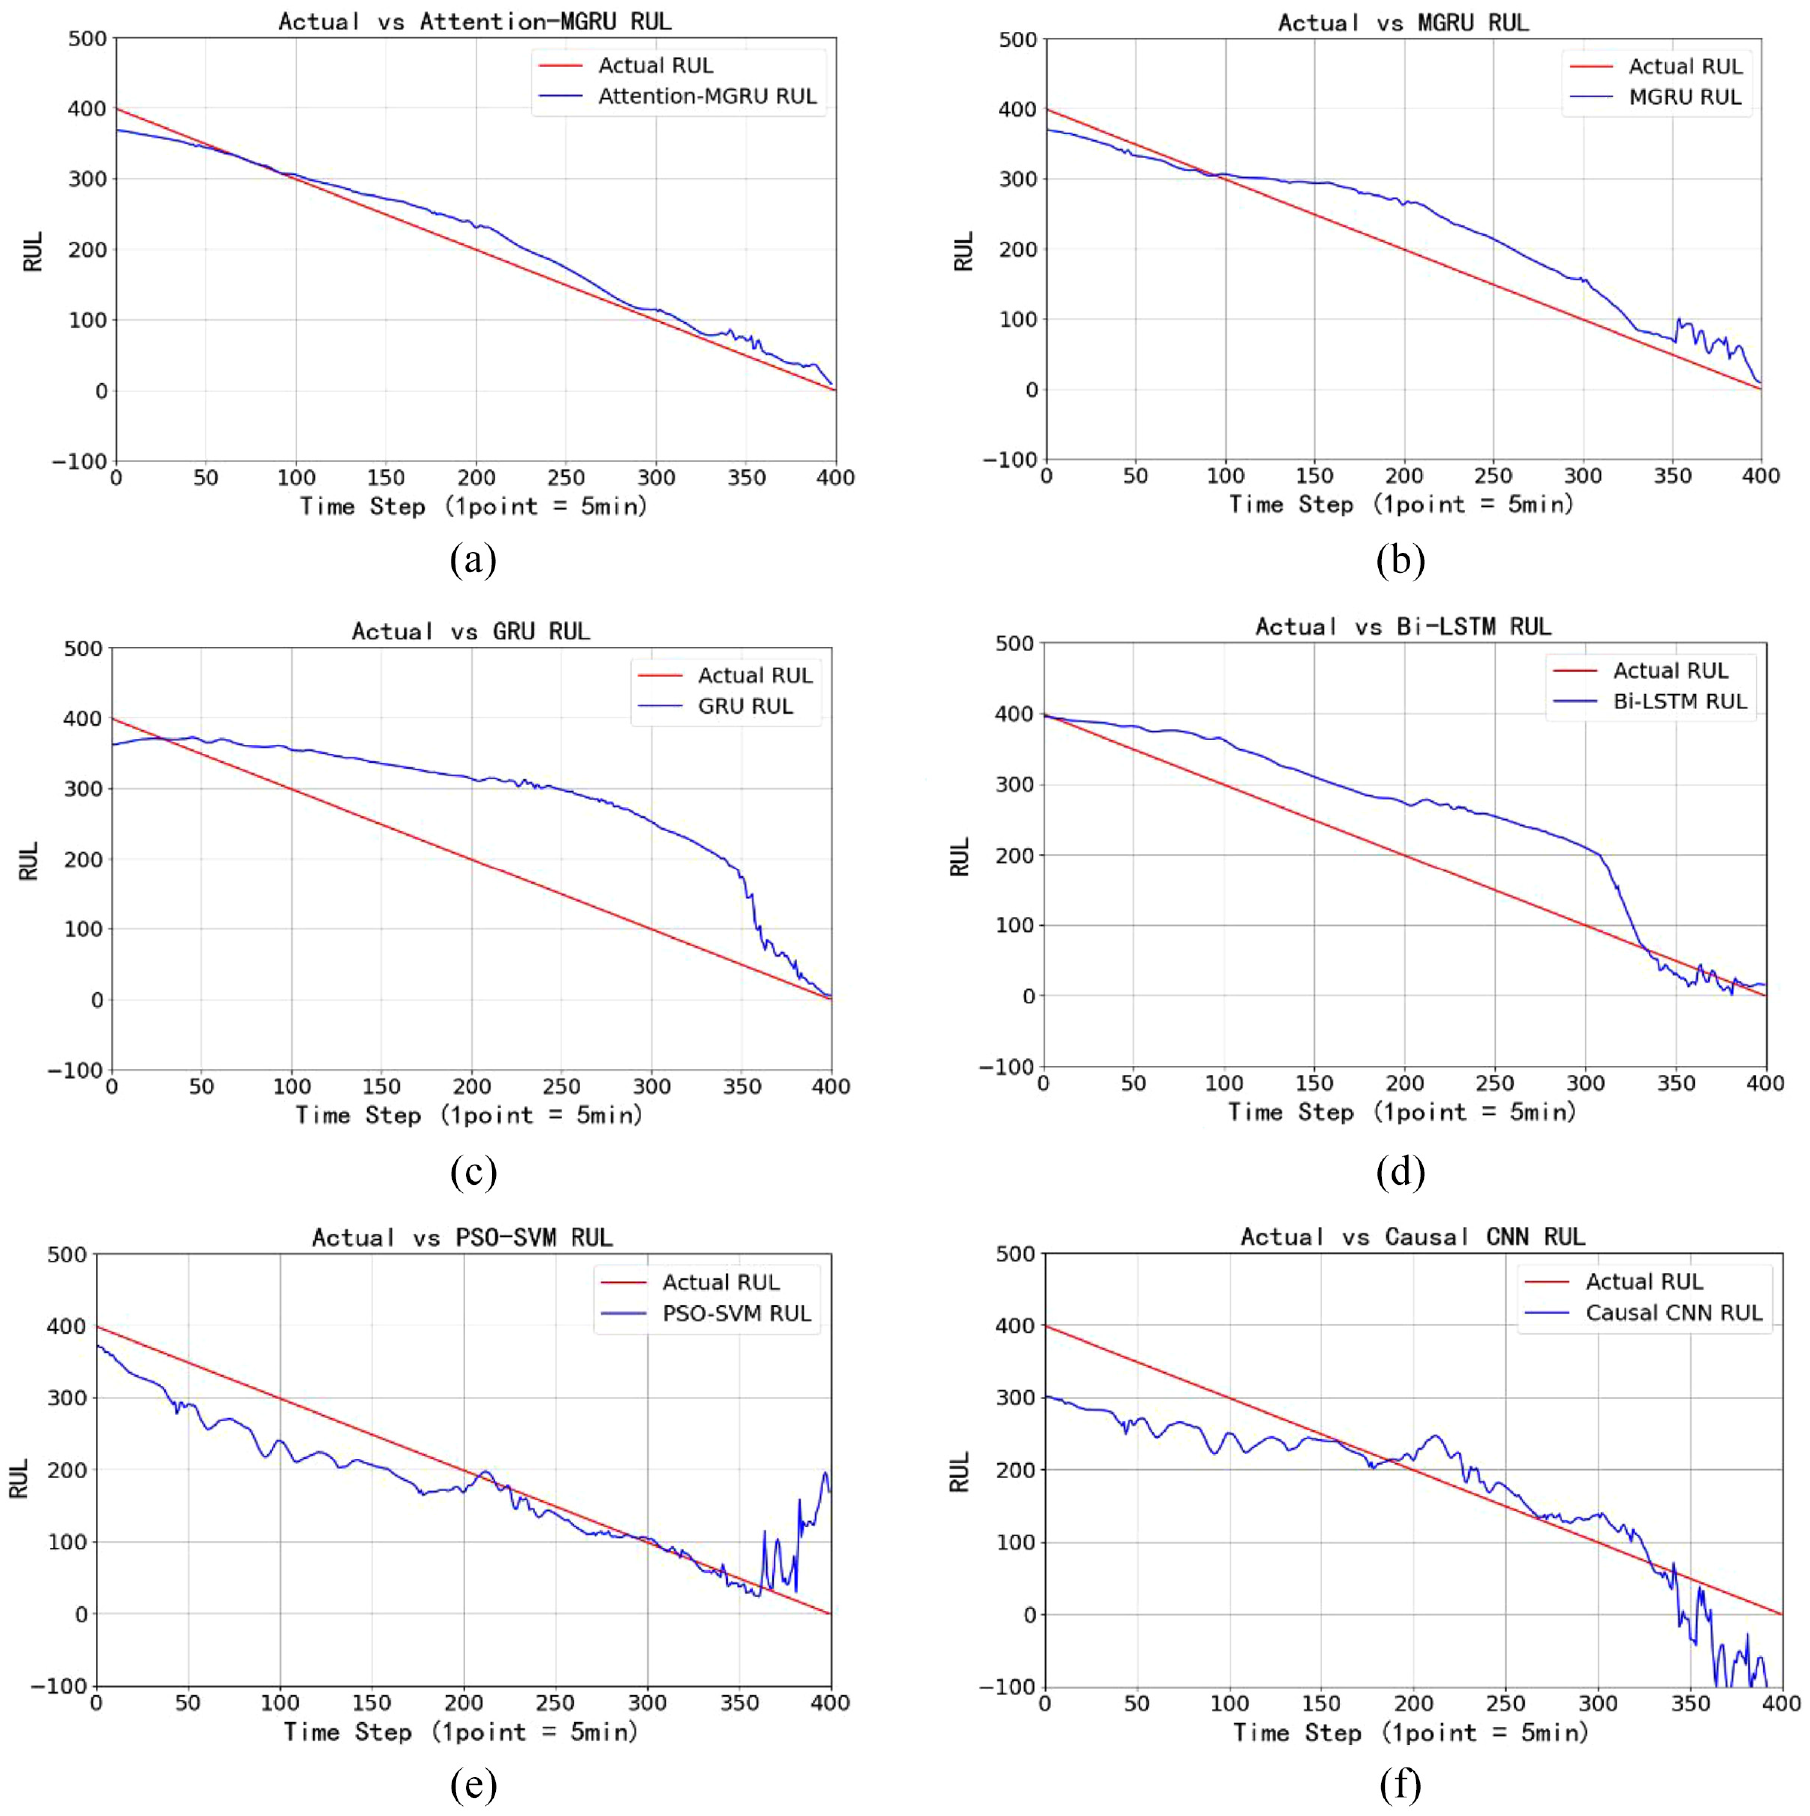
Results of test 1: (a) Results for Attention-MGRU, (b) Results for MGRU, (c) Results for GRU, (d) Results for Bi-LSTM, (e) Results for PSO-SVM and (f) Results for Causal CNN.
The prediction results based on attention-MGRU model demonstrate that this model owns obvious advantages over the other. RUL predicted by this approach shows small difference with the actual values. During the whole prediction period, the difference is diminutive and no obvious oscillation occurs. Due to the existence of attention mechanism, the internal relationship between HIs of multi-physical signals and RUL can be researched. This model considers the correlation factors of the remaining life from multiple angles, which effectively improves the accuracy and stability. MGRU prediction model takes
To compare the performance of each model more intuitively, mean absolute error (MAE) and root-mean-square error (RMSE) are used for comparison and measurement. Their formulae are as follows
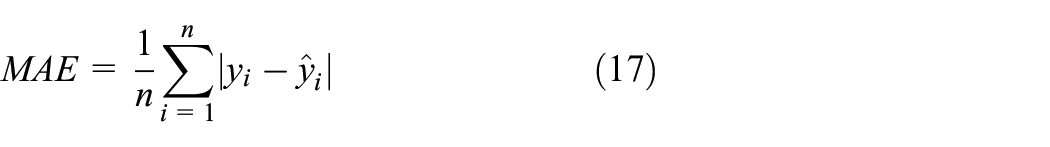
where n is the total number of points;
Test 2: Validation and discussion through different data sets
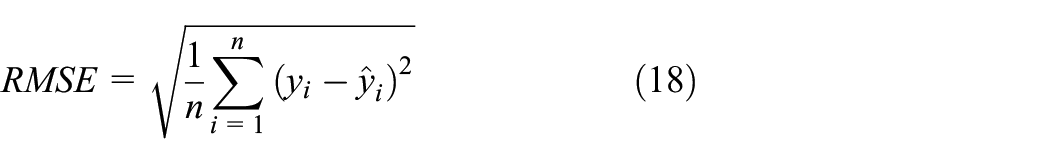
The test performed above divides data into a training set and a test set, which is incapable to support that this method has good generalization. So, vibration and torque signals from other sensors are applied to validate this test. Training sets are the HI data obtained in test 1. New sets of data and HIs of them are shown in Figure 6(a)–(b). Then, parameters of initial model are modified according to the method proposed in “Build life prediction model” section. There is only one set of torque data, so the fine-tuning operation only brings in new vibration and temperature data. Figure 6(c)–(d) demonstrates the prediction results of two different models including values of RUL and the weights each variable accounting for. It can be perceived that the curve after fine-tuning is closer to actual line than the curve of original results from Figure 6(c), and the weights provided by attention layer transform slightly from Figure 6(d). Temperature and torque account for a greater proportion while vibration is the opposite.
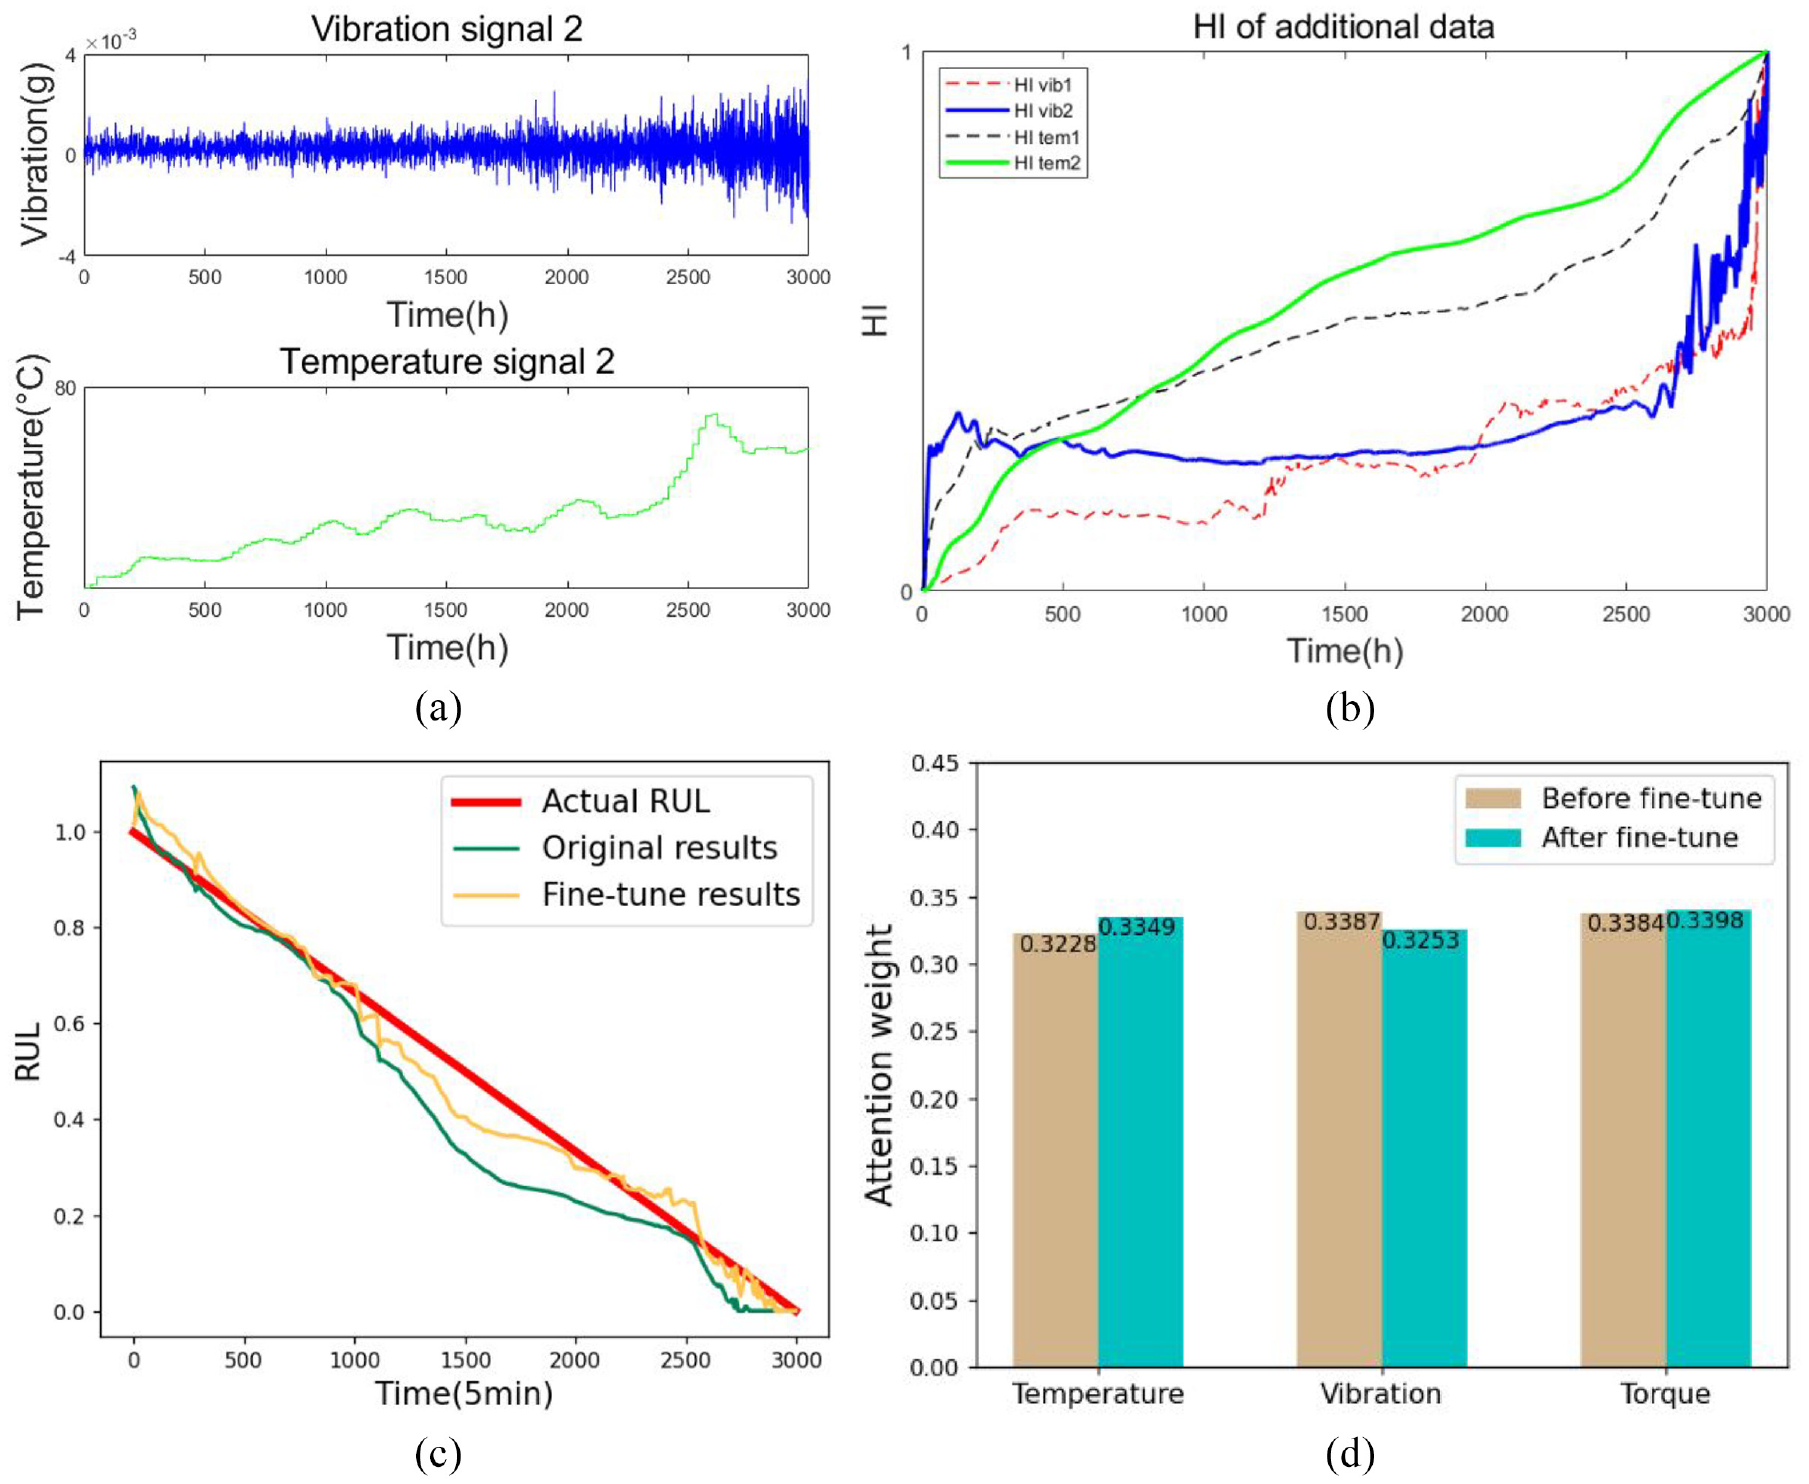
Raw signals, HIs and results of test 2: (a) Raw signals of test 2, (b) HIs of test 2, (c) Results for proposed method in test 2 and (d) Attention weights of test 2.
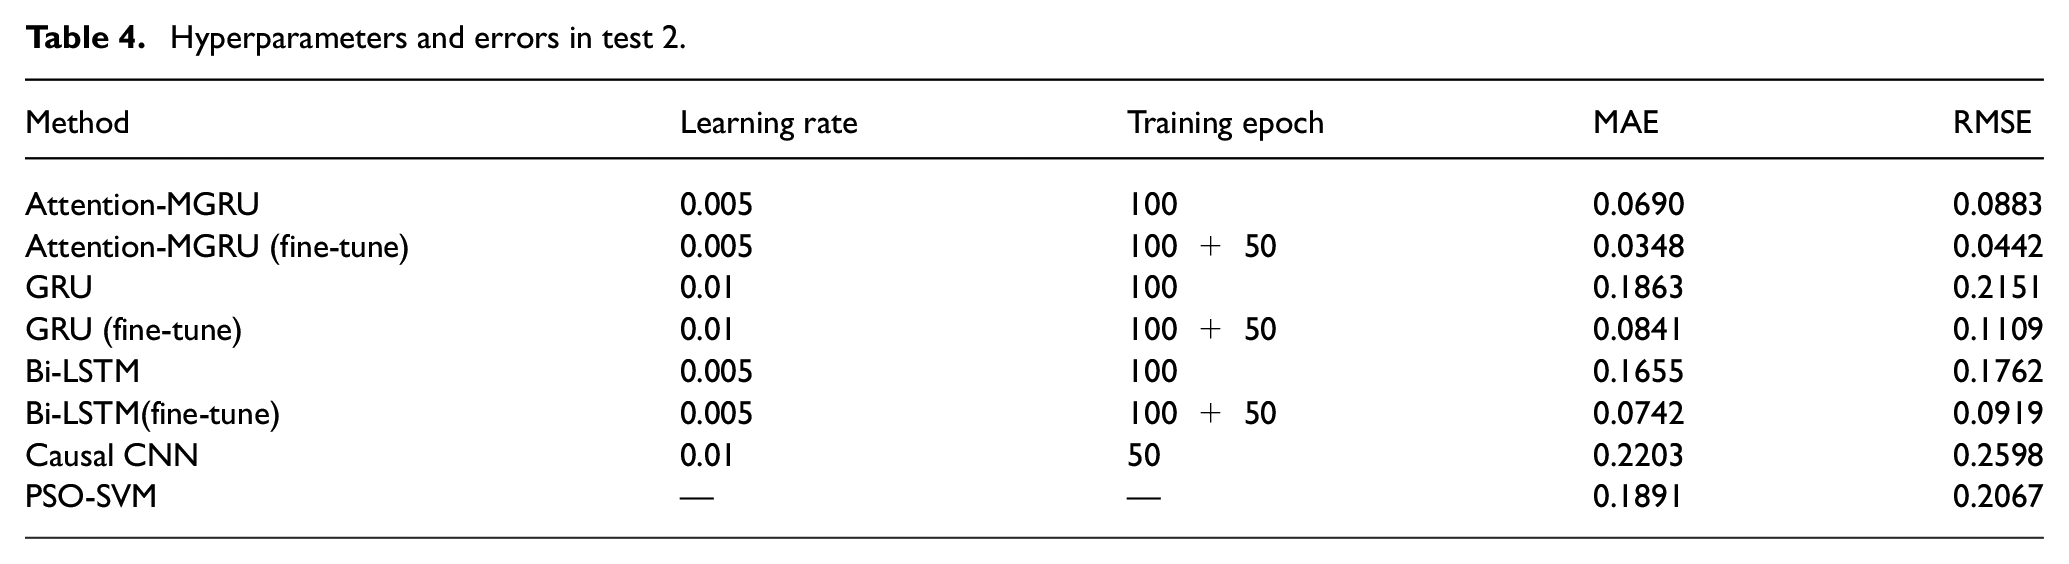
In addition, the proportion change of the temperature signal is minimal. These phenomena are consistent with the discrepancy of actual data, which validates the effectiveness of results. The values of error indicators of the initial model and modified model as well as other advanced methods are present in Table 4. RUL is normalized in test 2, so the evaluation indicators’ order of magnitude is different from test 1. Hyperparameters of models are the same as those of test 1. Models converge faster in fine-tuning process, so the additional epoch is set to 50. After fine-tuning, the prediction accuracy of attention-MGRU, GRU, and Bi-LSTM gets improved. This proves the effectiveness of fine-tuning. Moreover, compared with other models in the table, attention-MGRU (fine-tune) has the best precision.
Hyperparameters and errors in test 2.
Conclusion
Based on the traditional GRU model, an attention-MGRU prediction model is proposed in this paper. The internal correlation of multi-physical signals is captured by the attention mechanism. It can be seen that the approach proposed in this paper can effectively improve the predictive accuracy and stability according to the results. In addition, multiple physical variables ensure the rationality and robustness of the model. It performs well in cross-domain tasks with the aid of fine-tune, which demonstrates its ability of generalization. The method presented in this paper provides a new idea for the maintenance of rotary machinery in the future. In the next stage, we will try to apply this method in practice and do some research to improve model’s predictive ability under the condition of few shot.
Footnotes
Declaration of conflicting interests
The author(s) declared no potential conflicts of interest with respect to the research, authorship, and/or publication of this article.
Funding
The author(s) disclosed receipt of the following financial support for the research, authorship, and/or publication of this article: This work was supported by the National Natural Science Foundation of China (grant no. 51875273) and Suzhou Key Research and Development Industrialization Project (grant no. SGC2020064). Meanwhile, the authors would like to thank the editors and the anonymous reviewers for their helpful comments.
Data availability statement
Data sharing is not applicable to this article as no data sets were generated or analyzed during this study.