





Abstract
Prediction of rolling bearing performance degradation trends is crucial for ensuring the reliability and safety of rotating machinery in industrial applications. Aiming at deep learning methods such as recurrent neural network, convolutional neural network, and their variants only focus on a single temporal or spatial dimension of time series and lack joint modeling of spatio-temporal features, this paper proposes a rolling bearing performance degradation trend prediction method based on Refined Composite Multiscale Fractional Diversity Entropy (RCMFDE) and Spatio-Temporal Attention Graph Convolution Network (STAGCN). First, the fractional calculus is introduced into the Diversity Entropy (DE), and the multi-scale analysis is extended to propose a feature indicator construction method based on RCMFDE. The spatial correlation of the RCMFDE graph model is parsed by Chebyshev graph convolutional network (ChebGCN), and the gated recurrent unit is designed to learn the temporal correlation. Meanwhile, the weight allocation of key degenerate nodes is dynamically optimized by using the soft-attention mechanism, and the STAGCN prediction framework is established. Experimental verification shows that by improving DE, the robustness of the feature indicator has been enhanced. Compared with the Temporal Fusion Transformer, Efficient Additive Attention Transformer, Series-Core Fused Time Series, TimeXer, and Extended Long Short-Term Memory-Informer models, the MAE and Score of the STAGCN prediction model are reduced by 14.19%–48.13% and increased by 6.42%–14.77%, respectively.
Introduction
To ensure the safe operation of mechanical equipment, timely maintenance of the equipment is necessary. By using performance degradation trend prediction technology, maintenance opportunities can be identified to extend the service life of mechanical equipment while saving costs (Sun and Wang, 2024). In many application scenarios, predicting the performance degradation trend of rolling bearings plays an important role. Bearings are key components in wind turbines, aircraft engines, and machine tools. By using performance degradation trend prediction methods, bearing failures can be detected on time, thereby avoiding unexpected shutdowns caused by sudden failures. Bearings used in nuclear power plant cooling pumps, thermal power plant coal mills, and ship gas turbines require extremely high safety standards. By constructing characteristic indicators that characterize their health status, predicting performance degradation trends can detect faults in advance and ensure the safe operation of equipment (Chen et al., 2023).
Rotating machines under normal and fault operation have corresponding characteristics to reflect their operating status (Feng et al., 2023). Rolling bearing vibration signals often exhibit nonlinear and nonsmooth characteristics (Cheng et al., 2024). Feature extraction based on entropy theory not only quantitatively analyzes the complexity of data, but also possesses the ability to effectively identify the dynamic changes of nonlinear behavior (Ma et al., 2025). Li et al. (2023) extracted features from signals using refined composite multiscale dispersion entropy. Wang et al. (2024b) proposed a refined composite multiscale slope entropy to overcome the lack of complexity and regularity in the description of bearing signals. Meanwhile, in gear fault diagnosis, Wang et al. (2025) utilized Boltzmann–Shannon interaction entropy to extract high-frequency and low-frequency fault information.
Performance degradation prediction methods include physical models and data-driven models (Zan et al., 2021). Methods based on physical models usually rely on priori knowledge (Qiu et al., 2023). Song et al. (2023) established a predictive model based on two Wiener process models. The simplicity and high prediction accuracy of data-driven modeling methods have made it a mainstream method (Hou et al., 2024). Ou et al. (2024) used distribution discontinuity evaluation gated recurrent unit (GRU) to capture temporal dependencies in data. Li et al. (2024a) established a prediction model based on the trend memory attention-based GRU network. Sun et al. (2024) proposed multiple kernel convolutional LSTM (MKConvLSTM) to capture temporal information during the degradation process by dynamically selecting features. However, most of the relevant studies based on recurrent neural network (RNN) and their variants have only considered temporal correlation in time-series data. Luo et al. (2025) enhance the extraction of local features through multi-scale convolution. Qi et al. (2024) built a prediction model based on a graph isomorphism network. Li et al. (2024b) used graph entropy to take into account the structural differences between dynamic changes in graphics and perform spatial feature modeling. The traditional graph convolution network (GCN) has even been proven to focus mainly on spatial features, ignoring the temporal features of the data (Ma et al., 2024). Meanwhile, when monitoring the status of the gearbox, Li et al. (2024c) proposed Composite Neuro-Fuzzy System-Guided Cross-Modal Zero-Sample Diagnostic Framework. Feng et al. (2025) used a hybrid model and data-driven approach for gear wear monitoring.
Compared with traditional methods, entropy-based nonlinear dynamics methods have the advantages of rigorous mathematical theory and high efficiency. However, the existing entropy analysis methods are difficult to fully consider the signal’s pattern, amplitude information, and low sensitivity when describing the long-term correlation information of the signal, which affects the accuracy of feature extraction. RNN, GNN (graph neural network), and their variant networks based on deep learning are research hotspots in the field of mechanical system state monitoring, widely used in processing data with complex temporal and spatial relationship characteristics. The existing research mainly relies on a single model method, but a single model structure cannot simultaneously take into account the temporal and spatial relations. To overcome these limitations, this paper proposes a rolling bearing feature indicator construction method based on Refined Composite Multiscale Fractional Diversity Entropy (RCMFDE), designs a Spatio-Temporal Attention Graph Convolution Network (STAGCN) to predict the degradation trend of rolling bearing performance, and explores the effectiveness of the model. The main contributions of this work are summarized below:
Research a feature indicator construction method based on RCMFDE and explore its superiority in representing degraded information. The experiment verified that the linear weighted evaluation results of RCMFDE are superior to multiscale diversity entropy (MDE) and Refined Composite Multiscale Diversity Entropy (RCMDE) at all scales, and verified that the feature indicators extracted by RCMFDE have good anti-interference robustness.
A spatio-temporal fusion framework based on GRU and Chebyshev Graph Convolution Network (ChebGCN) is constructed to effectively express the spatio-temporal correlation of vibration signals, and the attention mechanism is introduced to adaptively assign the weights to build an STAGCN. The MAE metric based on the STAGCN prediction model decreased by 20.80%, 48.13%, 17.91%, 14.19%, and 17.18% compared to the temporal fusion transformer (TFT), efficient additive attention transformer (EAAT), series-core fused time series (SOFTS), TimeXer, and Extended Long Short-Term Memory-Informer (XLSTM-Informer) models, respectively. The Score metric increased by 7.16%, 14.77%, 7.07%, 6.42%, and 6.80%, respectively.
The subsequent sections are structured as follows. Constructing feature indicators based on RCMFDE is described in Section 2. In Section 3, a new method for rolling bearing degradation trend prediction using STAGCN is presented. Section 4 describes the validation of the proposed method. Section 5 is the conclusion.
Construction of feature indicator based on RCMFDE and performance evaluation
Construction of feature indicator based on RCMFDE
Diversity entropy (DE) can quantify the dynamic complexity of data by calculating the cosine similarity distribution between neighboring orbits (Jiao et al., 2025). The combination of DE and fractional calculus resulted in fractional diversity entropy (FDE).

where α denotes fractional order
The FDE under fractional order α is

where
Combining Eq. 1, the

where ε denotes the interval number and
Extending FDE to a fine composite multiscale analysis yields the RCMFDE. Figure 1 illustrates the specific calculation process of RCMFDE.

Derivation process of RCMFDE.
Step 1: Time series coarse-graining. For the original time series

Step 2: Phase space reconstruction. For a subsequence

Step 3: Cosine similarity calculation.


Step 4: State probability calculation. Divide interval [−1, 1] into ε intervals. The probability that the cosine similarity value in
Step 5: Calculate the RCMFDE.


where
Evaluation of feature indicator based on linear weighting
This study systematically evaluates the extracted multi-feature indicator based on three core metrics: trend monotonicity, degradation correlation, and anti-interference robustness.
The linear weighting formula is:

where
The weight calculation function is:

where n indicates the total number of attributes. j is queuing level.
Since the degradation process is irreversible, the feature indicator that characterizes the bearing degradation trend should show a monotonous change trend while maintaining a high degree of correlation. Based on this, the monotonicity, correlation, and robustness criteria were assigned ranks 1, 2, and 3, respectively.
Obtain
Performance degradation trend prediction model based on STAGCN
To fully explore spatio-temporal degradation information in the data, this study carries out the construction of a graph model on the basis of the RCMFDE feature indicator and builds the STAGCN model.
Spatio-temporal correlation feature extraction
Temporal scale feature extraction
The GRU completes the process of updating the hidden state with the help of the update gate operation and realizes the function of processing and transferring information through the calculation of the reset gate (Fantini et al., 2024). The updated rule for

where at moment t, the input data are
Spatial scale feature extraction
According to the form of definition of graph convolution, GCN can be categorized into two paradigms based on spectral and spatial domains. Graph convolution–based spectral domain maps graph structure data to the spectral domain space. Decompose the graph signal
Defferrard et al. (2016) applied the Chebyshev polynomial

Kipf simplified this model by restricting K = 1 and approximating the maximum eigenvalue


where
Expanding the above convolution definition to multiple convolution layers and using f spectral filters, the final propagation law for the simplified model is:

where on the l layer, output is
The spatially dependent properties of vibration signals are modeled using a two-layer ChebGCN architecture. The ReLU function acts as a nonlinear activation unit. The propagation process is represented as:

where
Soft-attention mechanism
The computational architecture of the soft-attention mechanism is as follows (Zheng et al., 2024). Suppose the input is


where
Performance degradation trend prediction model based on STAGCN
Construction of graph model based on RCMFDE
In this study, the topology of the roadmap is chosen for the construction of the RCMFDE-based graph model. The undirected weighted graph model for multiscale entropy values is described as:

where
Therefore, the problem of predicting degradation trend of rolling bearing performance can be categorized as a time series analysis task. The core is to construct a spatio-temporal mapping function f based on a given PathGraph
Construction of a STAGCN-based model for predicting performance degradation trends
The STAGCN model consists of ChebGCN, GRU, and a soft-attention mechanism, as shown in Figure 2. Combining ChebGCN and GRU to obtain the spatio-temporal characteristics, global trend of rolling bearing degradation state is captured by the soft-attention mechanism to realize the accurate prediction of rolling bearing recession trend.

STAGCN network model.
First, this study uses the historical n entropy features


where
STAGCN’s framework is shown in Figure 3. Specific operation process is as follows:
Step 1: Acquire raw vibration data. Build a bearing full life simulation accelerated degradation experimental platform to obtain vibration data of rolling bearings throughout their entire life cycle.
Step 2: Construct RCMFDE feature indicators. The vibration signals are extracted by FCMFDE features, and the multiscale entropy value at the optimal fractional order parameter is selected using a linear weighting formula.
Step 3: Modeling Graph Entropy-Based. The feature matrix
Step 4: Build the STAGCN prediction model. Construction of STAGCN prediction model by ChebGCN spatial dimension, GRU temporal dimension, and soft attention mechanism.
Step 5: Adjust the network parameters. Initialize model network parameters. The STAGCN model is trained in multiple batches through the training set.
Step 6: Performance degradation trend prediction. Use the trained completed model to predict the decline trend of rolling bearing performance.

Framework for predicting rolling bearing degradation trends based on STAGCN.
Experimental verification and analysis
The rolling bearing full life cycle vibration data described in this paper comes from the BPS bearing accelerated degradation experimental bench built independently in the laboratory. In Figure 4, it consists of key components such as an AC motor, digital force display, speed control module, hydraulic servo loading device, adjustable force arm mechanism, spindle system, support bearing set and bearings to be tested.

BPS Bearing accelerated degradation test bench.
The vibration signals of bearing in different directions were collected by installing triaxial acceleration sensors on the bearing housing. The sampling frequency is 25.6 kHz, Blocks is set to 1, the duration of a single sample is 1.28 s, and the sampling interval is 1 minute. Working condition A: rotation rate is 1800 r/min and radial load is 10 KN. Working condition B: rotation rate is 2100 r/min and radial load is 9 KN. Working condition A: rotation rate is 2400 r/min and radial load is 8 KN.
In this paper, the collected B1 bearing dataset will be used to investigate the superiority of the proposed method. In the horizontal direction, there are radial loads that allow the vibration response in that direction to more fully reflect the degradation characteristics of the bearing component. Therefore, in this study, it was determined that the horizontal direction vibration signal would be used as an analytical parameter.
Analysis of feature indicators based on RCMFDE
In RCMFDE, fractional order α, scale factor τ, embedding dimension m, and cosine similarity d are four main parameters. Multiscale is a processing method to get different analytical perspectives by scale variation of vibration signals, and in this paper, the scale factor is set to 10. m is too large to detect the early small changes in the vibration signals, and m is too small to tap into the dynamic changes in the vibration signals. According to the suggestions in the literature (Wang et al., 2020), the embedding dimension of 2 is chosen in this paper. The value of cosine similarity is related to the correlation between the reconstructed signal components, and since the contribution of this similarity measure to the entropy is negligible, it is set to 1.
To select the optimal value of fractional order, the linear weighted calculation results of RCMFDE with fractional order

Weighted results of linear evaluation of RCMFDE at different fractional order values.
From Figure 5, when the fractional order
Calculate the feature evaluation indicators and linear weighted evaluation results of MDE, RCMDE, and RCMFDE under 10 scale factors. To show the evaluation results of the three types of feature indicators, the data are visualized in the form of bar charts, and the analysis results obtained are shown in Figure 6. After the introduction of fractional order, the monotonicity of RCMFDE does not change significantly compared to MDE and RCMDE at different scale factors; the correlation of RCMFDE decreases at individual scales, but the robustness of RCMFDE improves significantly at all scales. And the weighted results of RCMFDE are all better than those of RCMDE and MDE. This indicates that the proposed RCMFDE feature indicator construction method can significantly improve the anti-interference robustness of the feature indicators, and its sensitivity and contained degradation information are improved to different degrees.

Results of each evaluation indicator with different entropy values. (a) Monotonicity; (b) Correlation; (c) Robustness; (d) Weighted results.
The normalized feature metrics of the RCMFDE based on the best fractional order

Multiscale results for RCMFDE characterization indicators of fractional
From Figure 6, the weighted metrics evaluation results of RCMFDE with the fractional order taking the value of 0.5 are overall better than the entropy metrics of both MDE and RCMDE. From Figure 7, the RCMFDE entropy values exhibit a consistent degradation trend from the second scale to the tenth scale. Therefore, the entropy values of RCMFDE at a total of 9 scales from RCMFDE-2 to RCMFDE-10 are selected as inputs to the prediction model.
Performance degradation trend prediction verification based on STAGCN
The STAGCN prediction model is constructed with an architecture that relies on the TensorFlow deep learning framework implementation. The activation function of ChebGCN is ReLU. The activation function of GRU is sigmoid. Optimizer is Adam. The number of trainings is 130. The training set ratio is 80% and the test set ratio is 20%. The batch size is 32.
To measure the predictive performance of STAGCN, MAE, and Score were used to assess the model’s efficacy.


where


where
The number of neurons and learning rate are key hyperparameters in the STAGCN model, and their values play a key role in the model’s prediction accuracy. This study conducted comparative experiments to determine the optimal parameter settings. The number of neurons was set to 8, 16, 32, 64, and 128, and the learning rates were set to 0.01, 0.005, and 0.001. The evaluation metric for the STAGCN model under different parameter settings was MAE.
As shown in Table 1, the evaluation results are best when the learning rate is 0.001 and the number of neurons is 64. When the learning rate is constant, the predictive performance of the STAGCN model shows a trend of first improving and then decreasing with the increase of the number of neurons. This indicates that when the number of neurons is below the critical value, the model will have difficulty fully capturing data features, leading to underfitting problems and limiting its predictive performance; On the contrary, when the number exceeds the optimal interval, it is easy to cause the model to overfit to the training samples.
Prediction results of the model under different hyperparameters.

To evaluate the predictive performance of the STAGCN model, it was compared with the TFT, EAAT, SOFTS, TimeXer, and XLSTM-Informer models. Figure 8 shows the prediction results and local magnified images of each model test set.

Prediction results of different models and local magnification. (a) TFT; (b) EAAT; (c) SOFTS; (d) TimeXer; (e) XLSTM-Informer; (f) STAGCN.
From the prediction results of each subfigure in Figure 8, the STAGCN prediction model significantly outperforms the other comparative models in terms of the fitting accuracy of the overall trend and local extremes. By analyzing the enlarged graphs of the prediction results of six models, it can be found that the prediction curves of TFT, SOFTS, TimeXer, and XLSTM-Informer models have a high degree of fit during the stable operation stage, but a low degree of fit during the fluctuation stage, which cannot truly reflect local degradation information. The prediction results of the EAAT model are highly biased.
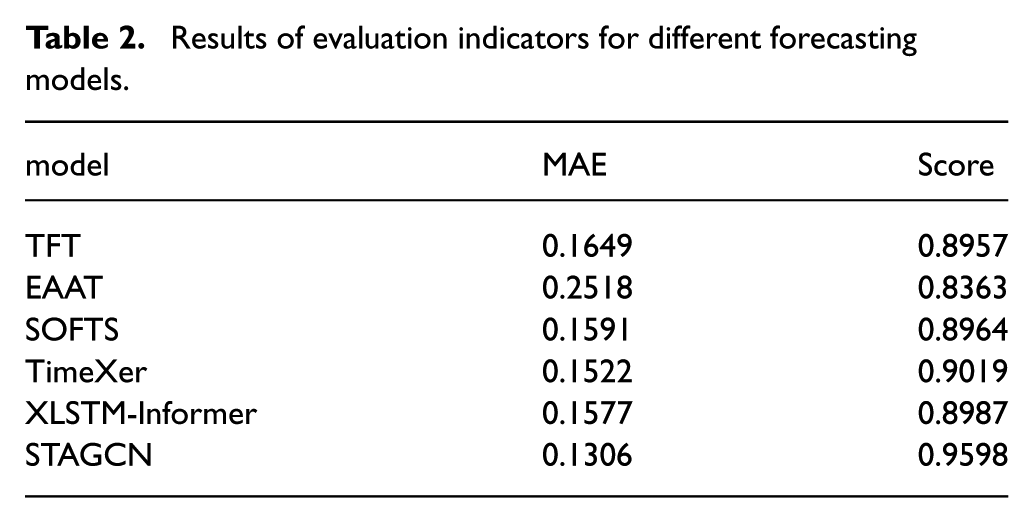
Table 2 shows the MAE and Score of six models. The STAGCN model has the smallest MAE metric and the largest Score, so the STAGCN prediction model has a smaller prediction error and optimal prediction performance. The MAE of the STAGCN model decreased by 20.80%, 48.13%, 17.91%, 14.19%, and 17.18% compared to the TFT, EAAT, SOFTS, TimeXer, and XLSTM-Informer models, respectively. The Score metric increased by 7.16%, 14.77%, 7.07%, 6.42%, and 6.80%, respectively. Therefore, after experimental comparison and verification, the STAGCN model has shown significant advantages in predicting the degradation trend of bearing performance.
Results of evaluation indicators for different forecasting models.
Conclusion
In this paper, a rolling bearing performance degradation trend prediction method based on STAGCN is constructed. Accurate performance degradation trend prediction is achieved through joint modeling of spatio-temporal features. By combining fractional calculus with DE, a rolling bearing feature indicator based on RCMFDE is constructed, fully retaining the advantage of DE in characterizing the dynamic characteristics of vibration data. With the help of sensitivity measurement in calculus operations, the robustness of the constructed feature indicator is greatly improved. The optimal fractional order parameters were determined using a weighting formula based on the coefficient of variation method and a linear weighting strategy, and a comprehensive weighted evaluation was conducted on the three entropy features. Based on the RCMFDE feature indicator, a PathGraph model is established. A spatial correlation model is constructed using ChebGCN and PathGraph topology structure. A temporal correlation model is constructed by GRU. Introducing a soft-attention mechanism to regulate weights through a serial combination approach. Build a performance degradation trend prediction model for rolling bearings based on STAGCN. The experimental results show that the robustness advantage of RCMFDE over MDE and RCMDE is effectively maintained at different scale parameters. The MAE metric based on the STAGCN prediction model decreased by 20.80%, 48.13%, 17.91%, 14.19%, and 17.18% compared to the TFT, EAAT, SOFTS, TimeXer, and XLSTM-Informer models, respectively. The Score metric increased by 7.16%, 14.77%, 7.07%, 6.42%, and 6.80%, respectively. The STAGCN prediction model can effectively reduce prediction errors.
Shortcomings and prospects of this article:
This model is mainly based on vibration signals, and subsequent research can incorporate multi-source monitoring data such as temperature, torque, and acoustic emission to construct a cross modal knowledge graph and multi-channel STAGCN to capture more comprehensive bearing degradation characteristics.
Footnotes
Acknowledgements
This research was funded by the National Natural Science Foundation of China, grant no: 52175502, the Heilongjiang Provincial Natural Science Foundation of China, grant no: LH2023E082, and Natural Science Foundation of Hunan Province, China, grant no: 2023JJ40289.
Declaration of conflicting interests
The authors declared no potential conflicts of interest with respect to the research, authorship, and/or publication of this article.
Funding
The authors disclosed receipt of the following financial support for the research, authorship, and/or publication of this article: This work was supported by the National Natural Science Foundation of China, grant no: 52175502, supported by the Heilongjiang Provincial Natural Science Foundation of China, grant no: LH2023E082, and supported by Natural Science Foundation of Hunan Province, China, grant no: 2023JJ40289.

Data availability statement
The datasets generated during and/or analyzed during this study are available from the corresponding author on reasonable request.