
Abstract
As the cornerstone of modern industrial production, the reliable operation of complex mechanical equipment is crucial for ensuring operational stability, enhancing production efficiency, and preventing safety incidents. However, due to the intricate structures, multi-source coupled fault modes, and prominent nonlinear dynamic evolution characteristics, traditional diagnostic models often fail to simultaneously address high-dimensional feature processing and complex nonlinear relationships, which limits their diagnostic accuracy. To address the high-accuracy diagnostic requirements in industrial applications, this paper proposes a fault-diagnosis method for complex machinery based on Stacking ensemble learning. The method integrates Random Forest (RF), XGBoost, Support Vector Machine (SVM), and Backpropagation (BP) neural networks as heterogeneous base learners, with a BP neural network employed as the meta-learner to construct a layered fusion framework that effectively combines the strengths of each model. In addition, feature selection is performed using time-weighted maximum mutual information coefficients in combination with recursive feature-elimination cross-validation to identify the optimal feature subset. Furthermore, a constraint-based Bayesian optimization approach, tailored for industrial deployment, is used for automatic hyperparameter tuning of the base learners. The proposed method is applied to a lithium battery electrode double-roll pressing machine, where comprehensive data completion and validation experiments are conducted on real-world data containing 11 fault categories. The results show that the proposed method achieves fault classification and severity assessment with a diagnostic accuracy of 96.67%, significantly outperforming individual models and conventional fusion strategies. This study provides an effective technical pathway for the precise and efficient intelligent fault diagnosis of complex mechanical equipment.
Keywords
Introduction
In modern industrial production, complex machinery comprises numerous precision components and multiple subsystems. Over extended periods of operation, these systems are subject to environmental variations, component aging, and multi-physics coupling effects, which lead to fault modes characterized by multi-source origins, strong coupling, and nonlinear dynamic evolution. If critical components fail, the inability to promptly and accurately identify the fault source not only degrades product quality but can also result in equipment shutdowns or even safety hazards. Therefore, the development of high-precision, robust intelligent fault-diagnosis methods under complex operating conditions and multi-source data environments remains a major research challenge in the industrial sector.
To address fault-diagnosis challenges in complex mechanical equipment, various methods based on signal processing and machine learning have been proposed. Zhou et al. (Zhou and Lei, 2021) introduced artificial intelligence–based dynamic detection into hydraulic system fault diagnosis, utilizing principal component analysis to extract features and applying a backpropagation (BP) neural network to map the relationship between features and faults, thus enhancing diagnostic accuracy to a certain extent. Guo et al. (2021a) tackled the challenge of separating coupled faults like hydraulic pump shoe and swashplate wear by proposing a mathematical morphology-based separation method using trapezoidal structural elements, which effectively extracts distinct fault features. However, such methods are typically based on manually designed feature-extraction rules, limiting their ability to adapt to complex nonlinear relationships and dynamic operating conditions.
At the system level, several studies focus on integrating equipment condition monitoring with diagnostic systems. Divi et al. (Divi and Priyadharsini, 2015) designed a CAN (Controller Area Network) bus-based monitoring and fault-diagnosis system for real-time equipment status monitoring, while Fan et al. (2020) developed a fault tree analysis–based diagnostic platform for launch vehicles, achieving progress in system integration and logical modeling. However, these approaches mainly focus on system architecture and information exchange, leaving insufficient exploration of complex fault patterns hidden within high-dimensional, multi-source data, which leaves room for improvement in diagnostic accuracy.
With the advancement of machine learning technologies, data-driven approaches have become a research hotspot for fault diagnosis in complex equipment. Soltanali et al. (2021) employed fuzzy fault tree analysis to optimize equipment-availability decisions; Guo et al. (2021) achieved system-level information fusion via multi-task parallel convolutional neural networks; Chen and Zheng (2023) combined feature selection and ensemble learning to improve bearing fault-diagnosis performance; Li et al. (2023a) enhanced model input expressiveness by incorporating polynomial features; Zheng et al. (2023) and Wu et al. (2023) employed genetic algorithms and Bayesian optimization methods to optimize model parameters, respectively. While these methods show satisfactory results in specific scenarios, most studies still rely on single models or fixed-structure ensembles, struggling to address the complex challenges of high-dimensional feature processing, nonlinear modeling, and overall diagnostic performance.
Fundamentally, fault diagnosis in complex mechanical equipment faces several challenges. On the one hand, fault features are highly dimensional and exhibit complex correlations, with feature subspaces varying significantly in terms of sensitivity to different models. On the other hand, machine learning models each have their strengths and limitations when handling noise, nonlinear relationships, and imbalanced data. Random Forest (RF) excels in high-dimensional and noisy environments, Support Vector Machines (SVM) maintain good generalization under small sample conditions, XGBoost captures complex nonlinear relationships effectively, and neural networks excel at learning implicit mapping relationships between features and failure modes. However, a single model often excels only for specific fault modes or feature subspaces, making it difficult to capture the multi-source coupled fault characteristics of complex machinery. Therefore, integrating the complementary strengths of multiple models is crucial to enhancing diagnostic performance.
To improve diagnostic accuracy and robustness, integrating predictions from multiple models is an effective strategy. However, simple fusion methods such as weighted voting and averaging typically rely on fixed rules, which cannot dynamically adapt to changes in feature subspaces. To overcome this limitation, ensemble learning methods have emerged (Bahad and Saxena, 2020; Li et al., 2023; Xu et al., 2019; Ye et al., 2019). Ensemble learning leverages the complementary strengths of various models by combining outputs from multiple base learners, thereby improving performance in high-dimensional feature spaces and nonlinear problems (Dong et al., 2020; Mienye and Sun, 2022).
As industrial systems grow increasingly complex, ensemble learning methods have attracted significant attention in fault-diagnosis research. Liu et al. (2023) proposed an attention-based ensemble learning approach that deeply integrates multi-source features, enhancing diagnostic accuracy and robustness. Chen et al. (2025) adopted an uncertainty-guided Bayesian active learning strategy, using Bayesian neural networks to assess sample uncertainty, significantly reducing labeling costs while improving fault-diagnosis performance. Li et al. (2025) constructed a trustworthy Bayesian deep learning framework, enabling uncertainty quantification and confidence calibration, thus enhancing the reliability of diagnostic results. Despite these advancements, complex integration strategies often rely on sophisticated model structures and significant computational resources, which increase sample size and inference latency requirements.
In industrial settings involving multi-sensor systems and fluctuating operating conditions, such as dual-roll press equipment, balancing model stability, diagnostic performance, and engineering feasibility is crucial. In this paper, we comprehensively consider diagnostic accuracy, robustness, and deployment requirements. By adopting the Stacking ensemble learning framework and integrating feature optimization with constrained Bayesian hyperparameter optimization, we achieve efficient diagnosis of multiple fault types. Stacking was selected for its ability to adjust base model weights dynamically through meta-learning, allowing for effective integration of model strengths to improve diagnostic performance. This approach is well-suited for handling complex fault patterns and dynamic operating conditions. The main contributions of this paper are summarized as follows:
Developed a fault-diagnosis model for complex mechanical equipment based on Stacking ensemble learning. By integrating the complementary strengths of multiple base learners and dynamically adjusting their weights via a meta-learner, the model significantly improves diagnostic accuracy and stability under complex operating conditions;
Combining the maximum mutual information coefficient (MIC) with its temporal characteristics and Recursive Feature Elimination Cross-Validation (RFECV), we construct an optimal feature subset to achieve synergistic optimization of feature engineering and model integration.
Introduced constrained Bayesian optimization to tune base learner hyperparameters, ensuring reliable and accurate diagnosis;
Validated the proposed method using real industrial production data and identified fault severity levels. Experimental results demonstrate that the method outperforms benchmark models in both diagnostic accuracy and robustness.
The structure of this paper is as follows: Chapter 2 focuses on research in ensemble learning methods, introducing evaluation metrics for fault-diagnosis models and model fusion techniques, and analyzing the performance of different models in fault diagnosis through comparative experiments. Chapter 3 focuses on fusion-optimization methods for ensemble learning models, enhancing diagnostic performance through feature subset construction and model hyperparameter optimization. Chapter 4 conducts experimental research using real-world production data, performing data completion processing and experimentally validating the proposed model fusion strategy with results analysis. Chapter 5 discusses research conclusions and future research directions. The systematic framework of the research is illustrated in Figure 1.
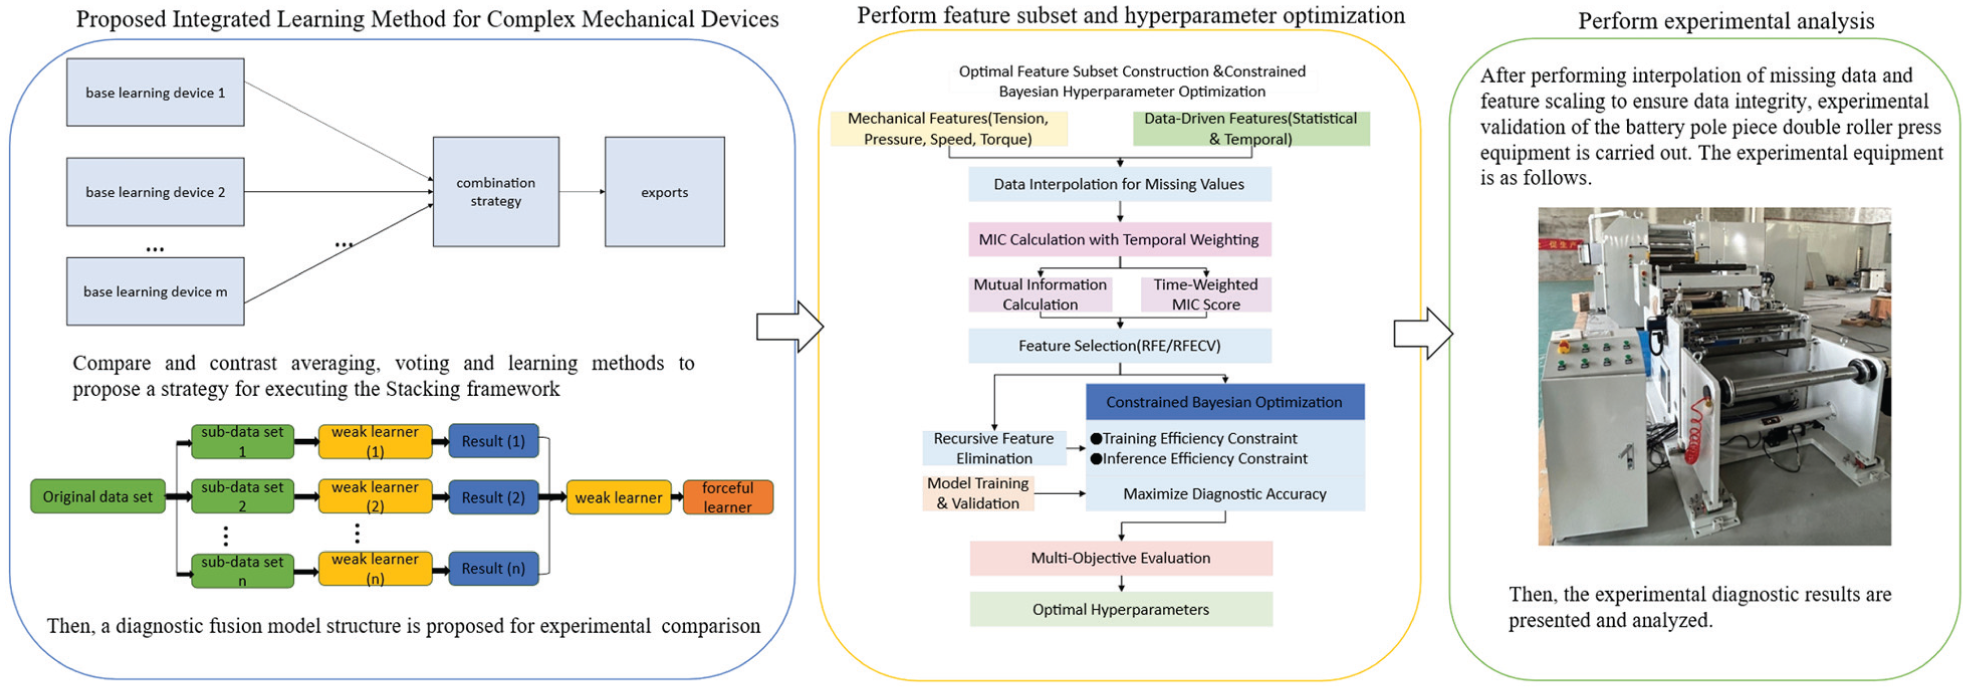
The systematic framework of the research.
Research on Stacking ensemble learning methods
The key advantage of the Stacking method lies in its flexibility and adaptability. By applying meta-learning to the outputs of base learners, Stacking dynamically adjusts the weights of each base learner, allowing the model to optimize performance adaptively under varying operational conditions. This characteristic enables Stacking to fully leverage the complementary strengths of base learners in complex machinery fault diagnosis, significantly enhancing overall diagnostic capabilities (Xu and Yang, 2018).
It should be noted that the production data used in this study satisfies the basic training requirements for various machine learning models in terms of sample size and feature dimensions. Building on this foundation, model performance was evaluated through repeated experiments and cross-validation strategies to ensure the stability and reliability of the analytical results under experimental conditions.
Diagnostic model evaluation metrics
The Stacking ensemble learning method begins with the selection of appropriate base learners, which requires evaluation through specific metrics. For fault-diagnosis classification tasks, the confusion matrix is used to assess the performance of the classifier. From the values in the confusion matrix, various evaluation metrics can be calculated, such as accuracy, precision, recall, and the F1 score. These metrics provide a multidimensional evaluation of model performance. In multi-class classification problems, where more categories are involved, the confusion matrix becomes higher-dimensional. As a result, the evaluation metrics for model performance differ from those used in binary classification tasks (Zhang et al., 2021a), and the formulas for calculating recall and accuracy are adjusted accordingly.
Here, TP represents the number of samples correctly classified into category, which is the number of misclassified samples. This sample is categorized as the target class, while its actual class belongs to category. To accurately reflect the operational status of complex machinery and more effectively evaluate model performance, the model evaluation metric cost is proposed for comprehensive assessment. Its expression is:

Among them,
Different evaluation metrics serve distinct purposes in this paper. During the initial screening phase of base learners, the primary focus is on the accuracy of the models on both the training and test sets, as well as the differences between them, to assess model stability and diagnostic capabilities. This process helps in identifying potentially overfitted models. As a result, accuracy is chosen as the main comparison metric at this stage, with multiple rounds of experiments conducted on different individual models, and their average accuracy values are compared. Initially, commonly used and widely applied machine learning algorithms were selected, including SVM, BP neural networks, Extreme Learning Machines (ELM), RF, XGBoost, Adaboost, Decision Trees (C4.5, ID3, CART), Naive Bayes (NB), and K-Nearest Neighbors (KNN). Each model underwent 20 repeated experiments, and the mean accuracy was taken as the average accuracy for each model. The resulting average accuracy rates are presented in Figure 2.
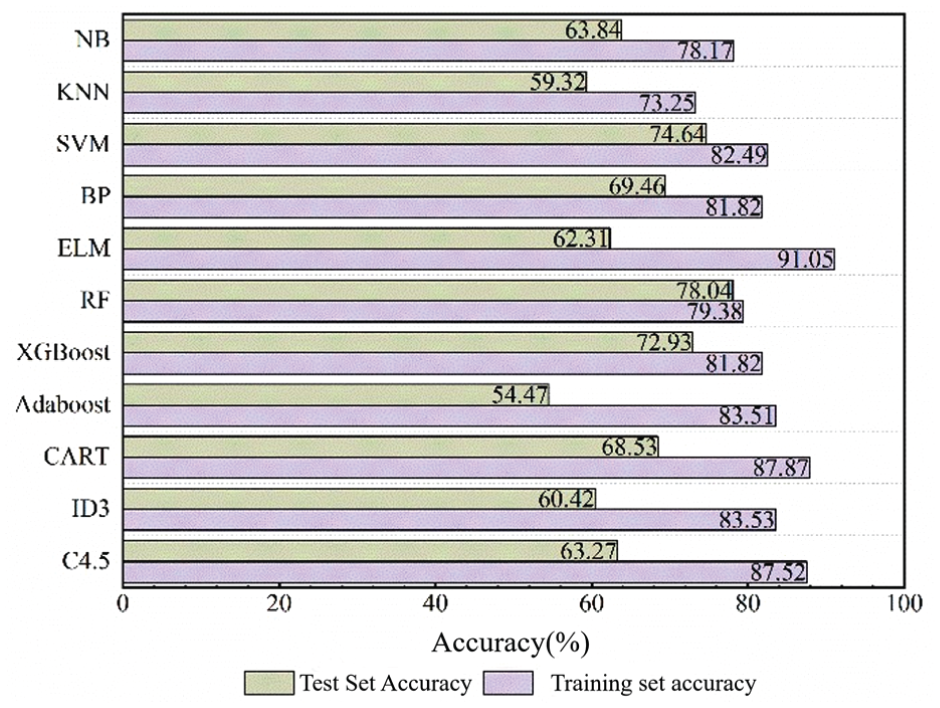
The resulting average accuracy rates.
As shown in Figure 2, there are significant differences in accuracy between the training and test sets across different algorithms. ELM, C4.5, Adaboost, ID3, and CART achieved high accuracy on the training set, but their performance on the test set declined markedly, revealing a substantial gap between the two sets and exhibiting clear signs of overfitting. In contrast, RF, SVM, XGBoost, and the BP neural network showed smaller accuracy differences between the training and test sets, indicating more stable model performance.
For the remaining algorithms, the NB and KNN models exhibit lower overall accuracy on the test set and are sensitive to feature independence assumptions or sample distribution. Their diagnostic capabilities are limited in complex scenarios involving multiple feature couplings in mechanical equipment. Furthermore, within the Stacking ensemble learning framework, the selection of base learners is not solely based on test set accuracy but emphasizes complementarity among models. RF, based on an ensemble structure of multiple decision trees, effectively handles high-dimensional features and complex noisy data, demonstrating strong robustness across diverse industrial scenarios. SVM construct decision boundaries using the maximum margin principle, maintaining strong recognition capabilities even with limited sample sizes. XGBoost progressively fits residuals through a gradient-boosting framework, demonstrating strong capabilities in capturing nonlinear feature coupling and local pattern variations, and exhibiting excellent modeling performance under complex operating conditions. BP neural networks leverage multi-layer nonlinear mapping structures to holistically learn implicit relationships between input features and fault patterns, making them suitable as learners for integrating multi-model outputs. Therefore, considering recognition capability, stability, and suitability for modeling complex nonlinear features, this paper ultimately selects RF, SVM, XGBoost, and BP neural networks as base learners. By incorporating base learners with distinct learning mechanisms and performance levels while avoiding significant overfitting, the meta-learner can synthesize effective information from multiple decision perspectives. This approach holistically enhances the model’s recognition capability and diagnostic performance.
After completing the selection of base learners, the next step is to determine the meta-learner. In the Stacking method, the meta-learner’s task is to further enhance model performance by integrating the outputs of multiple base learners, responsible for finding the optimal combination among these different outputs. An ideal meta-learner should possess the following characteristics: First, it must effectively integrate outputs from multiple base learners to enhance overall model accuracy. Second, it requires robust nonlinear modeling capabilities to capture complex patterns and features within base learner outputs. Finally, the meta-learner should demonstrate strong discrimination ability to prevent overfitting and improve model robustness.
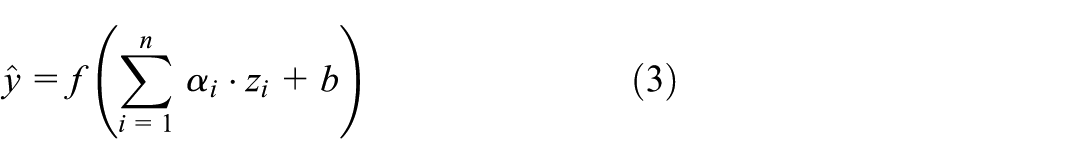
Based on these considerations, the BP neural network was selected as the meta-learner for this paper. The BP neural network can flexibly adjust weights to optimize model performance and excels at handling nonlinear relationships. Unlike traditional fixed-weight methods, the BP neural network adaptively adjusts the weights of individual base learners through its multi-layer structure and BP algorithm. Specifically, the BP neural network receives outputs from multiple base learners and integrates these outputs through dynamic weighting to optimize the final diagnostic result. Assuming the output of the i-th base learner is
During training, the BP neural network updates its weights through the BP algorithm to minimize the error between the final predicted results and the true values. During training, the BP neural network updates its weights through the BP algorithm to minimize the error between the final predicted results and the true values. The BP process involves the following steps: First, calculate the error at the output layer and propagate it backward through chain rule to each layer, computing the gradients for each layer. Then, update the weights using the gradient descent algorithm to optimize the loss function L. The weight
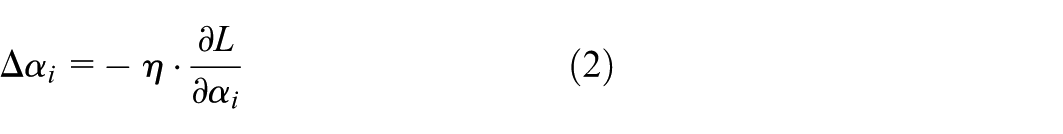
Here, η is the learning rate, which controls the step size for weight updates, and
where
Although meta-learning approaches based on attention mechanisms or gated architectures have shown promising results in certain studies in recent years, such methods typically rely on more complex network structures and higher computational resource consumption. Considering the practical demands for model stability, interpretability, and inference efficiency in industrial equipment fault-diagnosis scenarios, this paper adopts a BP neural network as the meta-learner. It utilizes a BP mechanism to dynamically adjust the weights of each base learner’s outputs. This approach ensures the model has adaptive fusion capabilities while avoiding instability issues that could arise from overly complex structures, making it more suitable for real-world engineering applications.
Model fusion and comparative experiments
To integrate the strengths of the aforementioned models, enhance the performance of the fault-diagnosis model, and simultaneously mitigate overfitting issues in Stacking model fusion, cross-validation is employed during model training. Cross-validation achieves excellent information isolation, thereby improving the recognition capability of the fused model to a certain extent. The specific process of K-fold cross-validation in the Stacking method is as follows:
Step 1: Divide the training set. Randomly partition the complete dataset R into four equal subsets (
Step 2: Successively train all base learners on each training set
Step 3: Concatenate the validation set predictions from all four rounds of base learners into a meta-feature matrix. Train the meta-learner using this matrix to form a two-layer fusion model: ‘base learners + meta-learner’. The final fault-diagnosis fusion model architecture is shown in Figure 3.
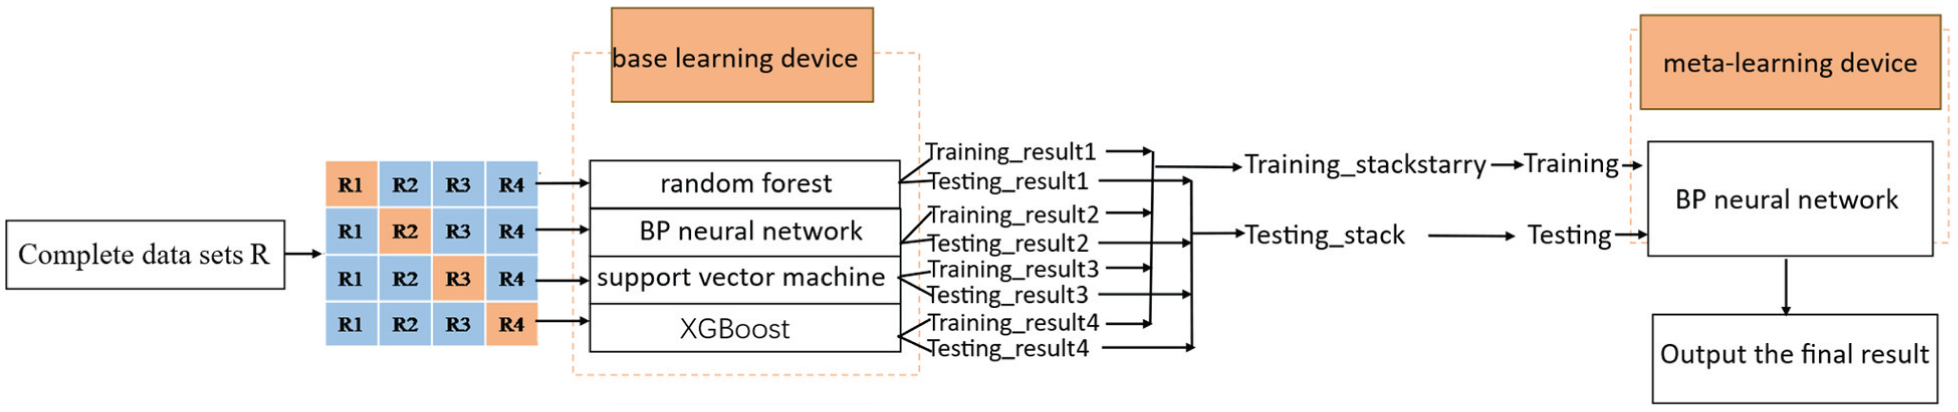
The final fault-diagnosis fusion model architecture.
Figure 3 illustrates the K-fold cross-validation process in the Stacking method, where the dataset is partitioned into multiple subsets. Each iteration employs distinct training and validation sets for training and validation. Through multiple training rounds, the predictions from base learners are aggregated into a meta-feature matrix, serving as input for secondary learning by the meta-learner. This process effectively mitigates overfitting, ultimately forming a fusion model that combines base learners with a meta-learner.
Within the Stacking ensemble framework, incorporating base learners with varying performance levels does not necessarily degrade a model’s performance. On the contrary, appropriate model diversity enables the meta-learner to extract complementary information among different base learners, thereby enhancing the overall recognition capability of the model. Diagnostic performance was evaluated for individual models, conventional voting (Normal-voting), weighted voting (Weighted-voting), and the Stacking-BP approach. Based on model performance, a fusion strategy for complex machinery equipment models was selected. The diagnostic performance comparison between single models and model fusion is shown in Table 1.
The diagnostic performance comparison between single models and model fusion.
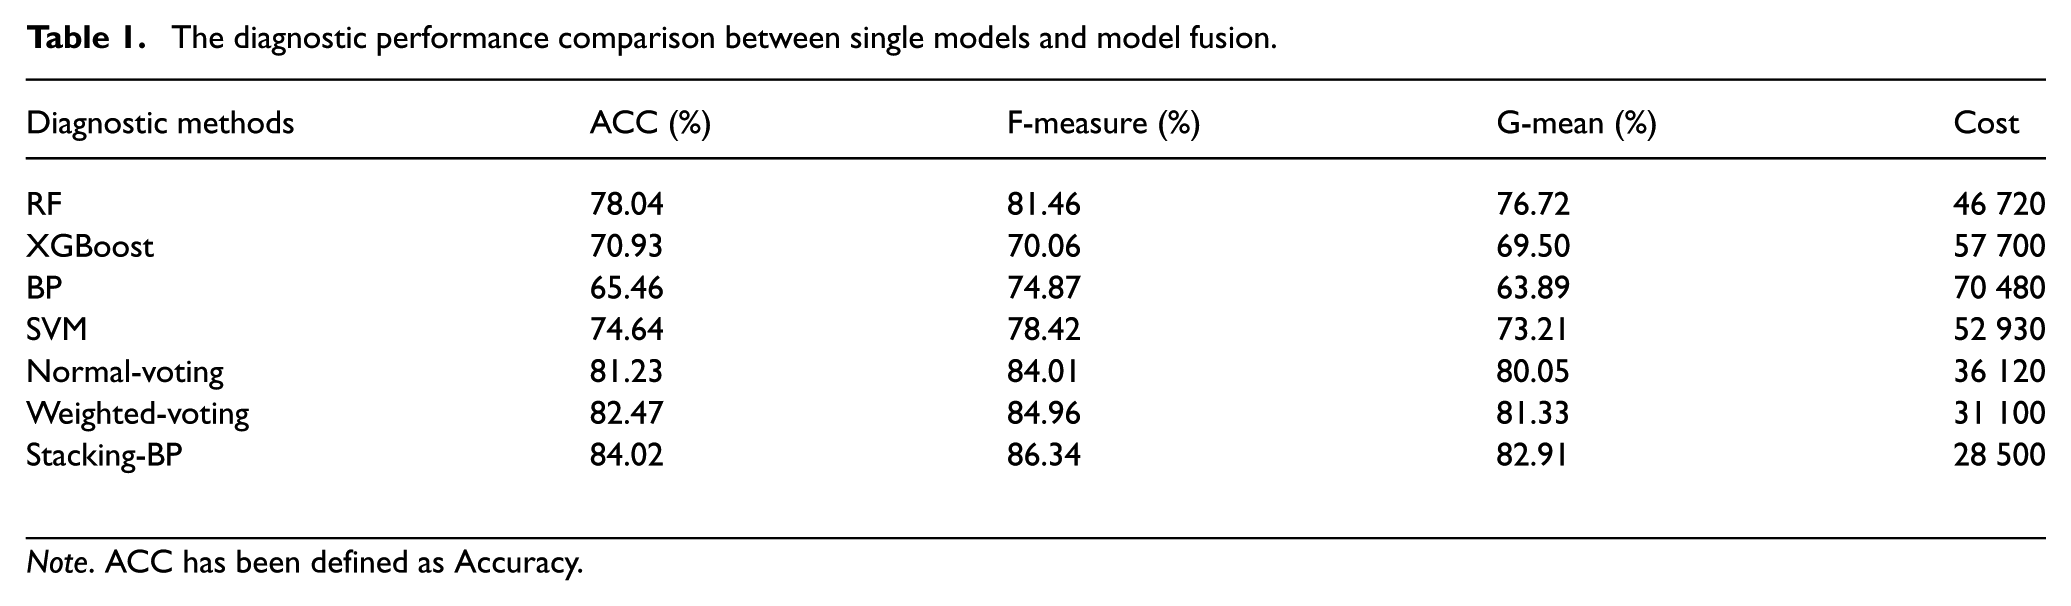
Note. ACC has been defined as Accuracy.
As shown in the table, model ensemble strategies significantly enhance diagnostic performance, particularly the Stacking-BP model, which outperforms single models (such as RF, XGBoost, and SVM) in terms of ACC, F-measure, and G-mean. Furthermore, the Stacking-BP model demonstrates superior diagnostic efficiency, reducing overall resource consumption and computational overhead while maintaining high accuracy compared to other models. Compared to Normal-voting and Weighted-voting fusion methods, Stacking further enhances accuracy while optimizing computational efficiency. These results demonstrate that the Stacking model more effectively integrates the strengths of base learners, improving diagnostic accuracy and computational efficiency, making it more suitable for fault diagnosis in complex mechanical equipment.
Research on integrated learning model fusion-optimization methods
To enhance the performance of the fusion model, this paper employs a sequential, phased modeling strategy to balance diagnostic capabilities and computational efficiency. First, feature selection is carried out by combining maximum MIC with RFECV. This approach reduces feature dimensions and mitigates the impact of redundant information on model complexity. Next, model training and hyperparameter optimization are performed on the base learners, thereby restricting the hyperparameter search to a feature space that has been sufficiently compressed. This workflow effectively reduces training time and computational resource consumption while maintaining the model’s predictive accuracy in industrial fault-diagnosis tasks.
Research on optimal feature subset construction methods
When performing fault diagnosis on complex mechanical equipment, feature selection must strike a balance between computational complexity and robustness while fully considering the physical characteristics of the equipment and the temporal nature of data features. Compared to other common correlation analysis methods, the Maximum Intercorrelation Coefficient (MIC) is an excellent data analysis tool that can simultaneously capture both linear and nonlinear relationships. MIC exhibits strong versatility, being applicable to various data distributions and capable of identifying arbitrary functional relationships (Li et al., 2019).
During feature selection, this paper integrates mechanical dynamic characteristics derived from the lithium battery electrode sheet double-roll calendering equipment into feature engineering, in addition to data-driven features (statistical and temporal features). these characteristics include unwinding tension, calendering pressure, calendering speed, and torque from the tension control system. Unwinding tension influences electrode sheet tension control and reflects the equipment’s operational status; abnormal tension may indicate impending equipment failure. Rolling pressure and rolling speed directly correlate with the equipment’s workload, where excessively high or low pressure and speed could lead to failures. Torque from the tension control system affects stable operation, with abnormal torque potentially causing instability. These mechanical features, collected via sensors, effectively reflect the equipment’s operational state. When combined with data-driven characteristics, they provide a more comprehensive description of the equipment’s working condition and potential failure modes, offering richer feature information for subsequent model training.
To further enhance the accuracy of mutual information (MI) computation, this paper optimizes the Maximum Information Coefficient (MIC) algorithm by incorporating time-dependent weights. This approach addresses the limitation of traditional methods that neglect temporal correlations. Equipment operational data typically exhibits strong time dependency, whereas conventional MIC methods focus solely on static correlations between features, overlooking dynamic characteristics that evolve over time. Therefore, when calculating MI between features and fault labels, this paper introduces time-dependent weights, allowing time-series data to exert a greater influence on feature selection.
By incorporating temporal weights, the enhanced MIC algorithm is better equipped to handle time-varying equipment state information. Specifically, each time step in the sequence is assigned a weight reflecting its importance in feature selection. This refinement improves model accuracy for dynamic fault patterns, particularly by effectively accounting for the impact of temporal evolution during prolonged equipment operation.
The MIC algorithm calculates the correlation between each input feature and the fault label and then ranks the MIC values of all input features to facilitate feature selection in machine learning (Zhang et al., 2021). The MIC value (ranging from 0 to 1) directly reflects the strength of the correlation between a feature and the fault. Based on the principle of MI, it employs a grid-based calculation of joint and marginal probabilities to simultaneously capture both linear and nonlinear correlations. The calculation of MI is highly dependent on sample size. When data is insufficient or incomplete, estimation results may become unstable, compromising the accuracy of feature selection. To address the common issue of missing data in industrial production settings, this paper introduces interpolation techniques prior to feature selection. These techniques impute missing values in the original data, generating continuous data samples to enhance the completeness and effective sample size of the dataset. Interpolation not only mitigates data sparsity caused by missing values but also helps balance the data distribution to some extent, improving the computational accuracy of MI estimation. The interpolated data ensures stability in MI calculations, enhances the robustness of high-dimensional feature analysis, and ultimately increases the reliability of feature-selection outcomes.
MI calculation methods can be categorized as continuous or discrete. In this paper, the fault-diagnosis data for complex mechanical equipment consists of continuous variables. To capture the relationship between these continuous data and fault labels, the continuous MI calculation method is selected, as it is more suitable for this type of data. In industrial scenarios, such as with double-roll press equipment, which involves multiple continuous variables and well-defined fault modes, approximately 100 effective samples are sufficient to support stable MI calculations for feature selection. The determination of the 100-sample threshold was based on an empirical convergence pre-test conducted during the initial data-processing phase. By calculating the MIC values across varying sample sizes, we observed that the feature importance rankings and their corresponding MIC values exhibited significant fluctuations when the sample size was below 60. However, once the sample size exceeded 100, the standard deviation of the MIC values for the top 28 selected features stabilized below a marginal threshold of 0.02. Therefore, considering both the computational efficiency required for industrial deployment and the algorithmic stability, 100 effective samples were determined to be sufficient. For continuous random variables, the MI calculation method incorporating the time dimension is as follows:
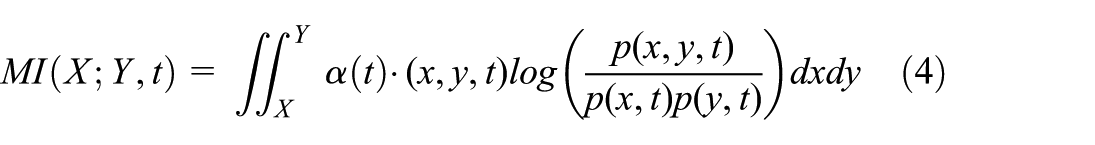
Among these,

T is the current diagnosis time, t is the historical timestamp of the sample, and λ is a predefined decay constant (set to 0.1 in our experiments). This assignment mechanism ensures that more recent operational data exerts a greater influence on the MI calculation, enabling the feature-selection process to more sensitively capture dynamic fault evolution trends.
The MIC algorithm calculates the maximum MI values between features through dynamic grid partitioning and normalization to quantify nonlinear correlations, achieving a balance between computational efficiency and accuracy. The calculation is as follows:
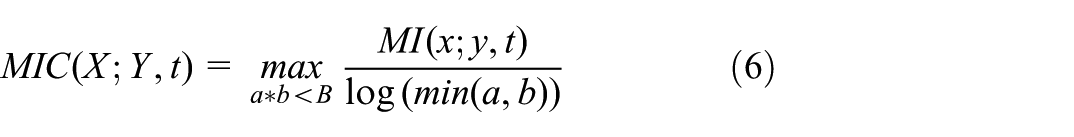
Here,
By analyzing the correlation between fault labels and features in complex machinery, the strength of the association between input features and target variables can be measured. Subsequently, the optimal feature subset is determined—specifically, the number of features required before sorting to achieve the model’s best performance. Recursive Feature Elimination (RFE) progressively selects the optimal feature subset by iteratively building models and removing less-significant features, ultimately yielding a feature importance ranking (Misra and Yadav, 2020). RFECV dynamically determines the optimal number of features by combining cross-validation with RFE: the screening process stops when adding or removing features causes significant changes in model performance, thus avoiding overfitting and improving classification accuracy (Darst et al., 2018; Mustaqim et al., 2021). This method evaluates the performance of each feature subset through n-fold cross-validation during iteration, ultimately retaining the feature combination that yields the best model performance. Its robustness surpasses that of traditional RFE.
As the number of features increases, model performance initially improves rapidly before stabilizing (peaking at 25 features). Beyond 29 features, performance declines slightly, indicating an optimal feature subset size of approximately 25–29 features. For each base learner, the top 28 features selected based on feature subset screening results were chosen as the model’s input feature subset. This approach reduces the number of features while maintaining model performance and achieving optimal results. RFECV recursively constructs models and eliminates less-significant features, simultaneously evaluating model performance through cross-validation. The comparison of model accuracy before and after feature subset construction is shown in Figure 4.
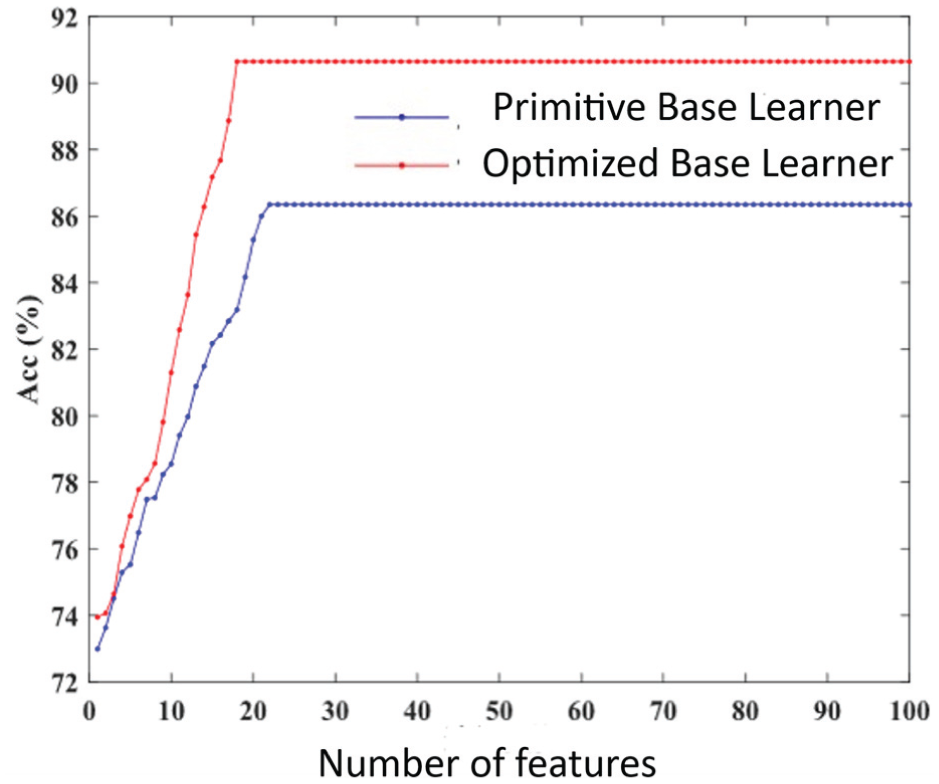
Comparison of model accuracy before and after feature subset construction.
As shown in Figure 4, the optimized feature subset significantly improved model accuracy from the outset compared to the original feature subset, achieving higher accuracy within fewer iterations. This further confirms the importance of the optimized feature subset, as it can substantially enhance the model’s classification accuracy in a shorter timeframe.
Model hyperparameter optimization methods
During machine learning model construction, hyperparameter tuning plays a crucial role in determining model performance. Optimal hyperparameter combinations can fully exploit the model’s expressive capabilities, leading to higher classification accuracy in complex industrial equipment fault-diagnosis tasks (Probst et al., 2019; Sun et al., 2021). Traditional manual parameter tuning heavily relies on experience, resulting in low search efficiency and difficulty in ensuring global optimal solutions. In contrast, automated hyperparameter optimization methods can more efficiently explore the hyperparameter space, even under limited computational resource constraints. Among these, Bayesian optimization constructs a surrogate model to capture the mapping relationship between hyperparameters and model performance. By leveraging historical evaluation results to guide subsequent search processes, it achieves faster convergence and higher search efficiency compared to methods like grid search and random search (Yang et al., 2022).
The core of Bayesian optimization lies in the selection of surrogate models. Common surrogate models include BO-GP based on Gaussian processes, SMAC based on RF, and BO-TPE based on tree-structured Parzen estimation (Yang and Shami, 2020). Different surrogate models exhibit variations in search efficiency, stability, and adaptability to high-dimensional and discontinuous hyperparameter spaces, with their selection directly influencing optimization outcomes (Bischl et al., 2023). Given that this study focuses on fault diagnosis for dual-roll press equipment with a limited sample size and diverse base learners, BO-TPE demonstrates superior robustness and computational efficiency in handling high-dimensional, mixed hyperparameter spaces. Therefore, it was selected for hyperparameter optimization of base learners, including RF, SVM, XGBoost, and BP neural networks.
Building upon traditional Bayesian optimization, this paper constructs a constrained Bayesian hyperparameter optimization framework for industrial fault diagnosis. It adopts diagnostic accuracy as the primary objective while incorporating training efficiency and inference efficiency as constraints. This framework prevents the exploration of hyperparameter combinations with excessive computational overhead that are impractical for deployment, achieving an effective balance between performance and efficiency. Specifically, the hyperparameter optimization objective function is defined as:
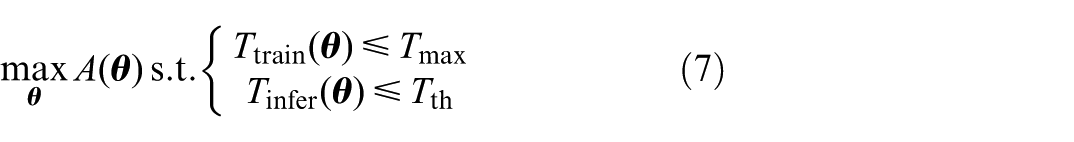
Here, θ denotes the model hyperparameter vector, and
This ensures the model maintains high diagnostic accuracy while offering strong engineering practicality and deployment feasibility. Within the BO-TPE framework, the proxy model probabilistically models historical evaluation results to partition the hyperparameter space into high-performance and low-performance regions, thereby guiding the search process toward areas with potential optimal solutions. Its probabilistic modeling form can be expressed as:
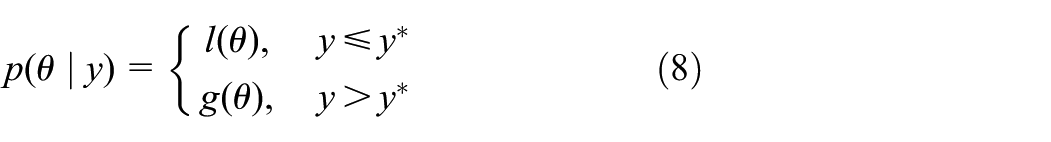
Here, y denotes the objective function value (i.e. classification accuracy), while
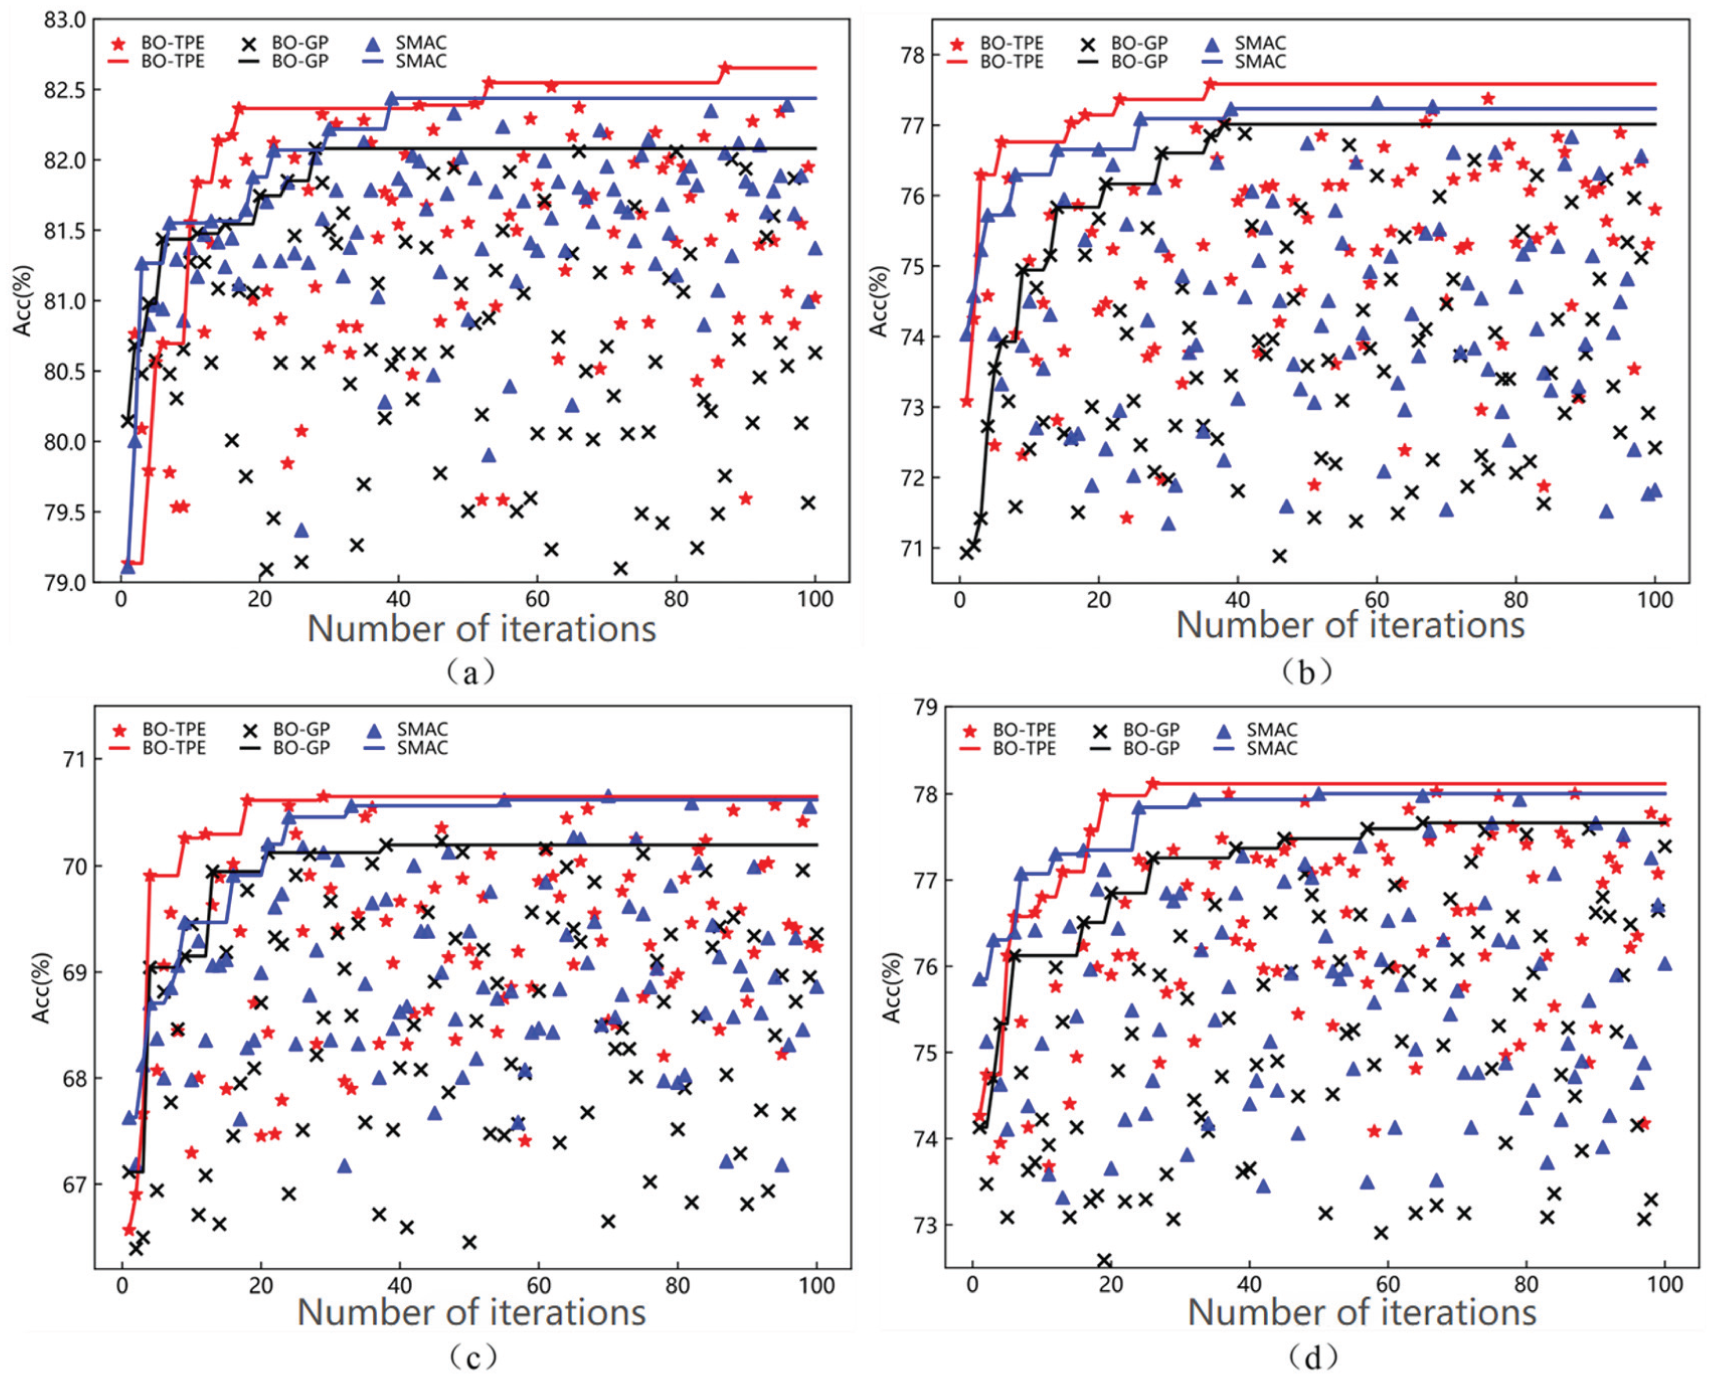
Evolution of classification accuracy for each model after hyperparameter optimization: (a) RF, (b) XGBoost, (c) BP, (d) SVM.
Results indicate that BO-TPE can guide the search process toward high-performance hyperparameter regions more quickly than BO-GP and SMAC. Its historical best classification accuracy improves at a faster rate with increasing iterations, and its convergence process is more stable. This demonstrates that BO-TPE offers higher hyperparameter search efficiency and superior convergence properties, even under limited search budgets.
Production data completion and experimental results
High-quality data serves as the foundation for constructing reliable fault-diagnosis models. In industrial production environments, data gaps are common during data collection. Missing critical variables can introduce bias, degrading data quality and causing model outputs to shift or even become distorted. This ultimately undermines the reliability and accuracy of fault-diagnosis models. Some models struggle to operate effectively with missing data, occasionally failing to complete training altogether. Therefore, it is crucial to properly handle missing data in the raw dataset before model construction. The experimental data originates from the dual-roll pressing workshop for lithium battery electrode sheets, collected based on the operational status of the dual-roll pressing equipment during actual production. The equipment structure and production process are illustrated in Figure 6. Building upon this foundation, this paper further performs preprocessing operations on the collected raw production data, including data interpolation and feature scaling, to provide a reliable data foundation for subsequent fault-diagnosis model operations.
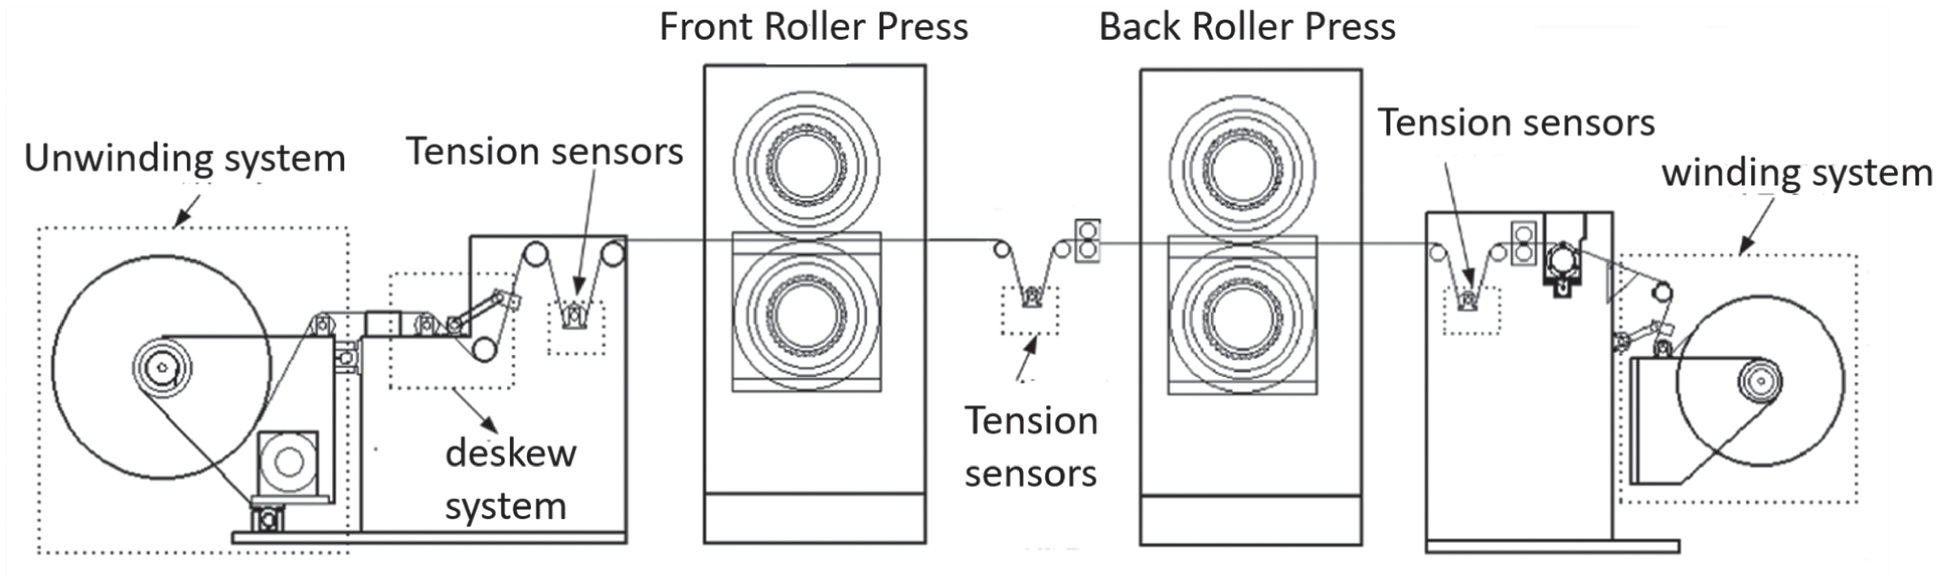
Lithium battery pole piece double-rolling equipment.
The figure illustrates the overall structure and production process flow diagram of the dual-roll pressing equipment. The equipment mainly consists of an unwinding system, a web guiding system, a front roll pressing section, a rear roll pressing section, and a rewinding system. After unwinding, the electrode sheet sequentially undergoes tension control, web guiding adjustment, and both front and rear roll pressing processes before being rewound. During production, tension sensors, speed sensors, pressure sensors, and position-detection devices are placed at key process nodes to collect real-time equipment-operating status and process parameters. Based on this production flow, this paper measures and collects production data during the operation of the dual-roll press equipment. Each raw data point obtained in the experiment contains multiple continuous numerical detection variables, encompassing information such as the operating conditions and environmental characteristics of the dual-roll press equipment. The selected raw production data from the dual-roll press equipment is presented in Table 2.
The selected raw production data from the dual-roll press equipment.
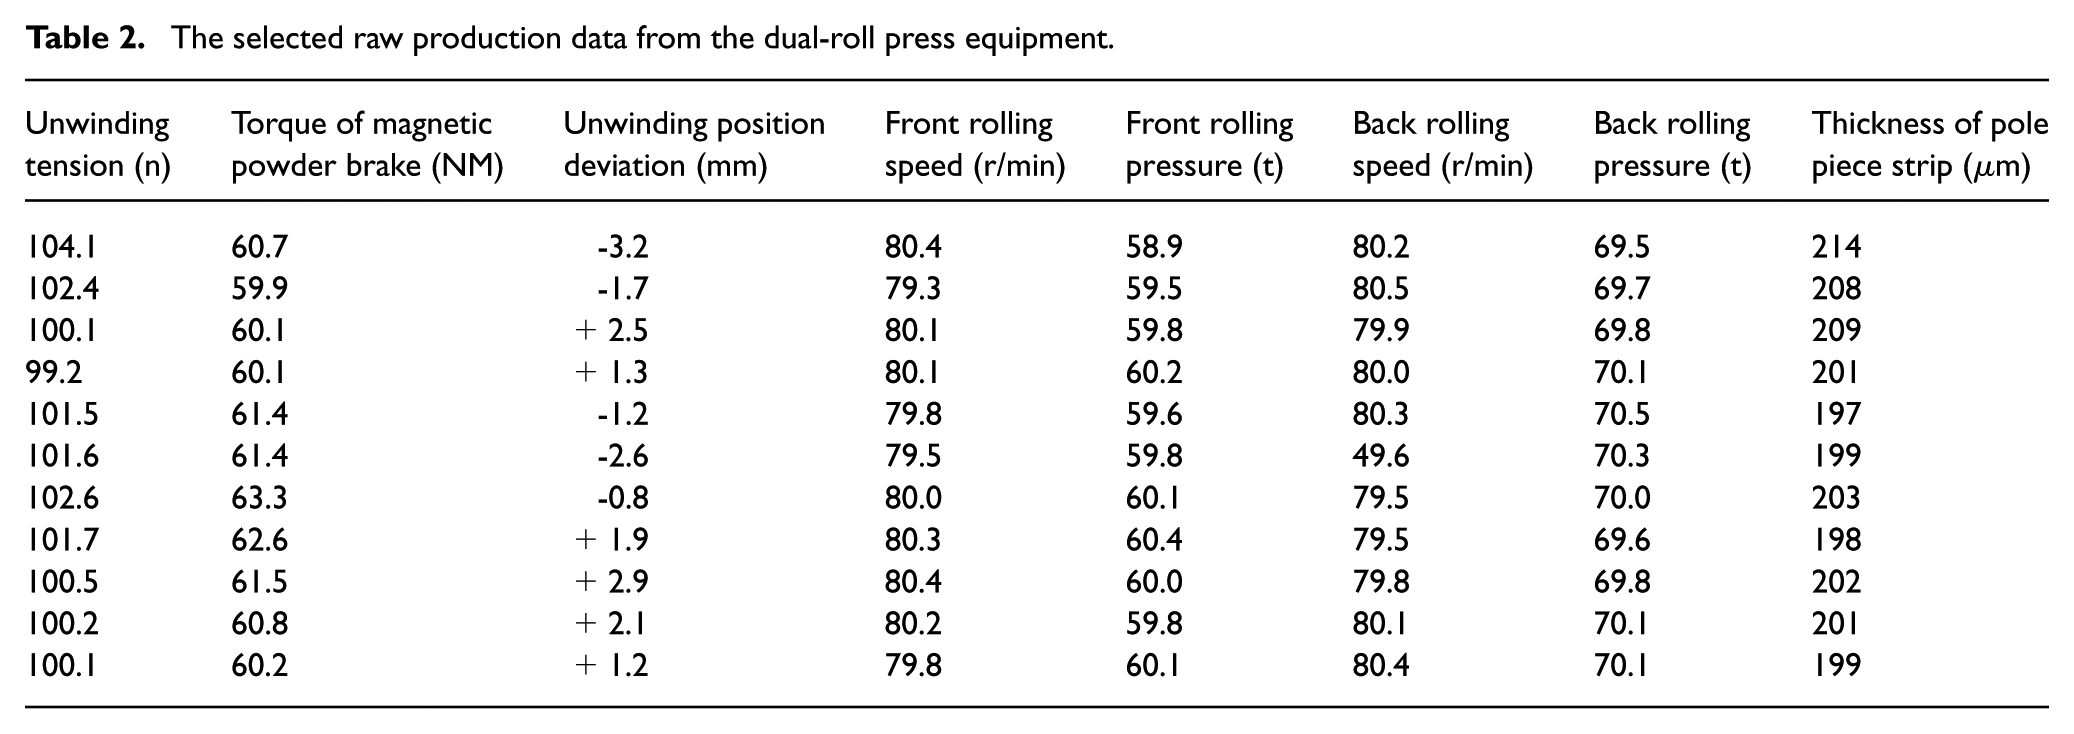
Table 2 presents a subset of raw production data from the dual-roll press equipment. This data includes multiple continuous numerical detection variables, covering both operational and environmental characteristics of the equipment. The data items include unwinding tension, magnetic powder brake torque, unwinding position deviation, front and rear roll pressure speeds, front and rear roll pressure values, and electrode strip thickness. Collectively, these variables reflect the equipment’s performance and operational status during operation, playing a crucial role in fault diagnosis and performance prediction. Analyzing this data allows for effective identification of the equipment’s working condition and potential faults, providing a reliable foundation for subsequent model training and optimization.
Building upon the performance validation of fault type identification for the dual-roll press equipment, this study introduces fault severity grading analysis during the experimental phase to extend the validation of model outputs and further assess the proposed model’s application potential in predictive maintenance scenarios. Unlike approaches focused solely on fault category classification, fault severity grading offers a more granular characterization of the deviation between equipment operating conditions and normal operation, providing more engineering-relevant criteria for maintenance decisions.
Based on the mechanical dynamics features and data-driven features mentioned earlier, and on the foundation of fault accuracy recognition, this study selects key operational parameters after MI feature selection. A deviation index referenced against normal operating conditions is constructed to quantify the abnormality level of fault states. For the kth key feature, its normalized deviation at time t is defined as:
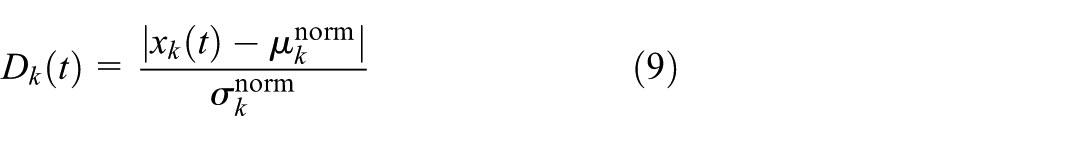
Here,
Considering that industrial equipment failures typically exhibit persistent characteristics, a single-point deviation may not fully reflect the evolution of a fault. Therefore, this paper further accumulates the normalized deviation within a time window
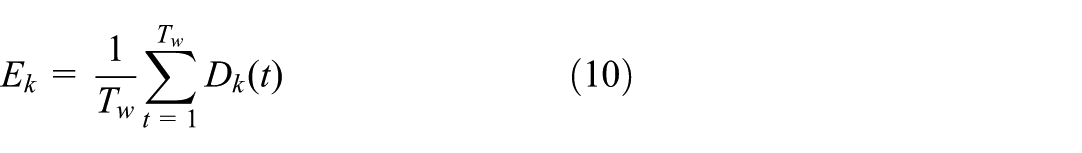
Based on this foundation, a comprehensive deviation index for fault severity is constructed by integrating multidimensional key features:
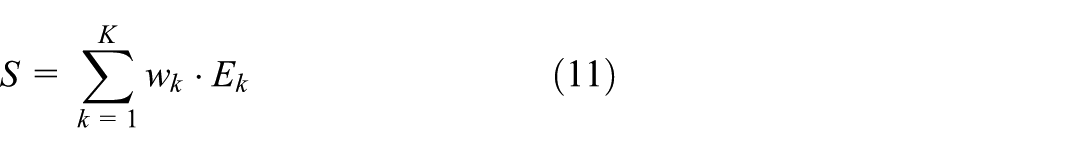
Here, K denotes the number of key features involved in the calculation, and
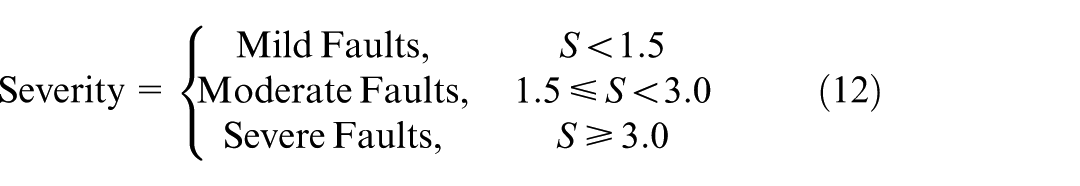
Mild faults correspond to minor deviations in key parameters from normal operating conditions, allowing the system to maintain stable operation. Moderate faults manifest as significantly increased parameter deviations, accompanied by persistent abnormal trends. Severe faults correspond to substantial abnormal deviations across multiple dimensions, indicating a marked increase in equipment operational risk.
Missing data imputation
Missing data in industrial field environments can severely compromise the reliability of diagnostic models. Traditional deletion-based methods inevitably lead to information loss, whereas imputation-based techniques enable more effective utilization of incomplete samples that still contain critical fault-related features (Abro et al., 2023; Deng et al., 2019). Therefore, selecting an appropriate processing strategy according to the underlying missing-data mechanism is essential to maximize the retention of valid information while maintaining overall data quality. In general, missing data imputation methods can be categorized into two main approaches: (1) traditional statistical techniques based on summary statistics such as the mean, median, or mode, and (2) advanced imputation strategies, including multiple imputation (MI) (Xiong et al., 2021).
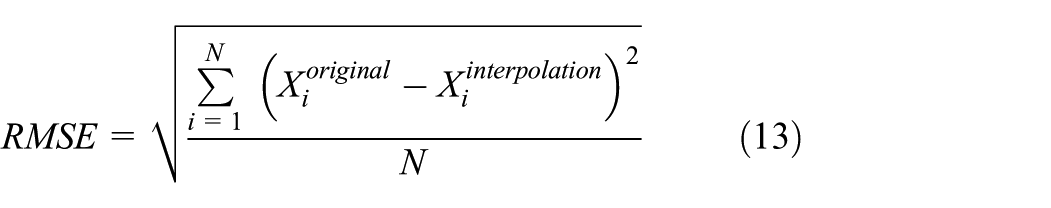
To evaluate the adaptability of different interpolation methods under varying degrees of data incompleteness, the dataset was artificially configured with missing rates of 5%, 15%, 25%, and 35%. Subsequently, several interpolation techniques were applied to reconstruct the missing values in the original dataset of complex mechanical equipment, including Average Interpolation, Median Interpolation, MI Interpolation, NB Interpolation, KNN Interpolation, and K-means Interpolation. The root mean square error (RMSE) between the interpolated dataset and the original complete dataset was adopted as the evaluation metric, with its calculation formula given in equation (13). A lower RMSE value indicates a smaller deviation between the reconstructed values and the true data, thereby reflecting superior interpolation performance.
Among these,
RMSE performance of different interpolation methods under different data-missing degrees.
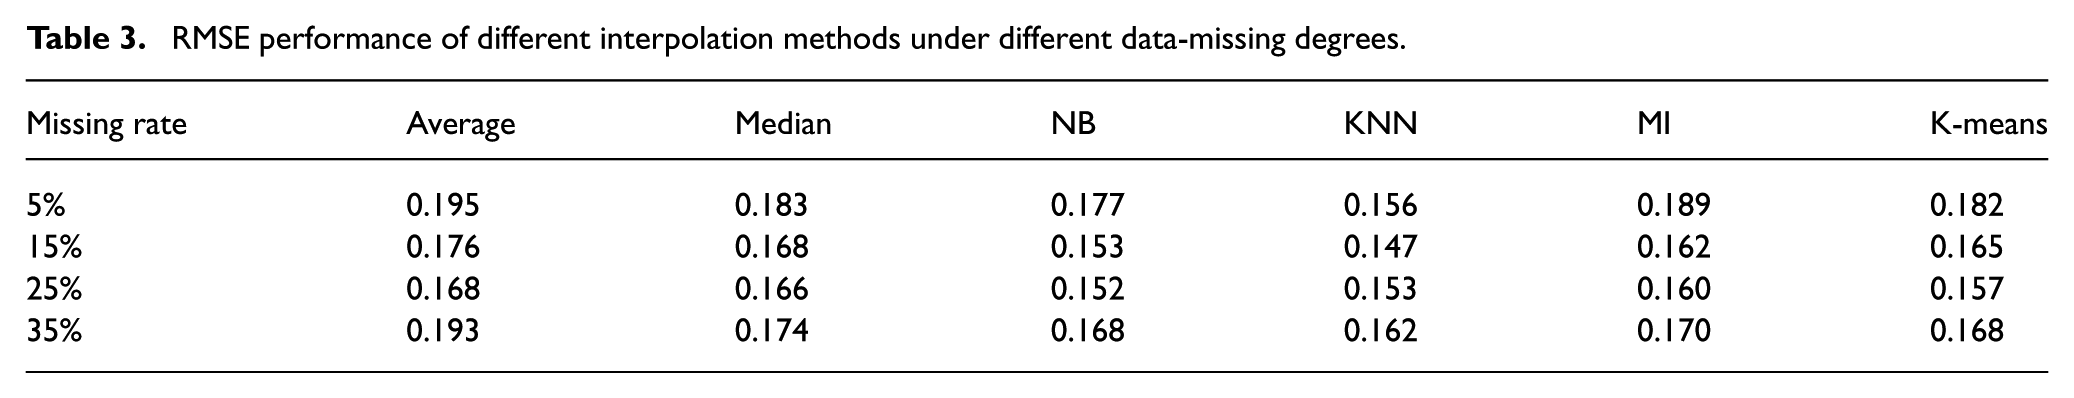
Table 3 presents the RMSE performance of various interpolation methods applied to the dual-roll press equipment dataset under different missing data rates. The results reveal significant performance variations among the interpolation methods as the missing data rate increases. In general, machine learning–based interpolation methods outperform traditional statistical methods, showing lower error levels and superior interpolation accuracy and stability. Among these methods, the KNN interpolation technique consistently achieves the best RMSE performance across different missingness rates. This demonstrates its ability to effectively leverage the similarity relationships among samples to accurately estimate missing data in complex, multivariate industrial data scenarios. As a result, the KNN interpolation method shows greater applicability for handling missing values in the dual-roll press equipment production data.
Feature scaling
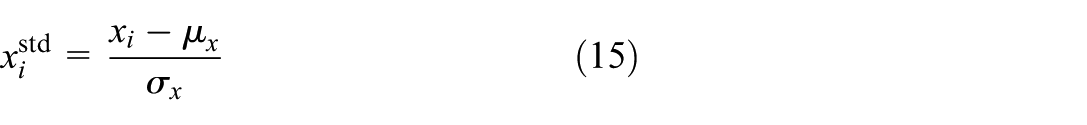
After completing the missing data imputation process, data integrity is ensured; however, the production data from the dual-roll press equipment comes from diverse sources. Different features exhibit significant variations in physical meaning, dimensional ranges, and numerical scales. If directly used for model training, this disparity may cause certain features to dominate the learning process, affecting the model’s convergence speed and diagnostic performance. Therefore, feature scaling is required on the interpolated data to unify the numerical scales of different features and enhance model training stability. Feature scaling achieves this by normalizing the data to the [0,1] range or applying standardization, thereby aligning the numerical scales of features with different dimensions. This accelerates model convergence and improves the fairness of performance weight allocation. The calculation process for normalizing a feature column is expressed as:

In the formula,
Here,
Through normalization and standardization, the scale and distribution of the interpolated production data are uniformly processed. This reduces numerical discrepancies between features, enhancing their comparability during model training and facilitating the model’s effective learning of key information. Based on this data preprocessing workflow, a solid data foundation is established for the subsequent experimental processing and result analysis of the fault-diagnosis model.
Experimental results
This experiment employed a Stacking ensemble model utilizing RF, SVM, XGBoost, and BP neural networks as base learners, with the BP neural network serving as the meta-learner. The model demonstrated outstanding performance in the fault-diagnosis task for the dual-roll press equipment. RF excels at handling high-dimensional data and large sample sizes, SVM performs well with nonlinear data and limited samples, XGBoost shows strong capabilities with complex data, and the BP neural network enhances the ensemble model’s performance through its robust nonlinear modeling ability. Each of these four base learners brings distinct advantages in pattern recognition, complementing each other to improve the model’s accuracy and stability.
Fault-diagnosis testing was conducted on 120 sets of dual-roll press equipment. These 120 test cases included normal operating conditions and 11 distinct fault types, specifically: Unwind tension sensor failure; Unwind edge trimming motor overload failure; Unwind web guide motor lubrication deficiency failure; Front roll press main motor inverter undervoltage failure; Front roll press pneumatic-hydraulic booster pump cylinder stalling failure; roll press section tension sensor offset failure, rear roll press main motor overload failure, rear roll press solenoid valve coil damage failure, rear roll press pressure sensor element damage failure, rewind guide motor voltage deficiency failure, and rewind thickness sensor offset failure. Each fault type underwent 10 diagnostic test sets. In this experimental setup, each sample represents not a single value but a multidimensional continuous feature vector collected from multiple sensors. This comprehensively characterizes the operational behavior of the dual-roll press under specific operating conditions and fault states. For each fault type, multiple sample datasets were collected across varying time periods and production conditions to ensure sample independence and representativeness. Consequently, despite the limited number of samples per fault category, each sample contains rich operational information, effectively supporting MI-based feature selection and model-training processes.
Based on the developed fault severity assessment method, this paper performed a graded analysis of different fault samples. Simultaneously, by integrating three major modules—fault location, fault cause, and resolution strategy—a corresponding system interface was created. This interface uses traffic-light indicators to visually represent the operational status of each subsystem. The fault mode classification results and severity-assessment interface are shown in Figure 7.
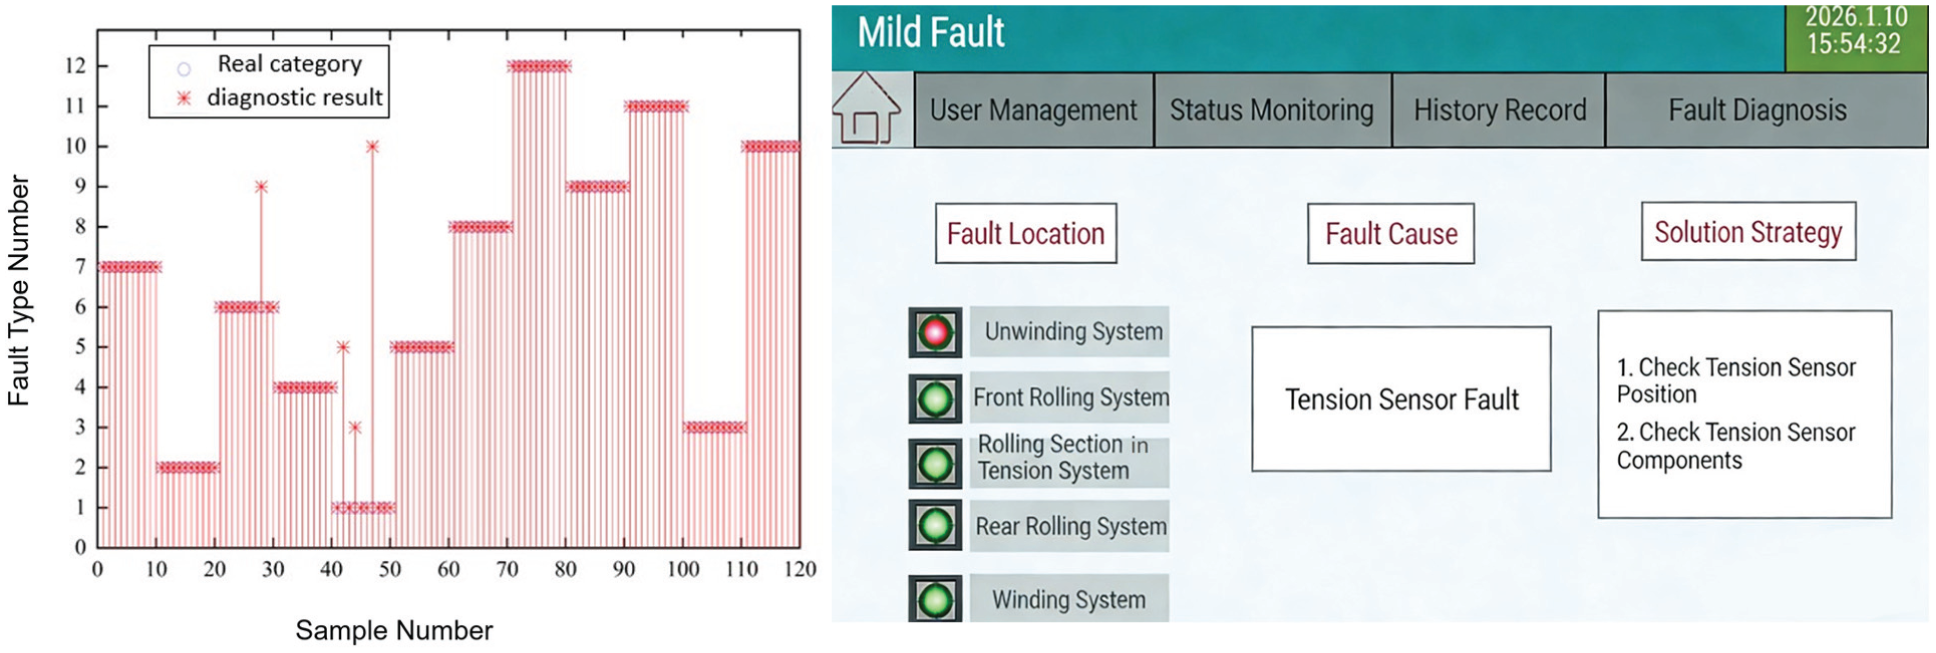
The fault mode classification results and severity-assessment interface.
Figure 7 illustrates the practical deployment interface and the comprehensive diagnostic results. The scatter plot (left) details the classification performance across 120 test samples, which are strictly grouped into 12 distinct clusters (1 normal state and 11 fault modes, with 10 samples per cluster). The high overlap between the ‘Real category’(circles) and the ‘Diagnostic result’(asterisks) visually confirms the model’s precision. Furthermore, the diagnostic interface (right) translates these mathematical classification results into actionable engineering directives. By integrating the severity assessment logic outlined in equation (12), the system employs a traffic-light visual indicator for each mechanical subsystem. When a specific fault is identified, the interface not only highlights the precise location in red but dynamically outputs the exact ‘Fault Cause’ and step-by-step ‘Solution Strategies’ pulled from the expert knowledge base. This visualization bridges the gap between algorithmic outputs and on-site maintenance execution.
Overall, the model achieves a diagnostic accuracy of 96.67%. To further validate the effectiveness of the proposed complete framework, it is crucial to benchmark this 96.67% accuracy against previous traditional methods. As evaluated earlier in Table 1 of the Research on Stacking ensemble learning methods section, the accuracies of unoptimized traditional methods (such as Normal-voting and the base BP neural network) were only 81.23% and 65.46%, respectively. Although the basic Stacking architecture improved the baseline to 84.02%, it is the integration of MIC-based dynamic feature selection and BO-TPE hyperparameter tuning within our complete pipeline that ultimately enabled the final accuracy to reach 96.67%.
This result showcases the system's robust recognition capability in fault-diagnosis tasks and its ability to accurately differentiate between various fault types. The diagnostic results for the vast majority of samples align closely with their true categories, with only a small number exhibiting minor deviations. These results validate the effectiveness and stability of the proposed method in diagnosing faults in complex mechanical equipment, meeting the practical application requirements for accuracy and reliability in intelligent fault diagnosis.
Conclusions
This paper addresses intelligent fault diagnosis for complex mechanical equipment. By appropriately processing industrial production data, it enhances the reliability of feature evaluation and model training. Building on this foundation, a fault-diagnosis model based on Stacking was designed. In feature engineering, the model integrates equipment operational mechanism features with data-driven features. In addition, by introducing time-correlated weights, it strengthens the correlation modeling between features and faults, effectively leveraging the complementary advantages of multiple learners during training. Validation using actual production data from the lithium battery electrode sheet double-roll pressing equipment demonstrates that the proposed method achieves high diagnostic accuracy in multi-fault-type identification tasks. It can also classify fault severity levels, providing more engineering-relevant decision support for predictive maintenance. Although the proposed method demonstrates strong performance in experimental scenarios, its validation remains limited to a single equipment type due to experimental constraints and data availability. Its transferability across different equipment or operating conditions has not been systematically evaluated. Future research will focus on multi-device transfer diagnostics, few-shot fault recognition, and lightweight model deployment. Future research will further incorporate domain adaptation and transfer learning techniques to enhance the model's generalization capabilities and engineering practicality in complex industrial environments.
Footnotes
Author contributions
All authors contributed to the study conception and design. All authors commented on previous versions of the manuscript. All authors read and approved the final manuscript.
Funding
The authors received no financial support for the research, authorship, and/or publication of this article.
Declaration of conflicting interests
The authors declared no potential conflicts of interest with respect to the research, authorship, and/or publication of this article.
Data availability statement
The datasets generated during the current study are available from the corresponding author on reasonable request.