
Abstract
Typical weather data (TWD) consists of 8760 values of various selected meteorological parameters such as ambient temperature, solar radiation, relative humidity and wind velocity, and are originally derived from long-term data. In this paper, TWDs have been generated, using three different methodologies, from hourly meteorological data measured in Seoul, Daejeon, Daegu, Gwangju, and Busan. The aims of this study were to compare the simulation results from the three methodologies (ISO Test Reference Year, CIBSE Test Reference Year, and Typical Meteorological Year) with those from individual years and their long-term means to assess the important five components of the building envelope (wall-to-window ratio, window overhang, window transmissivity, window U-value, and wall U-value) for the influence on the heating and cooling load and to study the influence of the different weather parameters (temperature and solar radiation). Results of the comparison show that predicted monthly load and energy consumption profiles from the TWD tended to follow the long-term mean quite closely. The load calculations vary almost linearly as the building envelope components varied apart from the window U-value. The yearly average values of mean bias error and root mean squared error for the heating and cooling loads were evaluated for the three TWDs and long-term measured meteorological data.
Keywords
Introduction
Computer simulation of buildings and solar energy systems is being used increasingly in energy assessments and design. Simulation often requires hourly weather data. “Typical weather data” (TWD) consists of 8760 values of various selected meteorological parameters such as ambient temperature, solar radiation, relative humidity, and wind velocity that are originally derived from long-term data. Several methods for generating typical data have been developed. The TWD methods were developed to generate statistically significant years for dynamic thermal energy analysis by computer simulation. These methods included the CIBSE Test Reference Year (CIBSE TRY), the Typical Meteorological Year (TMY) used in the USA, and the ISO 15927-4 1 TRY (ISO TRY). They are also essential for the numerical analysis of sustainable and renewable energy systems. They differ in some details, but are all based on constructing a year from 12 individually selected months of real weather data concatenated to make a complete year. In this paper the selection was made from 20 years (1986–2005) of daily average weather data for Seoul, Daejeon, Daegu, Gwangju, and Busan in South Korea.
Many authors showed the alterative design possibilities using the TWD. Lam 2 investigated the likely diversity in computer predictions based on different weather years in Hong Kong. Gugliernetti et al. 3 investigated the influence of the stochastic component of meteorological data in evaluation office building energy performance in Mediterranean climate. Westphal and Lamberts 4 estimated annual energy consumption of non-residential buildings based on simplified weather data in 206 Brazilian locations. Enshen 5 compared the annual heating and cooling energy consumptions on the same building under 43 different climate conditions. Kolokotroni et al. 6 had been used the measured air temperature data to assess the heating and cooling load of a typical air-conditioned office building positioned at 24 different locations within the London. Mui and Wong 7 investigated the development of a new example weather year and a mathematical model to generate design occupant load profiles using Monte Carlo simulation for a subtropical climate. Karlsson et al. 8 discussed the relative importance to the annual energy demand of different energy aspects of a Swedish low-energy house. Yong et al. 9 compared the energy simulation results using multi-years and typical meteorological years in different climates of China. Jentsch et al. 10 had suggested the generation and assessment of building simulation weather files for the potential impacts of a changing climate. Radhi 11 evaluated the climate variation impact on the performance of weather data from different weather periods in Bahrain. Kershaw et al. 12 compared simulations run using the reference years and the results obtained from simulation using the base data sets from multi-year. Chow and Levermore 13 provided a comprehensive study and understanding to how various different office buildings in the UK will cope with climate change as well as the associated CO2 emissions as a result of meeting the thermal demands.
The simulation runs were performed and building heating and cooling loads were analyzed in the five major cities using TWD (ISO TRY, CIBSE TRY, and TMY) to compare the results with those predicted with individual years within the multi-year datasets from which the TWD were developed. In the study the objectives of this paper were:
(1) To compare the impact on simulation prediction of three alternative methods for the production of TWDs from long-term measurements. (2) To predict the annual cooling and heating load for office buildings based on the components of building envelope (wall-to-window ratio, window overhang, window transmissivity, window U-value, and wall U-value). (3) To study the influence of the weather parameters (temperature and solar radiation) in the assessment of office building energy performance in the South Korea.
Data and TWD methods
Hourly weather data for energy simulation
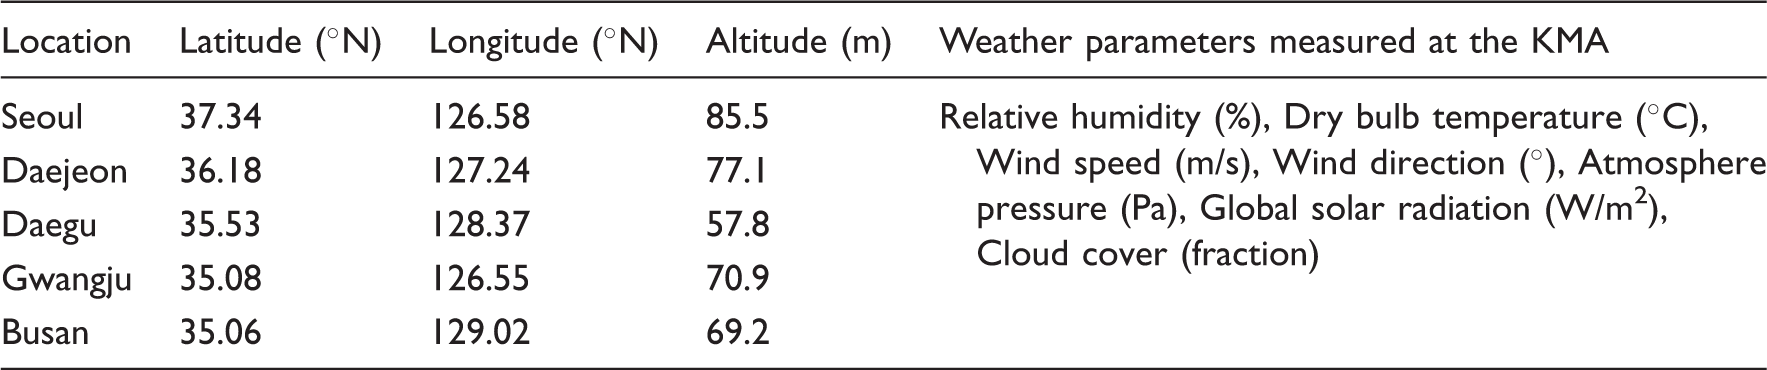
The data for this study come from the five major cities in South Korea and cover 20 years (1986–2005). All meteorological and solar radiation data that are used in the study were measured by the Korea Meteorological Administration (KMA). Figure 1 and Table 1 shows key measured weather parameters and the geographical characteristics of the stations, such as latitude, longitude, and altitude above sea level. Each weather year has 8760 records of hourly data of dry bulb temperature (DBT), wet bulb temperature (WBT), global solar radiation, wind speed, atmospheric pressure, cloud cover, and wind direction. WBT data were determined from the corresponding DBT and relative humidity (RH) data measured at the respective stations. Months with missing data were rare. Specifically, the missing data as a percentage of the entire 20-year period for each parameter was 0.6% for global radiation, 0.1% for temperature and relative humidity, while there were no missing values for wind speed and wind direction. Missing values were filled by linear interpolation or by estimates. Sudden, unnatural jumps or singular solar radiation values were examined and corrected using the cloud cover and the corresponding extra-terrestrial solar component. If the raw data were available only as 3-hourly data, then the missing values were calculated by linear interpolation.
Location of weather files locations in South Korea. Geographical data and weather parameters for locations considered in this study.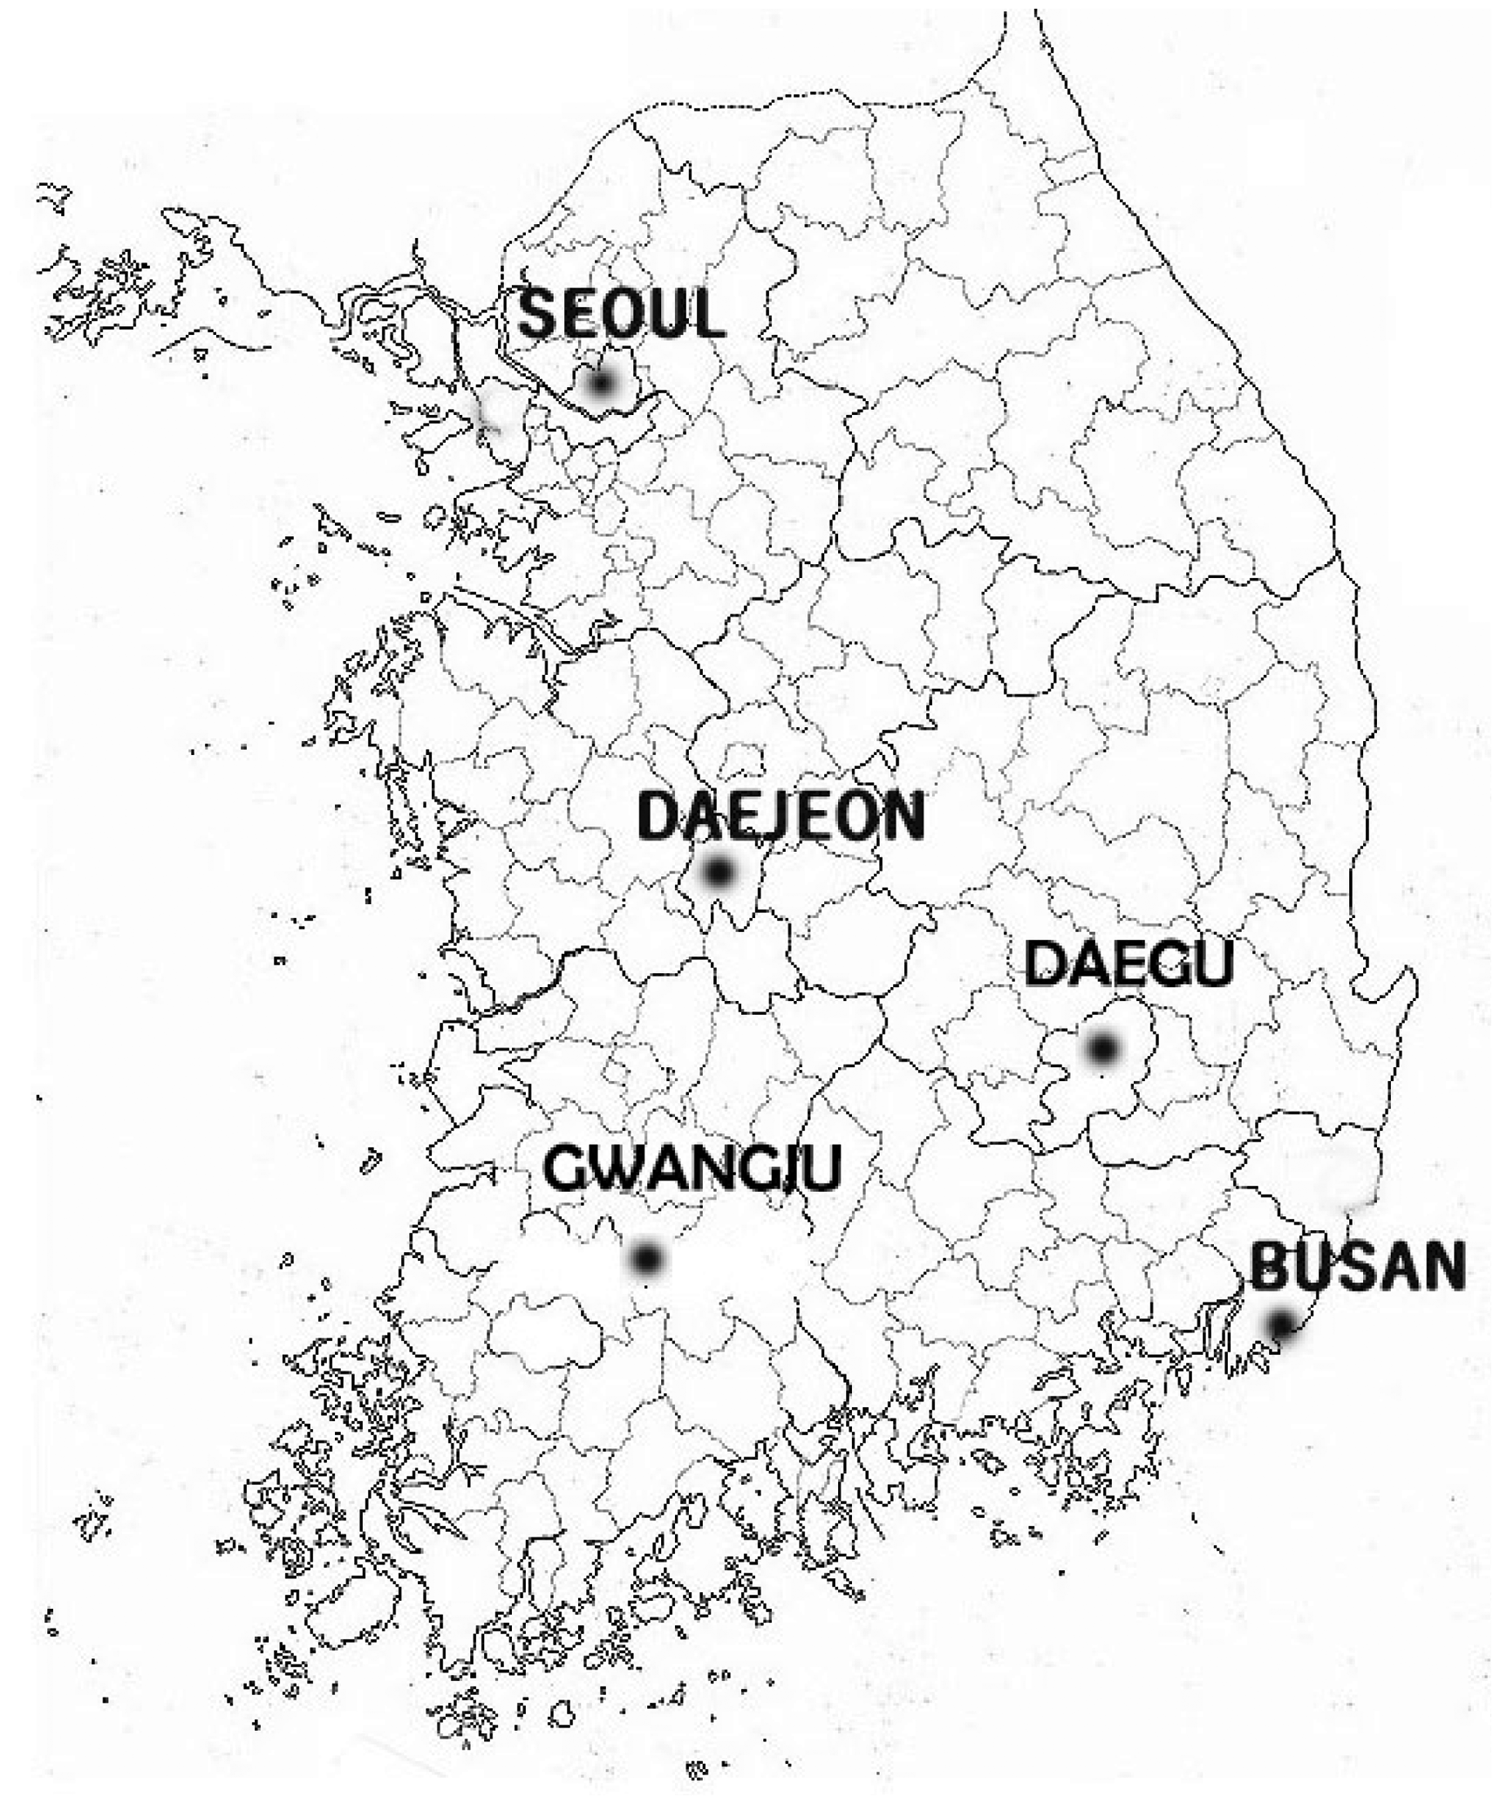
Diffuse-to-global solar irradiation correlation
The total solar irradiations on horizontal surfaces are separated into the beam and diffuse components. Although horizontal global irradiance is a commonly measured parameter for many sites, horizontal diffuse irradiance is not so readily obtainable. For such sites that measure global irradiation alone a simple but reasonably accurate method is required to estimate diffuse irradiance from its global counterpart. This study investigates the applicability of various standard models correlating hourly diffuse fraction k and hourly clearness index k t in the South Korea. Orgill and Hollands 14 were the first to develop an equation to determine the hourly ratio of diffuse-to-total irradiation received in a horizontal surface. Erbs et al. 15 derived the correlation between the hourly diffuse fraction and the hourly clearness day from four US locations. Reindl et al. 16 estimated the diffuse fraction using two different models developer with measurements of global and diffuse irradiation on a horizontal surface from five European and North American locations. In the absence of a site-specific diffuse estimation algorithm, CIBSE Guide J 17 proposed equations to estimate the horizontal hourly diffuse irradiation from the observed hourly global horizontal irradiation. Lee et al. 18 estimated the hourly solar irradiation on inclined surfaces in South Korea.
Statistical result of diffuse-to-global solar radiation correlation for the different models with Daejeon measured data (2010).
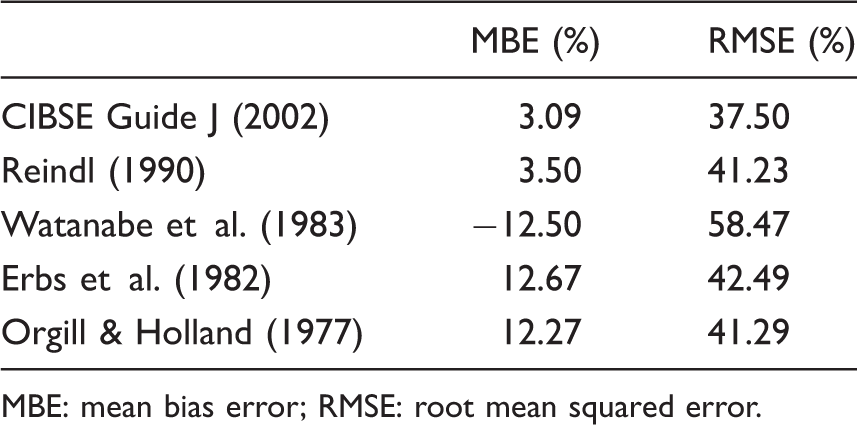
MBE: mean bias error; RMSE: root mean squared error.
Weather data selection using the Finkelstein–Schafer statistic
TWD consist of individual months of meteorological data sets selected from different years over the available data period, which is called a long-term measured data series. These are synthetic years based on the most average months taken from a 20-year period. The most average months are commonly selected using the Finkelstein–Schafer statistic (FS) by Finkelstein and Schafer.
19
FS statistics are the most common methodology for generating typical weather data. This method is an empirical methodology for selecting individual months from different years over the available period. According to FS statistics, if a number of observations, n, of a variable x are available and have been sorted into an increasing order x1, x2, … , x
n
. The FS comparison statistics (between the long-term CDF for each month and the CDF for each individual year of the month) are calculated according to
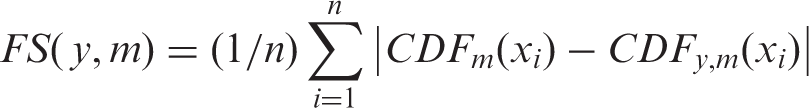

In CIBSE TRY method, the best month is the lowest total FS by the standard deviation. For TMY method, the best month is the lowest total FS by the weights. In ISO TRY method, for each calendar month and each year, add the separate ranks for the three climate parameters. For each calendar month, for the three months with the lowest total ranking, calculate the deviation of the monthly mean wind speed from the corresponding multi-year calendar-month mean. The month with the lower deviation in wind speed is selected as the “best” month to be included in the reference year.
Generic office building
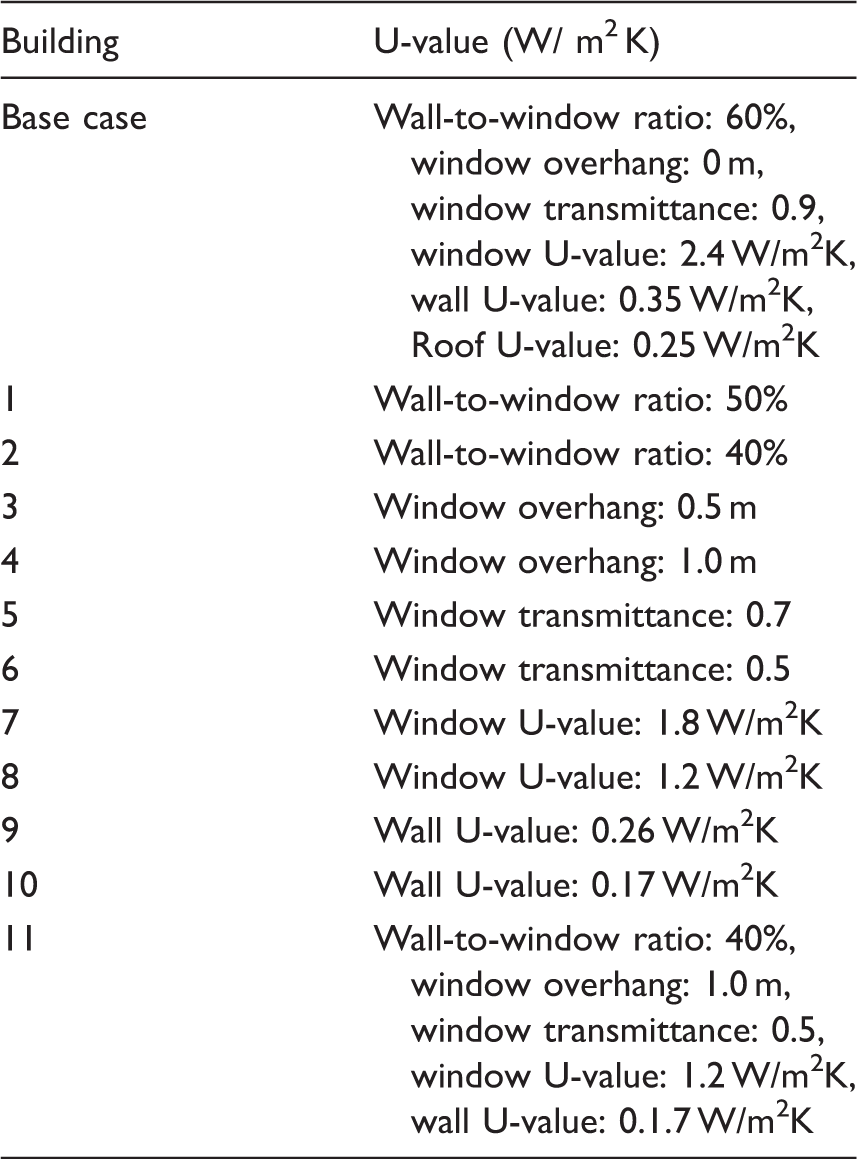
A base case office building was developed to serve as a baseline reference for the comparative energy studies. The base case was a 25 m × 25 m, 10-story building with curtain wall design, 3.4 m floor-to-floor height and 60% window for all four walls (Figure 2). The walls had a U-value of 0.35 W/m2K and the windows a U-value of 2.4 W/m2K1. The air-conditioned and non-air-conditioned floor areas were 5440 m2 and 810 m2, respectively. The air-conditioned space had four zones at the perimeter. Table 3 shows a summary of the key building envelope design parameters. The design standard covers all the cities. Since this study is about comparison of the relative energy performance using different weather years. ApacheSIM for the model system calculates hourly heating and cooling energy requirement over a period of 1 year. The heating setpoint and the cooling setpoint are 19℃ and 23℃, respectively. The humidity control is from 0% to 70%.
Generic office building. Summary of building envelope parameters. All buildings were considered for Seoul, Daejeon, Daegu, Gwangju, and Busan.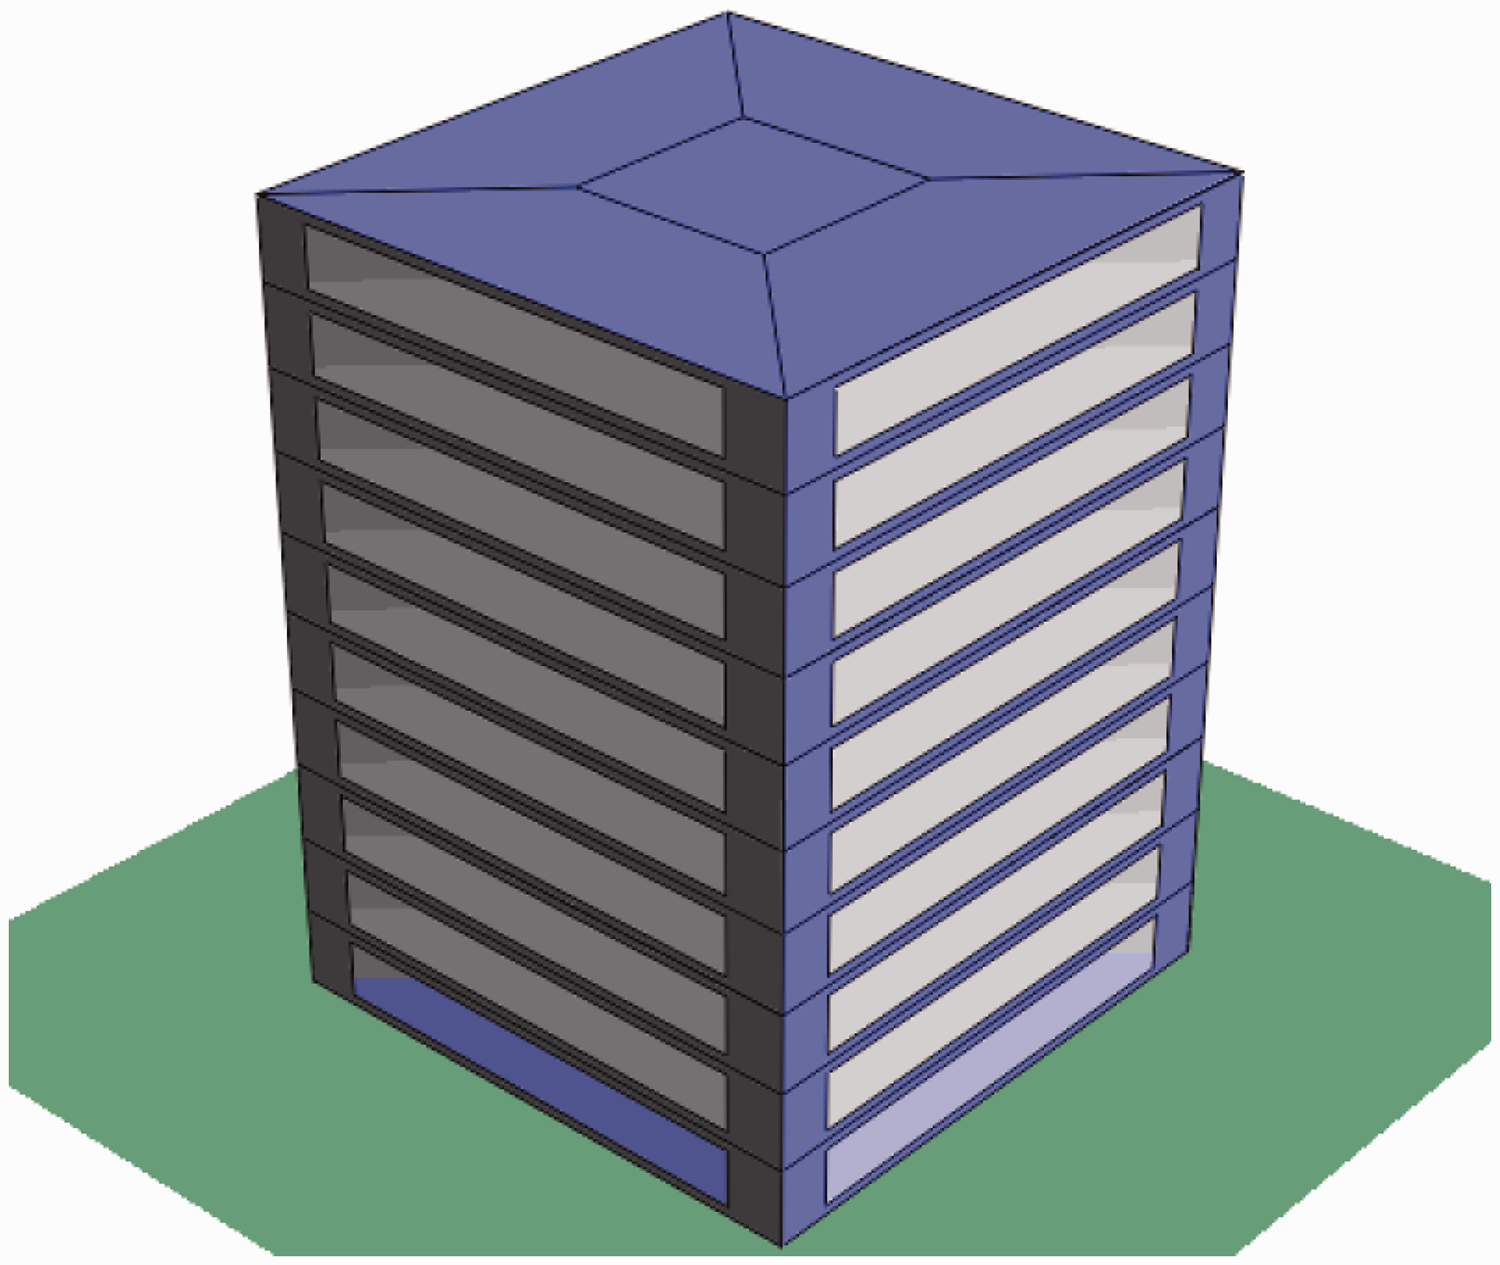
Typical weather data
Weather parameters of typical weather data.
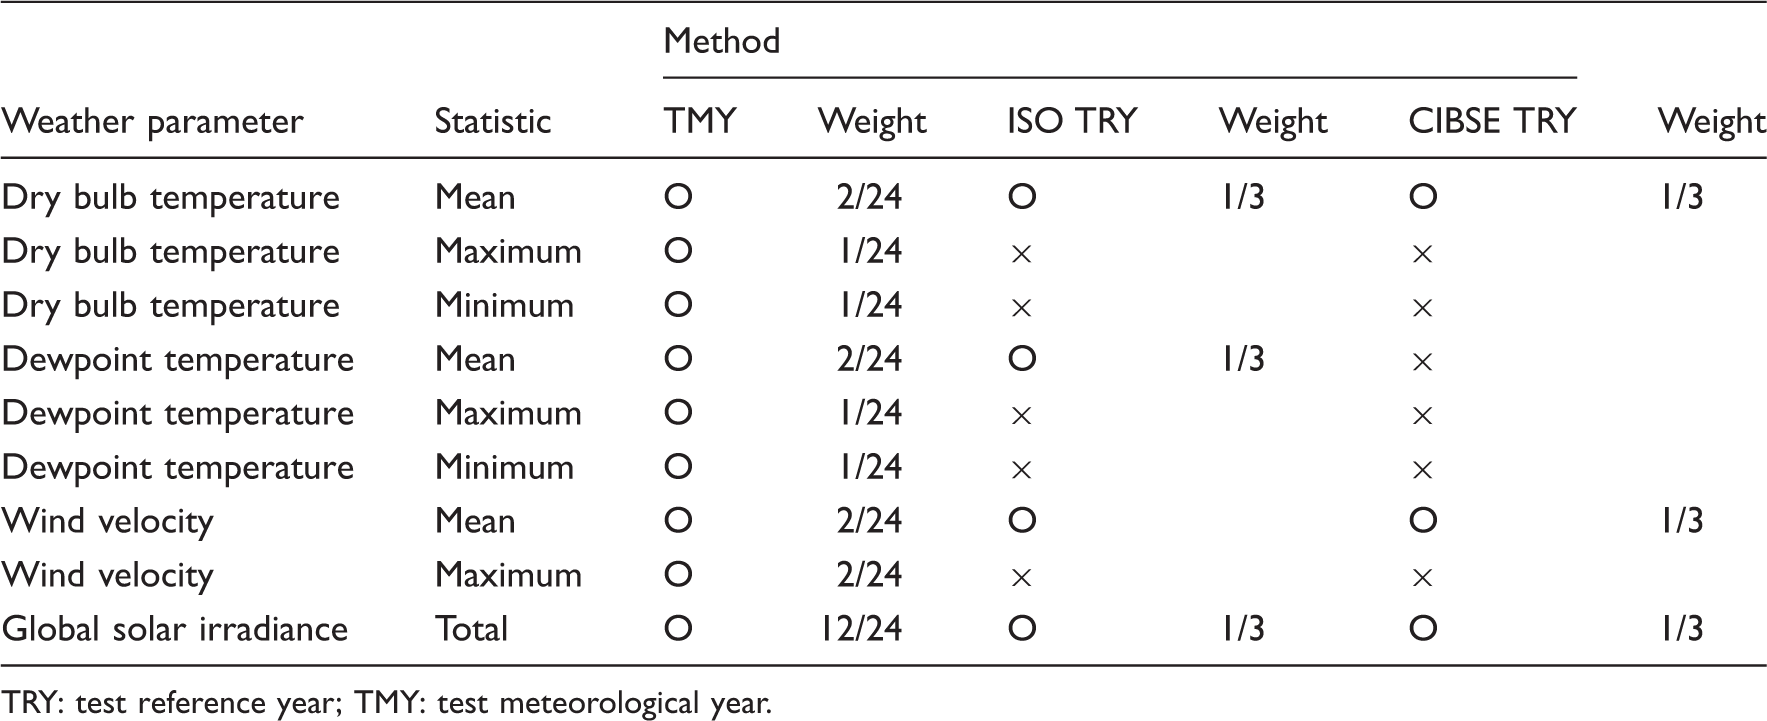
TRY: test reference year; TMY: test meteorological year.
Final selected months for the three major cities of South Korea.
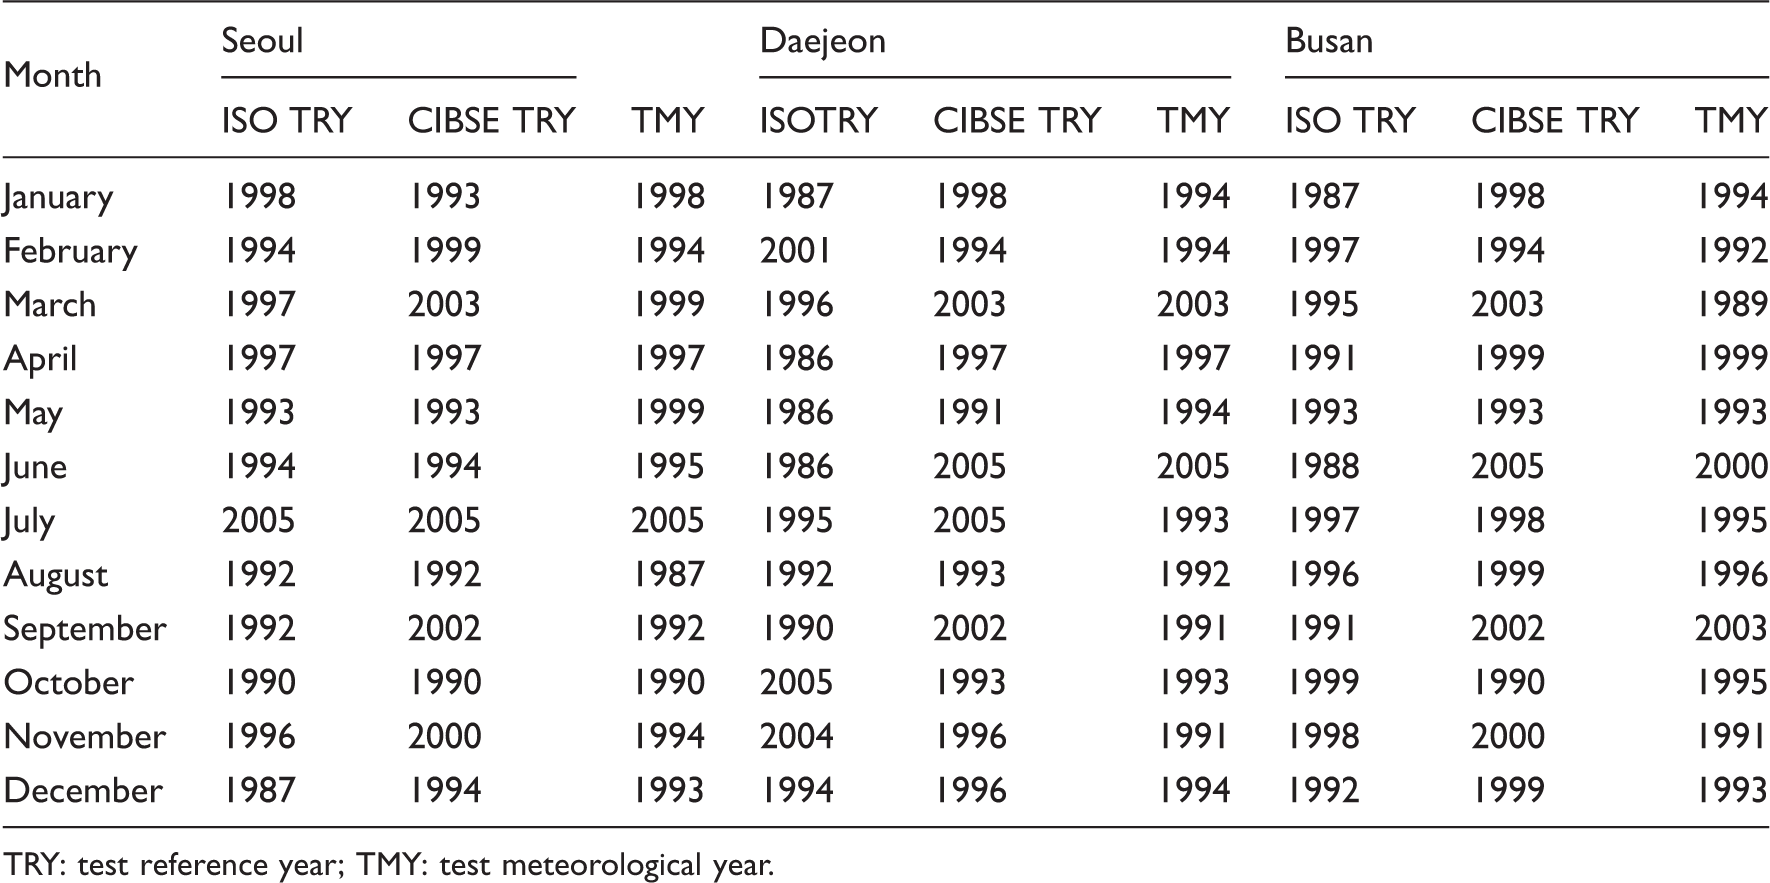
TRY: test reference year; TMY: test meteorological year.
Results and discussion
Comparison of the ISO, CIBSE TRYs, and TMY in simulation
The impact of modeling using the full 20 years of meteorological data base set (BS) was compared to the use of three TWD for five location in the South Korea (Seoul, Daejeon, Daegu, Gwangju, and Busan) by simulating 12 office buildings. The buildings were modeled using a fully dynamic thermal simulation software (a commercial software package), and the range of building parameters is shown in Table 3. The heating and cooling energy used by the air-conditioned 12 office buildings is shown in Figure 3, from which we see that the three TWD slightly underestimate the average total energy use of the heating and cooling plant. Table 6 demonstrates the TMY underestimate cooling load more than other, both ISO TRY and TMY underestimate heating load comparing with CIBSE TRY in Seoul. Except in the CIBSE TRY for Buildings 7, 8 and 9, the three TWD are slightly underestimate the average total energy use of the heating and cooling plant. The maximum difference between the simulated total heating and cooling loads is about 6% in Seoul.
The heating and cooling load used by the office buildings in Seoul. Result of base set and three TWD simulation for the heating and cooling energy use (Diff = difference in percentage). Data shown is for Seoul. TRY: test reference year; TMY: test meteorological year.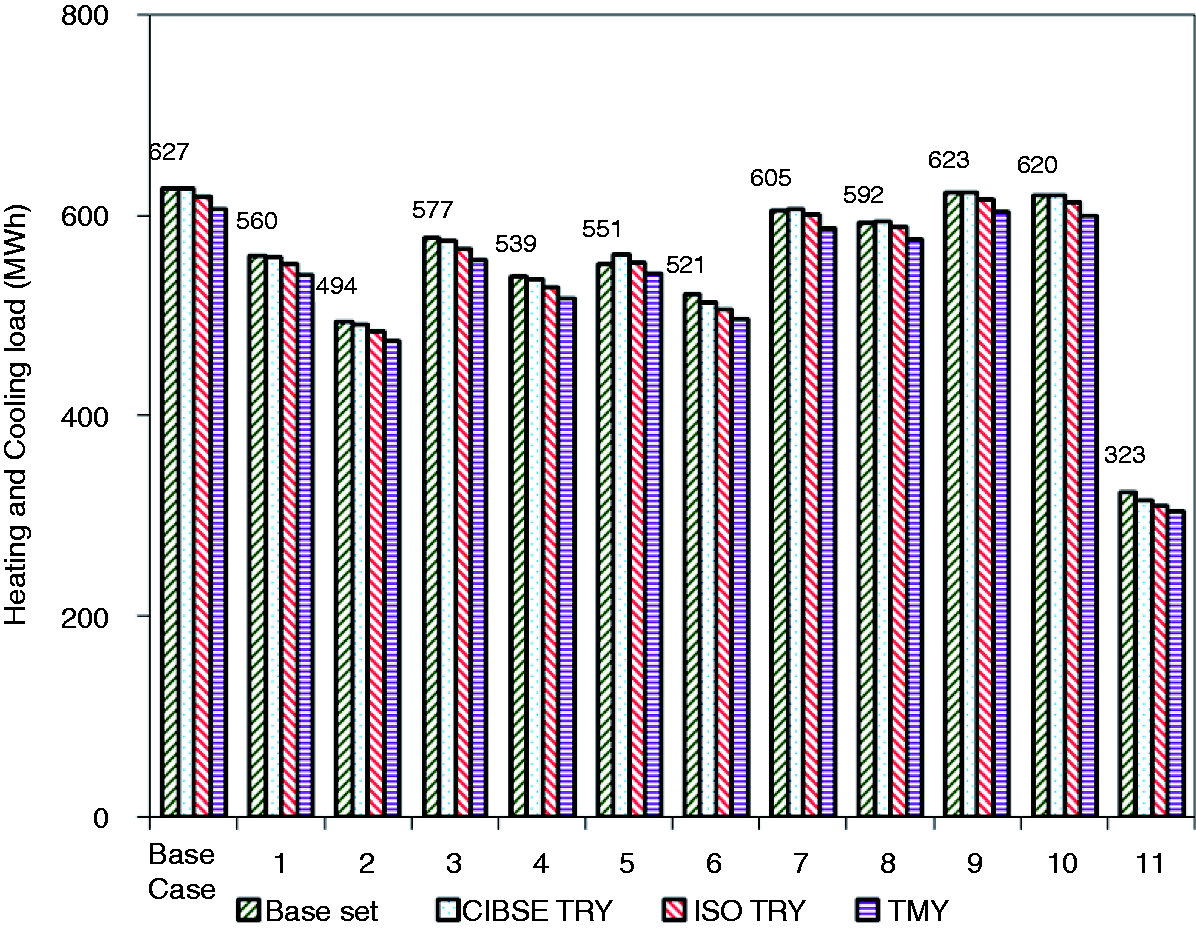
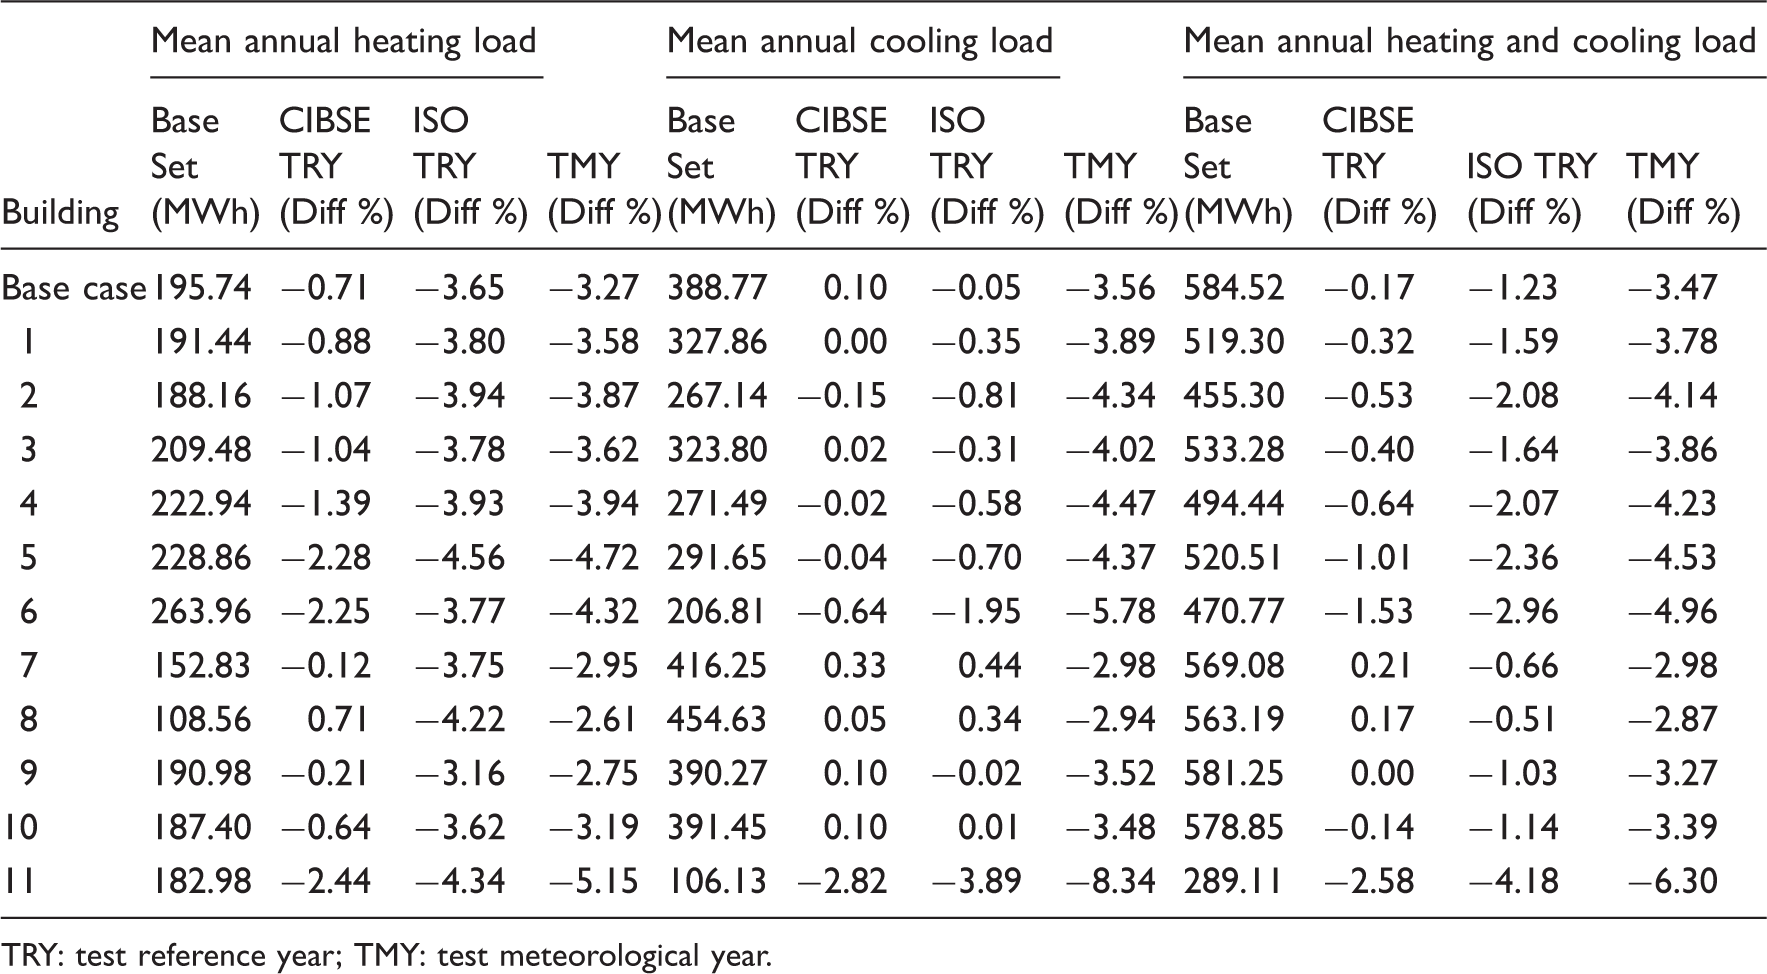
The simulation of the heating and cooling load of office buildings was divided five components (wall-to-window ratio, window overhang, window transmittance, window U-value, and wall U-value) for energy saving. These values are found in Figure 4. Comparing the five components, window and wall U-values were very close to the base case. However, the wall-to-window ratio had the largest differences, followed by window transmittance and window overhang. When the wall-to-window ratio decreases by 20%, the total load for the office building decreases from 585 MWh to 455 MWh (22.1%). The heating and cooling load is in the case almost linear with the flow as any building type exclude window U-value.
The heating and cooling load of office buildings by five components (wall-to-window ratio, window overhang, window transmittance, window, and wall U-value) in Seoul.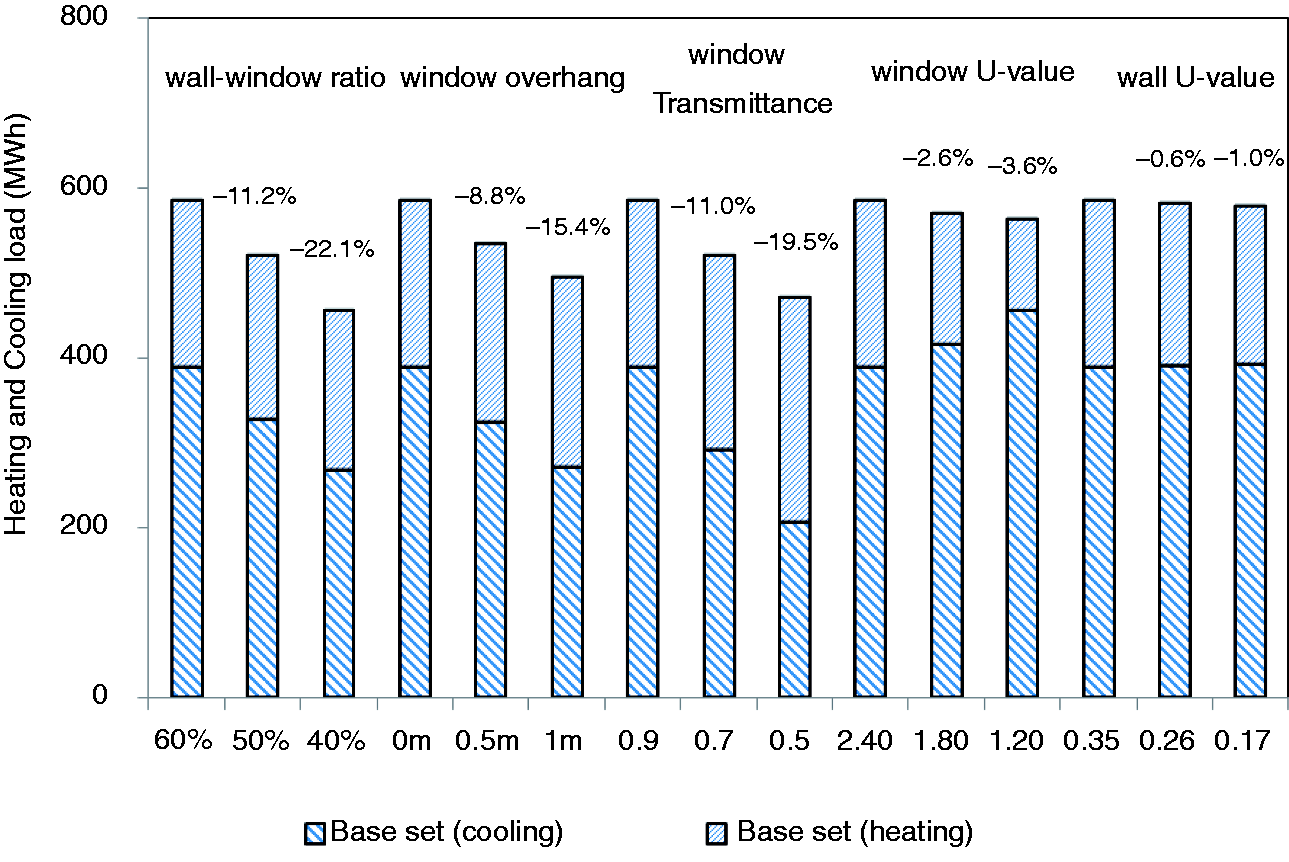
Building heating and cooling loads
The computed monthly heating loads from each of the 23 simulation runs were analyzed. To ascertain whether the computed heating loads from the TWD follow the long-term mean, the monthly load profile from the TWD was compared with those from the 20 individual years. Figure 5 shows four profiles—the monthly mean loads for long-term mean (i.e. 20-year average) and the three TWD (ISO TRY, CIBSE TRY, and TMY).
Comparison of monthly heating and cooling load profiles for Seoul, Daejeon, and Busan.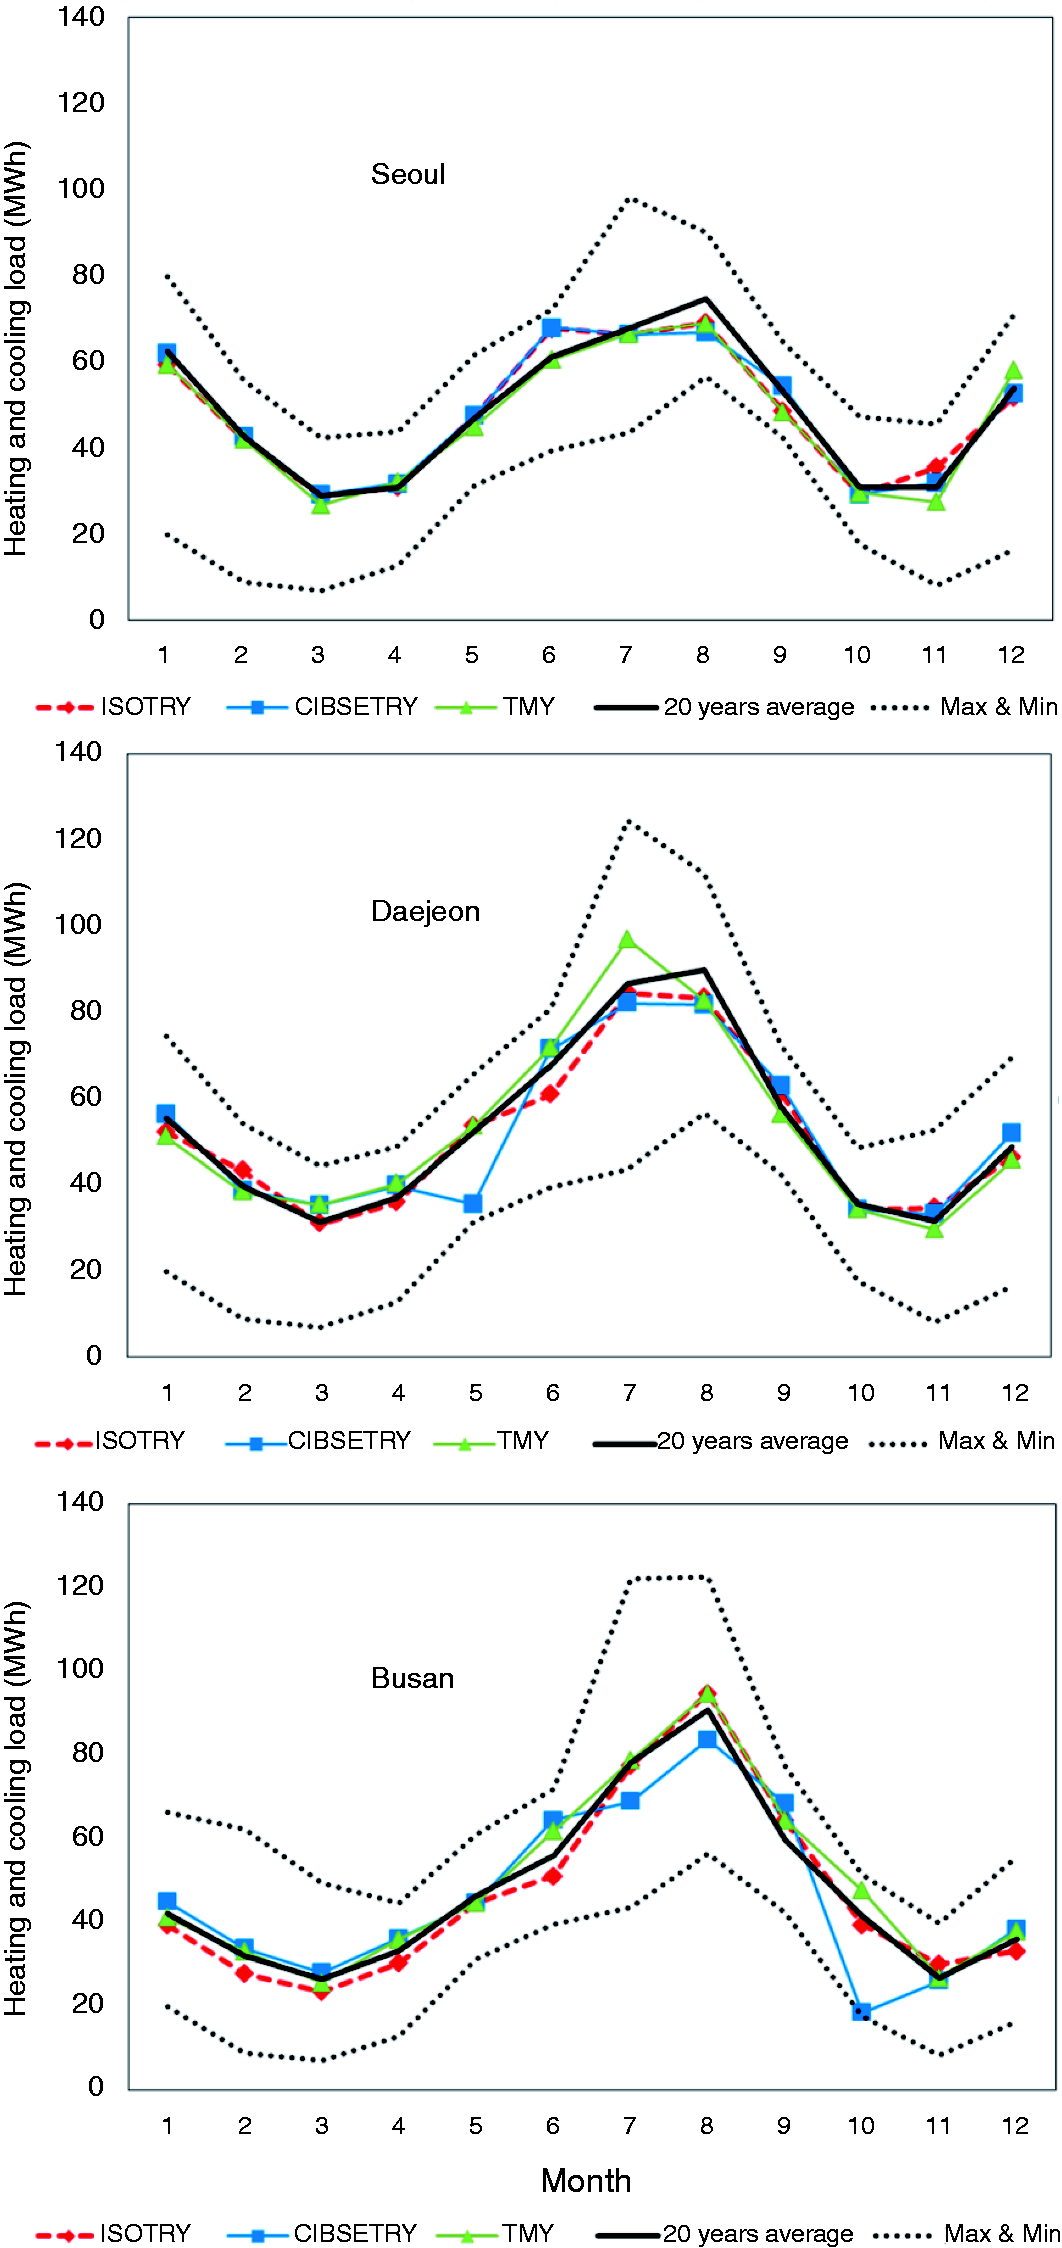
Summary of MBE and RMSE for heating loads.
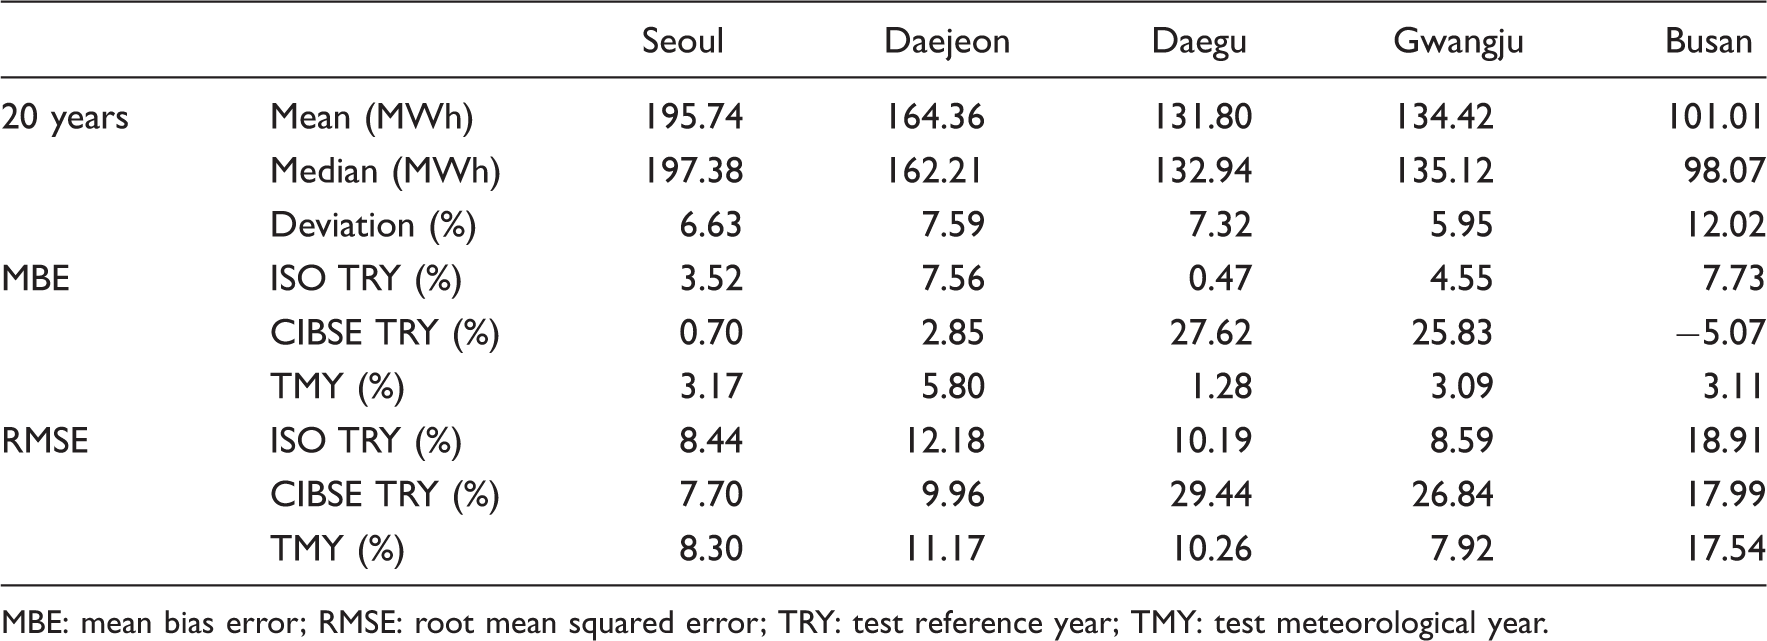
MBE: mean bias error; RMSE: root mean squared error; TRY: test reference year; TMY: test meteorological year.
Summary of MBE and RMSE for cooling loads.
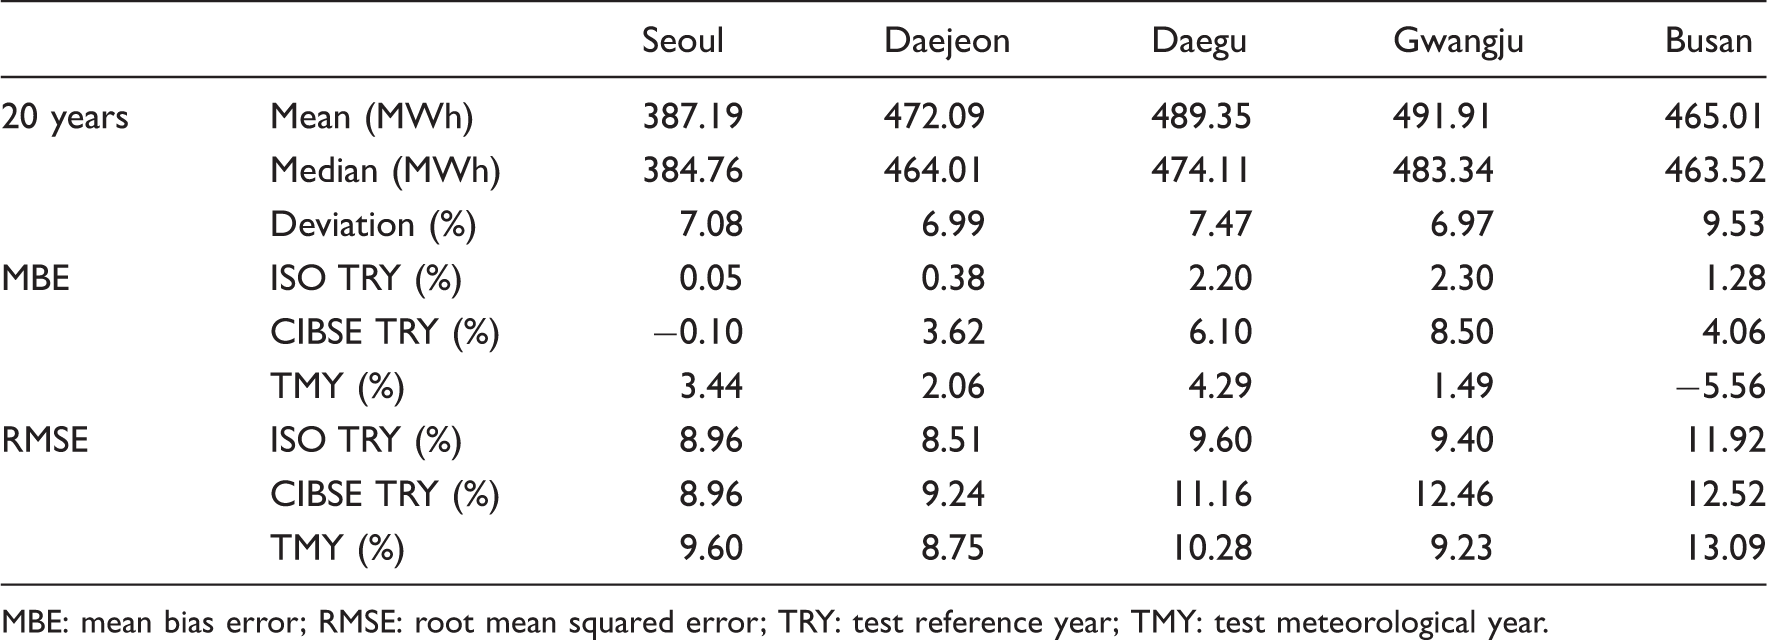
MBE: mean bias error; RMSE: root mean squared error; TRY: test reference year; TMY: test meteorological year.
The long-term annual mean total load varies from 633 MWh in Daejeon to 564 MWh in Busan. Predictions from the TWD are very close to the long-term means, ranging 7 MWh underestimation in Daejeon to 30 MWh overestimation in Busan, representing only 1.1–5.32% of the respective annual total load. In general, the TWD predictions tend to follow the long-term means quite closely, and both are well within the maximum and minimum ranges of the 20 individual year predictions. There appears to be some noticeable differences between the TWD predictions and the long-term means in June and August for Seoul. These percentage errors tend to be at the lower end of the 20-year ranges and, once again, indicate that there is good agreement between predictions from the TWD and the corresponding long-term means.
Sensitivity of weather parameters
Global warming in Asia means greater climatic extremes with drier dry seasons and wetter wet seasons. The summer climate of South Korea is characterized by a climate of high temperature and humidity. Table 9 shows that the cooling load of the base case office building changed as the weather parameters (temperature and solar irradiation of summer season) changed over the years for Seoul. 1994 produced the largest cooling load. According to Table 2, Figure 6 shows the cooling load for office buildings based on the components of building envelop by a greatest climate extremes year (1994) for Seoul. The maximum difference among the simulated cooling loads was 191 MWh, or 42.4%, the window transmittance had the best positive effects. Taking all the cases into consideration, the positive effects far outweigh the negative effects exclude the window U-value for a climate of humid and hot.
The cooling load of the office building by a climate of high temperature and humidity for Seoul in 1994. The cooling loads of the base case model by changing the weather parameter.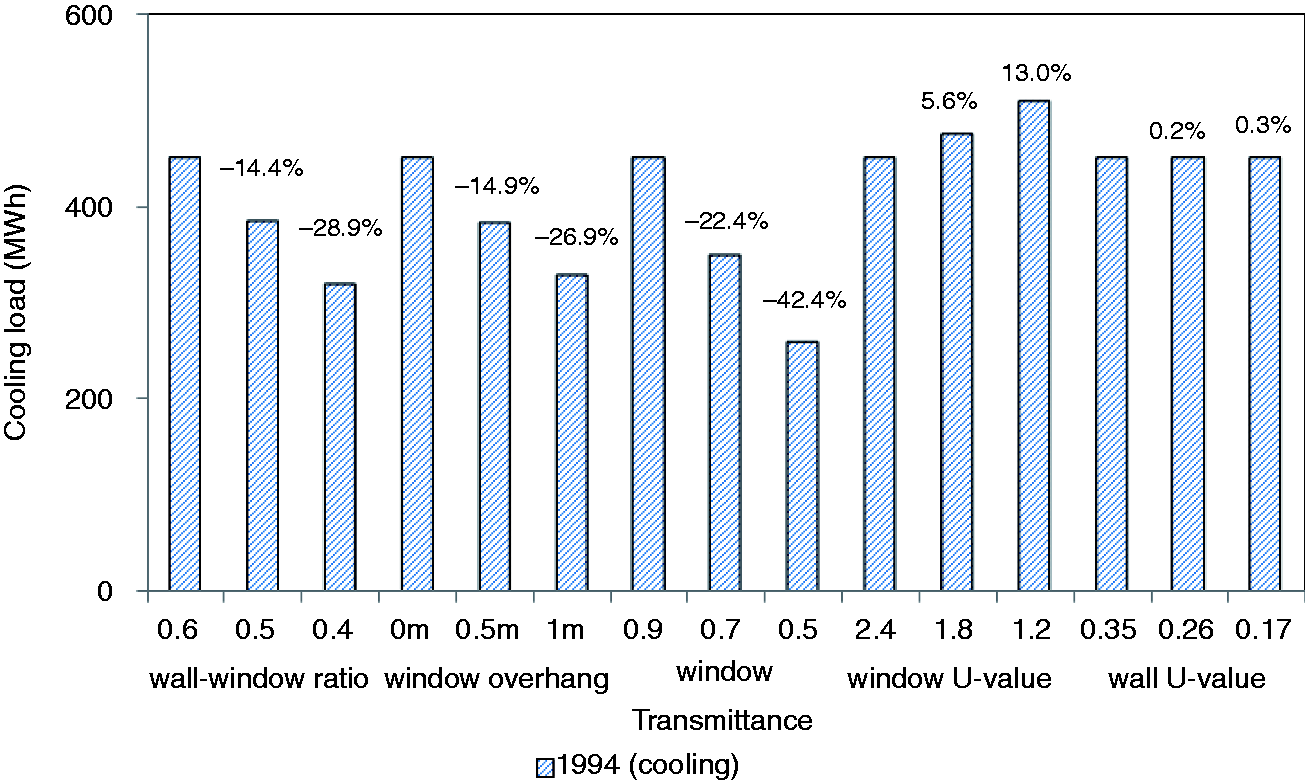
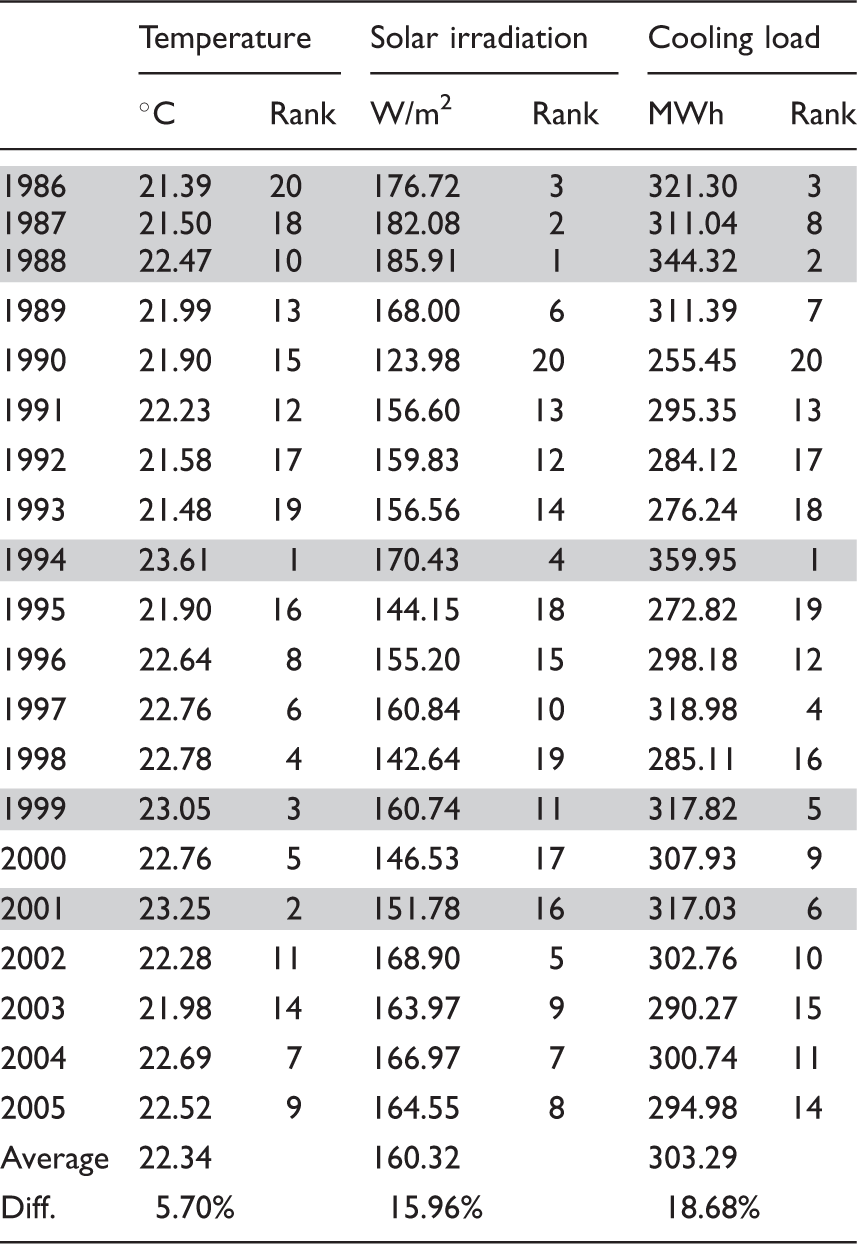
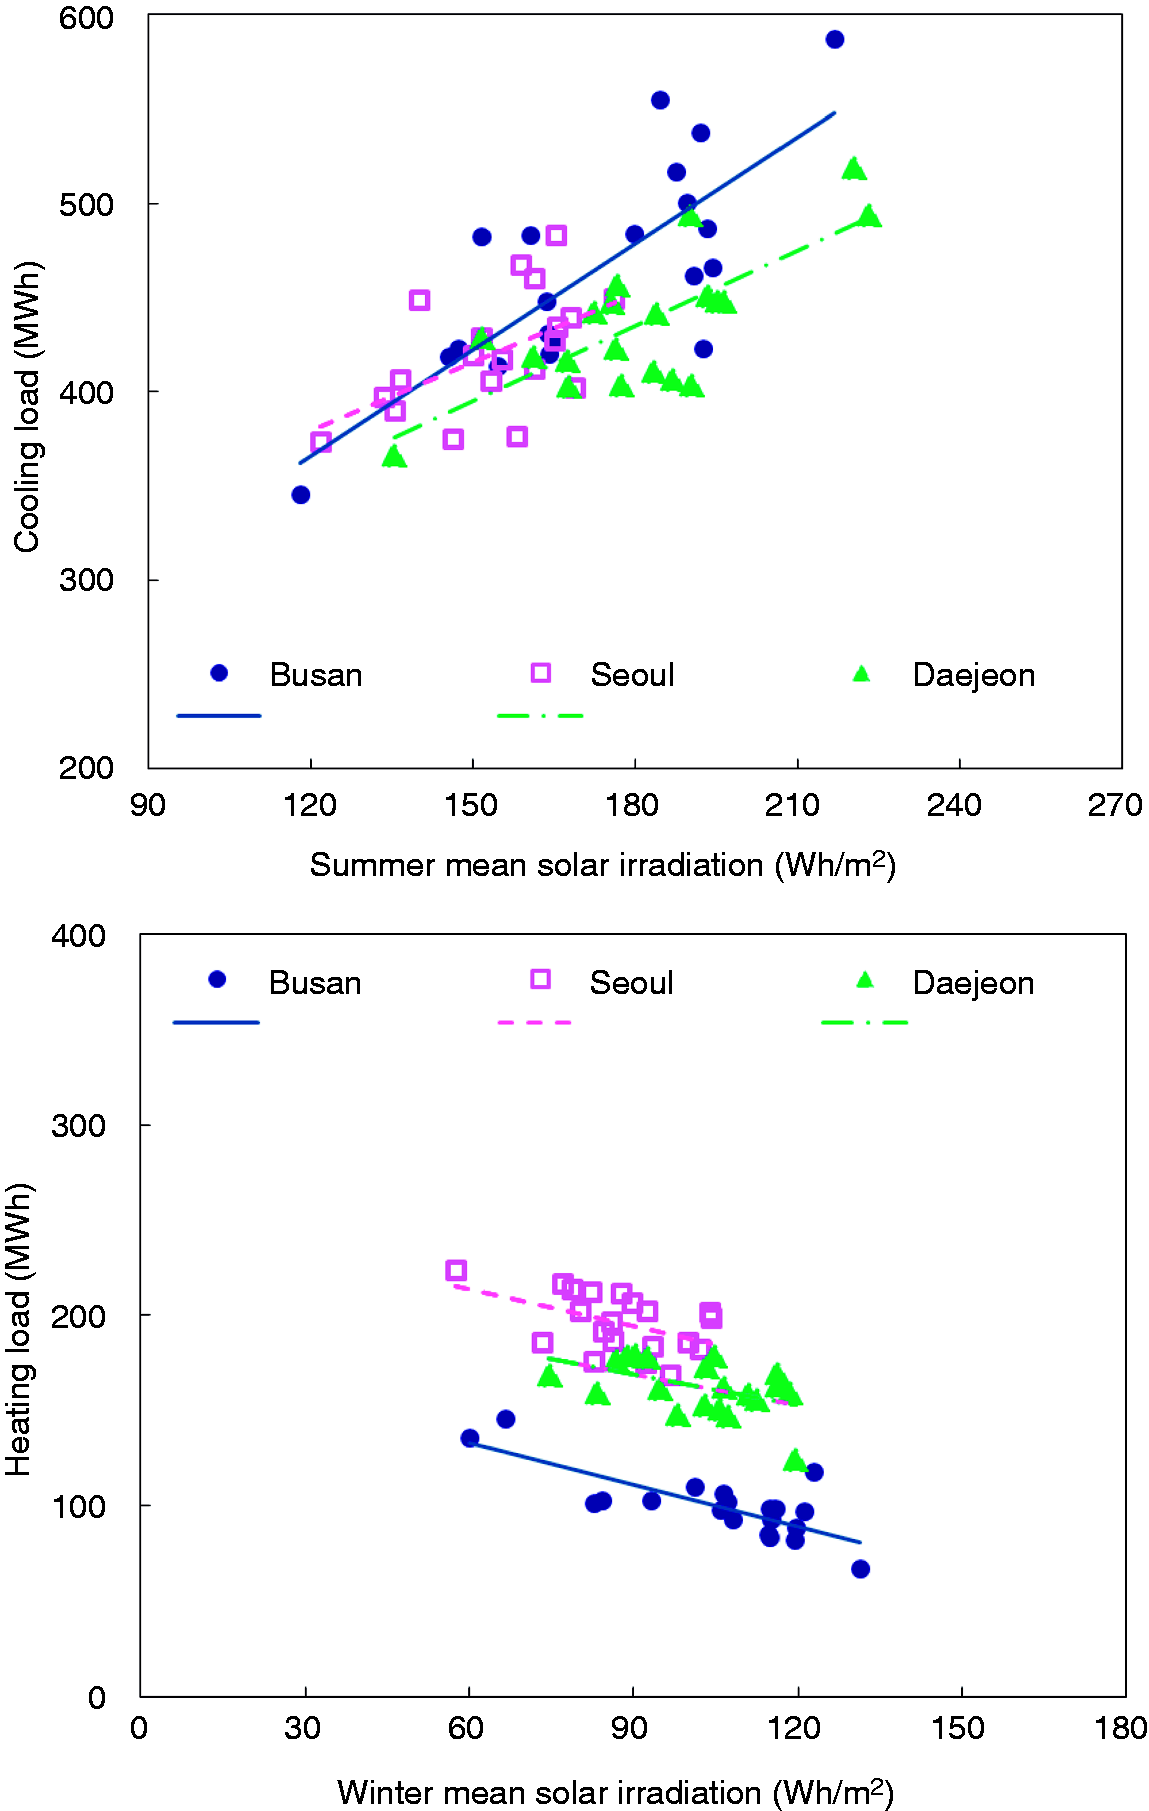
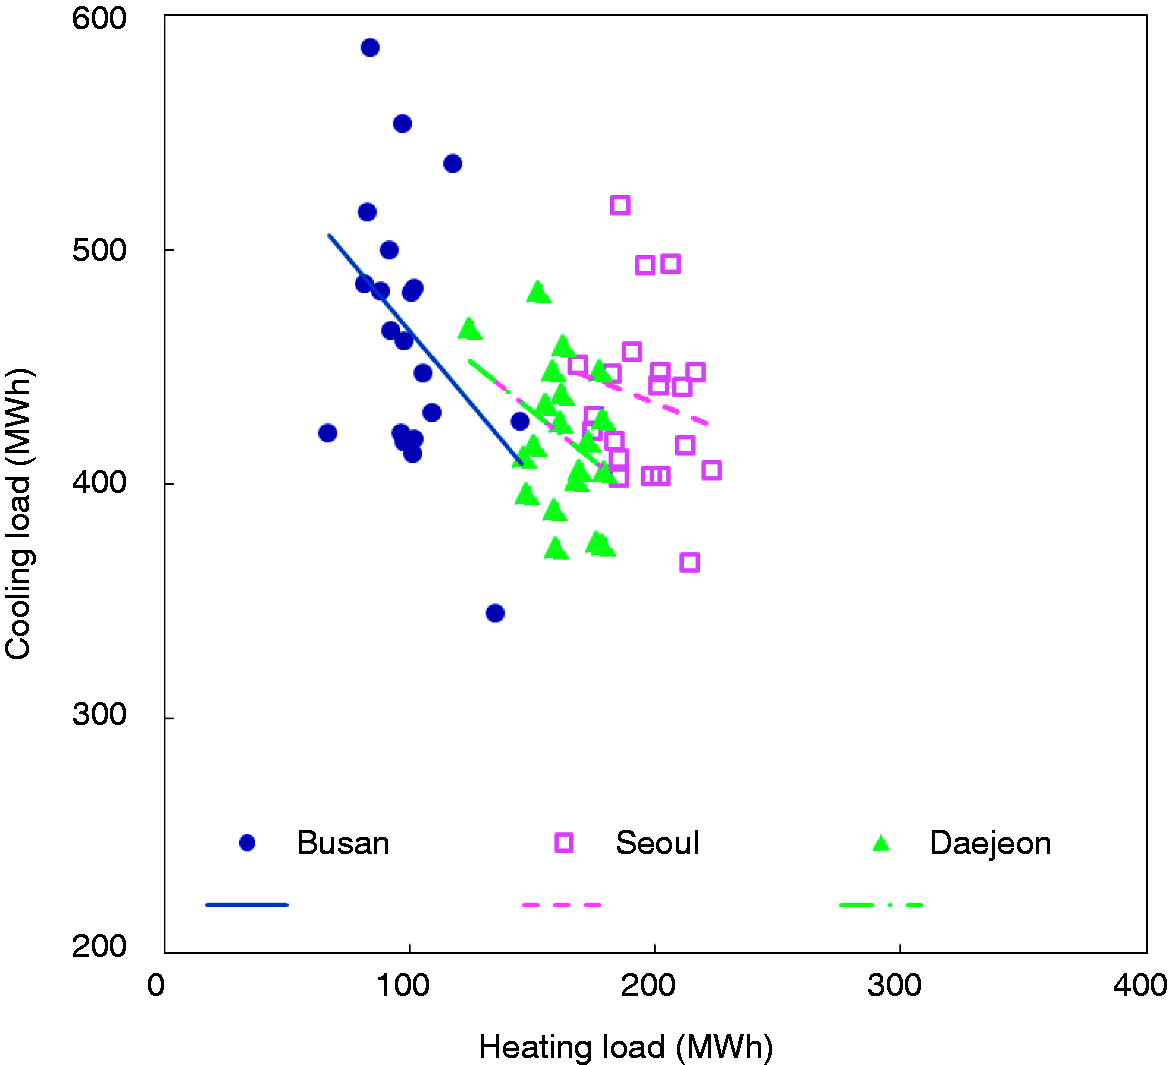
Figure 7 shows the relationship between the measured summer and winter mean temperature of each location over the 20 years and the heating and cooling load. The cooling load is considerably increased according to the summer mean temperature, but the heating load is slightly decreased. Figure 8 shows the relationship between measured summer and winter mean solar irradiation and the simulated heating and cooling loads. For the three cities, there are more increased the cooling load than decreased the heating load as the mean solar irradiation increases. It is interesting that the high coefficient of determinations for the solar irradiation parameter is strong so that about 60% of the data is explained by the linear relationships. Figure 9 shows that the relationship with higher cooling loads tend to have lower heating loads for 20 years of the three cities. A reason for scatter in the relationship being Busan with higher summer mean solar irradiation.
The relationship between measured summer and winter mean temperature and simulated heating and cooling load. The relationship between measured summer and winter mean solar irradiation and simulated heating and cooling load. The relationship between simulated annual heating load and cooling load during 20 years.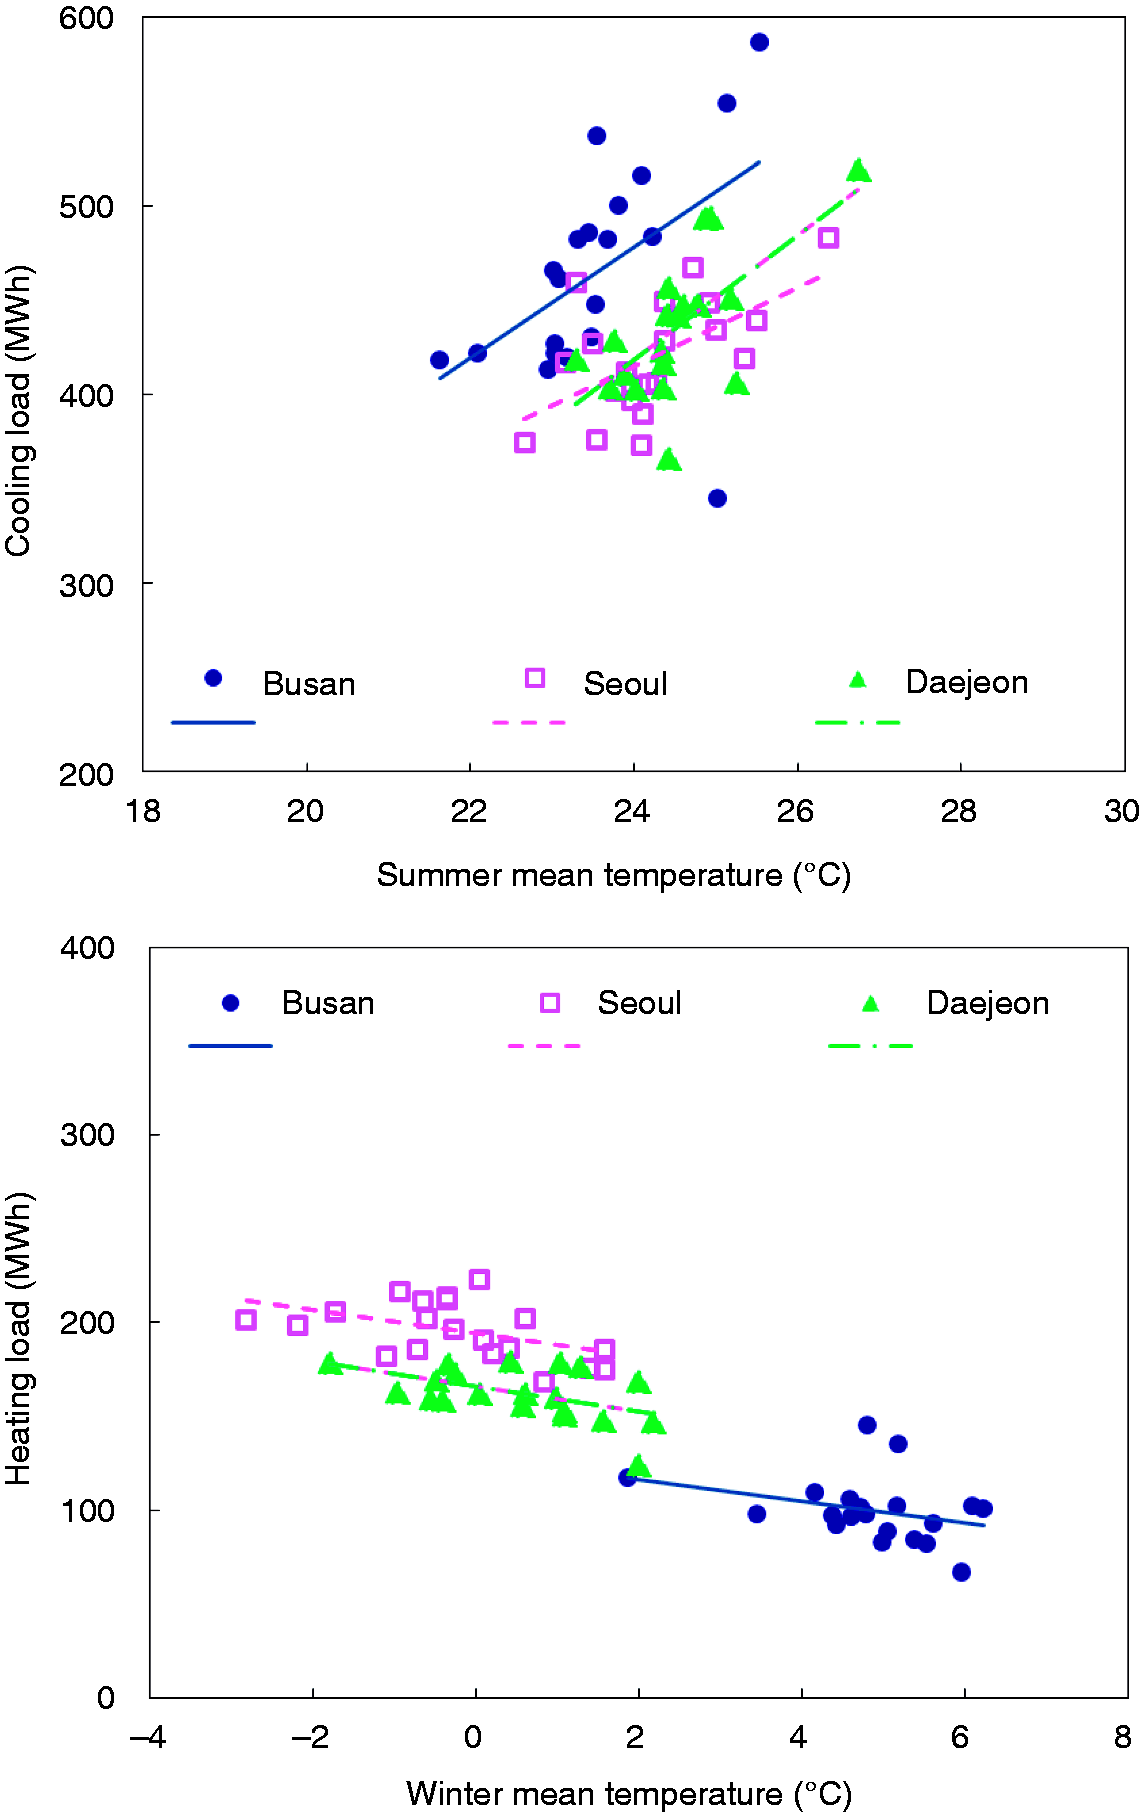
Conclusions
Computer simulation of buildings and solar energy systems is being used increasingly in energy assessments and design. In this paper, TWDs have been generated, using three different methodologies, from hourly meteorological data measured in Seoul Daejeon, Daegu, Gwangju, and Busan. A total of 368 simulation runs were performed and building heating and cooling loads were analyzed. The aim of this study was to compare the simulation results from three methodologies (ISO TRY, CIBSE TRY, and TMY) with those from individual years and their long-term means. It also assessed the importance of five important components of the building envelope (wall-to-window ratio, window overhang, window transmissivity, window U-value, and wall U-value) for the influence on the heating and cooling load and to study the influence of the different weather parameters (temperature and solar radiation).
It was found that monthly load and energy use profiles from the TWD did follow the long-term means quite well. From the yearly average values of MBE and RMSE errors it can be seen that MBE values range between 1.21% and 4.04% and that RMSE values range between 6.18% and 17.68%. The cooling loads indicate that the ISO TRY provided lower MBE and RMSE values for four of the five cities. For the humid summer in South Korea, the weighted factor of 0.33 for relative humidity in the ISO TRY is better than the other TWDs. Comparing the five components, window and wall U-values were very close to the base case. However, the wall-to-window ratio had the largest differences, followed by window transmittance and window overhang. When the wall-to-window ratio decreases by 20%, the total load for the office building decreases from 585 MWh to 455 MWh (22.1%). The cooling load is considerably increased according to the summer mean temperature, but the heating load is slightly decreased. The three cities are considerable increased annual cooling load according to mean solar irradiation. It is interesting that the high coefficient of determinations for the solar irradiation parameter is strong so that about 60% of the data is explained by the linear relationships. The reduction in window transmittance had the best reduction in cooling load, outweighing the changes in the window U-value. However, this is for the South Korean climate of high temperature and high humidity.
Footnotes
Funding
This research was supported by Basic Science Research Program through the National Research Foundation of Korea (NRF) funded by the Minister of Education (NRF-2013R1A1A2058276).
Conflict of interest
None declared.