
Abstract
In the UK, there is mounting evidence that the measured in situ performance of the building fabric in new build dwellings can be greater than that predicted, resulting in a significant building fabric ‘performance gap’. This paper presents the coheating test results from 25 new build dwellings built to Part L1A 2006 or better. Whilst the total number of dwellings reported here is small, the results suggest that a substantial ‘performance gap’ can exist between the predicted and measured performance of the building fabric, with the measured whole building U value being just over 1.6 times greater than that predicted. This is likely to have significant implications in terms of the energy use and CO2 emissions attributable to these dwellings in use.
Introduction
In the UK, as in most industrialised countries, the domestic sector is a significant contributor to national energy use and CO2 emissions. Currently, there are over 27 million dwellings in the UK 1 accounting for just less than 30% of the UK’s total CO2 emissions. 2 Therefore, if we are to mitigate the effects of climate change and achieve the UK Government’s target of an 80% reduction in national CO2 emissions by 2050 based on 1990 levels, 3 then significant reductions in the carbon emissions from dwellings, both new build and existing, will be required.4–6
One factor that can have a considerable impact on the energy use and CO2 emissions from dwellings is the performance of the building fabric. Traditionally, the performance of the building fabric in new dwellings has been taken for granted. This is despite the fact that fabric performance is rarely understood or tested in the field. However, in recent years, mounting field evidence has revealed that the measured in situ performance of the building fabric in new build dwellings cannot be taken from granted and can be much greater than that predicted. For instance, work undertaken by Hens et al. 7 and Doran 8 found that the U values achieved in practice are often much higher than those calculated. Similarly, recent work undertaken by Leeds Beckett University on whole dwelling heat loss found that there can be a considerable gap between the measured and the predicted performance of the building fabric. 9 This difference between the measured and the predicted performance is commonly referred to as the building fabric ‘performance gap’. In some cases, differences between the measured and predicted performance of the building fabric of more than 100% have been measured.9,10 Clearly, performance differences at this order of magnitude will have a significant impact on the dwellings associated energy use and CO2 emissions, and it is highly probable that they could also have a detrimental impact on occupant thermal comfort.
Traditionally, dwellings in the UK have had very slow replacement cycles and long physical lifetimes, and this generally tends to be the same for the building fabric. Consequently, by 2050, it is estimated that around 80–85% of the dwellings that we will live in are already built and are standing today.11,12 Therefore, it is crucial that we are not only able to quantify the performance of the building fabric in both new and existing dwellings as built, but in doing so, take the opportunities that arise to improve our understanding of fabric performance under real-life conditions and the factors that influence this performance. Otherwise, there is a very real risk that we will leave a legacy of poorly performing new and existing dwellings for generations to come. As we currently have very limited knowledge about the thermal performance of the building fabric in either new or existing dwellings, acquiring such knowledge is justified on the grounds that it will enable informed policy and technical decisions to be made regarding whether technical improvements should be made to the thermal performance of the building fabric in dwellings.
It is also important to realise that the building fabric is just one of a number of complex interrelated factors that influence the overall performance of a new or existing dwelling. Other factors include the performance of the various building services installed within the dwelling (space heating, water heating, ventilation, lights and appliances), occupancy and the energy supply system. In addition, the external environment also has an important influence on the building fabric, the building services and the occupants. This will be increasingly important in the future as the external conditions in which the dwelling is subject to alter in response to climate change.
Measuring building fabric performance
A wide range of tools and techniques are available that can be used to measure and quantify the performance of various aspects of the building fabric once constructed. These can be separated into two distinct categories: aggregate techniques and disaggregate techniques. Aggregate techniques measure the heat loss from the dwelling in totality (both fabric and background ventilation heat loss). However, if these techniques are used in isolation, it is not possible to disaggregate heat loss into all of its constituent components (individual fabric elements and background ventilation heat loss). Disaggregate techniques, on the other hand, measure the heat loss attributable to a particular aspect of the building fabric, such as the U value of a wall. Although it is possible to aggregate the results from various different disaggregated techniques together, it is often difficult to replicate the results obtained from using an aggregate technique, as it is only practically possible to undertake measurements from a limited proportion of the total building fabric surface area. Consequently, the measurements obtained may not be representative of the element of fabric as a whole.
Examples of each of these techniques are as follows:
Coheating test
One technique that has gained significant attention in recent years is the coheating test. The coheating test is an aggregate quasi-steady state (note 2) method that is capable of measuring and quantifying the in situ whole dwelling heat loss (both fabric and background ventilation) of an unoccupied dwelling. It is one of only a few aggregate methods that are currently capable of being deployed in the field to measure whole dwelling heat loss. Other methods include the PSTAR method, 13 or the QUB method, 14 which are currently under development. Of all of these methods, the coheating test is the technique that has been most extensively deployed and developed in the UK; it was a key component of the post construction and early occupation studies that were undertaken as part of the Technology Strategy Board's recent Building Performance Evaluation Programme. 15
The coheating test method test is not a new concept. It was originally proposed by Socolow 16 and then subsequently developed by Sonderegger et al. 17 and Sonderegger and Modera 18 in the late 1970s in North America. At this time, it involved simultaneously providing space heating to a dwelling using two different heating systems; the installed heating system and portable electric resistance heaters, hence the name ‘coheating’. Since its development, the application of coheating in the UK has been limited, with only a few documented instances of its use in the 1980s and early 1990s (see Siviour, 19 Everett 20 and Bell and Lowe 21 ). However, the situation in the UK has changed significantly within the last decade or so, as the method has seen significant development and application by Leeds Beckett University (see Wingfield et al. 22 and Johnston et al. 23 ). Nowadays, the term ‘coheating’ is more of a misnomer, as the Leeds Beckett University version of the test method no longer requires the dwellings to be ‘coheated’.
A coheating test involves heating the inside of an unoccupied dwelling electrically, usually using thermostatically controlled electric resistance point heaters, to an artificially induced mean elevated internal temperature over a specific period of time. To minimise the amount of accelerated shrinkage and drying that may potentially occur within the building fabric, the mean elevated internal temperature should be set so that it is within the expected range of temperatures that would normally occur when the building was occupied. It is also advantageous to set the test temperature towards the upper end of this range, so as to maximise the temperature difference between inside and outside and thus drive heat flow through the building fabric. On this basis, the recommended mean elevated internal temperature used in the UK is 25℃. The period of time taken to undertake the test can vary enormously, and is highly dependent upon the external environmental conditions present during the test, but typically ranges from 1 to 3 weeks once the building fabric has become thermally saturated. The external environmental conditions also determine the time of year that coheating tests can be undertaken. Tests are normally undertaken during the heating season, usually between the months of October/November to March/April, so that a sufficient value of ΔT between the internal and external environment (generally 10℃ or more) can be maintained throughout the test. This gives a six-month test window in total.
Whilst the dwelling is being artificially heated during the coheating test, a number of parameters are measured. These parameters include total electrical energy input to the dwelling, internal temperatures and relative humidity in all of the habitable rooms and circulation areas and various external climatic conditions (temperature, humidity, South-facing solar radiation, wind speed, wind direction and rainfall). By measuring the total daily electrical energy input (in Watts) that is required to maintain the artificially induced mean elevated internal temperature, the daily heat input (in Watts) to the dwelling can be determined. The heat loss coefficient (HLC) for the dwelling can then be calculated by plotting the daily heat input (in Watts) against the daily mean difference in temperature (in Kelvin) between the inside and outside of the dwelling (ΔT). The resulting slope of the plot gives the raw uncorrected HLC in W/K. This provides a measure of the instantaneous rate of heat loss from the whole dwelling per Kelvin. The uncorrected raw data can then be corrected using multiple linear regression analysis techniques to take account of effects such as solar radiation. An example of a plot using the multiple linear regression analysis method to account for solar radiation is illustrated in Figure 1.
An example of the multiple linear regression method of analysis that accounts for the effect of solar radiation on the test data.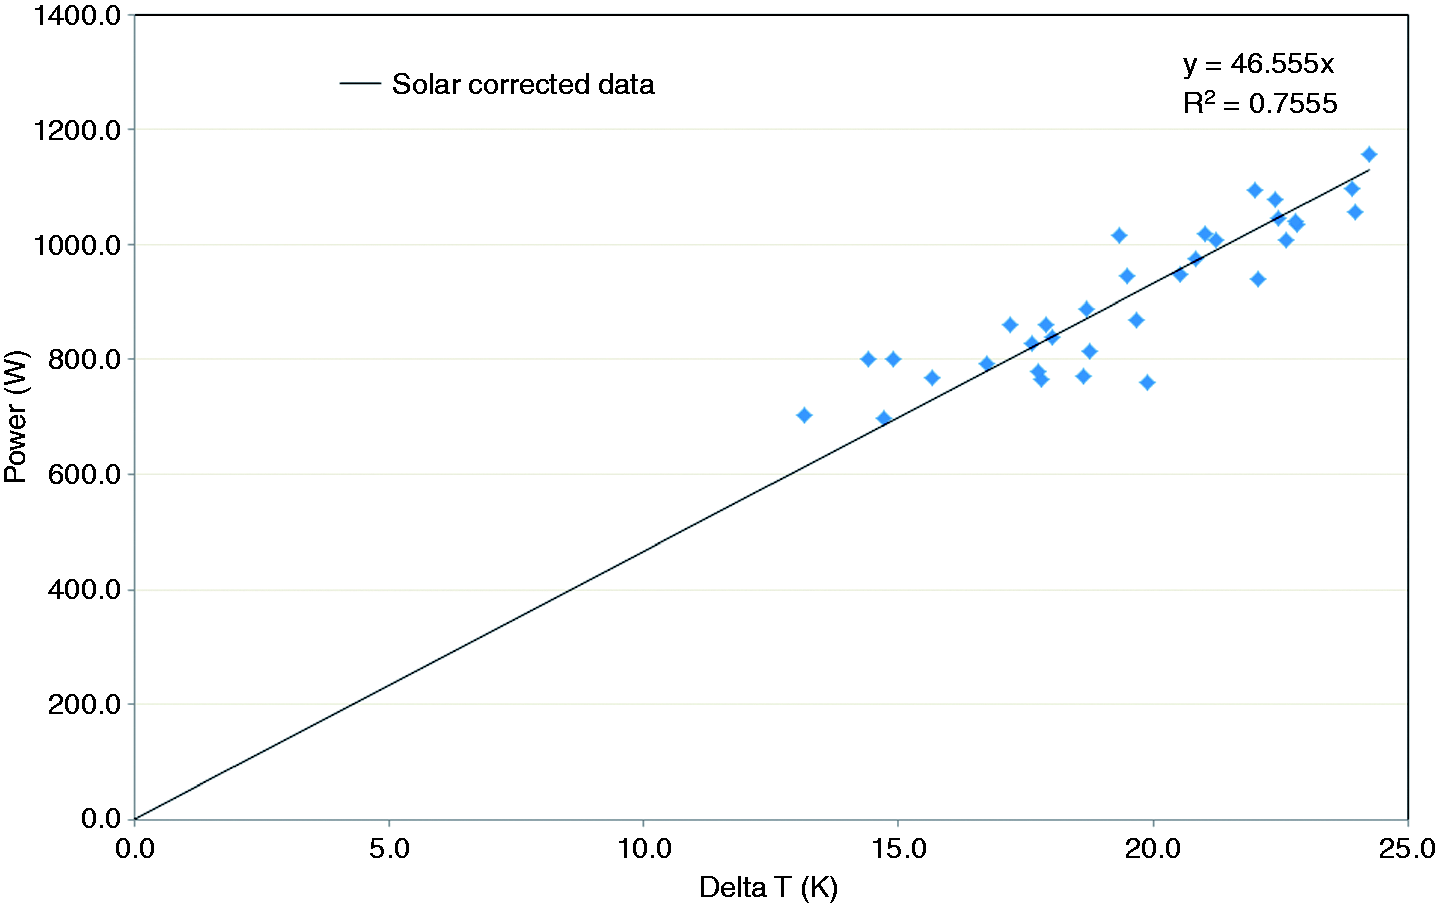
Details of the equipment required to undertake a coheating test and the test procedure can be found within Johnston et al. 23
It is also important to realise that there are a number of uncertainties associated with undertaking a coheating test that may potentially introduce bias into the test results. These uncertainties may result in an underestimate or overestimate of the dwellings HLC and the resulting ‘performance gap’. Areas of uncertainty include those that are related to the measurement of various parameters during the test, those related to the external environmental conditions (for instance, solar radiation, wind speed and wind direction) and the building fabric (thermal mass and the moisture content of building materials), and those related to the method that is used to analyse the test results. Unfortunately, as a complex interplay exists between some of these uncertainties, it is very difficult to establish the impact that each individual uncertainty is likely to have on the coheating test result. As a consequence, very little research has been undertaken on the uncertainties associated with coheating testing. One of the few authors to have investigated some of the uncertainties associated with a number of the external environmental conditions is Stamp et al. 24 Recent work undertaken by Stamp et al. 24 investigated the effect of thermal mass and solar radiation on a test dwelling using simulated coheating tests, coupled with a limited amount of in situ measured data. He concluded that in heavyweight, highly glazed dwellings, the HLC may be underestimated when there are high levels of incident solar radiation.
Other unpublished work undertaken by the Centre for the Built Environment (CeBE) Group at Leeds Beckett University has adopted an alternative approach to deal with a number of the issues associated with uncertainty. Tests undertaken in the field on the same dwelling by the same team almost three years apart revealed little difference in the measured HLC (132.9 W/K in January 2010 compared to 133.8 W/K in December 2013). In addition, coheating tests undertaken on a dwelling located within a controlled environment (test chamber) under three separate ΔTs revealed little difference in measured HLC (224.8 W/K, 222.9 W/K and 222.2 W/K at ΔTs of 10.9℃, 16.2℃ and 20.6℃, respectively). All of these tests give a degree of reassurance in the results obtained from the coheating test methodology. However, it is recognised that the areas of uncertainty associated with undertaking a coheating test are currently poorly understood and require further research.
Quantifying the size of the fabric ‘performance gap’
In order to be able to quantify the size of the fabric ‘performance gap’, an analysis of all of the new build coheating tests that reside within the CeBE at Leeds Beckett University’s coheating testing database has been undertaken. This database contains information on both new and existing dwellings and is one of the largest and most comprehensive sources of coheating test data in the UK. In terms of new dwellings, it contains data on 38 coheating tests that have been undertaken on 25 separate dwellings of different age, size, type and construction, all of which were built to meet the requirements of the Building Regulations Part L1A 2006 25 or better, and most of which were tested by the same team. In a number of cases, multiple coheating tests have been undertaken on the same dwelling in order to test the effectiveness of a particular fabric intervention. Details of a number of specific projects that are contained within this database can be obtained from http://www.leedsbeckett.ac.uk/as/cebe/..
It should be noted that the number of new build dwellings contained within the Leeds Beckett University coheating database is only small and the dwellings contained within it are not necessarily the result of random sampling. Consequently, any results obtained from the database may not necessarily be representative of the UK housing stock as a whole. In fact, as a significant proportion of the dwellings contained within the database were built to exceed the fabric requirements of Part L1A 2006, the database is likely to be biased towards dwellings that were designed to have higher levels of fabric performance than that which is required for compliance purposes alone.
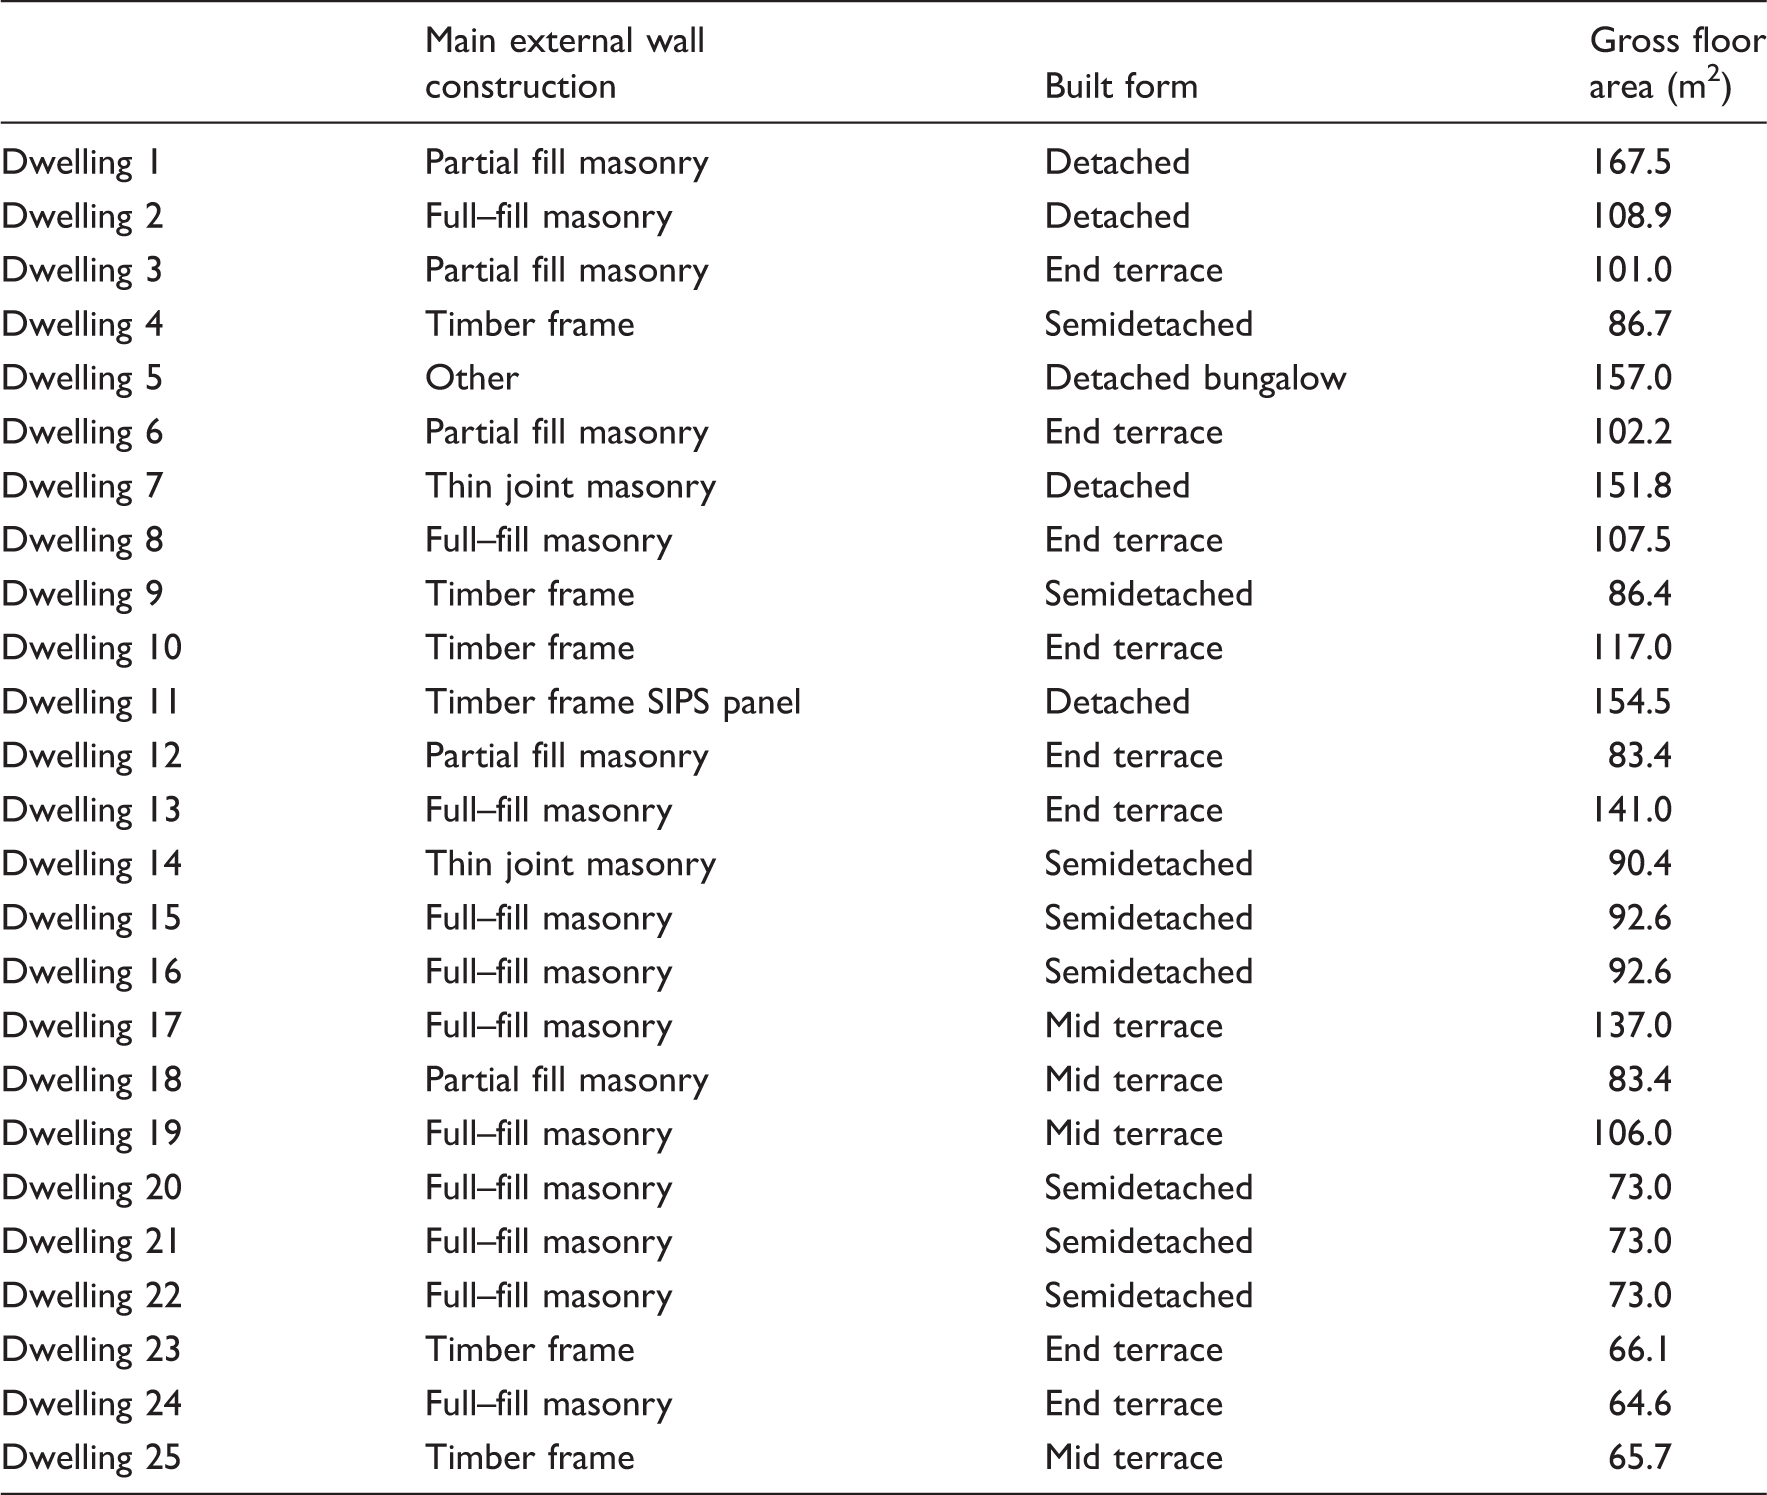
Size, built form and main construction type of the tested dwellings.
The coheating test results for all 25 new build dwellings are illustrated in Figure 2. For comparative purposes, the measured HLC obtained from the coheating test has been compared against the predicted steady state HLC. The predicted steady state HLC is an informed estimate based upon what was actually built, observed and measured on-site and comprises both a fabric and background ventilation HLC. In general, it is not the same at the design intent HLC that is used for compliance purposes. The fabric HLC has been calculated from the measured survey data, plane element U values and information on the heat losses attributable to thermal bridging. The background ventilation HLC has been approximated from the mean air leakage rate of the dwelling using the simple n50/20 ‘rule of thumb’,
26
coupled with data on the number of sides of the dwelling that are sheltered. The results illustrate that the dwellings contained within the database not only varied considerably in terms of their predicted and measured performance, but more importantly the measured performance exceeded the predicted performance in all of the dwellings. Interestingly, in the majority of the dwellings tested, the difference or ‘gap’ between the measured and steady state predicted whole house HLC is considerable. Despite this, it is encouraging to note that given the uncertainties associated with the coheating test method, the size of the ‘gap’ measured for dwellings 23, 24 and 25 can effectively be considered to be negligible, thus the in situ performance of the building fabric associated with these dwellings is performing pretty much as predicted.
Measured and predicted steady state HLC of the Leeds Beckett new build coheating database.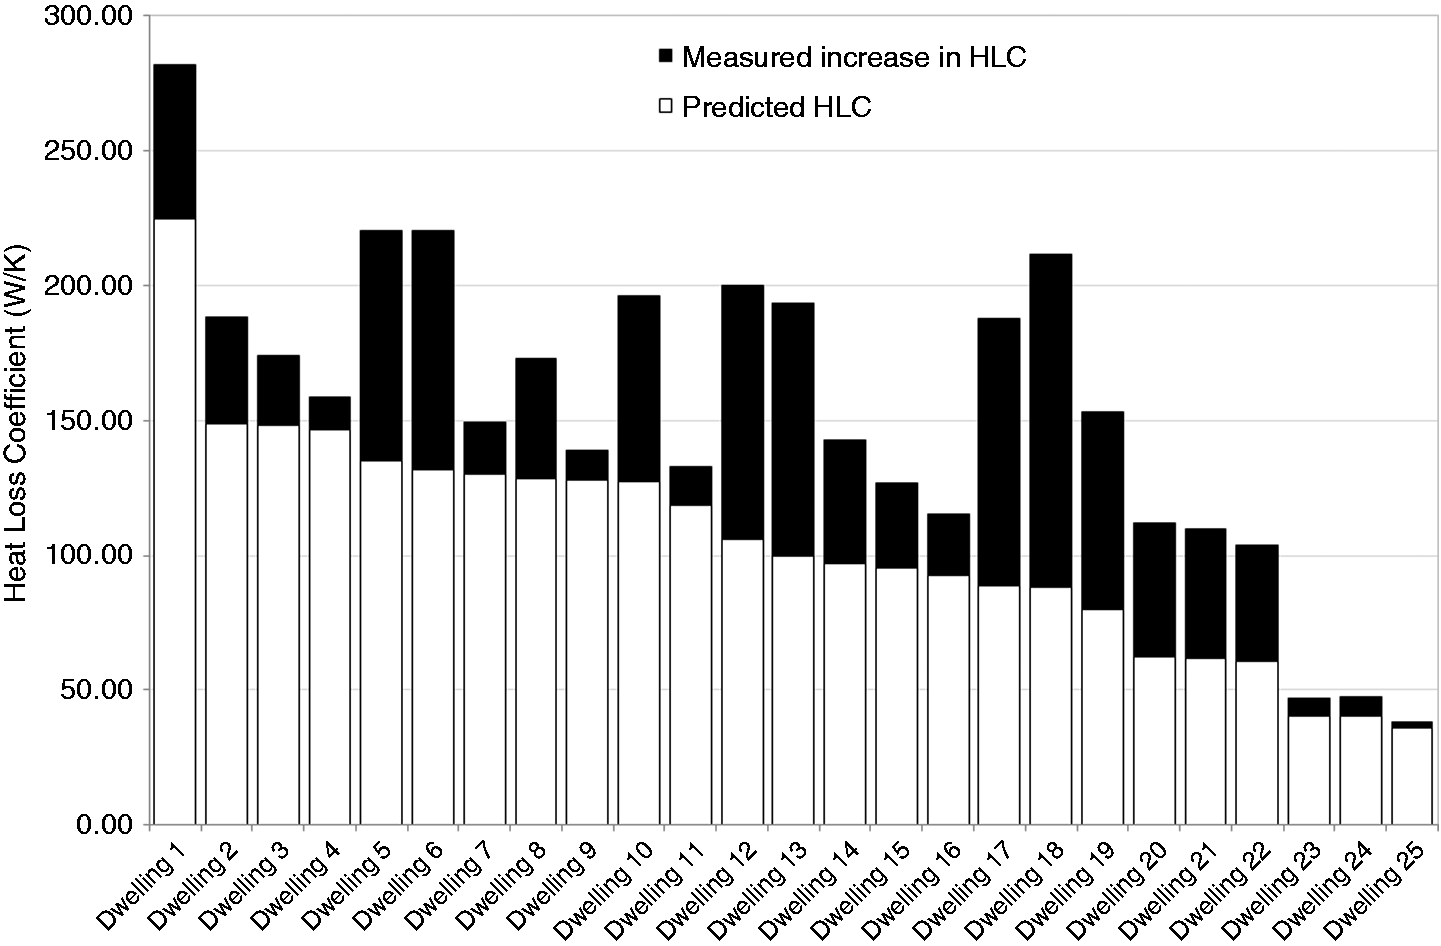
The predicted steady state HLC has also been plotted against the measured HLC and a simple linear regression analysis performed to establish the relationship between these two parameters (see Figure 3). Analysis of the data indicates that there is a significant ‘gap’ between the predicted and measured values, with the measured HLC being almost 1½ times the steady state predicted HLC. However, the value of r2 obtained from the linear regression model is low (0.61), probably due to a combination of factors that include the size and nonrandom nature of the sample, uncertainties associated with the measured coheating data and any bias introduced due to the analysis technique. Despite this, the scale of this ‘gap’, signified by the grey-shaded area in Figure 3, is alarming and is likely to have significant implications in terms of the energy and CO2 emissions attributable to these dwellings in use.
Predicted steady state HLC plotted against measured HLC of the Leeds Beckett coheating database.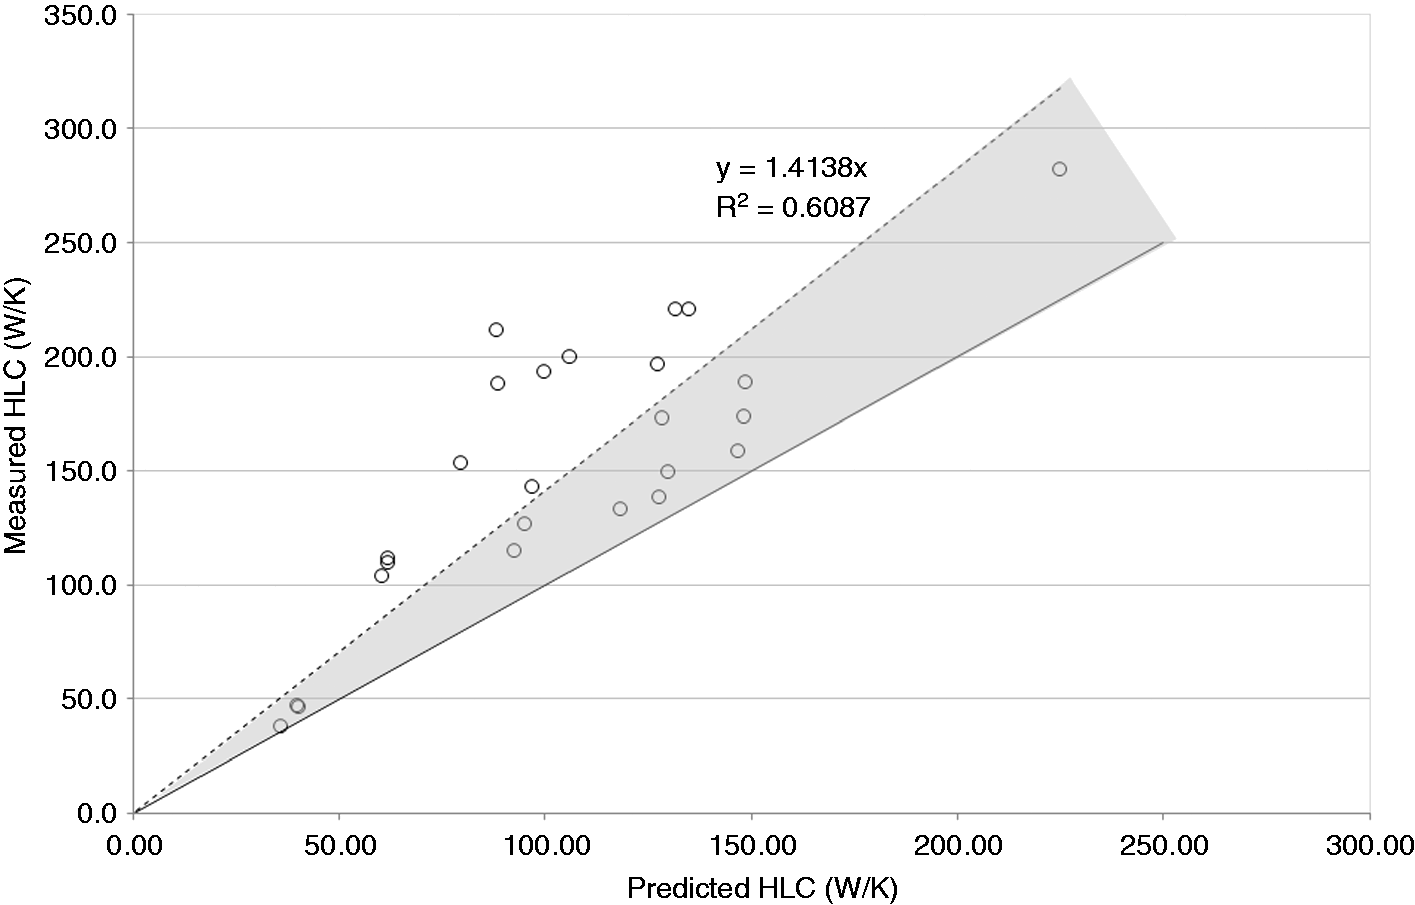
Closer analysis of the coheating data illustrates the size of the ‘gap’ in percentage terms that exists between the measured and predicted steady state performance (see Figure 4). As Figure 4 shows, the size of the ‘gap’ varies considerably, from just over 6% for dwelling 25 to just under 140% for dwelling 18. On average, the size of the ‘gap’ in percentage terms is 50%. However, use of such a metric tends to unfairly penalise those dwellings that have a very low predicted steady state HLC to begin with, such as dwellings 23, 24 and 25. In such dwellings, any observed difference between the measured and the predicted performance, even if it is only very small in absolute terms, will tend to appear to be disproportionately large in percentage terms. Such a metric also tends to mask differences in dwelling size, shape, form, complexity and construction type, so any conclusions drawn from using this metric need to be treated with caution.
Difference in measured HLC as a percentage of the predicted steady state HLC of the Leeds Beckett coheating database.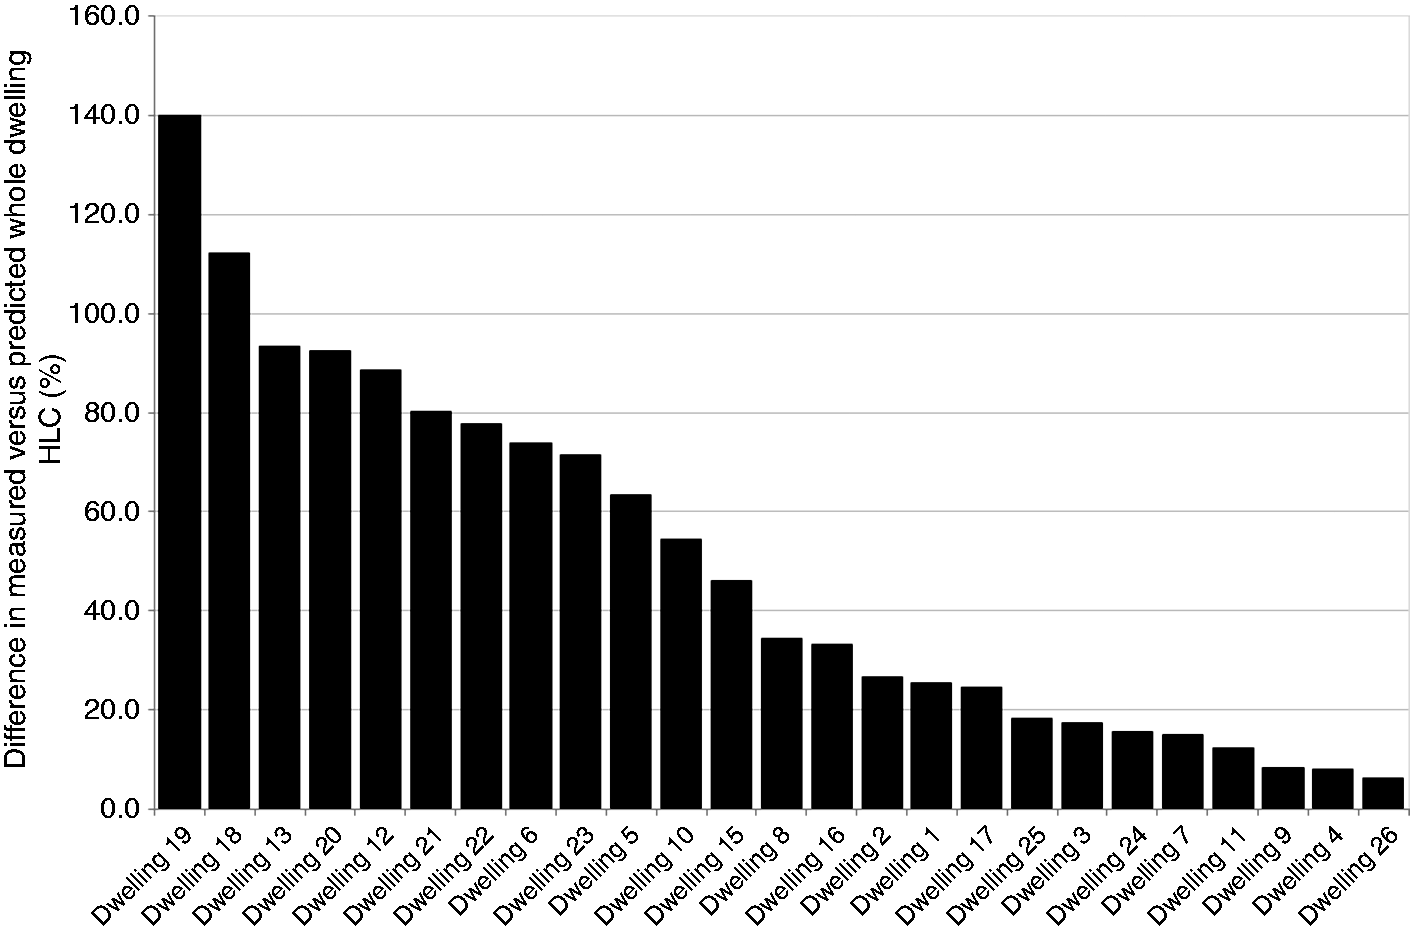
A more appropriate metric to use to compare the measured versus the predicted steady state performance of the dwellings would be to use mean whole building U value, as it normalises the results based upon the external heat loss area. However, by using such a metric, it is recognised that in doing so, the background ventilation HLC is not included within this metric. Utilising such a metric is still deemed to be appropriate as the background ventilation HLC in both the predicted steady state and measured HLC is the same, as both have been calculated based upon the results of pressurisation tests that were undertaken immediately prior to and following the coheating test. However, other important factors that may have an influence on the overall performance of the building fabric are still ignored, such as dwelling shape and level of complexity.
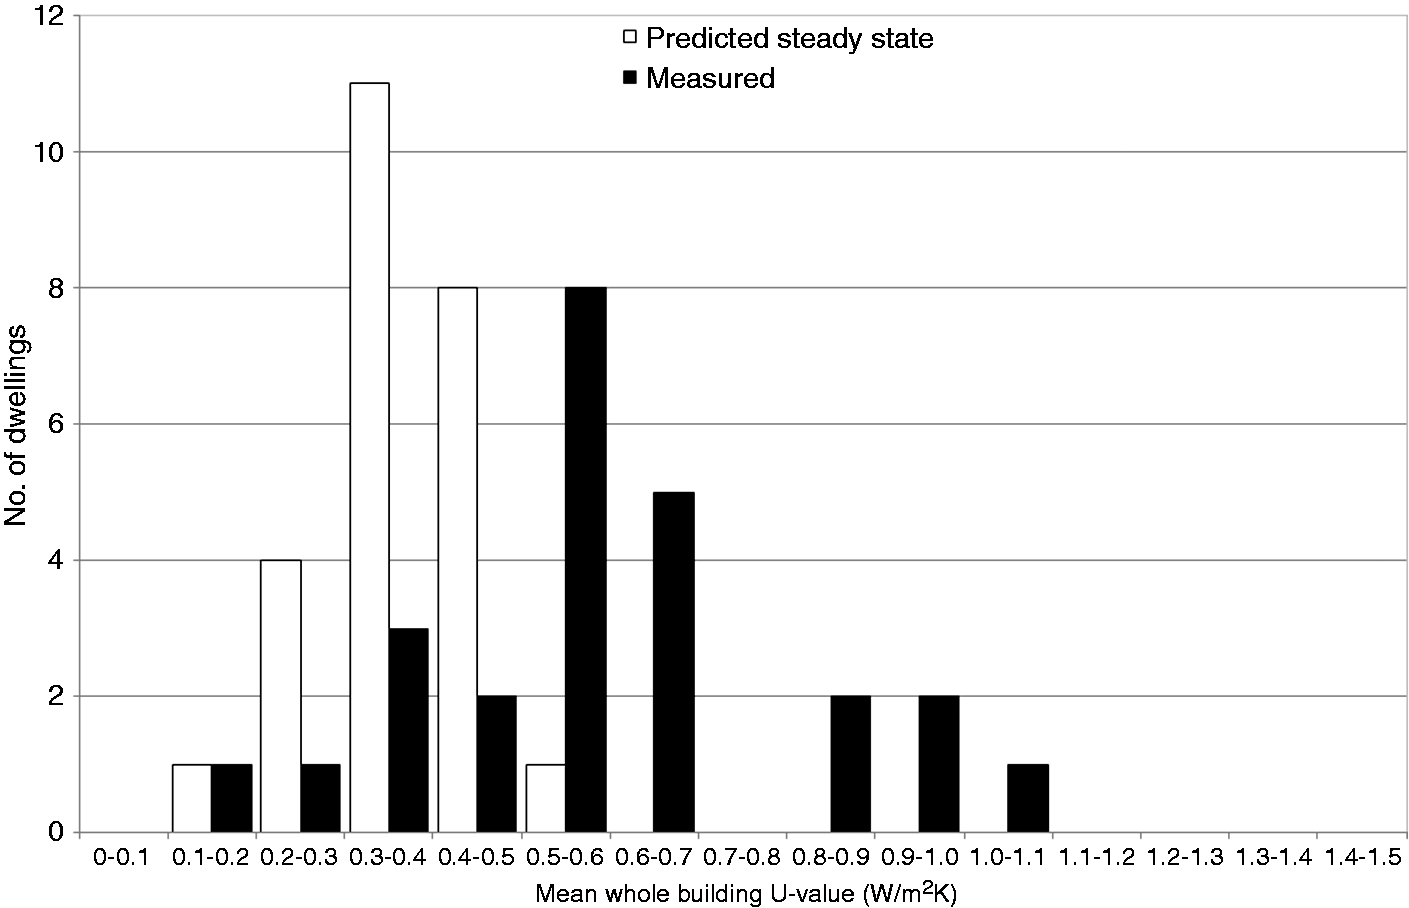
If the predicted steady state mean whole building U values are compared to the measured mean whole building U values (see Figures 5 and 6), it is apparent that a very wide range of performance was measured for the tested dwellings, with the range of measured whole building U values being much greater than the predicted range. The mean whole building U values that were measured ranged from 0.18 to 0.98 W/m2K, with a median of 0.58 W/m2K and an interquartile range of 0.22 W/m2K, whilst the predicted steady state whole building U values ranged from 0.17 to 0.52 W/m2K, with a median of 0.34 W/m2K and an interquartile range of 0.12 W/m2K.
Measured and predicted steady state whole building U value of the Leeds Beckett new build coheating database. Frequency distribution of whole building U value of the Leeds Beckett new build coheating database.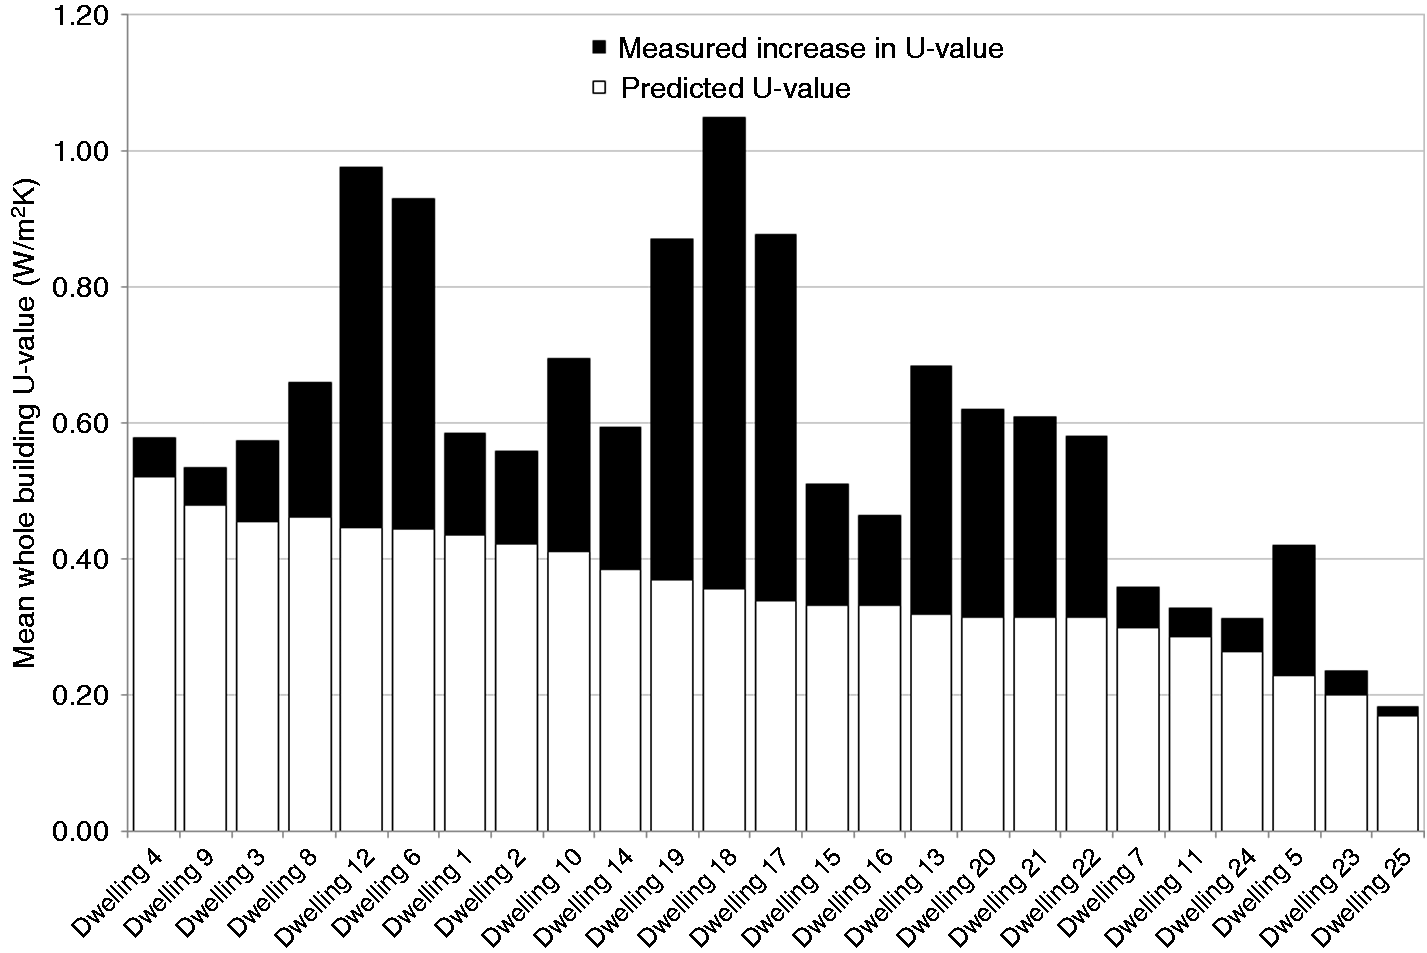
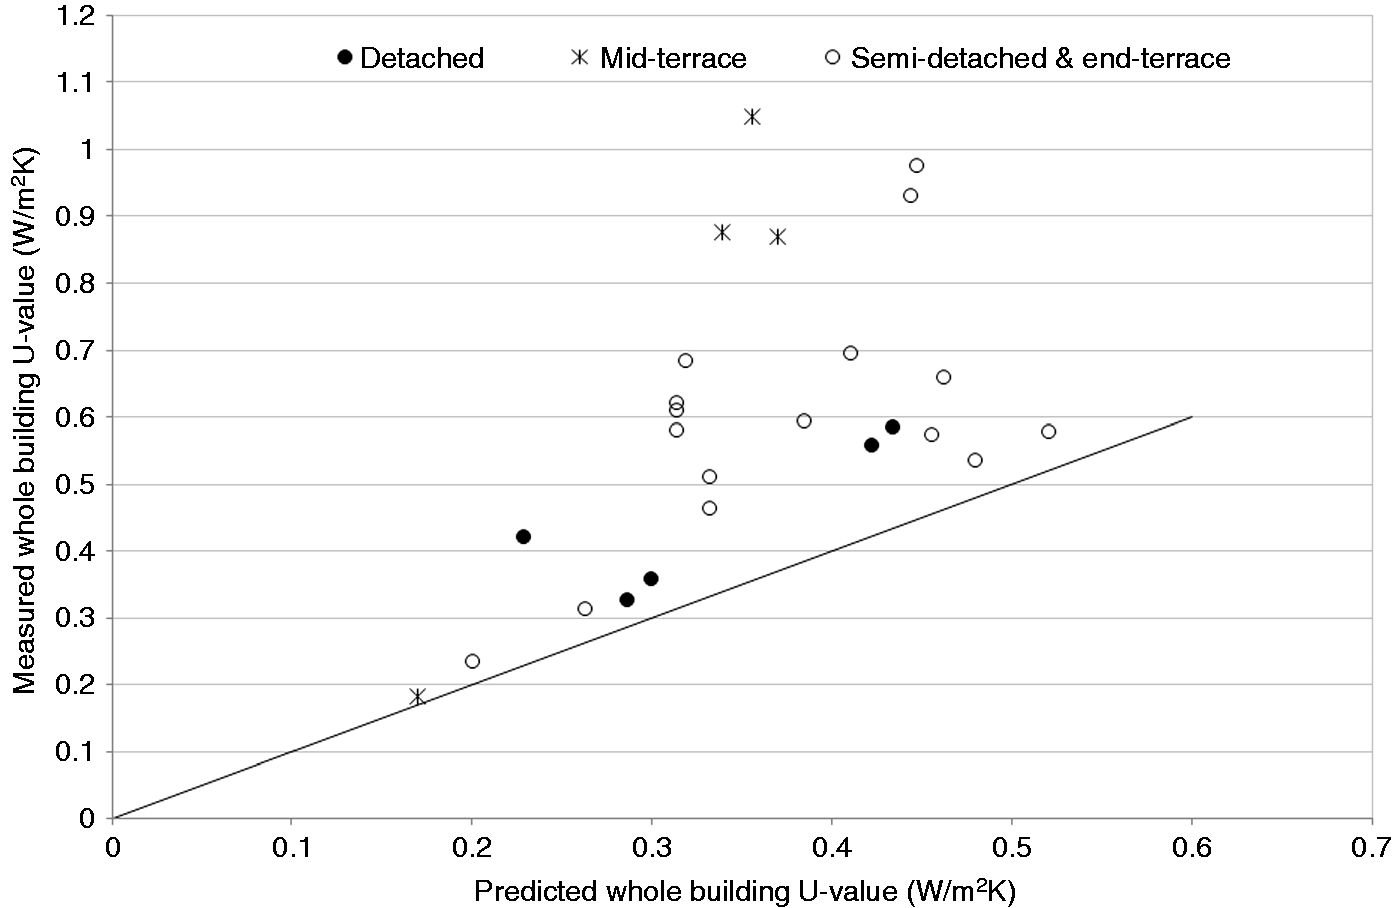
A simple linear regression analysis has also been undertaken to establish the relationship between the predicted and measured whole building U value (see Figure 7). Analysis of the data indicates that the measured whole building U value is just over 1.6 times the steady state predicted whole building U value. However, the value of r2 obtained from the regression analysis is very low (0.31). Again, the poor fit of the regression model is most probably due to the size and nonrandom nature of the sample. If this data is also analysed in terms of dwelling form and main external wall construction type (see Figures 8 and 9), a number of interesting trends become apparent. Analysis of the data in terms of dwelling form (note 3) suggests that detached dwellings tend to perform much better than the other dwelling forms, with mid-terraced dwellings, on the whole, performing significantly worse than any other dwelling form. This is more than likely attributable to the fact that all of the mid-terraced dwellings tested contained a party wall cavity and the majority of these dwellings were tested prior to the implementation of the Building Regulations Part L1A 2010,
27
which for the first time addressed the heat losses attributable to the party wall bypass.
28
As all of the mid-terraced dwellings tested contained two party cavity walls, the heat loss would be proportionately greater in these dwellings than other dwelling forms of equivalent size, as the party wall (note 4) can be one of the most dominant heat loss areas in such dwellings. It is highly probable that since the introduction of Part L1A 2010, the heat losses associated with mid-terraced dwellings, and other dwellings that contain a party cavity wall, will have reduced.
Predicted versus measured whole building U value of the Leeds Beckett coheating database. Predicted versus whole building U value by main dwelling form. Predicted versus whole building U value by main external wall construction.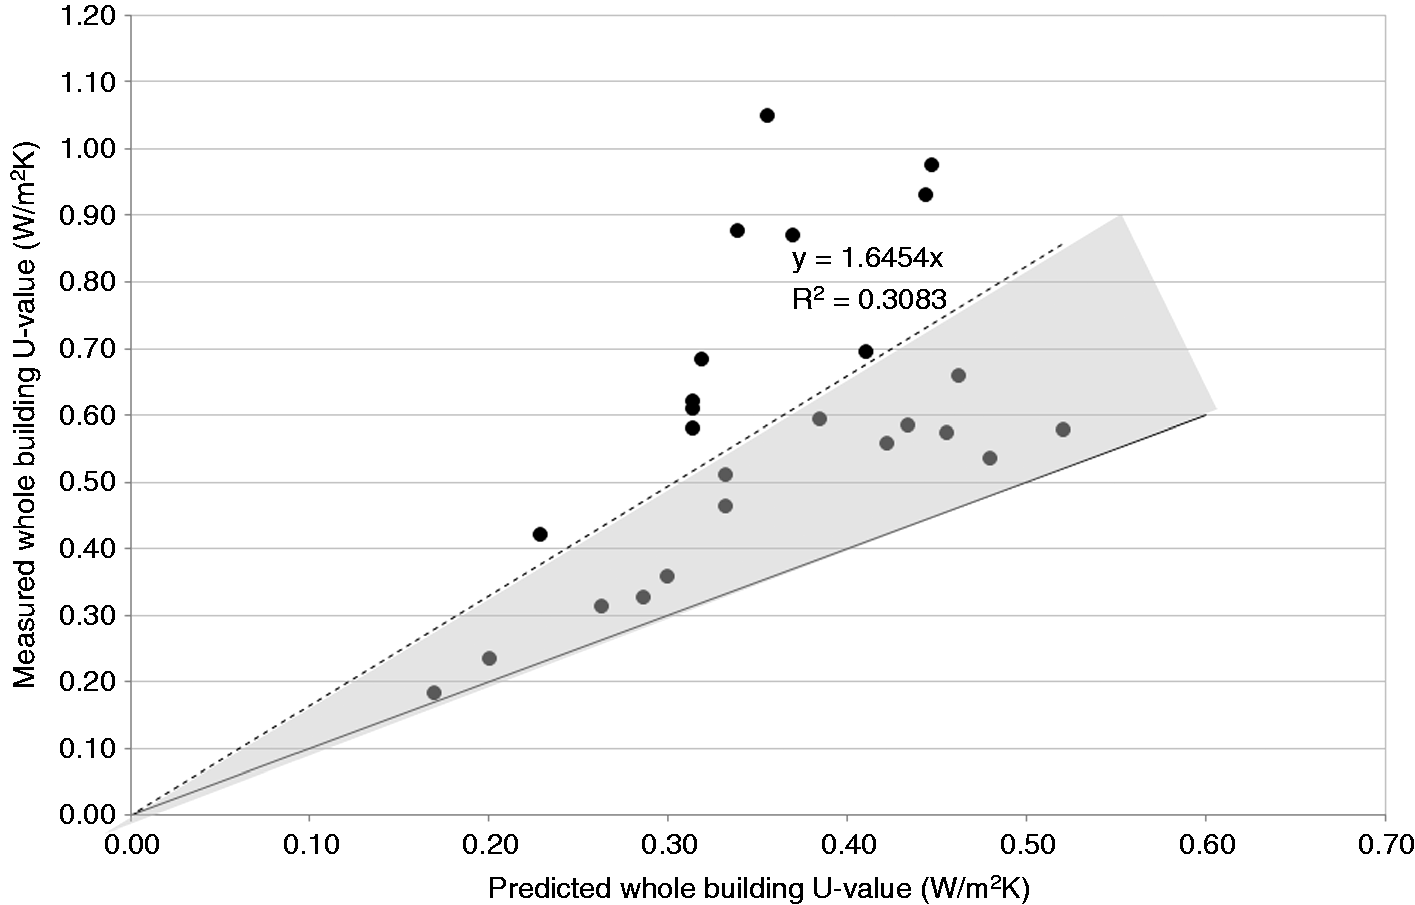
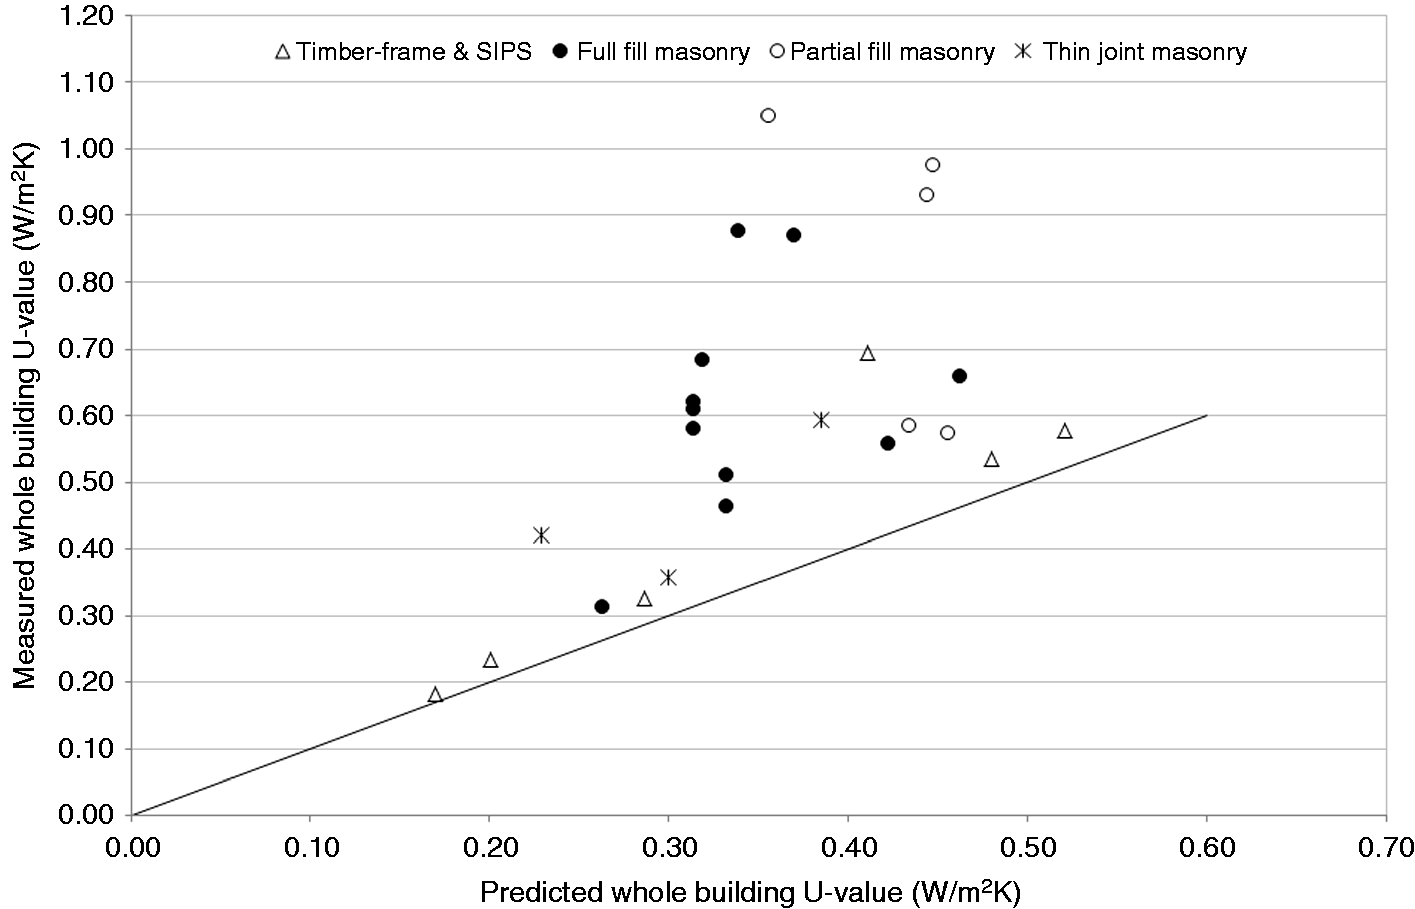
If the data is analysed with respect to the main external wall type, timber frame and Structurally Insulated Panel System (SIPS) dwellings tend to outperform the other construction types by a considerable margin. The worst performing external wall construction type appears to be partial fill masonry. Part of the reason for this may be related to the susceptibility of this construction method to workmanship and assembly issues. For instance, if the partial fill boards are not fully taped and the boards are not fitted flush to the outer face of the inner blockwork leaf, then there is the potential for thermal bypassing and wind washing, which will result in a degradation of the in situ U value.
Conclusions
The coheating test results from 25 new build dwellings that were built to meet or exceed Part L1A 2006 have been analysed in order to quantify the size of building fabric ‘performance gap’. Although it has only been possible to make a number of qualitative comments regarding the coheating test results, due to the small and nonrandom nature of the dwellings tested, the results indicate that a very wide range of fabric performance exists within the UK and the measured fabric performance exceeded the predicted performance in all of the dwellings, resulting in a building fabric ‘performance gap’. More importantly, in the majority of the dwellings tested, the size of the ‘performance gap’ was considerable. If a simple linear regression analysis is undertaken on the aggregate data, the measured HLC is almost 1½ times the steady state predicted HLC. This will have significant implications in terms of the energy and CO2 emissions attributable to these dwellings in use.
Even when the coheating test data is normalised to account for varying dwelling size, using whole building U value, a significant building fabric ‘performance gap’ exists, with the measured whole building U value being just over 1.6 times that predicted. Closer analysis of the data suggests that the size of the ‘performance gap’ varies depending upon the dwelling form and the main external wall construction types. The poorest performing dwelling form is mid-terraced dwellings, which tend to have a much larger ‘performance gap’ than all of the other dwelling forms. The reason for this is most likely to be attributable to the additional heat losses associated with the party wall bypass, which had not been addressed by Part L of the Building Regulations when the majority of these dwellings were constructed. In terms of construction type, the worst performing construction form is partial fill masonry, which can be particularly susceptible to thermal bypassing and wind washing if it is not assembled correctly or if the levels of workmanship are poor.
If one also considers that the sample of dwellings tested is likely to be biased towards dwellings that have a higher fabric performance than is the norm for new build dwellings, then the results are even more significant, as the size of the ‘performance gap’ for new build speculative housing may be even greater than that documented within this paper. However, some of this additional ‘gap’ will be counteracted by the fact that the party wall thermal bypass has since been addressed in the Building Regulations.
The results also illustrate the importance of undertaking a large-scale testing programme to produce a much larger, more representative and ultimately more powerful dataset. This dataset could be used by industry to apply suitable tolerances to new build dwellings that account for the ‘performance gap’, which are specific to form and construction type.
Footnotes
Acknowledgements
The authors would also like to thank Dr Jez Wingfield of the National Energy Foundation (formerly of Leeds Metropolitan University) who developed an earlier version of the Leeds Beckett University coheating database.
Funding
The authors gratefully acknowledge the assistance, funding and support given by the following organisations when undertaking the coheating tests referred to within this paper: Joseph Rowntree Housing Trust (JRHT), Mineral Wool Insulation Manufacturers Association (MIMA), National Trust, ODPM (now DCLG) and the Technology Strategy Board (now Innovate UK).