
Abstract
Natural ventilation is a simple and energy-efficient method to adjust the indoor environment. This study aims to develop a model for predicting the total flow rate of single-sided natural ventilation. It is motivated by the fact that the wind-driven ventilation itself is commonly considered to consist two components – a mean component and a fluctuating component. Pulsating flow rate, mean and broadband ventilation rate are discussed and considered in the model due to fluctuating wind velocity driven by the fluctuating pressures and unsteady flows around the opening. The new model shows that the total flow rate is majorly caused by pulsating flow when the area of opening is small, but it is mainly caused by mean flow in the case of large opening. Opening ratio can be taken as a boundary to distinguish the small opening area and the larger one from the case analyses in this study. Reynolds Averaged Navier-Stoke model, large eddy simulation, and other correlations are utilized to validate the developed model. The results of current method agree reasonably well with those of transient simulation. Finally, a simplified version of the model is developed which is useful for predicting the total flow rate of natural ventilation in buildings.
Introduction
Natural ventilation is a simple method to improve the indoor thermal comfort, maintain acceptable indoor air quality, and reduce energy consumption. Natural ventilation inside buildings can be categorised into air pressure ventilation, known as wind force, and stack effect ventilation or thermal force, and the patterns of it can be classified into single-sided ventilation and double-sided or cross-ventilation. 1 Cross-ventilation is often favored for its larger air exchange rate than the single-sided ventilation. However, single-sided ventilation is still of great importance in building designs. 2
Previous works on the ventilation rate model of single-sided ventilation
In order to calculate the ventilation rate of single-sided ventilation in buildings, some empirical correlations that can provide rapid estimations have been proposed in earlier studies. Warren
3
discussed the mechanisms available for single-sided ventilation and described a simple approach to its prediction, based on a combination of theoretical modeling, wind tunnel studies and tracer gas measurements in full-scale buildings. The simple equation for wind-driven natural ventilation is given as equation (1)

De Gids and Phaff
4
proposed an empirical expression based on 33 measurements on full-scale buildings, applicable in the case of combination of wind and stack effects. Their model is as given in equation (2)

Based on the study of De Gids and Phaff,
4
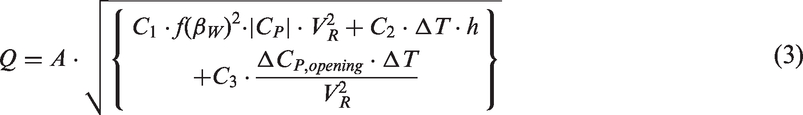
Larsen and Heiselberg
5
derived a more complex correlation as represented by equation (3), which takes into account of the wind direction.
In addition to the above analytical models, Dascalaki et al. 6 carried out four single-sided ventilation experiments in a full-scale outdoor test cell facility and presented the results of an investigation into the relationship between the air velocity at the opening and the bulk air flow rate measurements. Li et al. 7 presented a basic and consistent pressure-based formulation on natural ventilation of multi-zone buildings with multiple openings for both buoyancy and wind-driven flows. In their study, the opening width is divided into some sub-openings. The method is simple but numerical integration needed. Caciolo et al. 8 compared Warren’s correlation 3 with CFD and experimental results. It was found that this correlation captures well the stack and wind effects in windward conditions but shows poor results in leeward conditions. Thus, a new correlation had been developed by using CFD simulations in leeward conditions. The new correlation was then compared with the full-scale experiments and concords well.
However, the major difficulty with those correlations is the prediction of the fluctuating ventilation rate when they are applied in the unsteady condition. 2
The wind-driven natural ventilation through a building consists of two components – a mean component driven by the mean pressure field at the ventilation openings and a fluctuating component driven by the fluctuating pressures and unsteady flows around the openings. 9 The mean component is likely to be dominant when there are a number of openings around the buildings, in regions of different wind-induced pressures. The fluctuating component is likely to be dominant when there is only one major opening on the building, or where all openings are in regions of similar pressure. 9 The mean flow rate is approximately zero in the latter case, but it is not in the former case.
Techniques to predict the fluctuating air infiltration have earlier been investigated and developed. The latest review about it has been carried out by Haghighat et al. 10 According to the main features of turbulent wind and solving methods, they classified the approaches of fluctuating infiltration modeling to different groups: pulsation, 11 mechanical-system simulation, 12 correlation,13–15 numerical simulation, 16 resonator, 17 and power spectrum analysis. 18 For instance, this pulsation model is based on the pulsating flow of single open enclosure, caused by longitudinal fluctuations of wind and the compressibility of air within the enclosure. 11 In the resonator model, the fluctuating internal pressures are obtained numerically from second-order non-linear differential equation. 17
Simultaneously, Etheridge19,20 studied the effects of unsteady wind pressures on the mean flow rates and the instantaneous flow rates in certain types of purposed-designed naturally ventilated buildings and derived a procedure for calculating the mean flow rates when the unsteady effects are large.
Malinowski 21 pointed out that the fluctuating component of ventilation can be considered to consist of a number of distinct phenomena. The first mechanism is broadband ventilation, the second is pulsating flow, and the third is known as eddy penetration, or shear layer ventilation. Straw et al. 9 analyzed the relative magnitudes of the ventilation produced by the various fluctuating flow mechanisms (broad band, resonant and shear layer) and discussed the methods for calculating the total ventilation rate from the mean and the fluctuating components based on cross-ventilation.
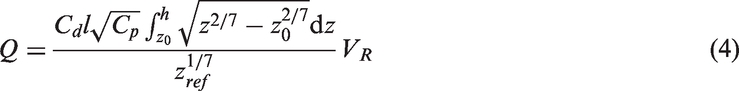
Wang and Chen
2
presented an empirical model for predicting single-sided, wind-driven natural ventilation in buildings, without considering broadband ventilation. Their governing equation of the model is based on the non-uniform pressure distribution along the opening height. The instantaneous flow rate is as defined by equation (4)
The wind velocity can be decomposed into mean and fluctuating velocity as


Previous works on numerical simulation with unsteady wind pressure
CFD is a useful tool for the prediction of air movement in ventilated spaces. 22 It is usually utilized to investigate ventilation flows and focused on the mean flow properties23,24 and fluctuating characteristics of flow.25–30 Bu and Kato 27 performed both wind tunnel experiments and numerical simulations ((Reynolds Averaged Navier-Stoke (RANS) method and large eddy simulation (LES) method) on a scale model with the focus on wind-driven natural ventilation in a basement with a single-sided opening. The comparisons between the experiment and the simulation indicated that LES can provide more accurate results than RANS. Hu et al. 28 used an LES method to investigate the fluctuating flow rate induced by wind with a CFD code capable of generating time dependent and unsteady inflows. Simulations were carried out for different wind directions and the results were in good agreement with experimental data. Jiang and Chen 29 compared different methods (on-site measurement, wind tunnel, and numerical simulation) researching the natural ventilation and concluded that LES can successfully simulate cross-ventilation in both cases by changing or fixing oncoming wind direction and the simulation results agree reasonably with the corresponding experimental data. It should be noted that air is considered as incompressible fluid in all the above studies22–29 because of low wind velocity and small Mach number.
Two important issues have been highly regarded in numerical simulation of natural ventilation. The first one is suitable methods of turbulent numerical simulation. RANS and LES models are often used to predict single-sided natural ventilation. RANS models provide effective time-average solutions while LES models provide more realistic results. It is superior to others in calculation of single-sided ventilation under the condition of unsteady wind pressure.30,31 Ai and Mak
32
compared the predictive methods of flow rate in single-sided ventilation based on both the RANS and LES models. It was concluded that
The second problem is the inflow turbulence boundary. The importance of defining proper inflow turbulence boundary condition while using LES was discussed by various researchers.33–36 Keating et al. 37 classified the techniques used to generate inflow turbulence for LES into three categories: cyclic boundary conditions, synthetic turbulence, and the method of precursor database that has been employed previously in wind engineering application but is computationally costly and not preferable unless the first simulation stage already exists and extensive turbulence velocity database is available corresponding to various exposure conditions.38,39 The drawback with all recycling methods is associated with the high computational cost to run the driver domain flow simulation compared to other methods such as synthesizing inflow turbulence. 40 Synthesizing inflow turbulence does not require costly prior flow simulations and high computational cost, making it a more robust approach provided that the target flow statistics are met satisfactorily. 41 Spectral synthesizer42,43 belongs to the last method, which has been adopted by Fluent software. 44
Aim of the work
The objective of the current study is to analyze and discuss the ventilation rate model of single-sided, wind-driven natural ventilation in buildings. With the opening located on the center of the windward wall of the building, it is assumed that the wind direction is perpendicular to the plane of the opening. The first section of this paper discussed the models of mean, broadband ventilation rate, and pulsating flow rate, which is followed by the possible method of calculating total ventilation rate. Finally, CFD studies and other models are utilized to verify the method. In the following numerical calculation, the LES simulation and the fluctuating velocity algorithm of Spectral Synthesizer are assumed to supply basic results to verify the validity of the model.
Model development
The fluctuating flow is totally governed by three mechanisms: broadband ventilation, pulsating flow, and eddy penetration. Therefore, the model developed in this investigation consists of four parts: (1) mean ventilation rate, (2) broadband ventilation rate, (3) pulsating flow rate, and (4) eddy penetration flow rate.
Mean and broadband ventilation
The mean flow is driven by the mean pressure field at the ventilation openings. Wang and Chen’s expression 2 is adopted here. Then, the mean flow rate can be calculated by equation (6).
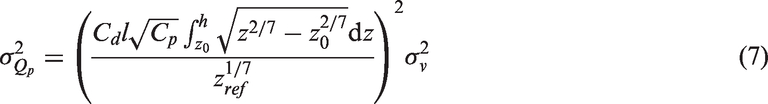
For equation (7), Wang and Chen take it as the pulsating flow rate.
2
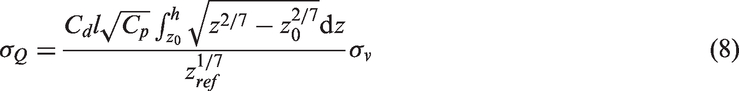
However, it only has relation with opening size and not the building volume. As Straw et al.
9
pointed out, broadband ventilation represents surface pressure fluctuations at the opening across a wide range of frequencies, and it can effectively be regarded as a modification of the mean ventilation mechanism. For this reason, we consider that this flow rate is due to broadband ventilation. Then, broadband ventilation rate,
Straw et al.,
9
have deduced a formula to calculate the mean plus broadband ventilation rate for two openings, which is shown in equation (9). This applies equally in the present case and therefore, the mean plus broadband ventilation, QB, can be calculated as
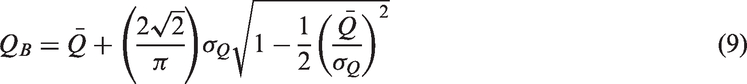
Equation (9) applies only for
Pulsating flow
Many researchers9,11,18 pointed out that pulsating flow is caused by a body of fluid being driven perpendicular to the opening by the difference between the external and internal pressures and is significantly affected by the geometry of the enclosure and air compressibility. The ventilation rate spectrum will have a peak at the Helmholtz resonant frequency of the enclosure, and for this reason, this mode can be called as resonant ventilation. 9
When calculating the resonant ventilation, the usual approach is to derive the momentum equation for each opening, for a slug of fluid that is forced in and out of the orifice by the difference between the internal and external pressures,17,18,45,46 and thus compressibility and inertia effects are taken into account. 9 Then, these non-linear equations are solved numerically or linearized using one of a number of approaches to produce equations that are analytically tractable. 9
In our early study,
47
a simple model (hereafter Hu’s model) has been proposed which can predict the pulsating flow rate of single-sided ventilation when the wind direction is perpendicular to the opening plane. If only the pulsating flow is considered, it can be assumed that the wind direction over a small opening area is uniform over a short period of time. Then a transfer function of indoor and outdoor fluctuating wind pressure can be constructed by taking compressibility of indoor air and inertia of air at the opening into consideration. Finally, the model of calculating pulsating ventilation rate for single-sided ventilation can be deduced
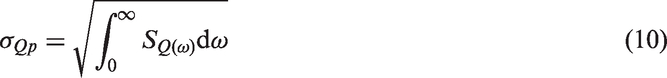
The power spectrum of ventilation rate


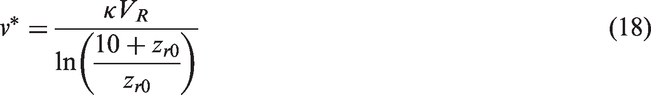
With the given values of reference mean velocity, roughness parameter (drag coefficient), opening area, and volume of room, the RMS value of pulsating flow rate
Comparison of different pulsating flow rate models.
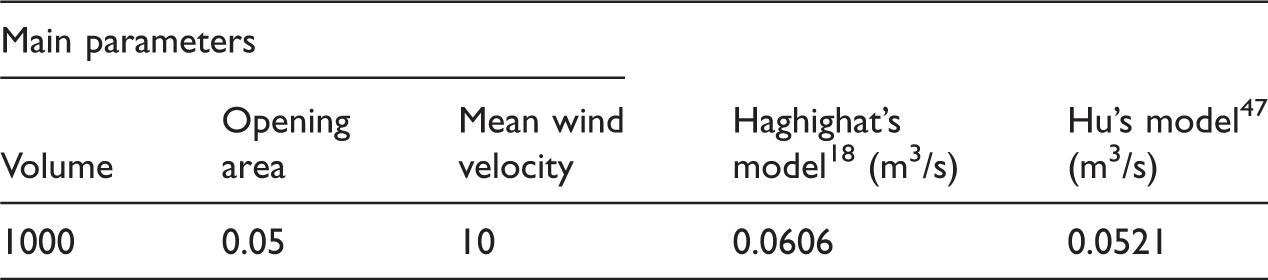
The results calculated by Haghighat’s model and Hu’s model have the same order of magnitude, and the relative difference between them is about 14% when Haghighat’s result is set as the reference value. Besides, similar expressions about the effect of opening area and building volume on pulsating flow rate as Haghighat’s study were obtained in Hu’s study. 47 Therefore, Hu’s model is used in this study to calculate the pulsating flow rate.
It should be noted that Cockroft and Robertson 11 also derived a theoretical model to assist in understanding the physical phenomena causing airflow through a single opening. However, the case results of their model and Hu’s model are not in the same magnitude. It is probably because the model of Cockroft and Robertson concentrates on the study of the low-frequency pulsating airflow through the opening.
Eddy penetration flow
Wang and Chen studied the effect of eddy penetration in the frequency domain based on fast Fourier transform. 2 Straw et al. 9 derived a simple formula for the prediction of fluctuating shear layer ventilation that needs further verification and calibration before it can be widely used. Chu et al. 49 also proposed different methods for calculating the fluctuating ventilation rate due to eddy penetration. Wang and Chen’s investigation found that the eddy penetration was zero when the wind incident angle was 0° due to zero parallel velocity, and the penetration was low when the angle was around 70° due to the low absolute pressure coefficient. 2 Therefore, the flow rate due to eddy penetration is ignored here because the wind direction is assumed to be perpendicular to the opening plane and the opening is located on the centre of the wall in this study.
Total flow rate
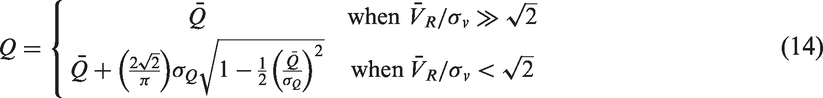
The case of the fluctuating infiltration of a small opening is special. The mean airflow rate through the opening is zero.
15
Therefore, the total flow rate is majorly caused by pulsating flow. Assuming to a first approximation that the variation is sinusoidal, the ventilation due to pulsating flow mechanism can be shown to be given as9,50

When the opening area is large, the main driving force is the pressure difference between upper zone and lower zone of the opening. Therefore, the pulsating flow rate can be ignored. Then, the total flow rate takes the form of (hereafter analytical model)

Numerical simulation
Domain size and discretization
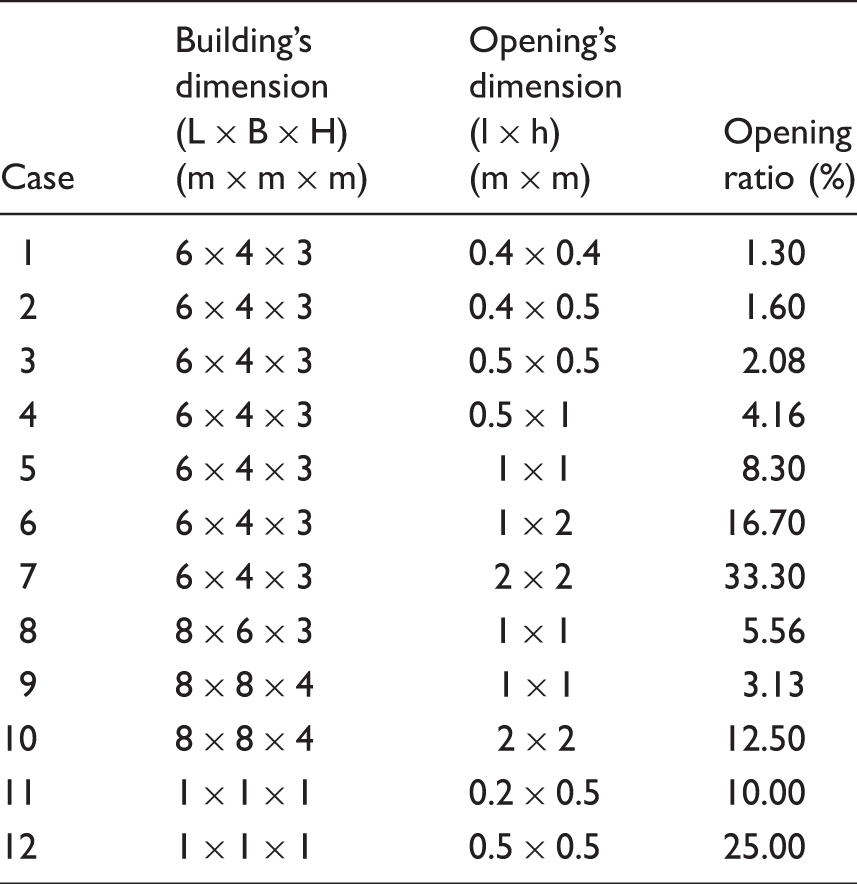
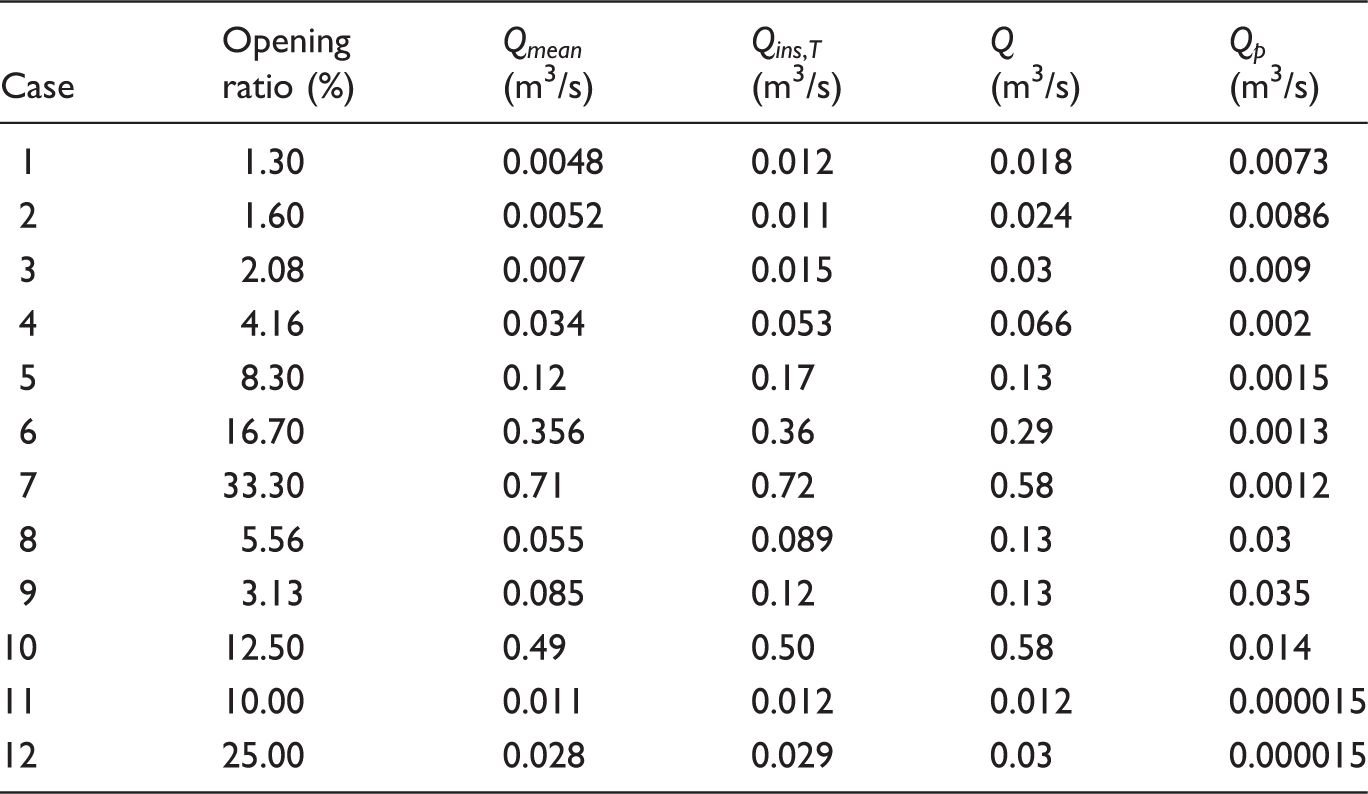
The computational domain and building geometry are shown in Figure 1. The building dimension is L × B × H, and the opening with dimension of l × h is in the center of upwind wall, which are listed in Table 2. The last column of the table is opening ratio, α, that represents the ratio of opening area to wall area. The incident direction of wind is perpendicular to the opening plane.
The computational zone and building model. Geometric characteristic parameter of all cases;VR = 2.5 m/s.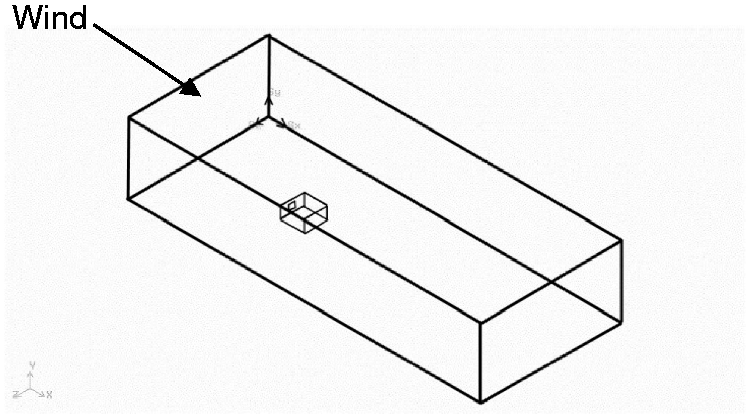
Based on the guidelines,
51
the lateral and the top boundary are both set to be 5H away from the building, and the inlet and outflow boundary are set to be 8H and 20H away from the building, respectively. Therefore, the dimension of whole computational domain is (L + 28H) ×(B + 10H) × (6H). The blockage ratios of all cases are below 3%. The domain is constructed using hexahedral gird (Figure 2). The grid is refined in the vicinity of the ground surface, the walls, and the opening, with a minimum grid size of 0.02 m for the wall containing the opening, 0.1 m for the ground surface. Mesh number independence is tested. Mesh systems, such as 1.1 Computational grid of the zone.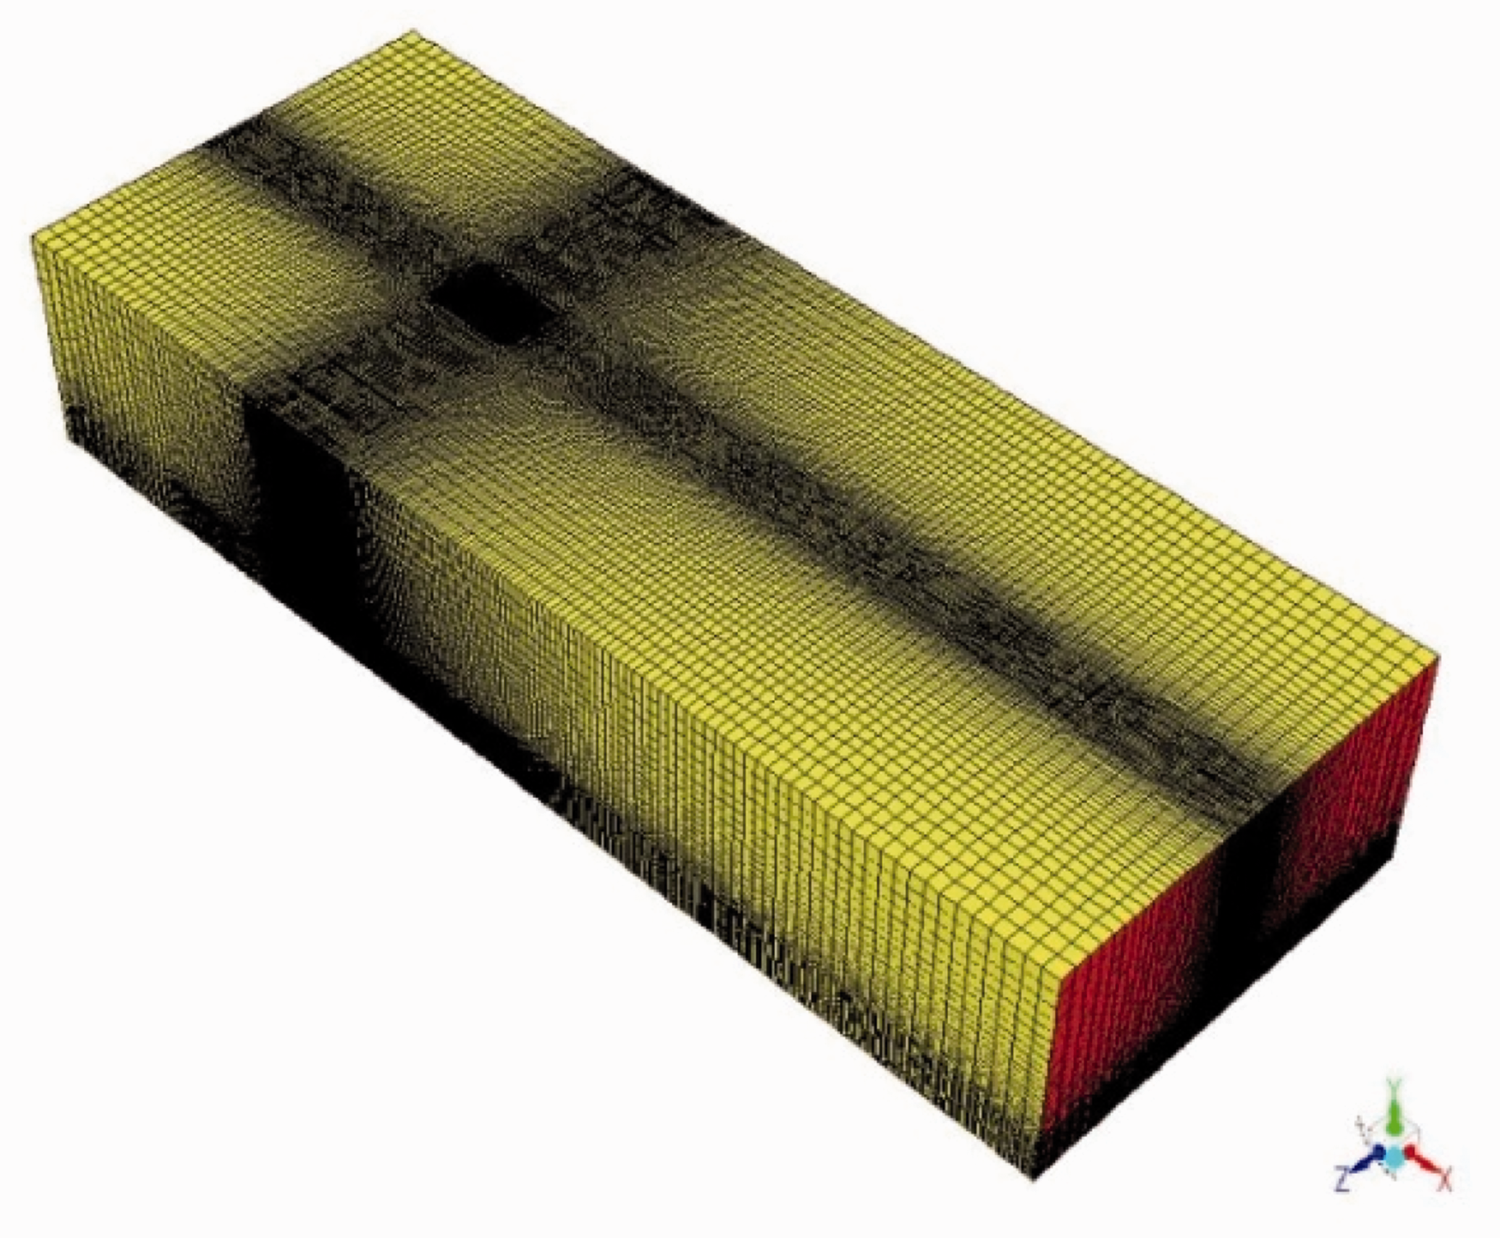
Incompressible, steady RANS simulations
RANS models have the most appeal for industrial applications due to their relatively low cost of computation, while still reasonably matching the field and experimental observations. RNG
In RANS simulation, it is solved by using the solution algorithm of segregated solver. The second-order upwind scheme is used for the discretization of momentum, turbulent kinetic energy, and turbulent dissipation rate.
Pressure and velocity are coupled using the SIMPLE algorithm. Solution is considered converged when all residuals decrease to 1.0e-04. When first convergence is reached, Yplus adaption is performed. Then the case is simulated again. Finally, Yplus values range from 30 to 400.
Incompressible, LES simulations
RNG
Boundary condition
The velocity inflow boundary condition is employed here. The vertical profiles for 


The top and sides of the computational domain are given symmetry boundary conditions. All the walls, floor, and ground surfaces are set as no-slip wall condition. For the outlet of the zone, outflow boundary condition is utilized.
All the above boundary conditions are employed in both RANS and LES simulations. The main difference lies in the method of spectral synthesizer,42,43 which is adopted in LES simulations to generate fluctuating inflow velocity.
Calculating method of the single-sided ventilation rate
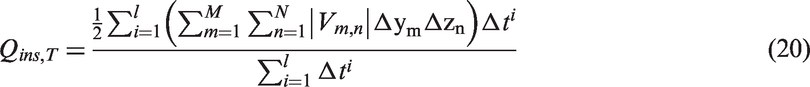
The integration of opening velocities is utilized to calculate the single-sided ventilation rate
32
Results and analysis
Comparison of steady-state simulation and transient simulation
RNG
Figure 3 shows the horizontal component of oncoming wind of the inlet on the height of 10 m. Different from the constant velocity of 2.5 m/s in steady-state simulation, the inlet velocity of transient simulation is time variant. The coordinate of monitor point is (0, 10, 5H + 0.5B), and it is also the center point of the inlet plane on the height of 10 m.
Horizontal wind velocity of the inlet boundary changing with time in LES simulation (center point on the height of 10 m).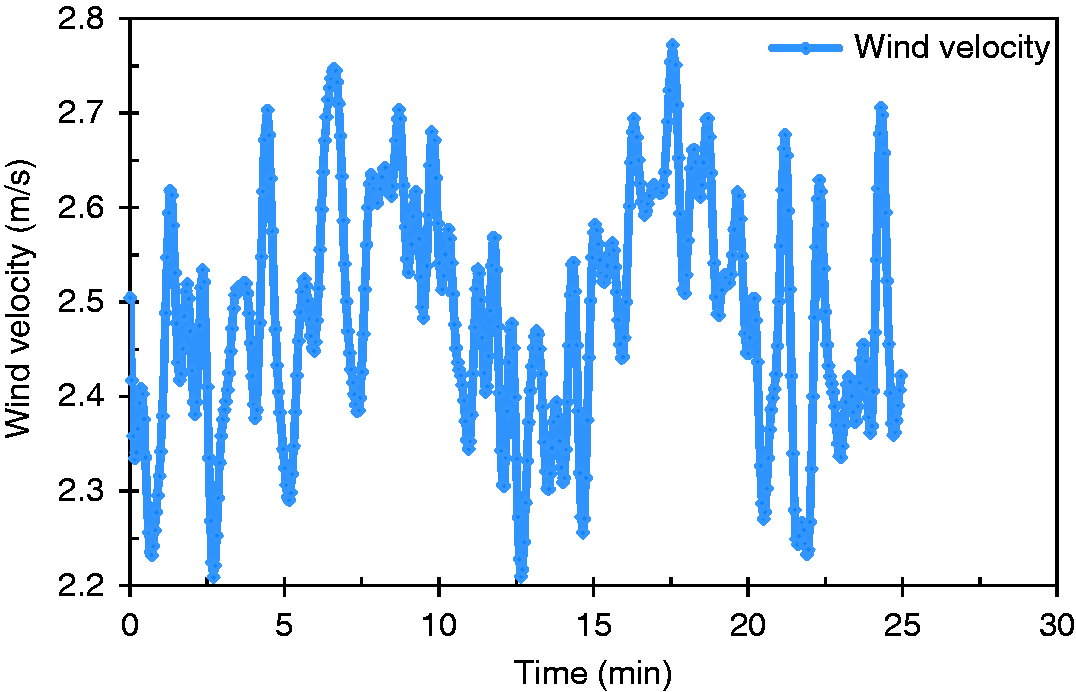
In the process of LES simulation, horizontal velocity is also exported along the central line of the inlet plane. Figure 4 compares the wind velocity profiles used by LES model and RNG Comparison of the mean wind velocity profile and an instantaneous profile at the inlet boundary on the centre line.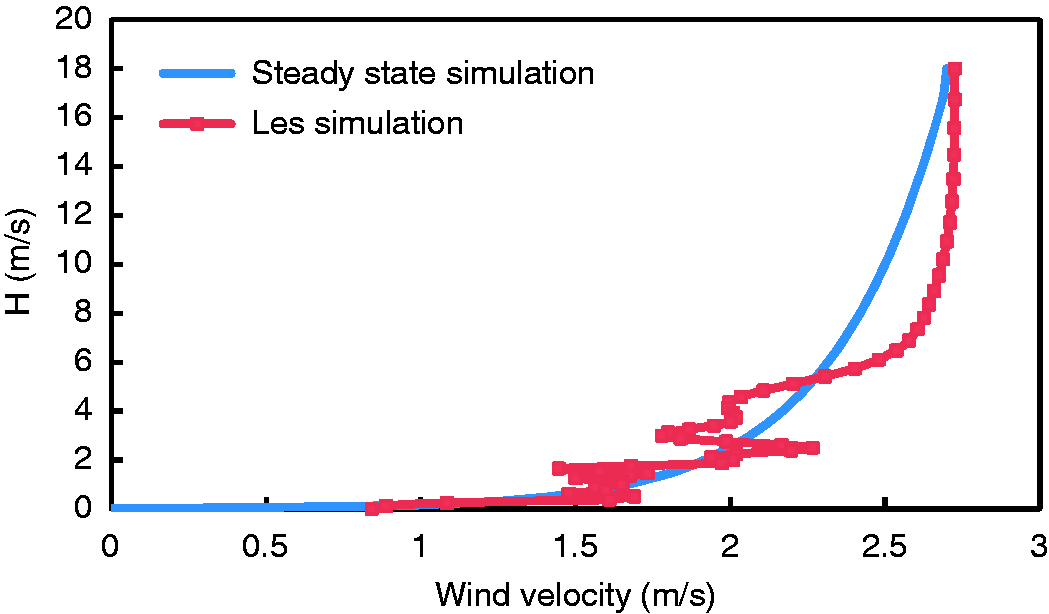
Flow rate calculated by numerical simulations and current models. a
The relative difference (ventilation rates of steady-state simulation and LES simulation) changing with opening ratio.
The effect of opening area
In all cases, the building dimensions are the same from case 1 to case 7. Then, it is possible to analyze the effect of opening area on the ventilation rate.
As many correlations2–5 have described, Table 3 also shows that
Threshold of opening ratio
As discussed above, the total flow rate is caused by pulsating flow when the opening area is small. In this part, we try to compare the results for all cases, and then choose a threshold to show the service conditions of equations (13) and (14). It is should be noted that air is considered incompressible in our CFD study because of very small Mach number, and those results of LES simulations in Table 3 are assumed to present basic results.
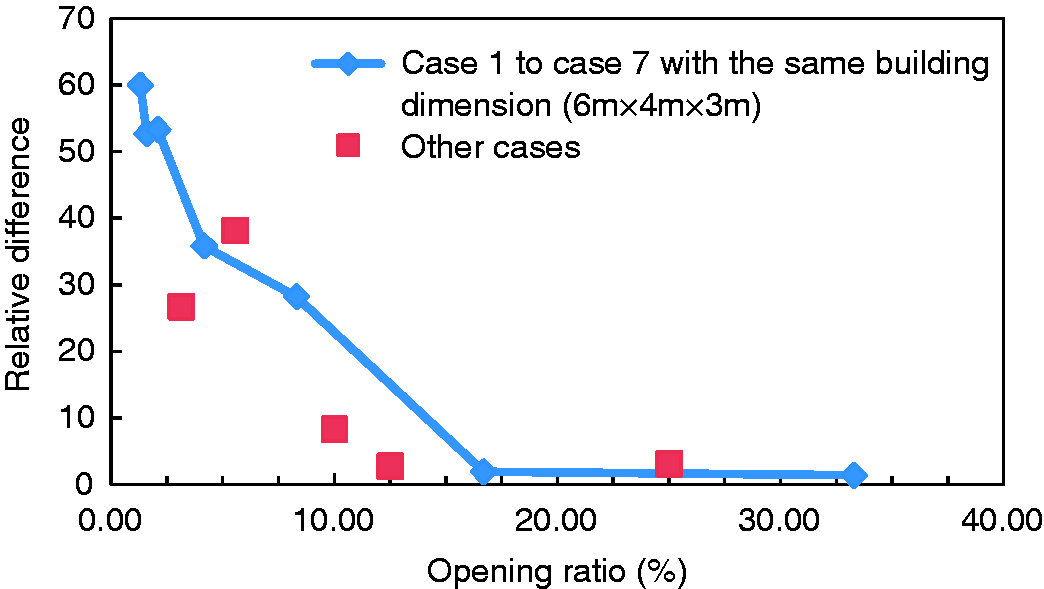
The fifth column summarizes the ventilation rate results calculated by analytical model, equation (14). Figure 6 ranks all cases and the relative difference by the value of opening ratio. It illustrates that the relative differences, The relative difference (ventilation rates of analytical model and LES simulation) changing with opening ratio.
Total flow rate
According to above discussion, the generally model of flow rate can be predicted by
The results of CFD (LES simulation that assumed to present basic results), current model, and other models3–5 are also compared in Figure 7. The temperature of indoor is considered as the same as outdoor in the calculation. Furthermore, all the air flowing into the enclosure do not necessarily contribute to the effective ventilation of the enclosure. Some of the inflowing air will be exhausted before mixing has a chance to occur. This proportion can be called as mixing coefficient.
11
The mixing coefficient describes the ratio of the amount of effective ventilation to the total calculating ventilation rate.
The ventilation rate calculated by CFD method, current model and other correlations.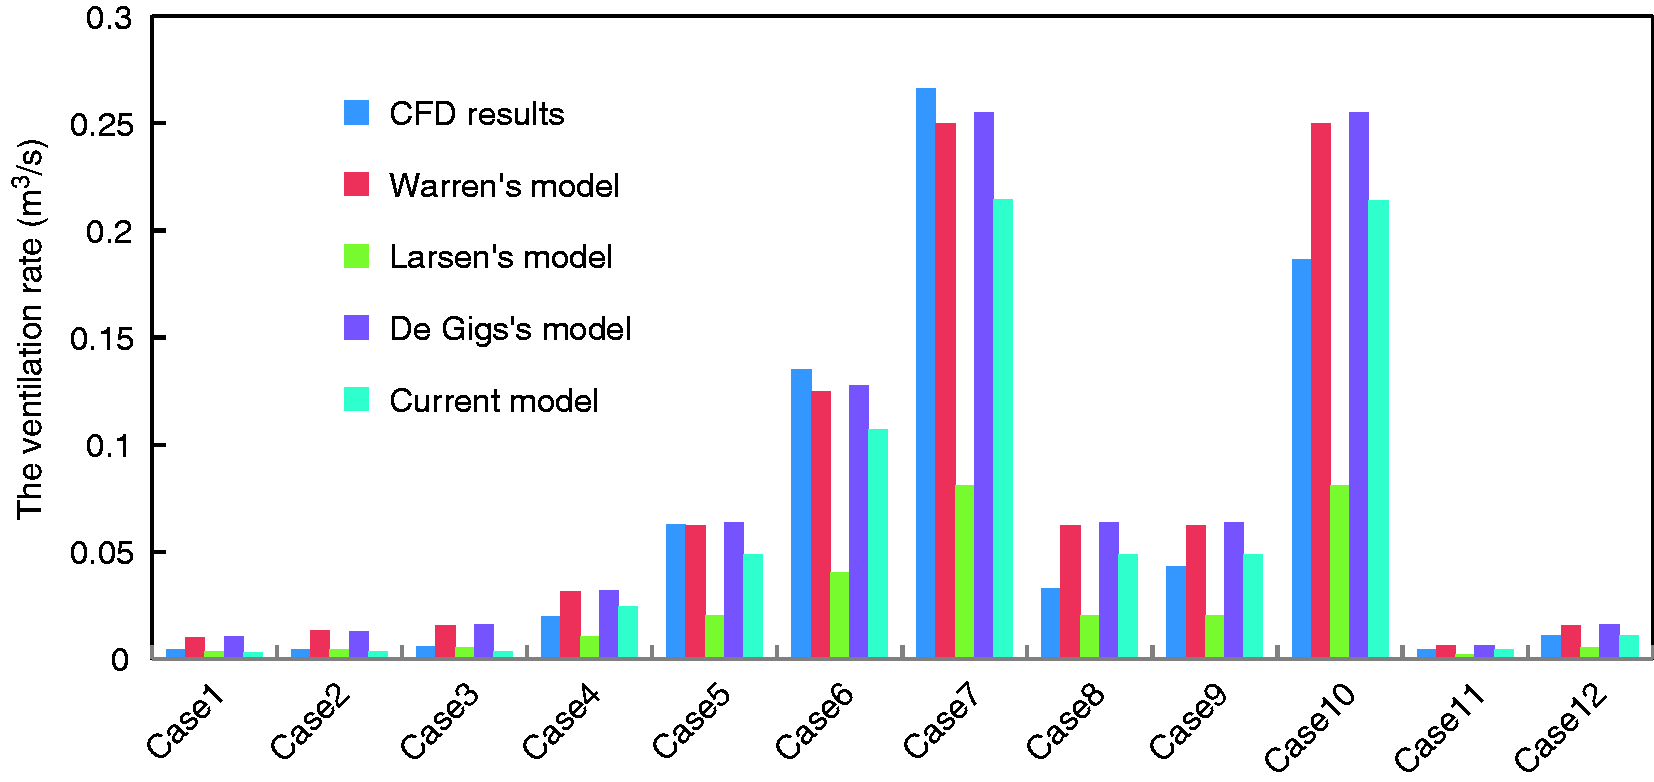
The study of Warren, 3 De Gids and Phaff 4 and Larsen and Heiselberg 5 about single-sided ventilation is based on experiments (their ventilation rate was calculated by trace gas decay method), so their results are considered as the effective ventilation rate. However, our study about the ventilation rate is based on the flow through the opening. Mixing coefficient should be considered here. A coefficient of 0.37 is employed to multiply CFD results and the current model to obtain an effective ventilation rate. 11
Figure 7 shows that Warren’s model and De Gids’s model basically resulted in the similar value of ventilation rate. Their model and current model overestimate the ventilation rate in most cases, but Larsen’s model underestimates it. The results of current model are in good agreement with CFD results, with the smallest average relative difference, 22%, compared to other models.
Further discussion
Random mean wind velocity
The value of mean wind velocity
However, the fluctuation of the mean wind velocity cannot be ignored, considering the unsteady condition in the study. The high frequency fluctuation of wind velocity has been treated in the Hu’s model 47 of pulsating flow rate, and then the low-frequency fluctuation should be weighed in the model of mean and broad band ventilation rate. The wind velocity can be easily measured when the field study of natural wind is possible. If not, mathematical methods can be utilized to get the data series of mean wind velocity, and then standard deviation of mean wind velocity can be obtained.
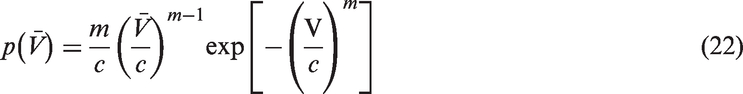
Although the mean wind velocity changes with time, it still has certain statistical regularity. By analyzing wind velocity’s probability density, it has been found that they generally conform to Weibull distribution. 56
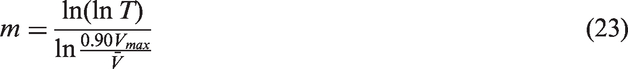
The probability density function of mean wind velocity can be described by
56


Two-parameter Weibull distribution can be utilized to get the data series of wind velocity, and then Samples of the mean wind velocity and associated flow rate.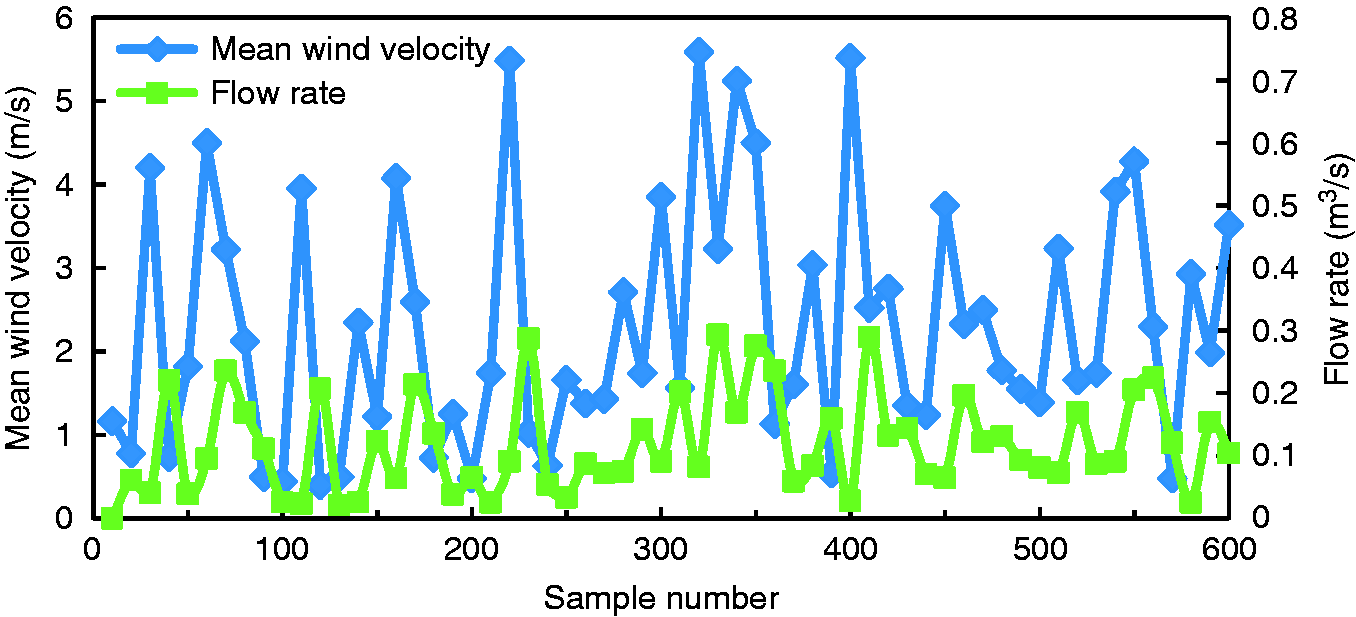
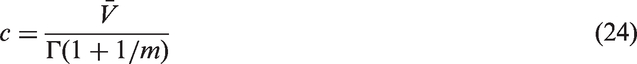
Further simplification of the model
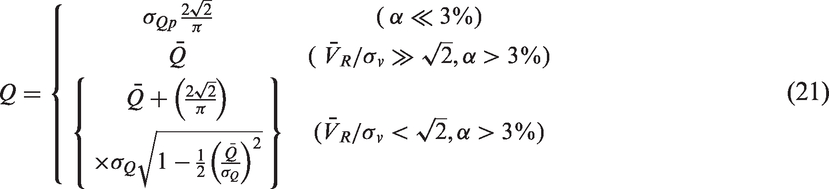
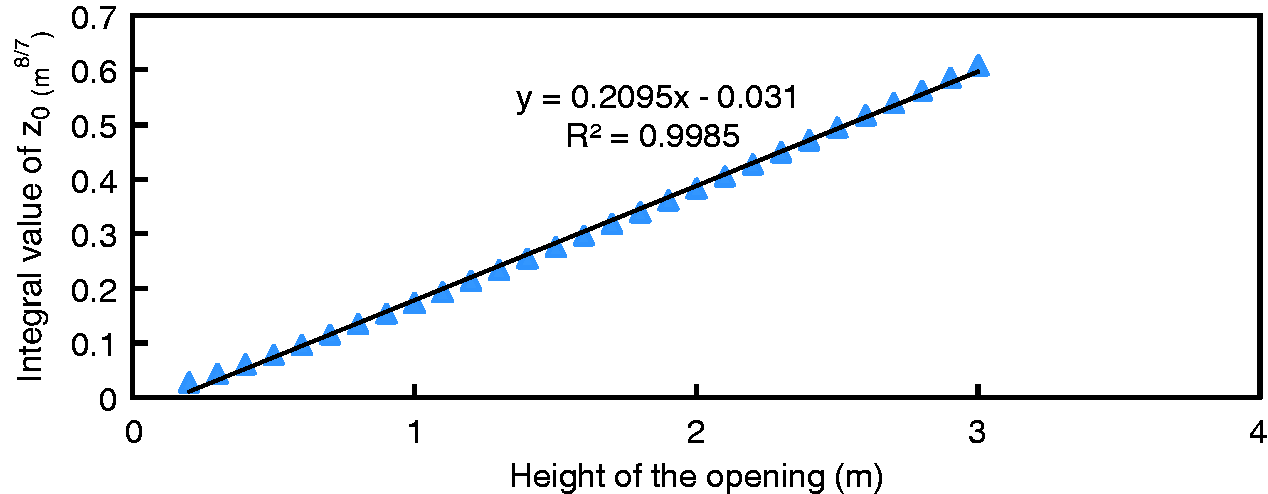
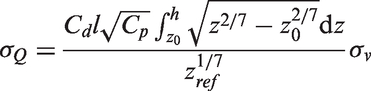
As shown in equation (21), the vertical position of the neutral plane and corresponding integral value should be calculated out according to Wang and Chen
2

By changing h from 0.2 m to 3 m, the integral values calculated by Matlab are depicted in Figure 9. It shows that the integral values grow linearly with opening height. Therefore, the integral value of neutral plane height (unit m8/7) can be estimated by
The integral values of neutral plane height for different opening heights (the value of equation (25)).
Therefore, 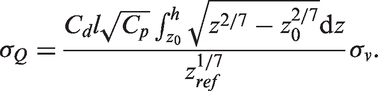
Other incidence angle of wind
It is assumed that the wind direction is perpendicular to the plane of the opening; therefore, the eddy penetration flow is ignored in this study. When other incidence angle of wind is considered, the ventilation rate due to eddy penetration should be counted. Chu’s model 49 can be used easily with the given wind velocity parallel to the opening. Besides, the mean broadband ventilation rates should be regarded as an important part of the total flow rate.
Wind pressure coefficients (Cp) are influenced by a wide range of parameters, including building geometry, facade detailing, position on the facade, the degree of exposure/sheltering, wind speed and wind direction. 57 There are many methods which are usually used to estimate the value of wind pressure coefficient with other wind direction, such as some databases,58–60 some equations,61–63 and so on. Therefore, the model presented in this study can also be applied to calculate the mean and broadband ventilation rate with other incidence angle of wind.
Terrain
The input parameter of pulsating flow rate model contains roughness parameter (drag coefficient in Davenport wind spectrum). It is set as 0.01 in our cases which represents the urban terrain. When other terrain is considered, it must be changed to corresponding value in the calculating program. As for the mean flow rate, the exponential term in calculating formula will change its value under the condition of other terrain. A similar but different formula of mean flow rate also needs further derivation.
Conclusions
Taking into account the fluctuating wind velocity driven by the fluctuating pressures and unsteady flows around the opening, this paper develops a model to predict the total flow rate of single-sided, wind-driven natural ventilation in buildings. In addition, several other correlations and CFD method are utilized to evaluate the performance of the model. The results of the current method agree with those of transient simulation basically.
The cases studied demonstrate that the total flow rate is mainly caused by the pulsating flow when the opening area is small in single-sided natural ventilation. When the opening area is large, the main driving force is pressure difference between upper zone and lower zone of the opening. Then the ventilation rate due to mean airflow is dominant. An opening ratio of 3% can be taken as a rough boundary to distinguish small opening and large one based on the CFD study. In the case of large opening, mean and broadband ventilation mechanisms should be counted together when the fluctuation component of mean wind velocity is large (
In general, the mean wind velocity varies with time. The two-parameter Weibull distribution can be utilized to obtain the set of samples of the mean wind velocity. Then standard deviation value of fluctuating component of mean wind velocity can be calculated, which is helpful for predicting broad band ventilation rate. Moreover, a linear correlation is obtained to calculate the mean and broadband ventilation rate, which can supply a quick estimate value.
It should be noted that the current model is derived with the opening located on the center of the windward wall of the building, and it is assumed that the wind direction is perpendicular to the plane of the opening. Therefore, the method to solve the mean plus broadband ventilation rate in other cases, such as other incidence angle of wind, other terrain and so on, should be explored in future studies.
Footnotes
Declaration of conflicting interests
The author(s) declared no potential conflicts of interest with respect to the research, authorship, and/or publication of this article.
Funding
The author(s) disclosed receipt of the following financial support for the research, authorship, and/or publication of this article: The work of this paper is financially supported by International S&T Cooperation Program of China (No. 2014DFA72190), the Research Funds of Key Laboratory of Heating and Air Conditioning, The Education Department of Henan Province (No. 2016HAC101), and ESI Discipline Promotion Foundation of WUT (No. 35400664).