
Abstract
The empirical investigation and development of a new Drainage Research Group drain-line carry test solid (DRG) for use in building drainage, waste and ventilation system research is described. The ‘shelf life’ of the National Bureau of Standards test solid used historically (NBS solid) was short and variability in results was large, making it problematic for use in extended investigative work. Further investigations revealed that the materials used in its construction were porous and osmosis would be a contributing factor to the variability observed, as would biofilm growth, causing changes in the coefficients of kinetic and static friction. This research is timely in view of the changing (i.e. generally reducing) volume and energy of contemporary discharges through water conservation initiatives such as WaterWise. Modern materials and analytical techniques present an opportunity to update the NBS solid and develop a modern alternative for research. The results from laboratory testing of the DRG solid compare favourably to the results from the NBS solid. The current mathematical description of the behaviour of a test solid used in a computer-based simulation model (DRAINET) is expanded and updated to include the new findings, creating the potential for extensive follow-on uptake of these results and use by other researchers and potentially use as a standard.
Keywords
Introduction
The field of building drainage waste and vent (DWV) system research has progressed in several areas over many decades. Early work focused on self-cleansing velocity, 1 but this work was based on appliance discharge volumes that were greater than those used today.2–4 Population demographics have also changed and while the population and number of low or single occupancy houses has increased, there has only been a small increase in the actual volume of water consumed. 5 This has led to a reduction in the energy associated with the flow in building drainage pipes, which suggests that research in this well established, yet often overlooked field, is far from over.
In combination with this, very positive water conservation measures driven by such initiatives as WaterWise are reducing the amount of water used in the built environment generally,6,16 and of course this increase in efficiency is absolutely essential. This also includes the use of grey water sources. The overall result is a reduction in the flow rate of water through the DWV systems, which means that suspended matter will be retained for longer and at higher prevailing temperatures. This is likely to have a measureable effect on the solid transport characteristics of a building drainage system.7,8
Within building DWV systems, the flow of discharge water, the transport of waste solids and the movement of entrained air are all examples of unsteady flow phenomena that may be represented by the solution of the St. Venant equations.9,15,17 Many workers have conducted research into these aspects of DWV systems over recent decades 10 and the current building codes 11 have evolved to reflect this. The advent of modern computers over the last 20 years or so has increased the capacity for computer-based simulation of unsteady free surface water flows and associated discrete solid transport, which has facilitated this research.
A fundamental component of this research is empirical laboratory investigations for the purposes of calibration and ultimately, validation. Typical parameters would be pipe diameter and slope, discharge profile and frequency of use (i.e. diversity factor) and perhaps water quality due to common additives such as detergents. All of this research since the 1970s has relied on a standardized artificial solid for providing the quantitative basis for the solid transport element of DWV flow investigations.
By default, principally because there was no suitable alternative, the NBS solid has dominated this aspect of DWV flow research. It is worthy of note that no recent (i.e. within five years) research has been conducted on solid transport simulants. The NBS solid is composed of water-filled Visking tubing (similar to sausage casing), covered in muslin tubing tied off at each end and at two equidistant locations in the middle. A specified mould or cast is used to ensure repeatability. These require practice to manufacture and only around 33% are acceptable, even with experience.
Requirement for change
Through anecdotal evidence and during use in previous research by the author, it was noticed that the ‘shelf life’ of the NBS solid was around three days. It was also noticed that performance varied from day to day and also during a day. Further investigations revealed that the Visking tubing was porous and so an osmotic potential would exist in any system which contained a large enough body of water to be realistically usable in such research. The reason is that tap water used to fill the NBS solids would have different chemistry to a recirculation system and sump tank with a capacity of several tons of water which had possibly been in use for months. Furthermore, this effect would be regionally different according to how soft or hard the local water was. Coupled with this, an unquantifiable degree of biofilm would develop on the outside of the NBS solids over a period of days, or even one day during warm weather, altering the surface friction of the outer muslin tubing.
There is also a current need to progress DWV system research in view of the changing (i.e. generally reducing) volume and energy of contemporary discharges. Modern materials and analytical techniques present an opportunity to update the NBS solid and develop a modern alternative for research, and potentially for use as a standard.
This paper describes the investigation and development of a new test solid (the DRG), with comparison to historical NBS performance in the laboratory, and empirical derivation of new mathematical descriptions of DRG solid behaviour. Such mathematical descriptions are of interest academically, but they are essential for computer-based simulations which can predict the behaviour of test solids such as the DRG. A joint UKWIR/EPSRC CASE grant (14440031) funded work on water conservation consequences, which has led to the research reported here.
Impact and practical use
One example of an application is relevant to the development of the computer-based simulation package DRAINET. This includes the characteristics of the NBS solid in the form of approximations to the very varied behaviour typical of the NBS solid. It also uses the flow depth around the moving solid, which this paper updates to those of the DRG solid. Future work would include use of an extended DRAINET as a design and comparison tool, with particular emphasis on code formulation for future water use scenarios. Potential outcomes would include reduced maintenance and increased safety for users, and market opportunities for different design options utilizing lower flow rates than are currently possible. This will also enhance water conservation by allowing the confident use of reduced flow appliances. This may be especially significant and beneficial where excessive over-design is prevalent, as over-design, in the form of exaggerated pipe diameters, leads to low flow depths and velocities, which generally reduce system efficiencies and can lead to deposition and blockages. The development of a new test solid will also facilitate research into the impacts of deposition in small bore pipes with open channel flow, which is an area that is traditionally under-represented in research. This would articulate with research into updates on the fixture unit method for estimating waste discharge rates, which is also a topic of current research by the author.
Aims and scope
The aim of this study was to develop a new artificial test solid which was more stable with time, could withstand several days worth of use, and was easy and cheap to manufacture. Quality control would be avoided by depending upon pre-manufactured goods, which were simple to assemble. The new solid only had to have a repeatable behaviour and did not have to behave identically to a ‘real’ solid. The parameters investigated only had to include conditions close to deposition flow rates, where significant differences in behaviour are noted and where DRAINET calculation processes are dependent upon outdated test solid data.
Background
The DRAINET unsteady flow model depends upon appliance discharge to provide the drivers for the unsteady flow. Network boundaries, such as junctions, discharges to vertical stacks and any local system defects, such as misaligned junctions, blockages and adverse slopes, are dealt with by either reference to empirical laboratory-derived flow/depth functions, or established free surface flow relationships, such as the critical depth at a free stack discharge.12,13 As part of an EPSRC award to investigate the effect of defective drainage installations, a comprehensive series of empirical relationships was developed to define the velocity decrement expressions linking the velocity of discrete solids, defined in terms of mass and diameter, to the surrounding free surface flow velocity. 13
This effectively allows the deposition of solids to be predicted, depending upon the appliance discharge profile, drain parameters and discrete solid properties. While the empirical velocity decrement model effectively includes local depth differences across a discrete solid, these may become large close to the point of deposition. The velocity decrement model allows for the interaction of a series of solids and both laboratory and field observations indicate that solid interaction will affect solid transport distances (Bokor, 1982). 18 The current model deals successfully with the repeated transport of discrete solids once deposited by further appliance discharges and confirms the concept of a maximum transport distance for any combination of solid/system parameters.
DRAINET is based on a finite difference scheme and utilises the method of characteristics as a solution technique to simulate drainage system operation. This is done via the equations that define unsteady partially filled full bore pipe flows and the boundary conditions represented by pipes, junctions and other common system components. In the case of fixtures and fittings, these have to be measured in the laboratory so that their accurate discharge characteristics in terms of flow rate against time can be employed in simulations.
DRAINET has been developed continuously since the late 1980s through several large EPSRC grants. Most of the work concerned the definition of the relevant boundary equations to describe the behaviour of water in circular drainage pipe systems, including junctions and joining flows. The legacy of this work in the form of a large physical test system has been applied to the work summarised in this paper. Understandably, much research was devoted to the behaviour of solids in live drainage systems. Owing to the close proximity to the point of entry to the system, models dealing with above ground drainage systems must consider solids to be discrete, as opposed to models of sewer systems where initial breakdown of the organic matter has occurred, leading to consideration of suspended, rather than discrete solids. This proximity to the point of entry to the system and the means by which this entry takes place have been the subject of much research over the past 30 years.
Discharge of waste solids into a drainage system is due to discharge from a W.C. which produces a surge wave, discharging the solid into the drainline. The inclusion of the surge in this scenario requires a modelling technique capable of predicting the attenuation of a surge wave along a pipe. The method most suited to this is the solution of the St. Venant equations of momentum and continuity in a finite difference scheme through the method of characteristics. Physical attributes of the system, such as entry and exit conditions, pipe junctions, slope defects and obstructions are easily catered for by the inclusion of empirical boundary equations, which describe their effect on the water. The method of characteristics is very effective at predicting the attenuation of waves along a pipe, but it has not been shown to easily include a moving boundary condition suitable for the description of solid objects moving through the system at a velocity differing from that of the water.
The most significant extension to DRAINET in terms of its usability and accuracy is due to McDougall. 7 This model was initially developed to describe the effects of pipe slope defects on solid transport; however, some inconsistencies were highlighted in existing models, leading to the development of a more robust model. McDougall’s model is based on the relationship between the flow velocity (Vf) and the velocity of the solid (VS). This relationship between (Vf) and (VS) is capable of tracking the velocity of a solid under many flow conditions, the velocity of the solid decreasing with decreasing flow velocity and vice versa. This method works well, however it has deficiencies, i.e. the presence of the solid does not modify the surrounding water conditions, the solid does not exist within the flow represented in the model and it is in effect a virtual solid. The consequences of this in terms of describing the interaction of solids are quite significant. If the water conditions were not modified to account for the presence of a solid then the modification of the velocities of approaching solids would need to be described in a way that covers a very wide range of interaction scenarios. Clearly, there is a need for a new solid which displays more repeatability than the NBS solid, but still meets the requirements above.
The flow and solid transport conditions to be investigated and updated were those relating to water depth and local flow velocity near the new DRG solid. In practice, the description of a solid traveling in typical discharges was found to follow a velocity profile governed by the Mach number (MS) of the solid given by


From this equation solid velocity can be calculated if water depth differences or ratio is known. The aim of this paper is to empirically determine the new ratio relevant to the DRG solid.
Method and materials
Laboratory DWV system
To lay the foundation for extending the capabilities of DRAINET, a recirculation system was required in order to provide a reasonably accurate representation of a real DWV system. This was based on site sampling information already at hand and was adapted from an existing full sized test apparatus of two 100 mm diameter, 1:80 slope, 15 m lengths joined by an open collection tundish. One 15 m length was in borosilicate glass; the other was transparent plastic.
The open collection tundish could be used for collecting test solids should disintegration occur, which turned out to be common. A standard w.c. and cistern were installed at the start of the glass pipe section, discharging into it through a standard w.c. bend. Fortunately the 4 l/6 l w.c., which had been used for testing historically, was still available.
The test solid alternatives reported on in this work did not include the historical attempts that have been used over time, such as one hundred 19 mm polypropylene balls, water-filled acrylic cyninders, dog food and porridge, as data existed that indicated significant shortfalls in all of them.
The new materials used in this work were foam of various densities, plasticine, foam with plasticene inserts, foam of various densities in plastic wrap, foam covered by adhesive tapes of various descriptions and water-filled ping-pong balls tied together in a train of three with short lengths of string. The ping-pong ball option was clearly the best performing of them all. It had good durability, good consistency and gave repeatable results. This was chosen for further development and named the DRG. It soon evolved into three ping-pong balls attached by cable ties, hot-glued onto the balls. This provided a good degree of flexibility with the tendency to return to the original shape, no doubt contributing to repeatability. An illustration is provided in Figure 1.
DRG solid. DRG: Drainage Research Group.
Flow depth is easily obtained in practice through pressure transducers which record the depth of water above them and which are located underneath the pipe in question via small tappings flush with the internal pipe surface. A ±100 mm water gauge high sensitivity SensorTechnics air pressure transducer was used, connected to a Keithley Instruments data acquisition card. By placing the transducer on top of the outside of the pipe and connecting it to the bottom spigot, then filling the lower bend of the tube with water, a simple manometer is made. Pipe wall elasticity can be ignored due to the very small resultant pressure rises and very short lengths involved. By choosing a suitably fast sample rate (100 Hz in this case), the water depth ‘signature’ of a solid passing overhead is recorded. In the case of the ping-pong ball train, the first and last depth readings were taken as there was some disturbance in the middle because there were gaps between the balls. The measurement point was 2.4 m downstream of the discharge entry point. The w.c. had a standard 15 mm mains connection for water delivery. All w.c. flushes were triggered by manually operating the 6l plunger on the w.c., typical of a flush containing solids. Ten replicates were taken of each solid tested. Distance was measured with a tape measure. Depth readings were the upstream and downstream depths recorded as the solid passed, although for clarity only the differential between them is shown in the results as this is the most easily interpreted visually.
This facility had been used in the development of the DRAINET simulation model described earlier in this paper. A base flow could be established just upstream of the w.c. point for the purpose of recovering solids from the system.
Flush characterization
A method of calculating the discharge profiles of appliances was available and was used to verify the discharge characteristics of the w.c. used. The apparatus utilised in this method is shown schematically in Figure 2, which illustrates how the volume versus time graph is obtained by a system of depth measurement at a range of locations corresponding to the principal nodes and antinodes of the first three degrees of freedom over the surface of the collection tank.
13
Discharge characterization apparatus.
A pressure transducer records the average air pressure in 12 vertical tubes distributed across the surface of the tank caused by changes in the rate of water surface height. The output has very good sensitivity and immunity from noise, permitting the detection, for example of the difference between a 6 L clean flush of a w.c. and the same w.c. with 12 sheets of toilet paper included. This allows progress in improving models of drain loading and w.c. fluid contamination removal.
9
Figure 3 shows the discharge profile of the w.c. used, which matched the historic profile. This was important in allowing future comparisons with a large amount of historical data.
Discharge profile of w.c. used in this study.
Test solid characteristics
Most of the required characteristics of a test solid are obvious: stability over time, durability and repeatability, approximation to the specific gravity of around 0.97, approximately 30 mm wide by 110 mm long and the ability to provide useable and representative data over the range of conditions that it could reasonably be exposed to. The NBS solid met some of these requirements but not all of them. Additionally, it was observed that a degree of articulation or flexibility was required to negotiate the swept junction on the system. In reality a real solid would deform and/or break up due to friction with the sediment bed, irregularities caused by couplings impacts with bends or shear forces at junctions with joining flows, etc.
Figure 4(a) to (c) shows different views of the test system as a whole. Figure 4(a) is a view along the whole 15 m pipe run which includes a w.c. at the far end and a junction to a neighbouring pipe; Figure 4(b) shows the view from above illustrating the junction and Figure 4(c) shows a detailed view of the proposed DRG test solid during a discharge.
(a) Lengthwise view of test apparatus, (b) top view of test apparatus and (c) detailed view of DRG solid transport in test apparatus. DRG: Drainage Research Group.
Results
Overview
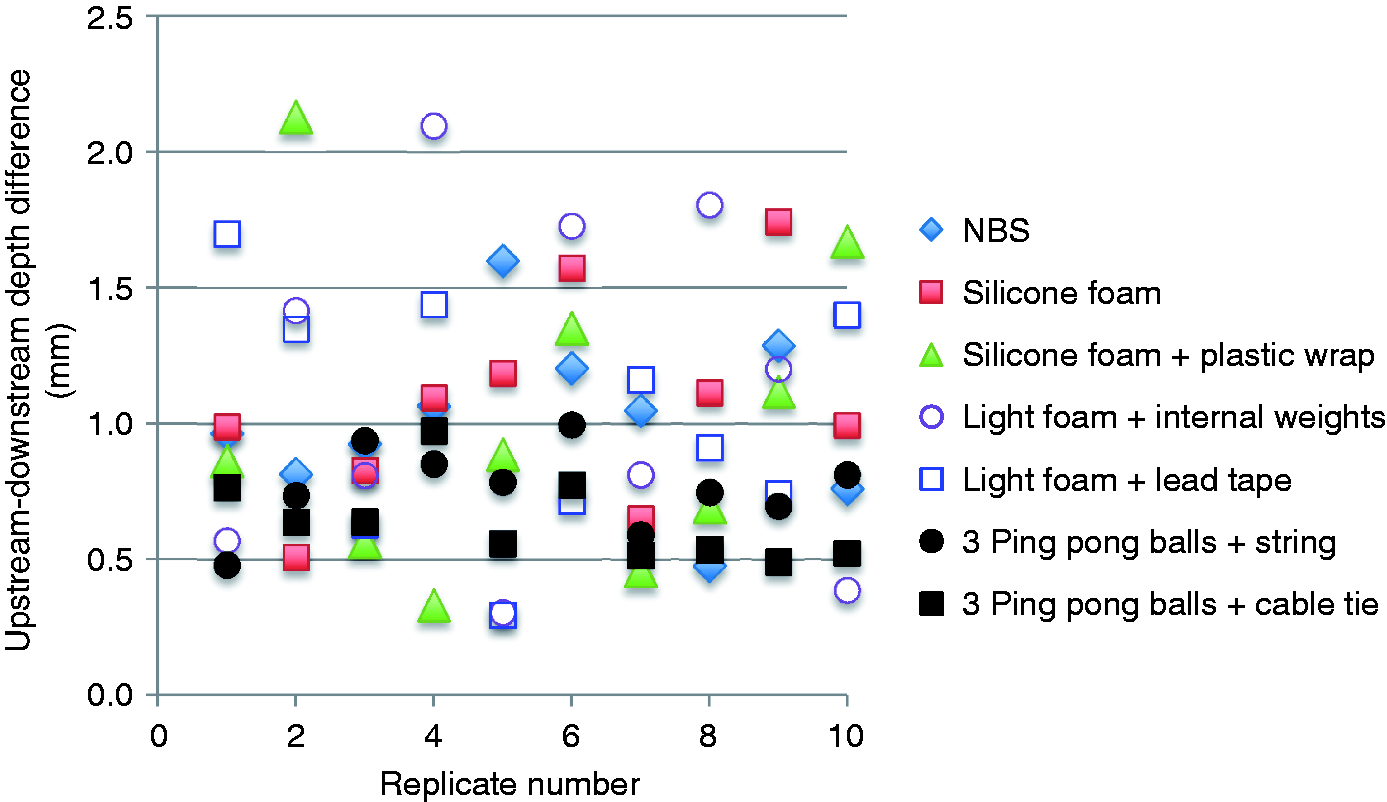
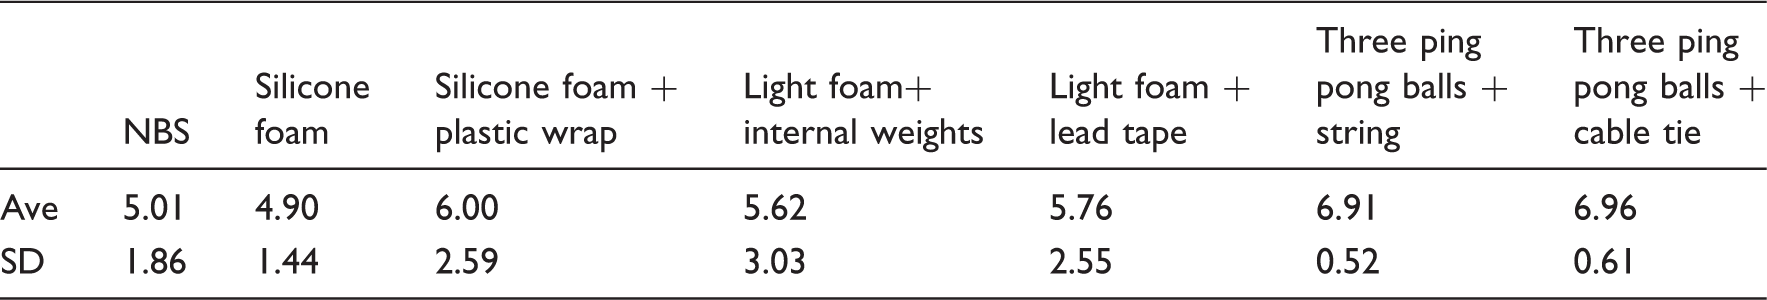
The basic process was to place a solid in the w.c., flush, record the data and then repeat. The order of test solids was the same as the description above. All flow parameters were recorded at 2.4 m distance from the discharge entry point into the system. The results are grouped together and shown in Figure 5 (transport distances) and Figure 6 (flow depth differentials). Table 1 shows simple statistics of average and standard deviation associated with the transport distances for each solid.
Solid transport distances: all test solids. Flow depth differentials: all solids. Basic average and standard deviation statistics for the transport distances in meters for each solid. SD: Standard Deviation.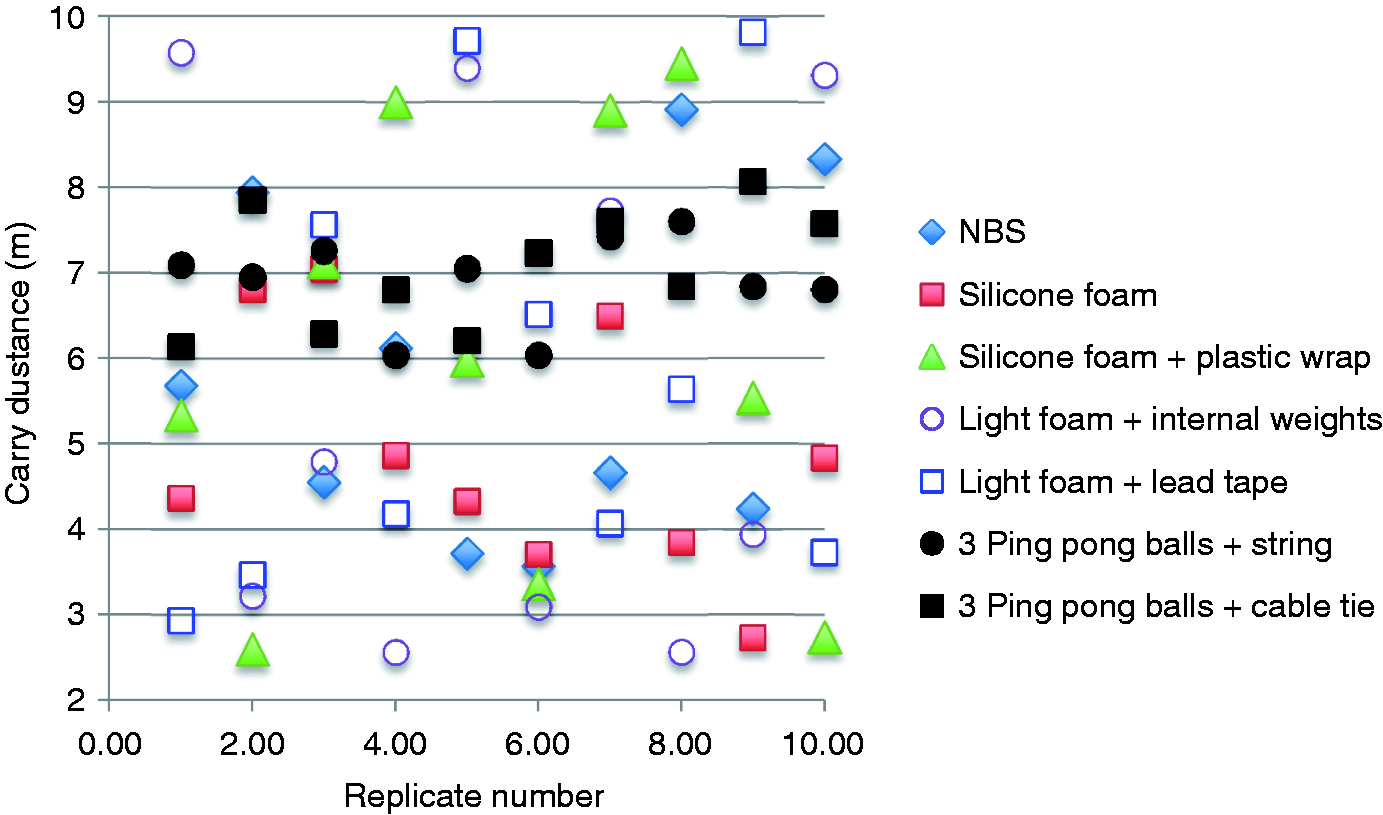
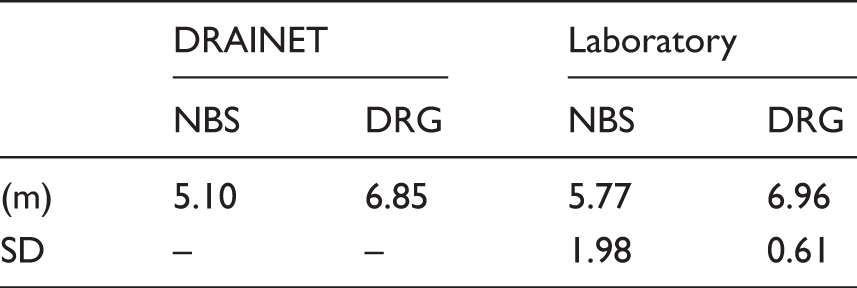
Comparison between unmodified (NBS) and modified (DRG) DRAINET transport distance predictions and averaged laboratory data (in meters) from Figure 5.
DRG: Drainage Research Group; NBS: National Bureau of Standards; SD: Standard Deviation.
Discussion
The variation in distances recorded in the laboratory tests shown in Figure 4 is quite marked. Some test solid design had a worse performance than the original NBS solid, but both ping-pong ball models were significantly better, explaining the reason behind the choice of the cable-tie option as the new preferred test solid. An examination of Table 1 reveals that the statistics for either ping-pong ball model are significantly better in terms of accuracy and consistency (i.e. smaller spread) than the others, including the NBS solid. The flow depth differentials shown in Figure 5 follow the general pattern of the distances in Figure 4, in that shorter distances are associated with greater depth differentials. There is some spread in the results as each solid may not have passed directly overhead the depth sensing point. The choice of 10 replicates would have minimized this effect.
Table 2 shows a better fit between DRAINET prediction and laboratory measurements for the DRG solid compared to the NBS solid, although it must be remembered that the statistical spread of the NBS solid in the laboratory is much larger than the DRG. Table 2 also compares the historic data (10 replicates) for that w.c. with an NBS solid from approximately 2003, that shows a longer travel distance. The materials used in 2003 will have been different to those used in the current investigation work, as will the water quality used to fill the solid, which highlights the requirement for a simple, reproducible and robust alternative to the NBS. The average and standard deviation for the DRAINET results are not applicable as a single result is given, which is identical for each repeat of identical test parameters.
The presence of the solid in a flow requires a simple modification to the water depth profile at the solid’s location (provided the flow is in Region 2) along the pipe at a given time. The water depth is therefore given by 
A gradually varied profile can then be fitted between the solid boundary and the upstream location where the flow depth returns to hi. This will be dealt with by ensuring that this boundary moves to the next correct node in the time sequence in the model at the correct time, subject to VS. The necessary equations to evaluate VS and dHS are shown to be classically dependent upon the flow regime downstream of the solid. 13 Because the solid affects the surrounding water conditions, which in turn affects the velocity of a solid and the entire process moves through the calculation grid used in DRAINET, a moving boundary condition is used. The updated method imposes a fixed boundary condition at a given node at a time governed by the solid velocity. The fixed boundary is then moved along the pipe in an iterative manner, subject again to the solid velocity. The solid velocity, acceleration and deceleration equations are used to calculate what time the solid arrives at the next node.
In particular, the new ratio described here was only required when the solid was moving, but in contact with the pipe wall described above as Region 2. The reason for this is that the low flush volumes and lack of upstream base flow meant that all solids only floated freely for around a metre and were all in contact with the pipe bottom by the time they crossed the measurement point. Based on the recorded flow depths, the old cus and cds ratio was changed from the iterative values estimated in the calculation steps to a fixed value of 1.052. In practical terms, this offers the possibility of programming other test solid standards into DRAINET, allowing the user to select the cus/cds ratio appropriately. This additional condition was only triggered when the flow depth was less than the diameter of the solid. The upstream depth is still calculated in real time by DRAINET, allowing the ratio to set a more correct downstream depth. This changes the way that DRAINET predicts the interaction between the solid and the water around it, by modifying the crossover point of the water depth that is declining with distance and the water depth increase caused by the solid. This has altered the distance given by DRAINET to a value closer to the DRG solid actual performance than to the NBS solid actual performance, thereby effectively updating DRAINET.
Conclusion
This research has proposed a new artificial test solid (DRG) for use in research related to DWV system solid transport characteristics. The need for this arises through known deficiencies of the NBS and other artificial test solid analogues. The proposed DRG is robust, easy to manufacture, stable through time and gives repeatable results. The new results are incorporated into DRAINET, an existing computer-based simulation model and correct the output to more closely match the behaviour of the DRG solid in the laboratory setting. The findings can be used by other workers in the field who use similar computational techniques.
The presence of a solid in a water flow is characterised by the water depth difference across the solid’s length and is a function of the flow variables and the attributes of the solid. This water depth difference, characterised by the ratio of upstream to downstream wave speeds (cus/cds) is central to modelling the transport of a solid and its interaction with other solids. This water depth difference has also been shown to be crucial in defining the erratic behaviour of solids as they near deposition, alternatively accelerating and decelerating as the water depth difference across an individual solid increases and decreases, nudging the solid forward a greater distance than would be predicted by water depth-only profile models. By refining this step to reflect the behaviour of a more repeatable test solid, more accurate solid transport and deposition rate predictions can be made, facilitating water conservation research and informing future strategy decisions.
Footnotes
Declaration of conflicting interests
The author(s) declared no potential conflicts of interest with respect to the research, authorship, and/or publication of this article.
Funding
The author(s) received no financial support for the research, authorship, and/or publication of this article.