
Abstract
The aim of this research was to investigate the scale of carbon dioxide recirculation in rotary energy wheel operated in air handling units. To achieve this objective, a test facility was installed into the indoor air quality and thermal comfort laboratory of BUTE University. A newly developed molecular 3 Å sieve sorption wheel with high humidity transfer efficiencies is integrated into the experimental setup. In this research study, carbon dioxide cross-contamination rate from the exhaust side into the supply side in sorption regenerative air-to-air rotary energy exchanger was conducted by experimental tests. During the study, the correlation between the carbon dioxide cross-contamination, different rotational speeds of the wheel and different volume flow rates of supply air were also investigated in detail. Based on the results, a rotation speed diagram – carbon dioxide cross-contamination diagram – is plotted which can be very useful for researchers, developers and building service engineers in practice.
Introduction
There is growing attention on the reduction of energy consumption, and on achieving sustainable development by saving primary energy sources (coal, oil natural gas).1,2 Combinations of engineering proposals, end user requirements, and civil authority regulations have resulted in an increasing usage of heat and energy recovery equipment. In spite of the fact that several heat and energy recovery units can be found on the market, they are frequently used in practice and are continuously under research and development for further increasing the performance of exchangers;3–23 the technical data presented by the producers do not provide detailed information on the carbon dioxide cross-contamination in the rotary energy recovery units.
The values of carbon dioxide concentrations and volatile organic compounds in buildings with various functions and occupancy were investigated by many researchers in the past years.24,25 Carbon dioxide is a non-toxic and non-flammable natural fluid, which becomes one of the most promising heat transfer fluids, 26 but the emission generated by human breathing degrades the indoor air quality of the conditioned space. In most studies on this topic, the location, the building function, the methods and tools of measurement and the controlling strategies were clearly published. Mainka et al. 27 carried out experiments in a kindergarten of Gliwice in Poland. From the measurement results, it can be clearly observed that carbon dioxide concentrations can reach as high as 3700 ppm (in the case of the highest group), and that the daily routine and the number of occupants of the premises are well indicated by peak and off-peak values. On average, carbon dioxide concentrations are between 2000 and 3000 ppm during the day.
Jurado et al. 28 conducted their research in the educational institutions of many Brazilian Universities. In the course of the study, 15 classrooms with natural ventilation and another 15 with artificial ventilation were monitored. Carbon dioxide levels were measured using a Testo Digital 535 non-dispersive infrared sensor, positioned at 1.5 m height. Carbon dioxide levels were between 1433.62 ± 252.8 ppm in the case of artificially ventilated premises and between 520.12 ± 37.25 ppm in the case of naturally ventilated premises. Sadly, however, the authors did not feature a diagram representing the changes in carbon dioxide concentration over time.
Rashidia et al. 29 investigated the differences in a classroom in the case of natural ventilation and air-conditioning in a school in Kuwait, and then based on the measurement results, they provided recommendations for various ventilation plans (longer/more frequent breaks between lessons). The results showed the indoor concentration levels measured on average in each classroom, in the case of both natural ventilation and air-conditioning. In the latter case, a higher concentration could be seen – values between 1500 ppm and 1900 ppm – because the windows are closed due to air-conditioning. In the case of natural ventilation, average values were below 1000 ppm at all times.
A research study conducted by Koiv et al. 30 on the topic focused on residential buildings. The authors of that study were interested on how recently significant building renovations aimed at saving energy influence the quality of indoor air hours. The most significant result of the measurement survey was the variation of carbon dioxide concentration in the premises equipped with old and new windows. It is clearly evident that in the case of new windows providing better insulation, concentration levels exceed even the 4000 ppm value, while in the case of old windows, the levels never exceeded the 1500 ppm value. The result is also favorable, because according to the standard effective at the time of the study, the maximum allowed value was 1500 ppm. Of the rooms measured, only two were below the permitted 1500 ppm, level C value. Only room no. 72 fulfilled level B of the standard (1250 ppm), while level A (1000 ppm) was not fulfilled by any of the rooms. With consideration to the results of all rooms during the autumn measurement period, carbon dioxide concentration was below 1500 ppm during 56% of the period of the measurement, below 1250 ppm during 38%, and below 1000 ppm only during 23% of the period of measurement. In most cases, the concentration was lower during the winter measurement period than during the autumn measurement period.
Vehviläinen et al. 31 presented a study focused on an office building in Finland. Based on the results, the difference between ventilated meeting rooms and those without ventilation was clearly visible. While carbon dioxide concentration in the former case was between 446 to 1452 ppm, recording an average value of 906 ppm, this range spread rather wide between 519 to 4917 ppm in the latter case, resulting in an average value of 2756 ppm. The level of significance was below 5%. Experimental tests have been conducted on the subject of recirculation within rotary heat exchangers; however, the number of these is insignificant.
Kodama 32 tested the occurrence on nine different materials in his study. Based on the results, two major conclusions can be drawn. The Hi-PANEX type heat exchanger of an ion-exchanged resin material investigated by Akio resulted in significantly lower cross-contamination. Furthermore, the rate of carbon dioxide “contamination” relevant in terms of the study was between 2 and 5%, both in the case of the commercially available 3 Å – grade molecular sieve and in the case of the tested resin.
Based on the values indicated in the literature, the most frequently occurring carbon dioxide value could be measured between 1433 ppm 28 and 1452 ppm 31 when compared to mechanical ventilation operation whose values serve as reference data for this research. High carbon dioxide concentrations were typical of those comfort areas, where ventilation was natural; no artificial ventilation appliances were operated. The novelty of this research study is determining the amount of carbon dioxide cross-contamination in sorption energy recovery wheel under different operating conditions by step changing of the wheel rotation speed and the volumetric flow rate of air transferred. The additional objective of the research is plotting rotation speed – carbon dioxide cross-contamination diagram which provides novel useful technical data for researchers, developers and building service engineers in practice. Accordingly, such an investigation could bring new scientific results, the elaboration of which is the primary objective of this research study.
Test facility for the experimental investigations
Specifications of the investigated sorption wheel. 33
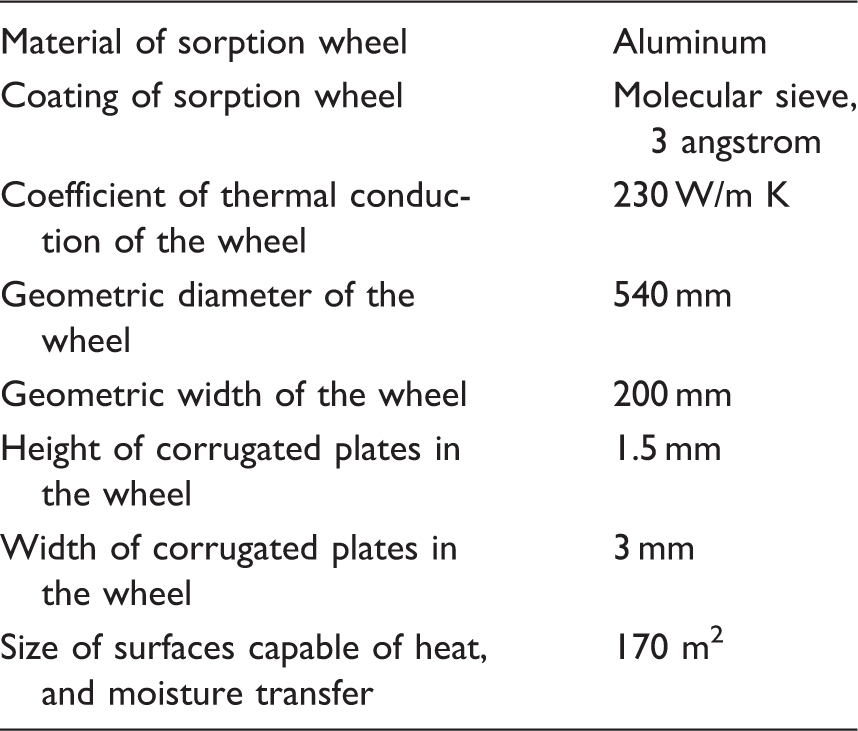
The rotor matrix consists of many small, sinusoidal channels (Figure 1) made from thin aluminum foil. Wave height is 1.5 mm and width is 3 mm. The geometric width of the rotor matrix is 200 mm.
The structure of the wheel.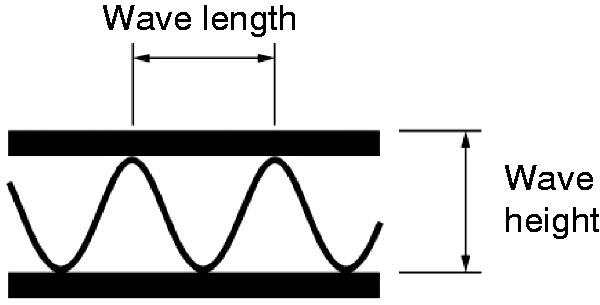
The test facility in the laboratory is shown in Figure 2.
Experimental apparatus for the measurements.
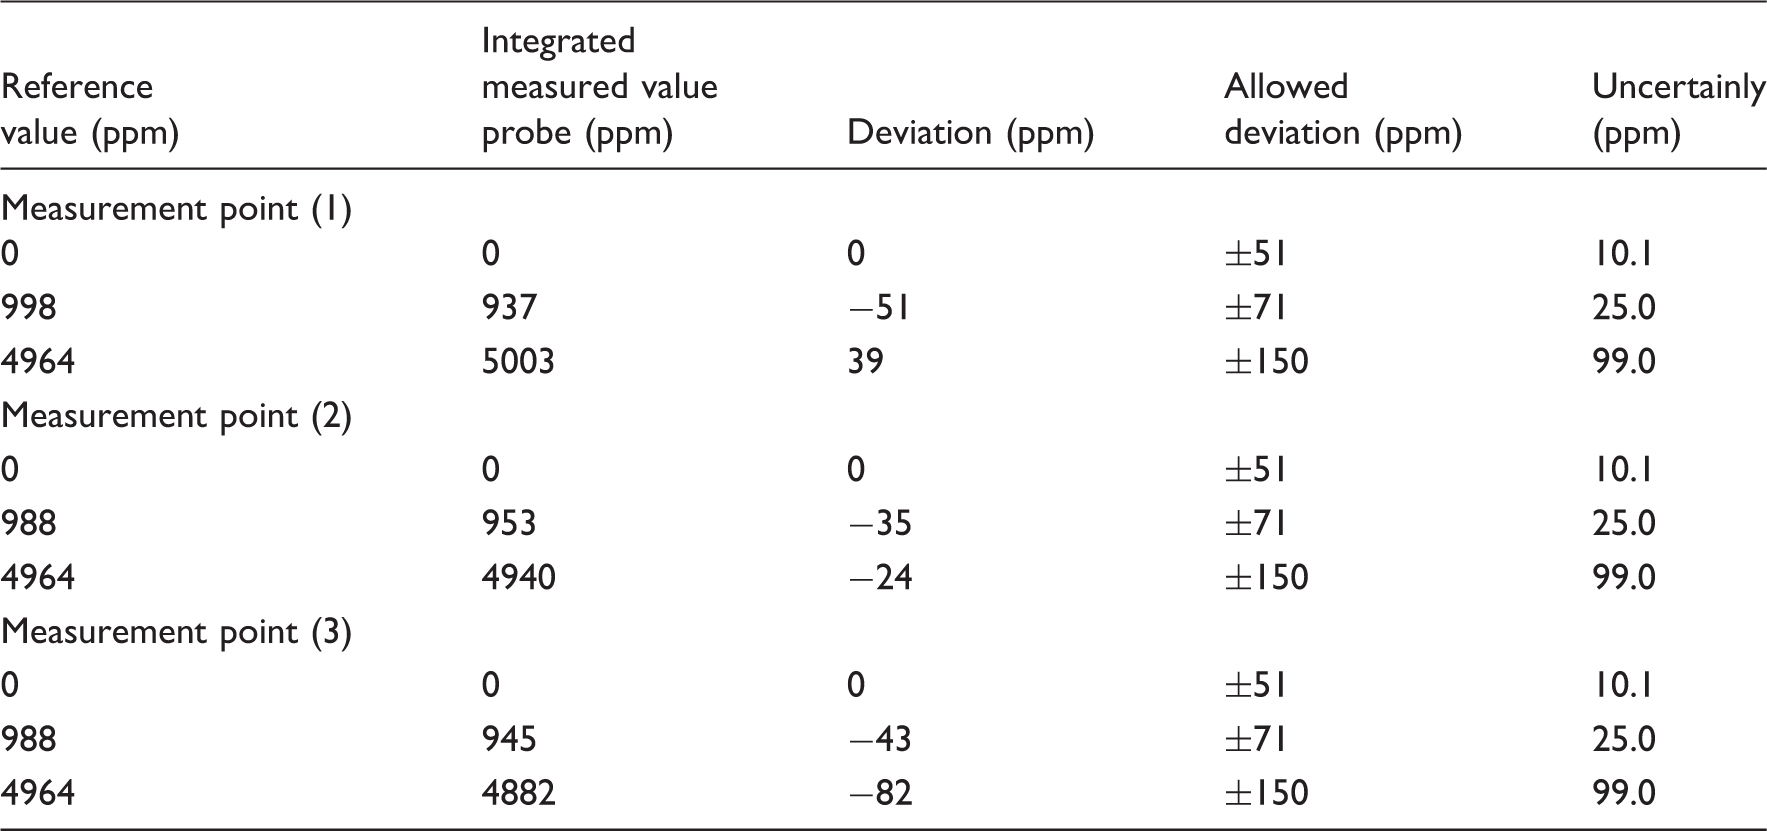
Calibration result of the multifunction instrument with carbon dioxide probe.
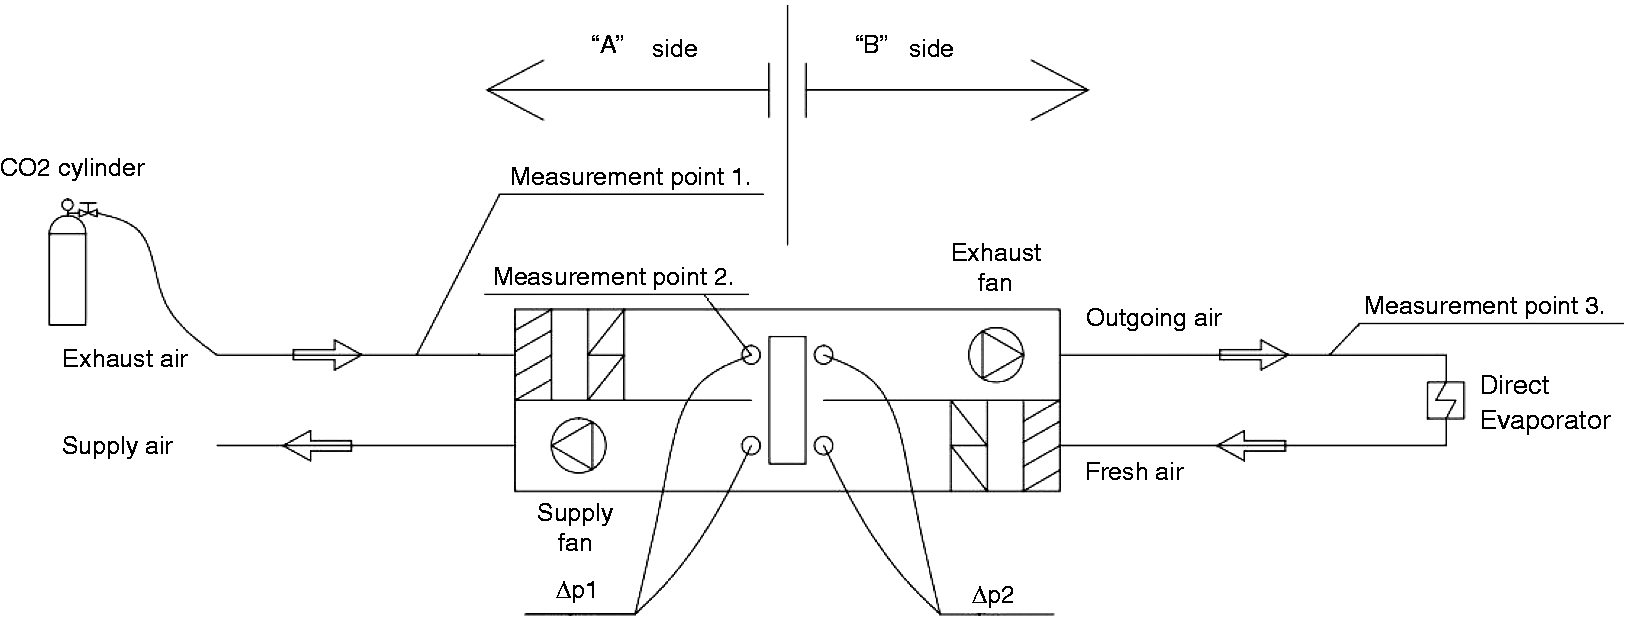
At the beginning of the preparation of the experimental tests, the objective was to locate carbon dioxide measurement points, where a homogeneous air–carbon dioxide distribution could be found within the measurement apparatus (Figure 3). In the figure, “side A” – connected to the conditioned space in the reality – represents the supply outlet and exhaust inlet part of the sorption wheel and “side B” is connected to the ambient air under real operating conditions. Accordingly, the sensors were positioned to the center of the air duct in the following points:
Carbon dioxide sensor positioned at the end of the carbon dioxide exhaust air duct (measurement point 1): Testo IAQ sensor 646 Carbon dioxide sensor positioned at the section before the heat exchanger (measurement point 2): Testo IAQ sensor 666 Carbon dioxide sensor positioned at the straight section of the outgoing air duct (measurement point 3): Testo IAQ sensor 652
Schematic of the locations of carbon dioxide sensors in the test facility.
A TESTO480 data recorder was used to record the data measured by the metering devices. The data recorder was connected to a PC via a USB port, and thus by using the TESTO EASYCLIMATE 3.3 software, the measured values could be plotted real time, showing the progress of graphs. The measured data sequences were saved with the software in the form of Microsoft Excel tables.
In the course of measurements, carbon dioxide concentration values were generated using a 50 L volume, 180 cm high cylinder filled with 37.5 kg carbon dioxide gas, with a pressure regulator and a hose. The opposite end of the hose connected to the cylinder’s pressure regulator was positioned at the end of the exhaust air duct of the test facility, with a ceramic insert water atomizer nozzle connected to the end of the hose and placed in a fixing vessel, in order to ensure the uniform distribution of air and carbon dioxide, required for the measurement (Figure 4).
Nozzle with ceramic cartridge.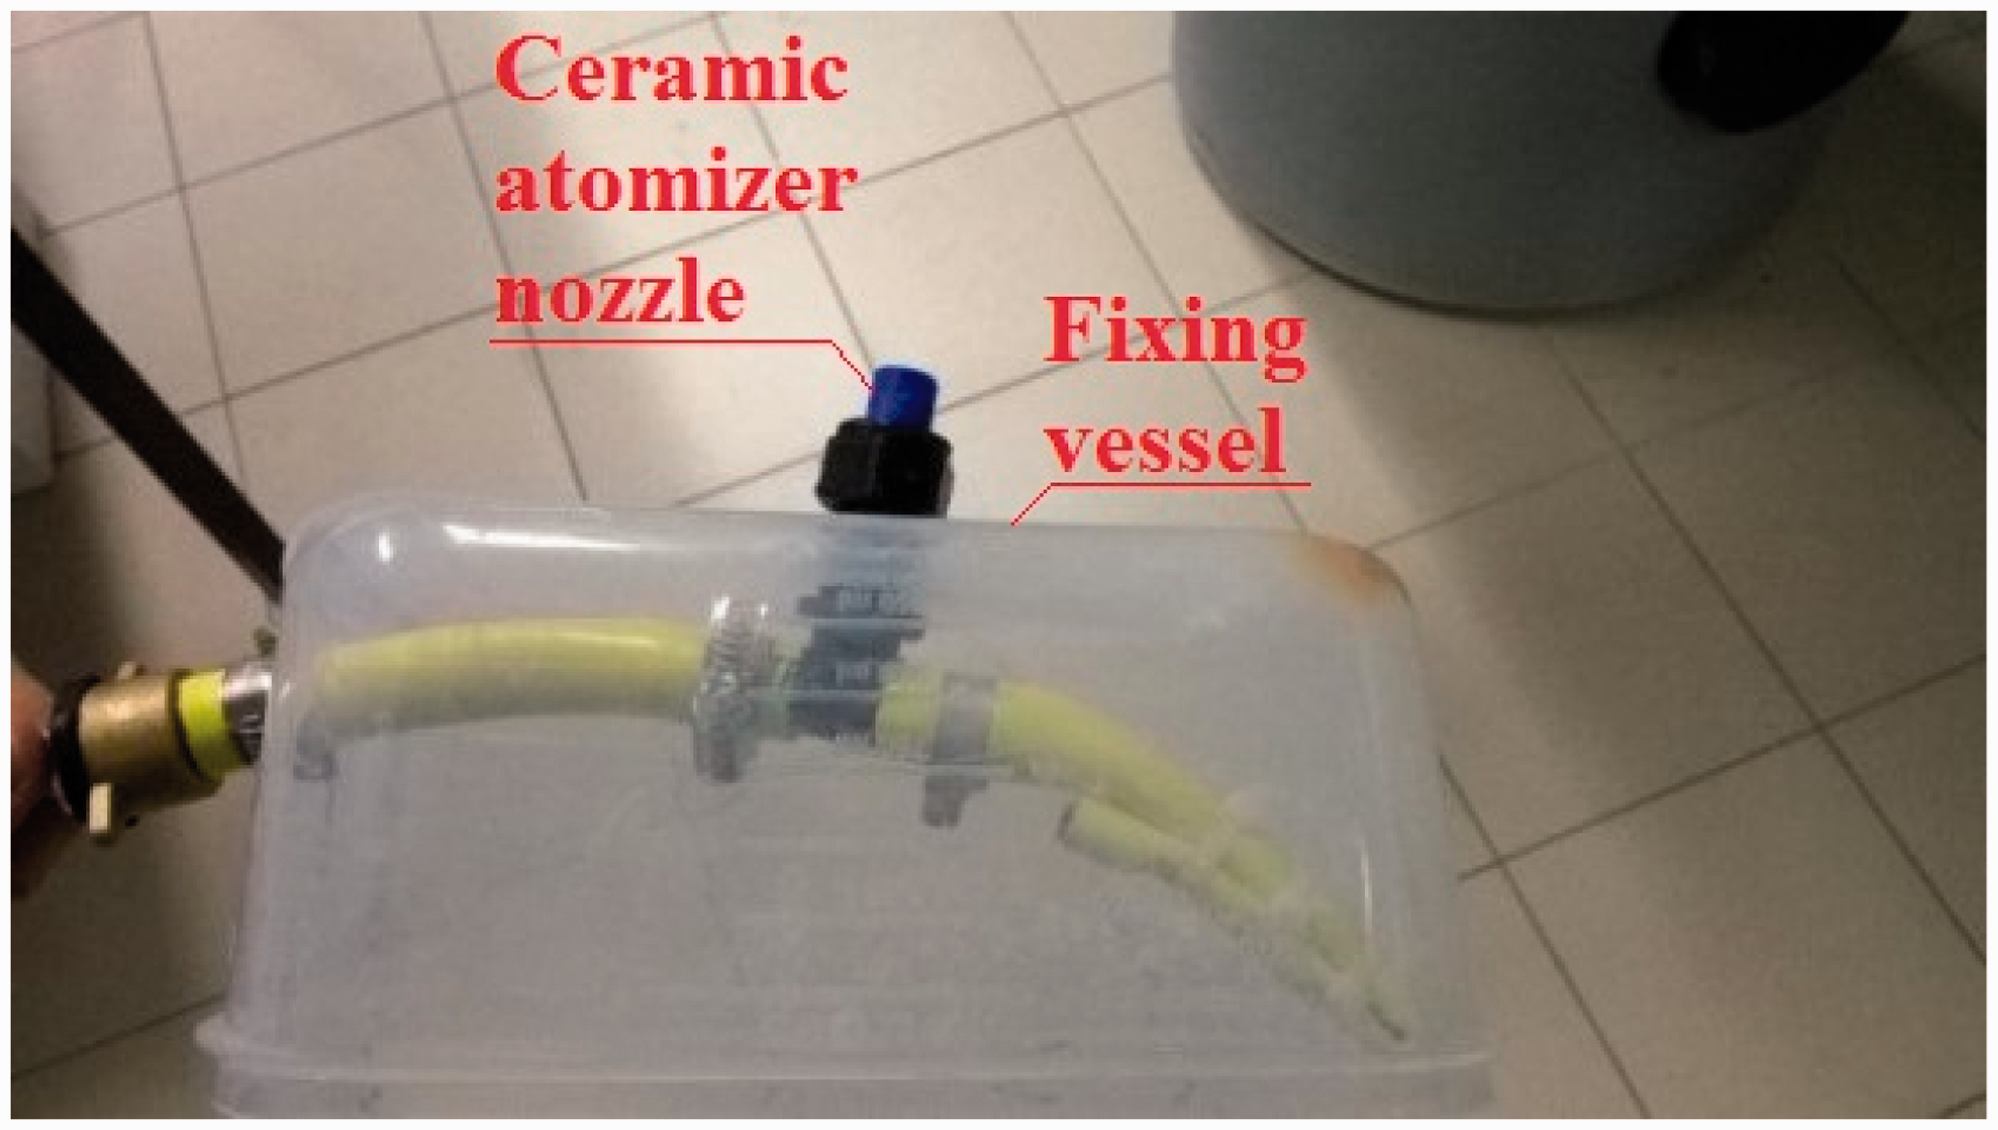
As shown in Figure 3, a direct evaporation heat exchanger is also installed in the test facility, which is capable of generating various air temperatures into the fresh air duct of the ventilation system. With consideration to the scope of this research, application of this heat exchanger was not included in the current experimental survey, as the prevailing air condition parameters vary along a narrow temperature and relative humidity range inside the laboratory, i.e. these can be considered as constant (21℃ air temperature and 40% relative humidity).
The system can be considered as a series-connected, nearly closed system; therefore, it may be assumed that the amount, the measured concentration in the discharge branch is lower when compared to the exhaust branch, is equivalent to the amount of carbon dioxide concentration recirculating into the supply branch. Thus, in terms of evaluation, the prevailing primary parameters in the course of the measurement task were: the difference between concentrations measured in these two points (ΔK = Kexh − Kout), the average carbon dioxide concentration of exhaust air (injected by carbon dioxide cylinder) at various flow rates (Kexh, average), the different speeds of rotation of the rotary heat exchanger (ω) and the pressure difference measured between the exhaust-supply air duct (Δp1) and outgoing-fresh air duct (Δp2) of the energy recovery ventilation system.
Calibration result of the hot-wire anemometer.
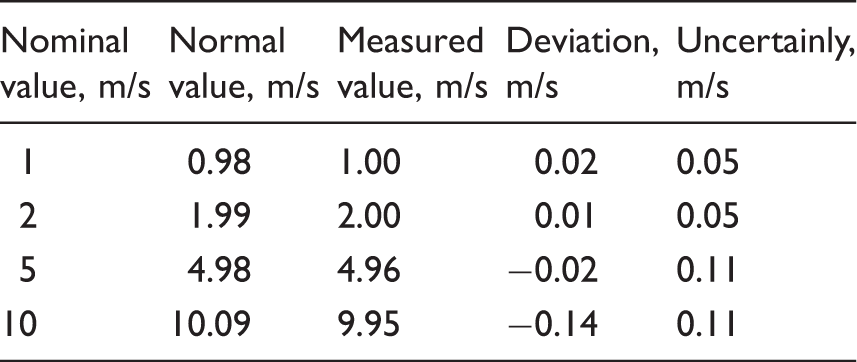
A metering device is connected to a smart phone through Bluetooth radio connection. TESTO EASYCLIMATE 3.3 software running on the smart phone, received data from the device, and computed the volumetric flow rate from the averaged air velocity values measured, based on the dimensions of the air duct, which were entered in advance. The measurement location allowed for the simulation of a realistic situation, where the maintenance of a steady volumetric flow rate of supply air is a requirement. Pressure differences (ΔP1 and ΔP2) were recorded for these operating points. These values could be measured properly at the factory-made pressure measurement outlets of the ventilation system, which could therefore be helpful in the reproduction of measurements, if necessary, and in the setting of operating points.
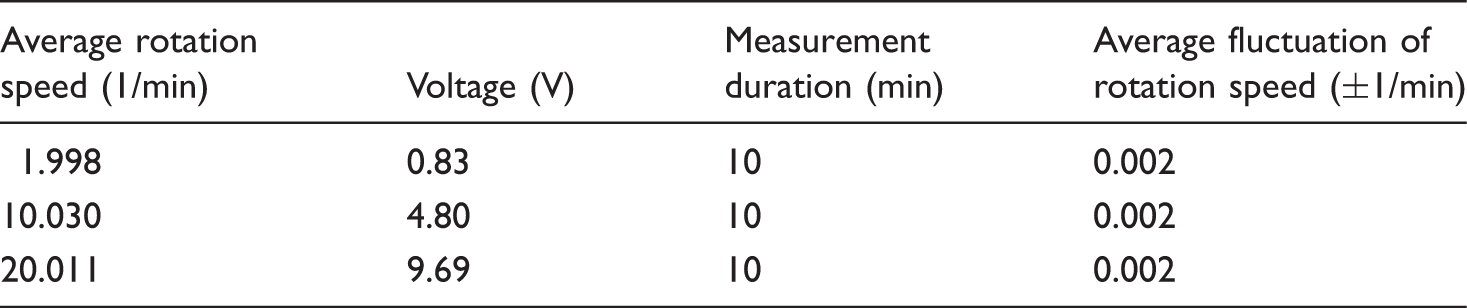
The speed of rotation of the wheel (ω (1/min)) was set with the use of a potentiometer on the control panel. The speed of the inverter-controlled electric engine can be deducted from the voltage shown on the control panel display. The speed–voltage relation of the wheel was determined through measurement, using a VOLTCRAFT DT30LK type laser tachometer.
Results of average wheel rotation speed
Description of the experimental process
In the course of measurements, it was assumed that carbon dioxide cross-contamination is caused by two reasons:
in the case of factory-installed sorption wheel, the carbon dioxide concentration of air flowing through the factory-made slot required for rotation; the carbon dioxide concentration of air flowing through as a result of recirculation of exhaust air into the supply air duct due to the rotation of the wheel.
The set input operational airflow and rotation speed parameters for the experimental investigations.
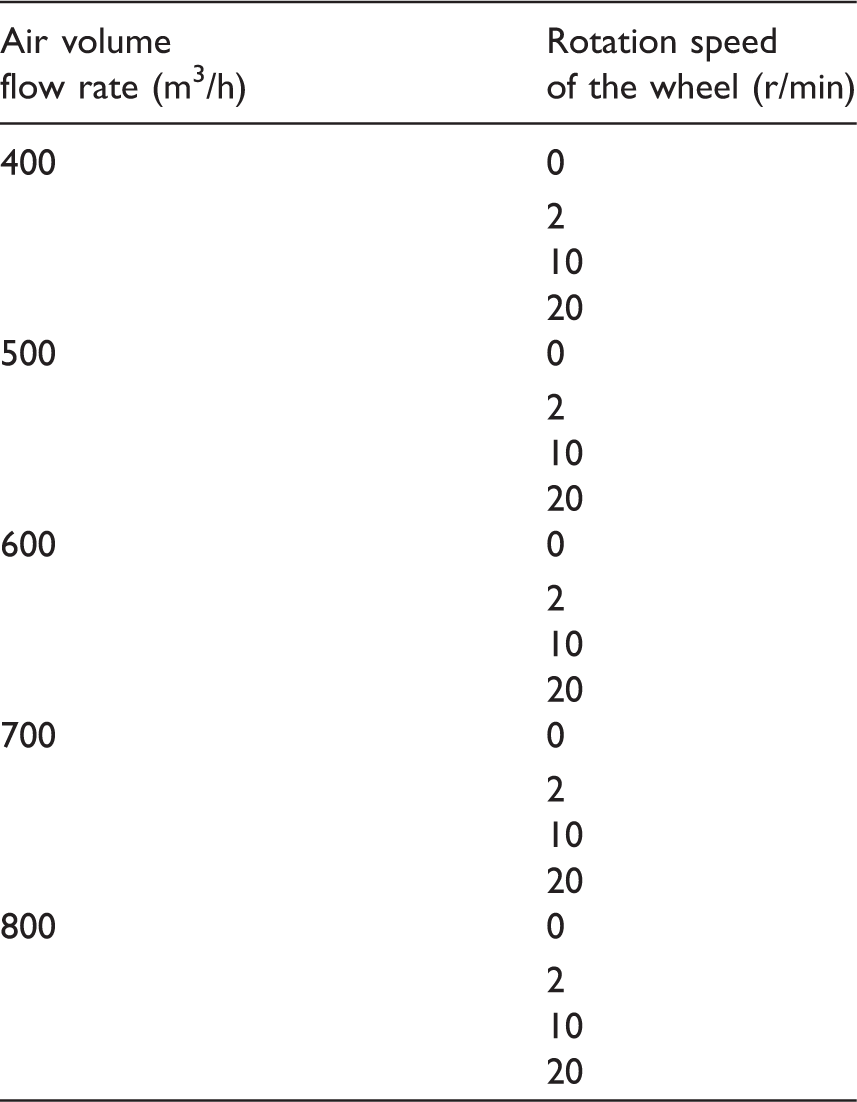
The values of the air volume flow rates were selected based on the capacity of the fan integrated into the experimental test facility and based on the type of real conditioned space. The 400 to 800 m3/h air volume flow rate can cover the required fresh air exchange rate of a single family house and also a restaurant or a smaller scaled office area.
Measurement results were recorded by a Testo 480 type recorder, which in addition to the continuous recording and collection of data, made the constant monitoring and reading of measurement results possible on a personal computer connected to the recorder.
Evaluation of experimental data
The experimental data measured at each volumetric flow rate were evaluated based on the following factors.
The data logger recorded at 2-s intervals, at which the differences of all carbon dioxide concentrations measured upstream (before) and downstream (after) the sorption wheel were generated, thus receiving a difference (equation (1)) for the given measurement point

Having completed the measurements, the average of the differences was taken, and the ratio of the result and the supplied average carbon dioxide concentration was calculated by the following equation


In the table, the relative deviation is also indicated for each operating point, which was determined as follows

Results and discussion
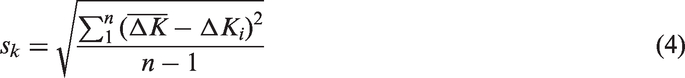
The relative amount of cross-contamination with deviations in each investigated operating point.
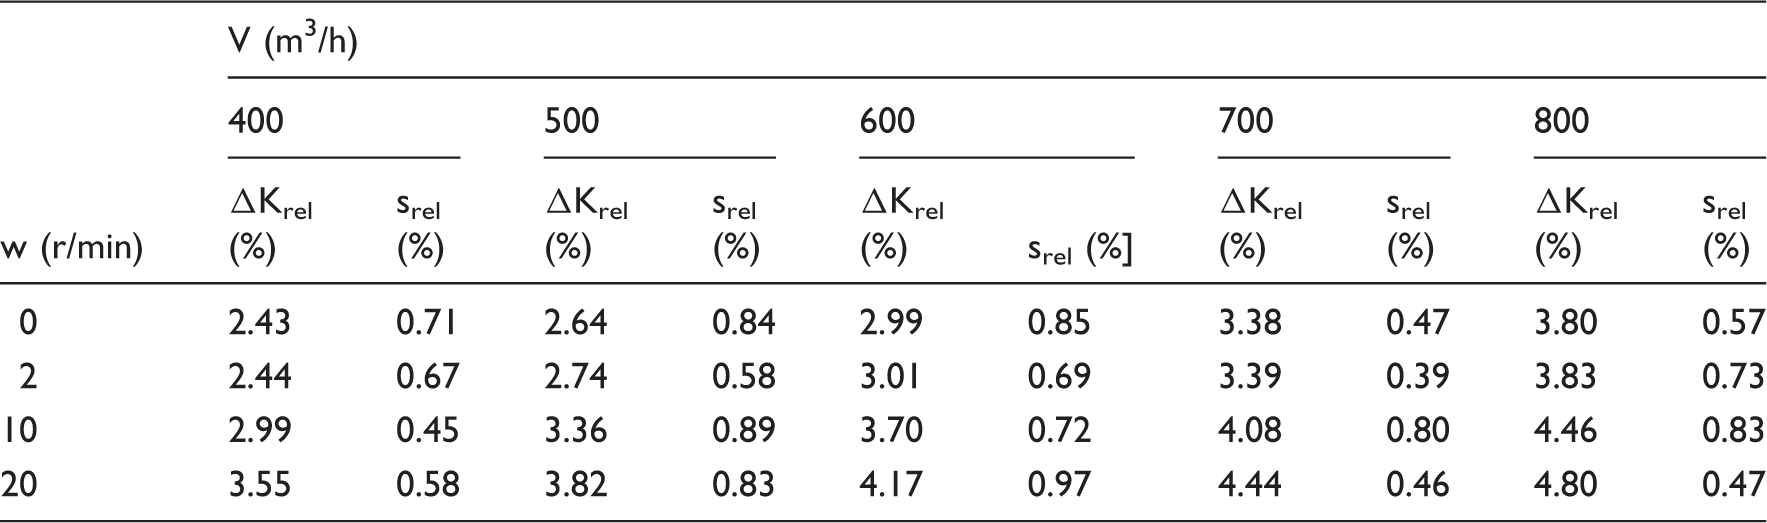
The 95% confidence band of cross-contamination around the average of each operating point.
Representing data on the defined rotation speed − cross-contamination diagram in different air volume flow levels (Figure 5), it can be seen that at a speed of 0 r/min, a certain slot removal occurs due to the pressure difference, then with the increase of the speed of rotation the rate of cross-contamination also increases, as a result of air stuck inside the wheel, then flowing into the fresh air (supply) branch.
Rate of cross-contamination in relation to the speed of wheel rotation.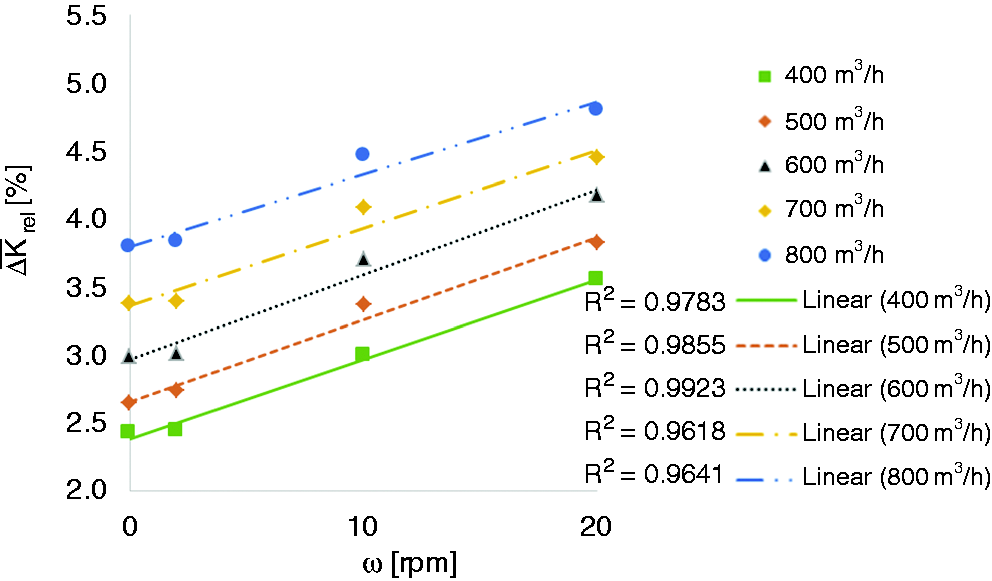
The result is also reassuring in terms of the fact that the rate of cross-contamination (2–5%) was within the range established by the studies mentioned in the literature.
Based on the statement of the producer and product catalogue, 33 the rotor speed should be around 8–12 rounds per minute for optimal energy recovery. If r/min is reduced, the efficiency of the energy wheel drops. In consideration of this fact and the results (Figure 5) obtained from this research work, consequently, the rotor speed should not be much higher than 8–12 rounds per minute (r/min). The higher carbon dioxide cross-contamination can result in degraded indoor air quality in the conditioned space, but operation of the wheel fewer than 8 r/min, the amount of energy recovered will be decreased.
Conclusion
In this study, the experimental investigation on carbon dioxide cross-contamination rate from the exhaust side into the supply side in sorption regenerative air-to-air rotary energy exchanger was conducted. The major findings obtained from this work are summarized as follows:
Carbon dioxide cross-contamination in air-to-air rotary energy recovery ventilation system degrades the indoor air quality. Linear increasing tendency for carbon dioxide cross-contamination can be concluded by increasing the rotation wheel speed and air volume flow rate. Rotation speed–carbon dioxide cross-contamination diagram is plotted which is useful for researchers, developers and building service engineers in practice.
The novelty of the results is the correlation between carbon dioxide cross-contamination rate from the exhaust side into the supply side and the rotation speed of the sorption wheel and the volumetric flow rate of air transferred in a wheel. The results were performed by experimental test and this correlation has not yet been investigated so much detailed in the course of studies conducted on the subject.
Footnotes
Declaration of conflicting interests
The author(s) declared no potential conflicts of interest with respect to the research, authorship, and/or publication of this article.
Funding
The author(s) disclosed receipt of the following financial support for the research, authorship, and/or publication of this article: This research was financially supported by the National Research, Development and Innovation Office of Hungary (grant number NKFIH PD 115614), Budapest, Hungary.