
Abstract
Bioaerosols formed by microorganisms in the air directly affect people’s health. The air quality in an office building in Shenzhen, China, is investigated and pollutant levels measured on 36 occasions; six times for each of six indoor spaces. A relationship between indoor bioaerosols and environmental factors was determined using both linear regression analysis and Poisson regression analysis. Our results and analysis indicate that linear regression is a poor predictor for the concentration of bioaerosols based on a single indicator. In contrast, Poisson regression can better predict the concentration of bioaerosols, and PM10 may be the indicator with the greatest impact on bioaerosols. As a result, a simple, fast, and low-cost online monitoring method for monitoring indoor bioaerosols is developed and reported. Our paper provides first-hand basic data to predict the indoor bioaerosol concentration and helps to formulate appropriate monitoring guidelines. The proposed method offers more practical values compared to existing studies as our prediction model facilitates estimation of the concentration of bioaerosols at low cost. Additionally, due to the current maturity and low cost of indoor environmental sensors, the proposed method is suitable for large-scale deployment for most buildings.
Practical application
Based on measurement data from a real office building, our investigation explores the relationship between indoor microorganisms and building environmental indicators through a combination of probability analysis and actual measurement. We establish a novel indoor microbial prediction model using the Poisson regression model. Our work presents an effective, low-cost, method for estimating the concentration of bioaerosols and discusses the possibility for large-scale deployment of microbial monitoring equipment inside buildings which may then support real-time monitoring of indoor microbial concentration to provide healthy indoor environments for personnel.
Highlights
• A simple, fast and low-cost method for predicting bioaerosol concentrations is developed through monitoring data. • The effect of several factors affecting indoor bioaerosol concentration are examined in depth. • PM10 is the most significant influential indicator of indoor bioaerosol concentration. • The Poisson regression is more effective in explaining bioaerosol concentration compared with linear regression.
Introduction
People spend >90% of their time indoors,1,2 which means that indoor air quality (IAQ) can significantly affect human health. 3 Cases of COVID-19 have continued to occur worldwide and continue to occur in Shenzhen, China. The outbreak of COVID-19, monkeypox, influenza, and other epidemics has focussed many people's attention on the quality of indoor air and the indoor environment, particularly in relation their health and wellbeing. 2
The office building is a complex place with a concentrated population and frequent communication making it a key location for harmful microbial infections. The complex indoor environment contains many factors that affect indoor microbial concentration, including particles of different particle sizes, carbon dioxide (CO2), temperature, humidity, ventilation rate, season, height, etc.4–13
Epidemiological evidence shows that there is a relationship between indoor pollutants and health risks, 14 and indoor pollutants of concern include particulate matter (PM), biological organisms (fungal spores, bacteria, and viruses), allergens, over 400 different chemical compounds, mainly volatile organic compounds (VOCs) such as benzene, toluene, methanol, ethylbenzene and xylene, inorganic compounds (ICs) such as carbon monoxide (CO), carbon dioxide (CO2), nitrogen oxides (NOx) and ozone (O3), among others.15,16
Given that 5%–34% of particulate matter (PM) in indoor air is in the form of bioaerosols (i.e., bacteria), 17 these bioaerosols are accompanied by many harmful microorganisms and viruses, such as SARS-CoV-2 and other viruses, which are spread through bioaerosols.2,18,19 So they are gaining increasing research attention. Indoor bioaerosol concentration is a direct factor affecting indoor air quality and human health, and also a direct cause of the spread of influenza and other epidemic diseases. The composition and concentration of bioaerosols in the indoor air of buildings reported in the literature indicate that it is important to further study the relationship between indoor bioaerosols and various measurable environmental factors to predict the concentration of indoor bioaerosols and prevent indoor infection. In this case, the quantitative estimation of microorganisms in the air is used to monitor the concentration of indoor microbial aerosol and improve the safety of indoor air.
Culture-based methods have traditionally been used to determine the concentration of bioaerosols20,21 but as these require offsite processing in remote laboratories, they cannot supply real-time information and cannot be applied on a large scale, due to strict cultivation conditions, long cycles, and high costs. 22 Fortunately, there are correlations between indoor bioaerosols and other physical parameters, supplying the possibility to explore a simple, fast and low-cost bioaerosol concentration prediction method. 23
Different environmental factors can affect the distribution and survival ability of indoor microorganisms, such as the survival ability of SARS-CoV-2 and its distribution in the environment. 24 Research has shown that air pollutants, especially particulate matter, and other meteorological factors, are important carriers of infectious microorganisms and play a crucial role in the spread of diseases. 25 The ability of microorganisms to survive and maintain their pathogenicity in ambient air depends on the following conditions: relative humidity (RH), temperature (T), ventilation, or chemical composition.19,26–29 The survival rate of microorganisms under low relative humidity is low, and the ventilation airflow is directly related to the relative humidity,19,30,31 and the ventilation airflow affects the distribution of bioaerosols in the indoor environment.19,32 RH levels between 40% and 70% can help reduce the spread of the virus, and engineering controls need to be implemented by adjusting the HVAC system to ensure optimal humidity in the indoor environment.26,30,33,34 At the same time, temperatures above 30°C and RH below 78% will strongly weaken the spread of SAS-CoV-2. 34 Moreover, more researchers insist that carbon dioxide (CO2) can reflect the trend of bioaerosol concentration, and strongly recommend that CO2 concentration be used for infection risk-based monitoring.35–39
Research has shown that particulate matter pollution is a serious global risk factor to human health among all key pollutants, 40 and PM2.5 levels are positively correlated with COVID-19 exposure risk, 25 as fine particles (FPs) and ultrafine particles (UFPs) have small particle sizes and large specific surface areas, making them easy to adsorb metals, microorganisms, and other pollutants. 40 Particles may play a role in the differential distribution and propagation rate of SARS-CoV-2. 41 Smaller particles can be used as tracers to estimate the air exchange rate, and the real-time air exchange rate of buildings can be predicted,42,43 so the real-time and recent concentrations of bioaerosols and particles (PM) can be determined with relatively high accuracy. 22 However, they can only be used as agents and cannot accurately reflect the distribution and quantity of indoor bioaerosols in real-time. 22
The above studies show the relationship between bioaerosols in indoor air of buildings and various environmental parameters, but these studies do not involve integrating these measurable parameters with the prediction of bioaerosols. However, in reality, environmental factors may lead to significant changes in space and time. 31 Therefore, it is necessary to consider the spatial changes of temperature, relative humidity, ventilation, particulate matter, and other environmental factors in the whole room to accurately determine the real indoor bioaerosol concentration in real-time. Because of the importance of preventing the spread of bioaerosols in the indoor environment, low-cost technologies that can accurately monitor indoor bioaerosols, especially the concentration of bioaerosols in the air, 44 are urgently needed.
Particle concentration, temperature, and relative humidity (RH) can be fitted into a multi-linear regression model, enabling it to reasonably and accurately predict the concentration of bacteria and fungi in indoor air from culture-based data. 45 Real-time sensor data can also be used to monitor key environmental indicators (including indoor temperature, carbon dioxide concentration, relative humidity, and water consumption). The large amount of data from these real-time sensors can help to model and predict indoor air pollution, to determine the real-time and recent concentrations of indoor bioaerosols with relatively high accuracy.22,44,46–48
The prediction models of indoor bioaerosol concentration mainly include linear regression, nonlinear regression, empirical equations, and other prediction models,9,12,49,50 and the use of linear regression models is better than the use of nonlinear regression models,49,50 and the study of bioaerosol models is better in predicting single office buildings. 49
So far, although the indoor bioaerosol concentration is clearly specified in China’s Standards for indoor air quality GB/T 18883-2022, 51 there is no detailed regulation for different office sections in the office building. In addition, there needs to be a more detailed analysis of the factors affecting the bioaerosol concentration in indoor environments, such as office buildings, and the development of prediction models.
The study will further explore the qualitative and quantitative relationship between indoor bioaerosol concentration and measurable environmental factors, and try to develop a simple, fast and low-cost bioaerosol concentration prediction method, as a simple alarm tool for indoor air quality in office buildings.
At present, no method has been developed that can continuously and accurately determine the real-time and near-future indoor microbial bioaerosol concentration. Therefore, in this study, the qualitative and quantitative relationship between indoor bioaerosol concentration and measurable environmental factors will be further explored, and a simple, fast and low-cost bioaerosol concentration prediction method will be developed based on linear regression and Poisson regression to accurately predict the continuous real-time and recent bioaerosol concentration using the environmental parameters monitored in real-time by indoor environmental monitoring sensors. The ability to predict the real-time and different durations of recent bioaerosol concentrations is very important for taking mitigation measures to deal with imminent and potential health risks. 52
Methodology
An office building in Shenzhen, China, was completed in 1996. The building has an area of 32,000 m2 and a total of six floors, as shown in Figure 1. Shenzhen is located in an area where summer is hot, and winter is warm with the average yearly temperature is 23.3°C.
53
The average temperature in January of the year is the lowest, with an average of 15.7°C. The average temperature in July is the highest, with an average of 29.0°C. The summer lasts for over 6 months (with an average summer length of 202 days).
53
Representative space in the office building is selected for on-site monitoring, including one office, one meeting room, two toilets and two corridors. With different environmental factor data as independent variables and microbial concentration as dependent variables, we analyse the correlation between microbial concentration and environmental factors and establish corresponding prediction models. The model with the best prediction accuracy is then selected as most representative of the real office building indoor microbial environment. Case study office building in Shenzhen, China.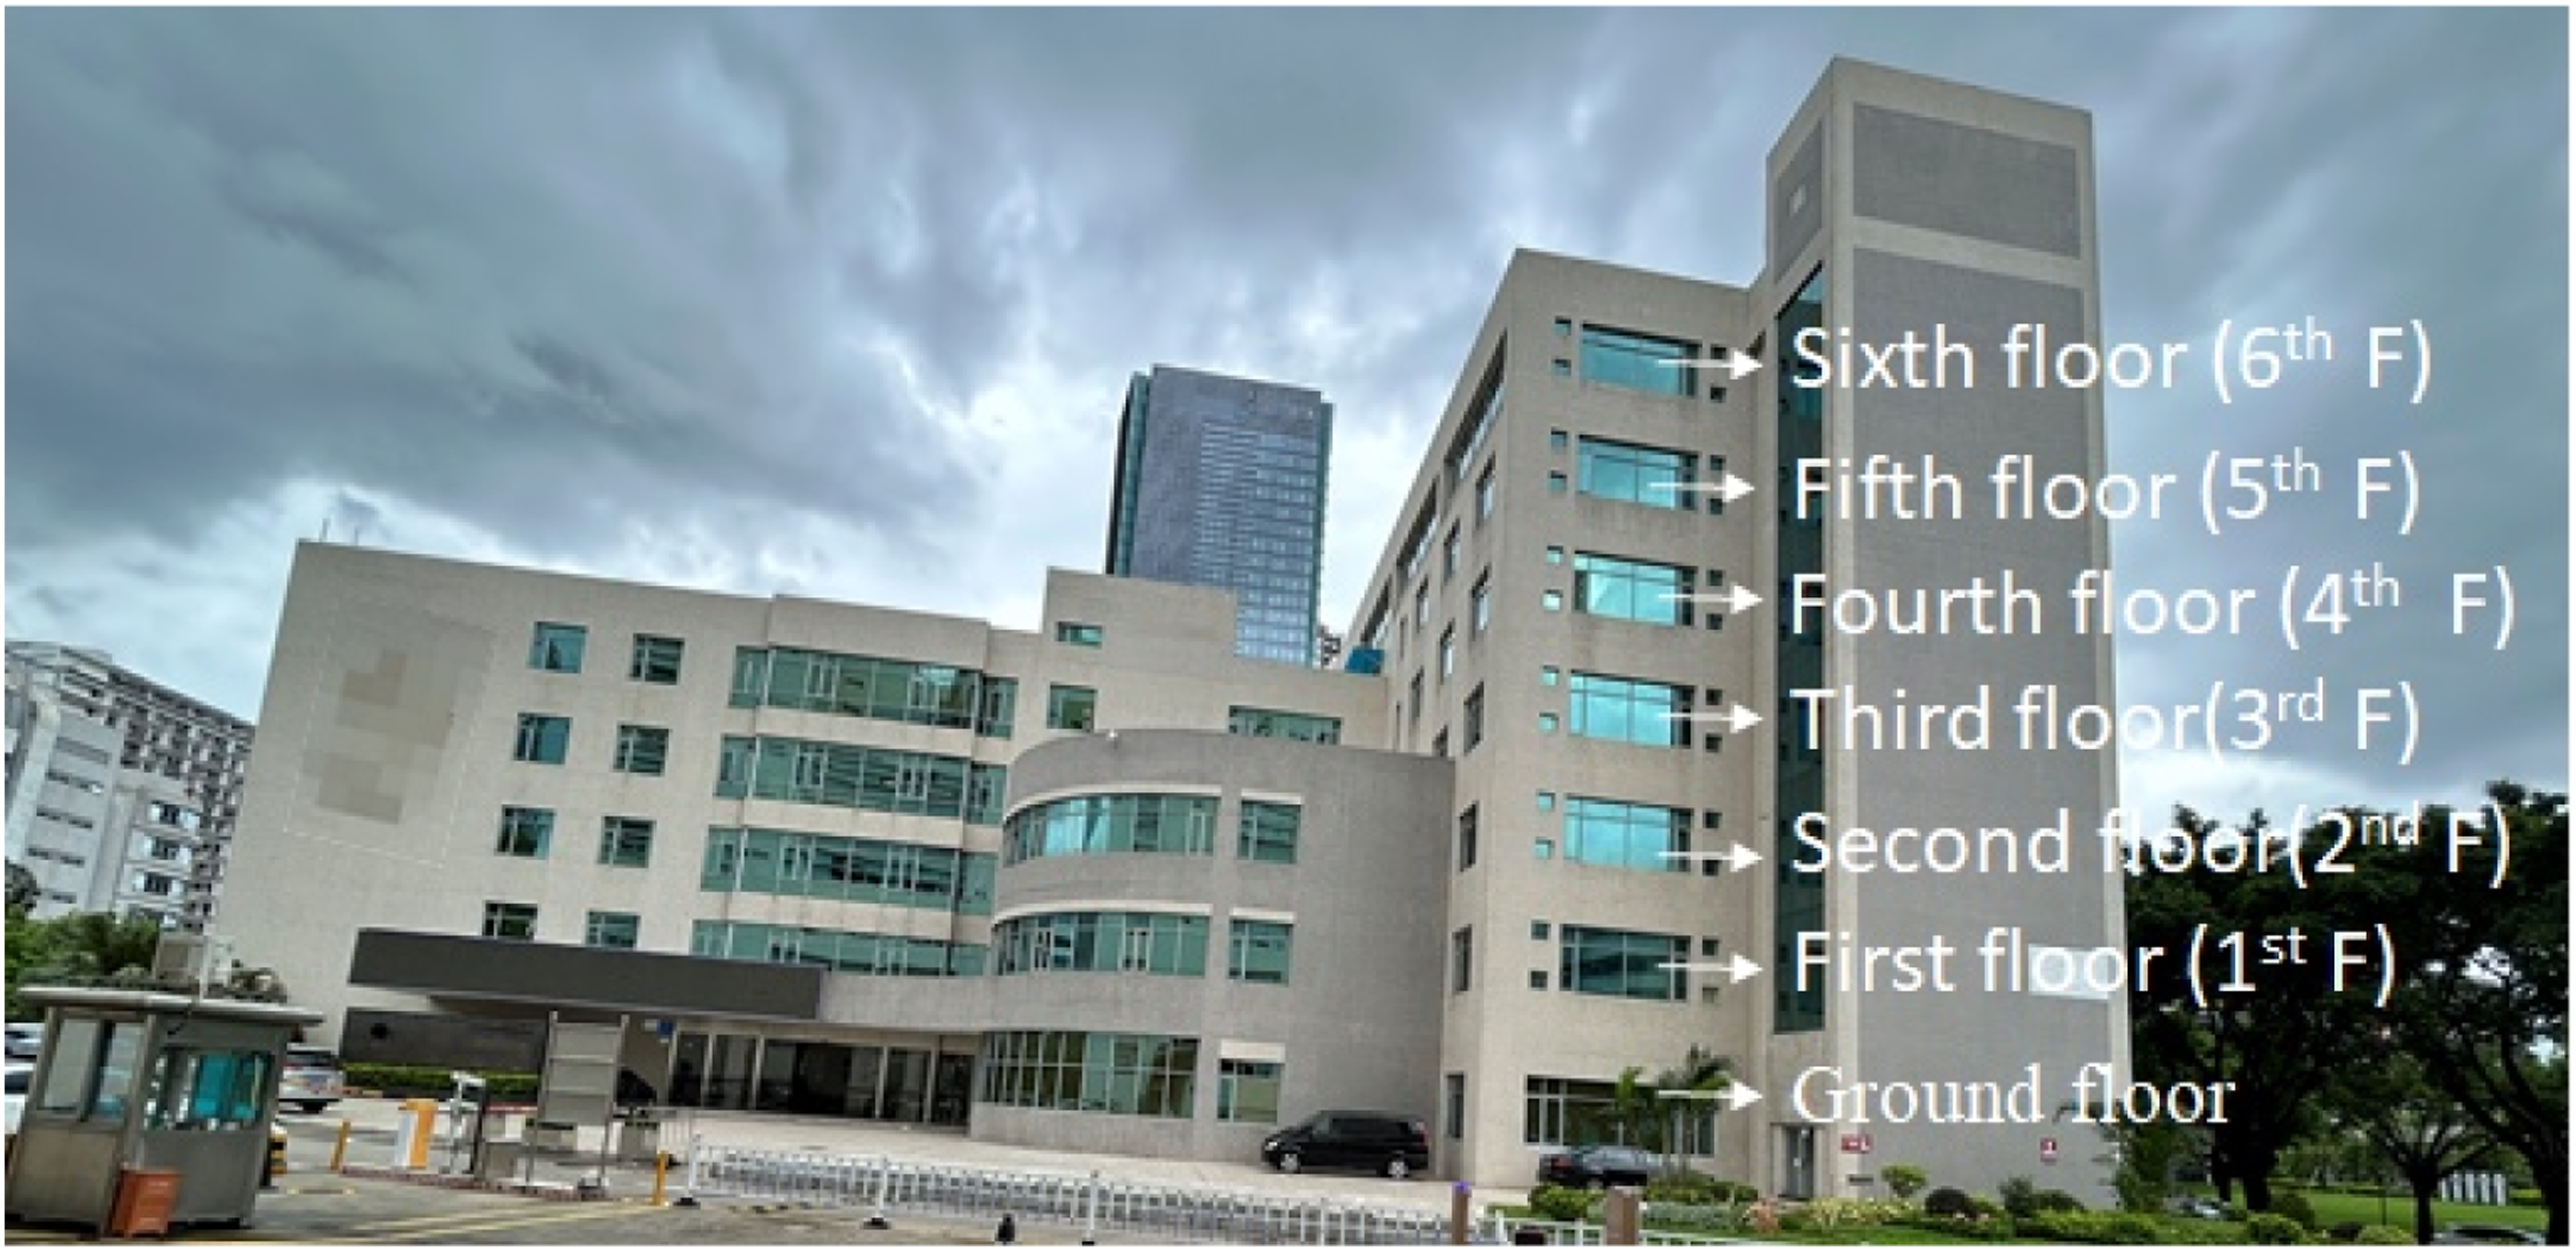
Sampling plan and field measurement
The location and time of measurement.
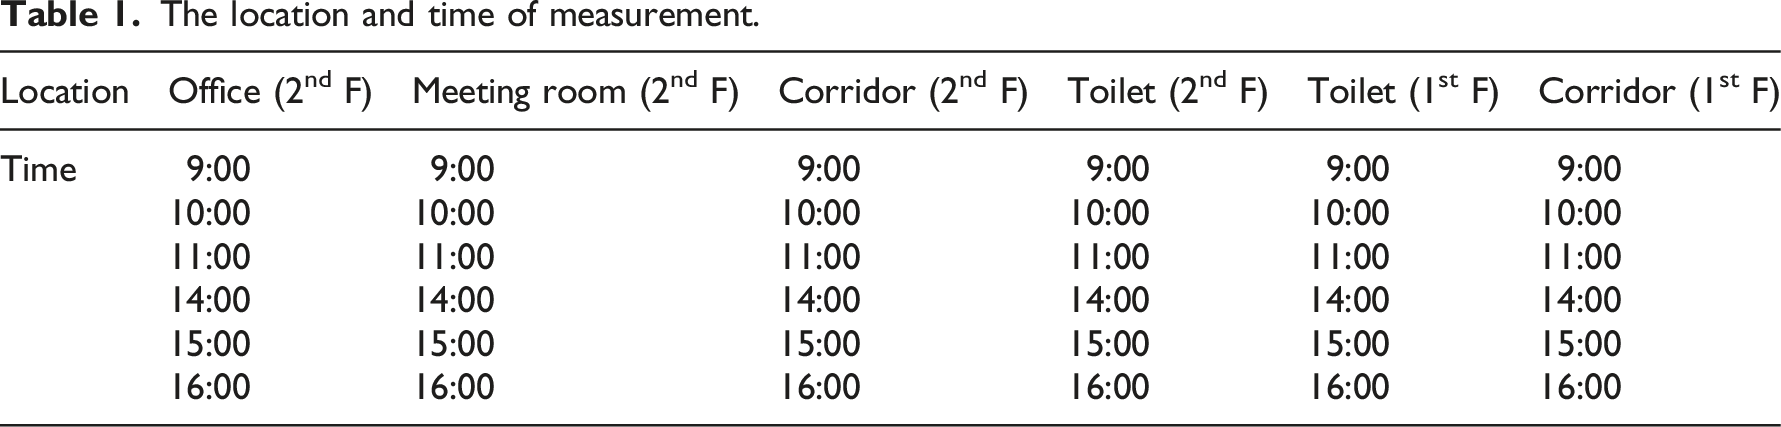
Using different air quality monitoring sensors to monitor indoor air pollutants in six different locations in Shenzhen, including bioaerosol concentration, particulate matter (including PM1, PM2.5, PM4, PM10, and Total Particulate Matter (TPM)), CO2 concentration, the air exchange rate (ACH), temperature (T), and relative humidity (RH).
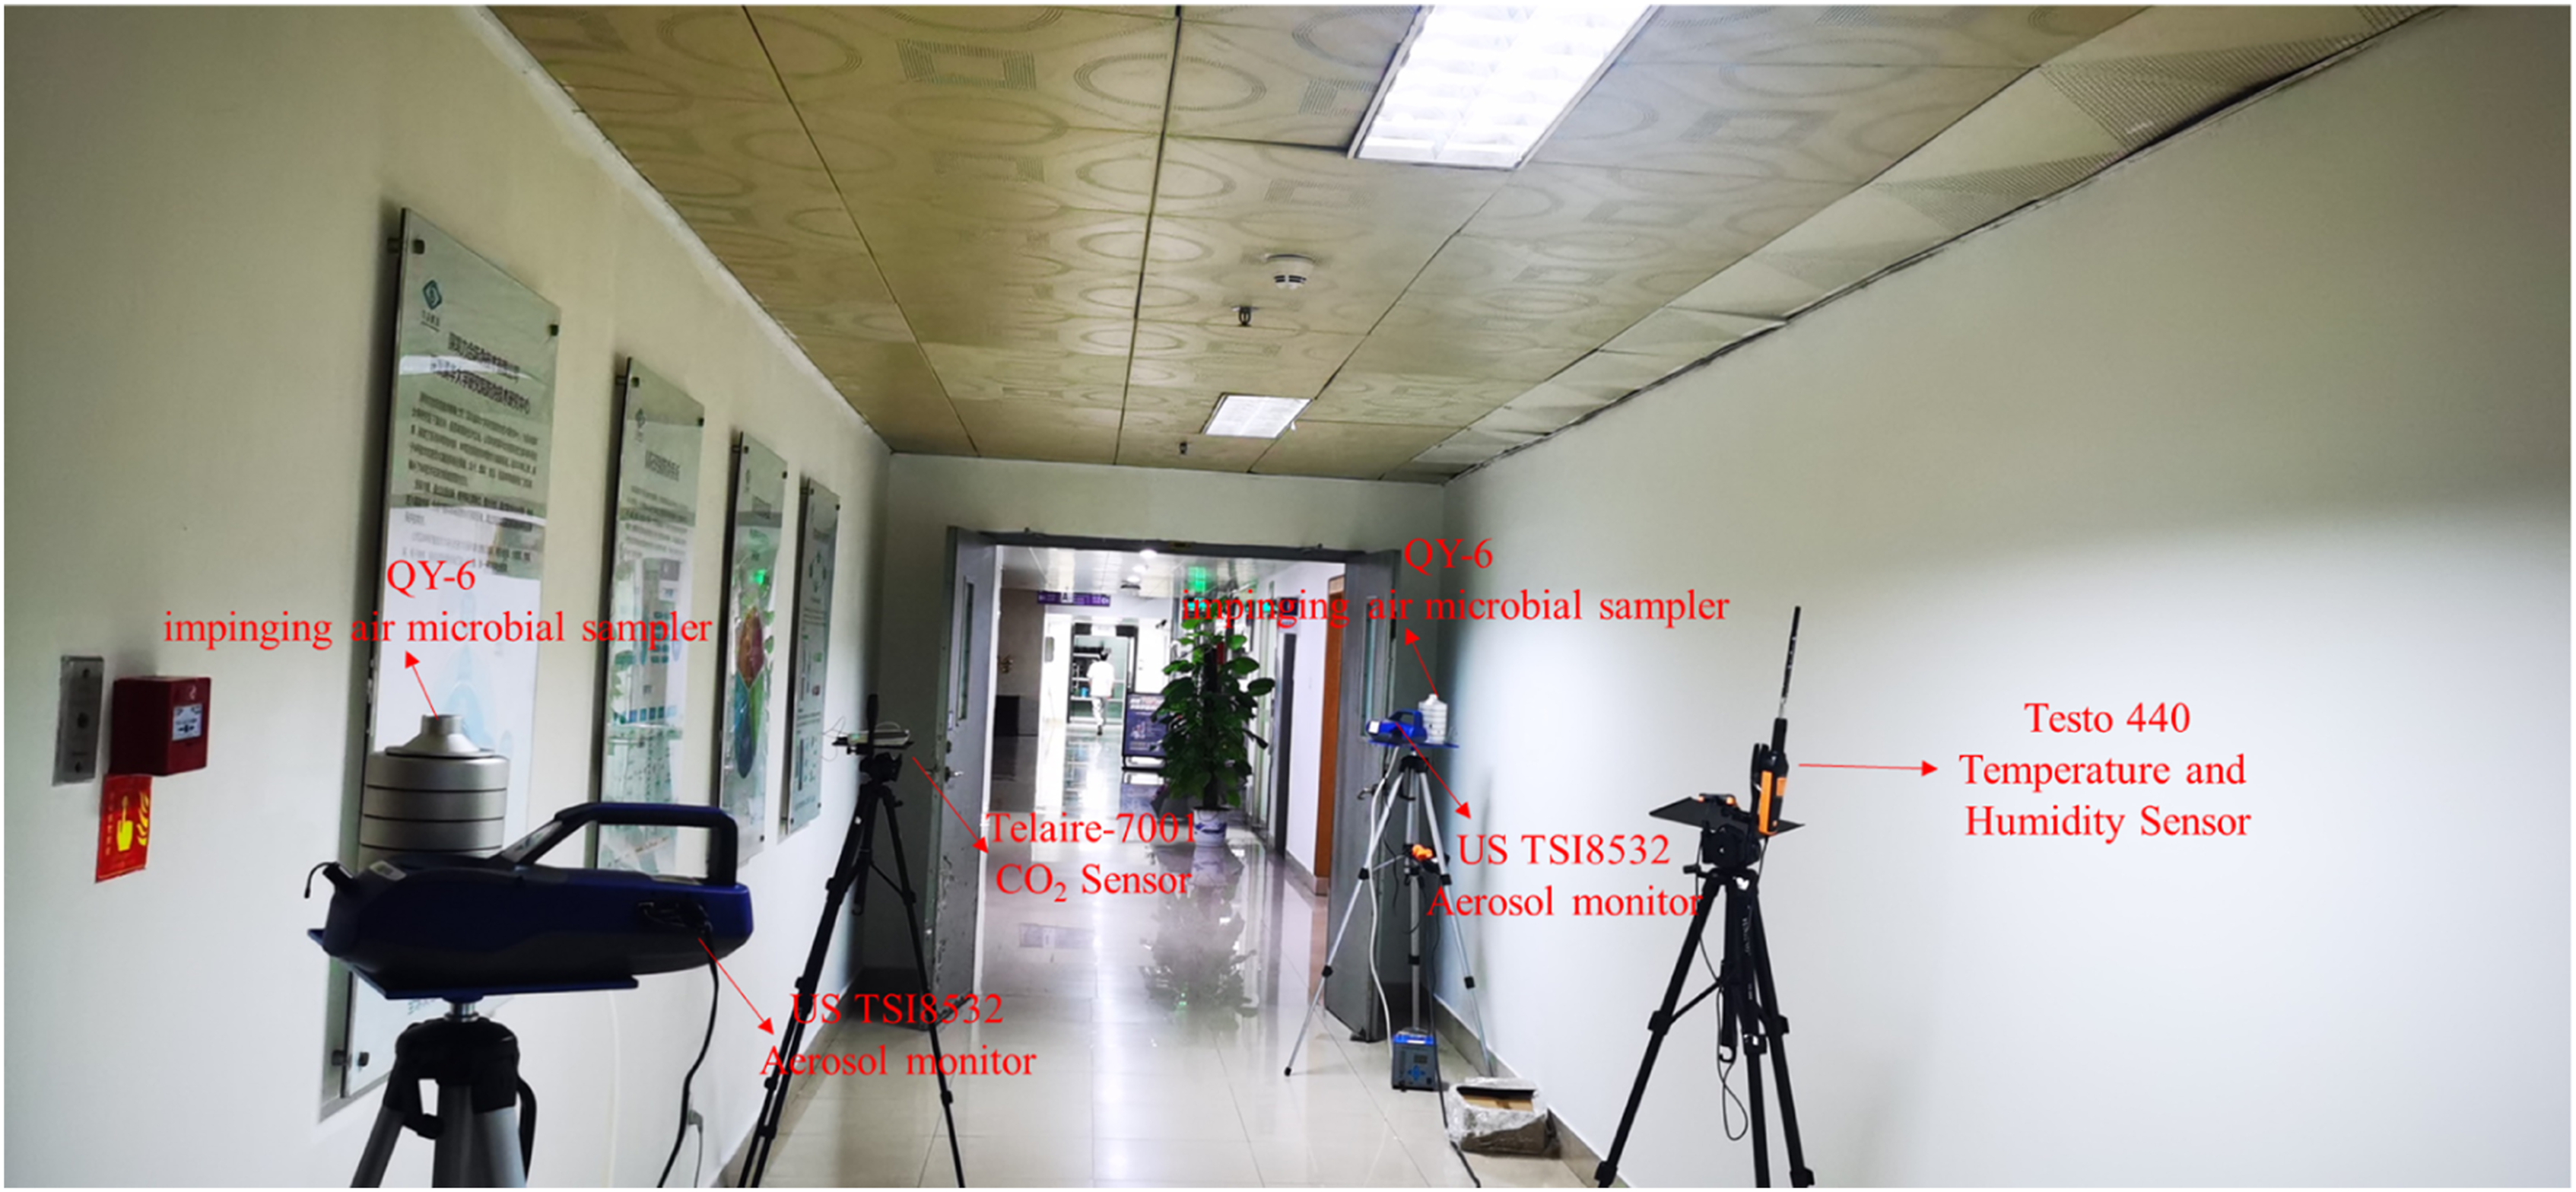
Two QY-6 impinging air microbial samplers are used for bioaerosol sampling, two US TSI8532 aerosol monitors are used to monitor the concentration of particles corresponding to PM1, PM2.5, PM4 and PM10, one Telaire-7001 CO2 Sensor is used to measure indoor CO2 concentration, and one testo 440 probe system is used to measure indoor temperature and humidity. The sampling points follow the principles of diagonal and centreline layout, as shown in Figure 2. Two QY-6 and two TSI8532 aerosol monitors were placed diagonally in the measurement room, while Telaire 7001 and Testo 440 were placed at the centreline of the measurement room. The on-site measurement location diagram is shown in Figures 3 and 4. Sampling point layout principles. Example 1 of on-site measurement location. Example 2 of on-site measurement location.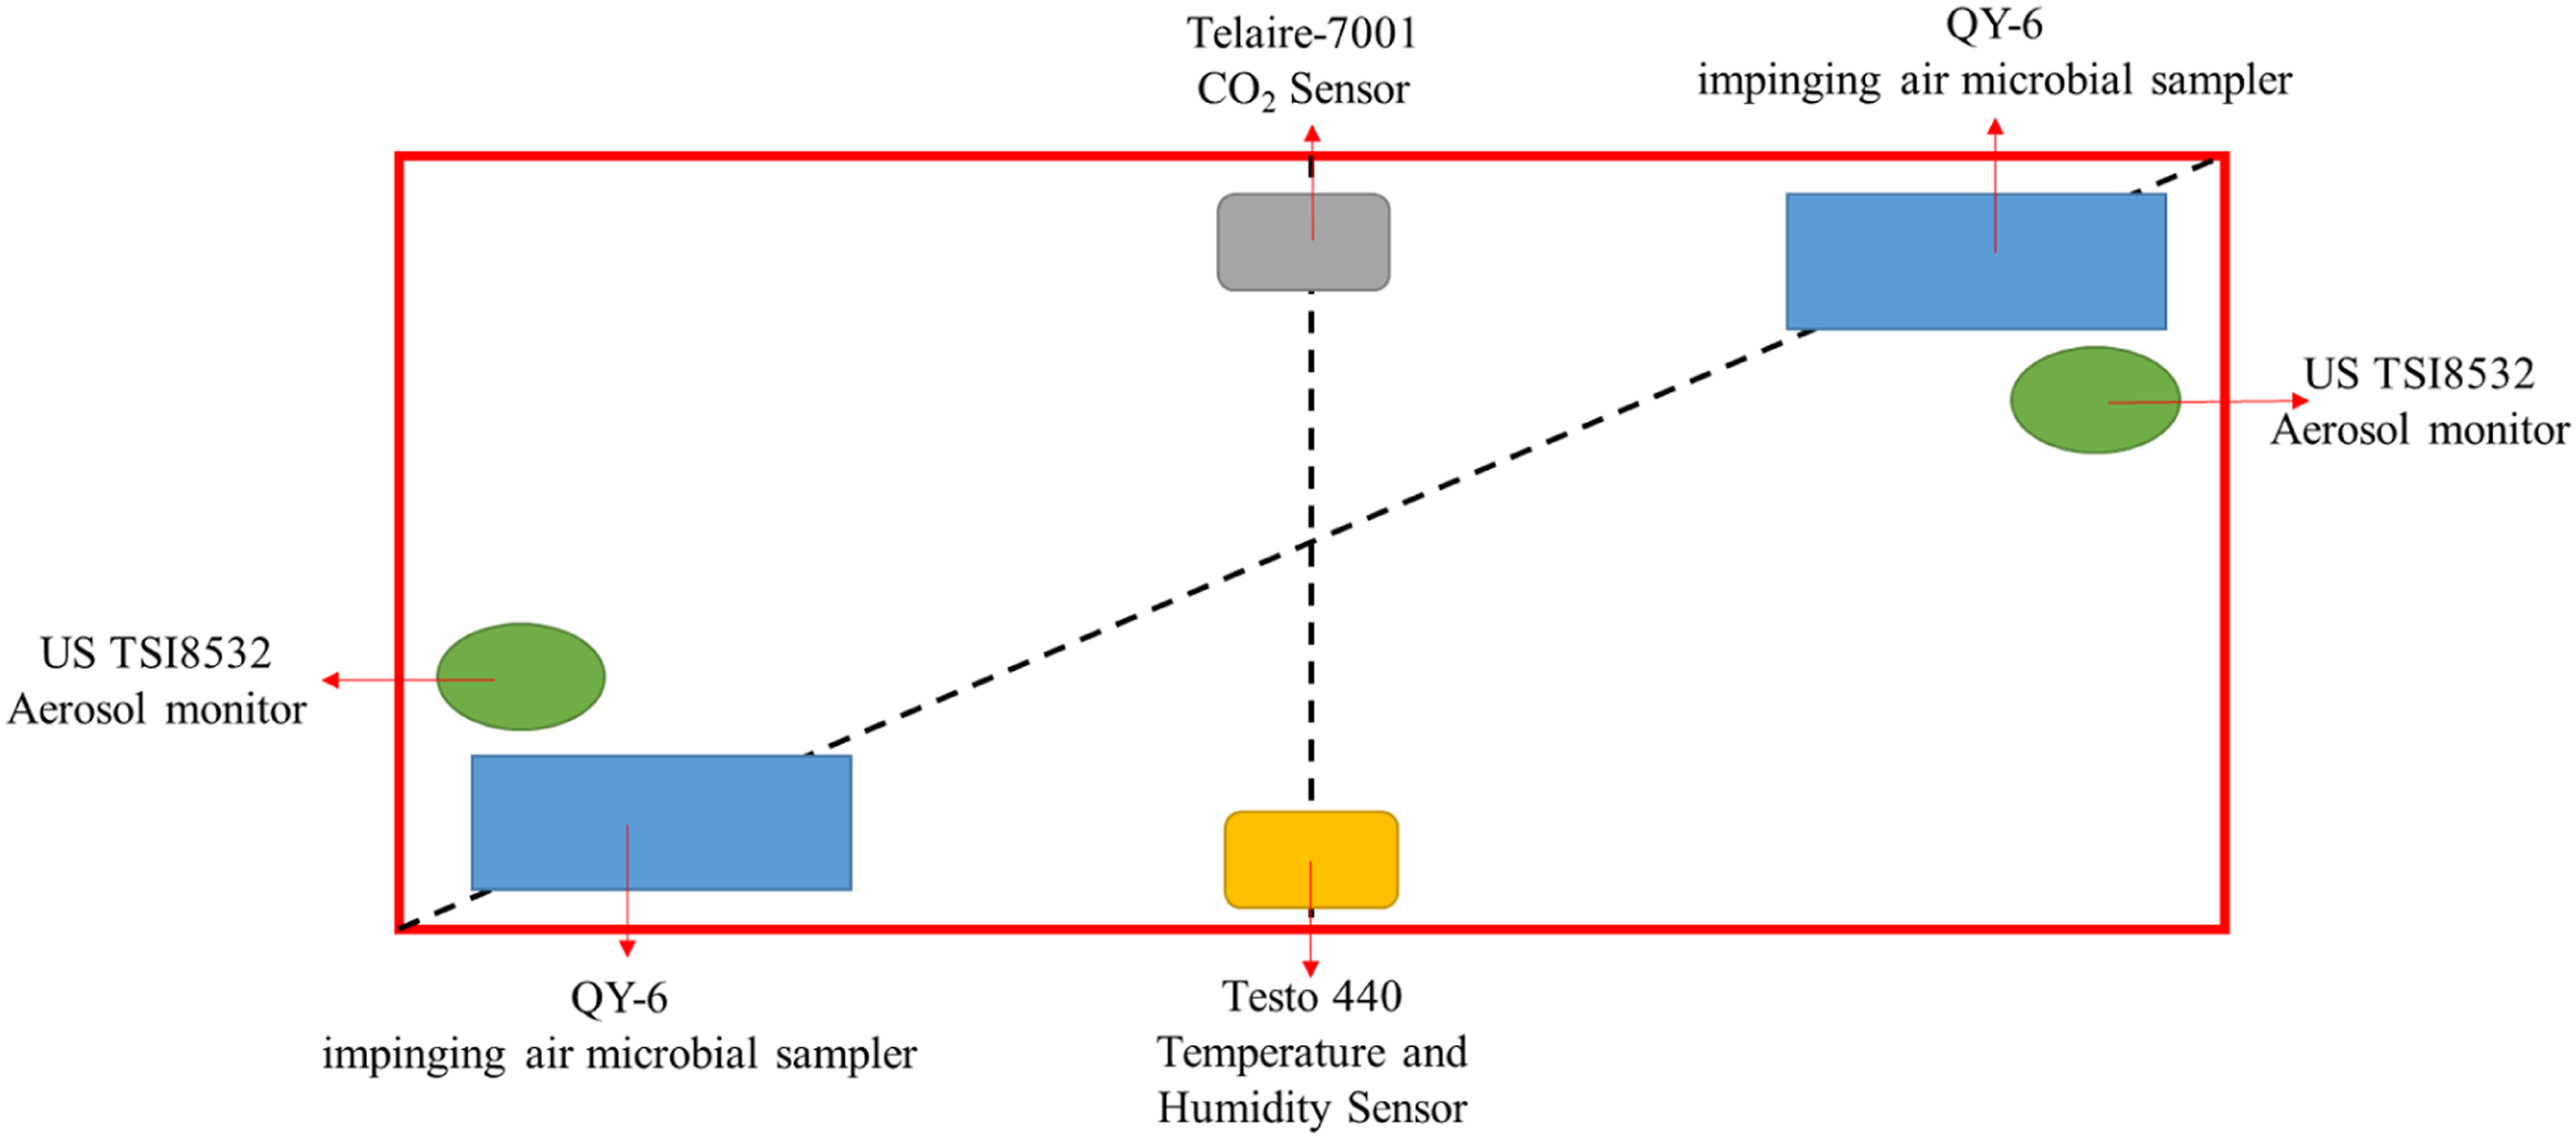
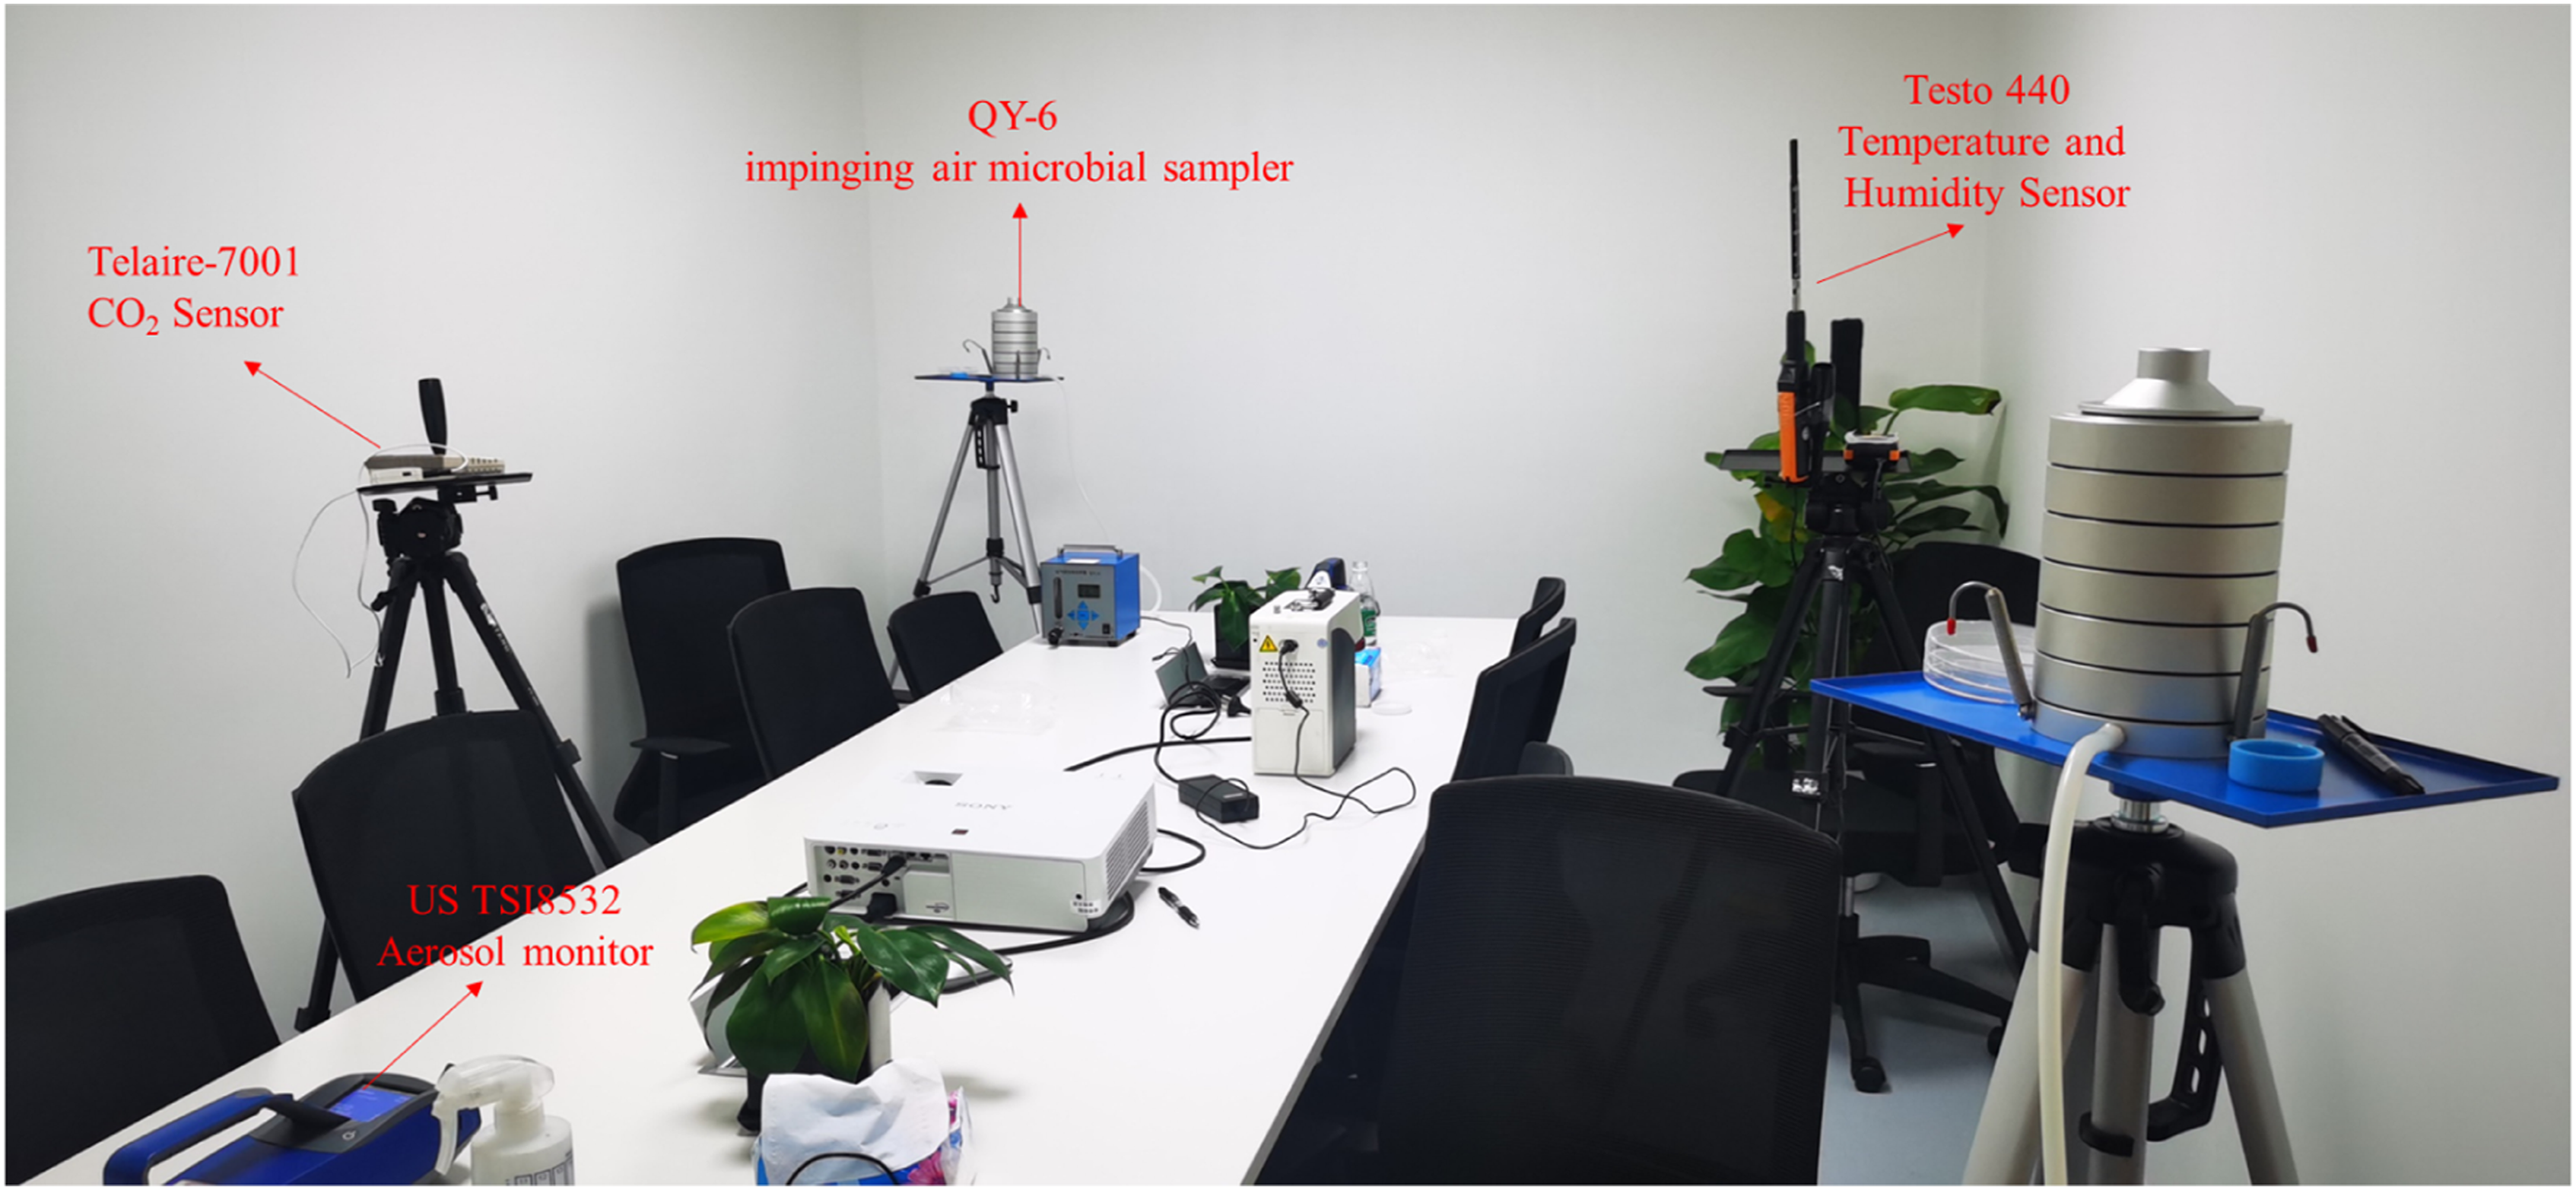
The microbiological sampling method is the Chinese Examination methods for public places-Part 3:Airborne microorganism (GB/T 18204.3-2013), and the QY-6 impinging air microbial sampler is used for bioaerosol sampling. The sampler can capture six levels of particle range (Level 1: ≥ 7.0 μm; Level 2: 4.7–7.0 μm; Level 3: 3.3–4.7 μm; Level 4: 2.1–3.3 μm; Level 5: 1.1–2.1 μm; Level 6: 0.65–1.1 μm), capture rate:>98%, sampling flow rate: 28.3 L/min (0–45 L adjustable), directly capturing microorganisms in the air onto the culture dish containing nutrient agar. After sampling, put the sample in a 37°C constant temperature incubator for 48 h, and then assign a special person to record and calculate the total number of bacterial colonies.
The concentration of bioaerosol in the air is calculated according to equation (1):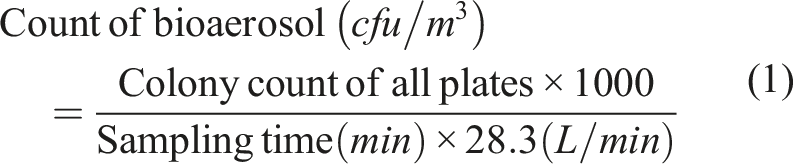
Particulate matter (including PM1, PM2.5, PM4, PM10, and TPM), CO2 concentration, ACH, T, and RH of indoor space were investigated.
The US TSI8532 aerosol monitor is used to monitor the particle concentration corresponding to PM1, PM2.5, PM4 and PM10, and can monitor the particle concentration range from 0.001 to 150 mg/m3.
The testo 440 probe system can be used for continuous measurement of the temperature and humidity, with a measuring range of 0 to 100% and −20 to + 70°C.
The Telaire-7001 CO2 Sensor can be used to measure indoor CO2 concentration, with a measurement range of 0–10000 ppm and an accuracy of ±50 ppm.
Some studies show that the content of bioaerosol in outdoor air is usually higher than that in indoor air.54–56 Therefore, to reduce the impact of outdoor microorganisms, the air conditioning system is closed during measurement to reduce the impact of outdoor air aerosol. The carbon dioxide concentration is used to calculate the indoor air exchange rate ACH, and the calculation equation is shown in equation (2).54,55,56
Data analysis and processing
The data recording of the continuous monitor should be at least 1 min for sampling the initial air quality. The sampling interval of all monitoring equipment was set as 1 s and data were averaged and logged at 10-min intervals. Microsoft Excel and SPSS 22.0 were used to process and analyse the data. Microsoft Excel was used for basic statistical analysis to quickly process raw data, including calculation of range, median, and average. 49 Then SPSS 22.0 was used for more advanced statistical analysis, and the confidence interval was set to 95% for statistical significance.
All measurement data were tabulated and stored in Excel. Before using the measurement data in the model, the following four steps are performed to organize the measurement data to reduce the impact of measurement errors. Firstly, abnormal data was removed from the dataset. Secondly, we perform a mean interpolation to fill in any missing values for all parameters. This provides three and four-time series data points for the bathroom and corridor, respectively. Thirdly, the measurement data adopts an average to reduce errors, that is, directly processing the average results of a series of measured values with internal differences.49,57 After the bioaerosol concentration is cultivated in the laboratory, the concentration of two groups of bioaerosols at the measurement location and time is obtained by equation (1), and the average value is taken as the model application data. The US TSI8532 aerosol monitor counts and measures particle concentration every minute for a total of 10 min (obtaining 10 sets of data). The data is averaged every minute, and then the average of these 10 sets of data is taken as the model application data. Temperature, relative humidity, and CO2 concentration were measured using an instrument that counts data every minute for a total of 10 min (resulting in 10 sets of data). The average of these 10 sets of data was taken as the model application data. Fourthly, obtain the corresponding ventilation rate according to equation (2). Finally, the model uses nine parameters (temperature, relative humidity, CO2 concentration, ventilation rate, and five different particle size particle concentrations) as input factors and bioaerosol concentration data as target factors to study the prediction model for indoor bioaerosol concentration.
Linear regression and Poisson regression analysis were conducted with the concentration of bioaerosols as the dependent variable and particulate matter, CO2 concentration, ACH, T, and RH as independent variables. First, the p-value of the whole model is analysed. If the value is less than 0.05, the model is valid. Otherwise, the model is invalid. Then when the p-value of an indicator is less than 0.05, it indicates that the indicator will impact the bioaerosol.
Development of prediction model for bioaerosol concentration
The indoor bioaerosol concentration and other indoor indicators may not be purely linear but more likely to show a probability correlation. Chao 6 found in his research on the indoor air of 37 office buildings in Taipei, Taiwan, that it is better to use multiple linear regression model to predict the microbial concentration of an office building, but field measurement found that the microbial concentration and indoor physical parameters are not completely corresponding to the linear relationship, and the bioaerosol concentration relationship in the same local reaction area is more likely to be a probabilistic problem, thus realizing online monitoring. Therefore, the paper attempts to use Poisson regression analysis and compare it with linear regression analysis.
The Poisson regression model is used to describe the frequency distribution of an event found in unit time, unit area or unit volume and is usually used to describe the distribution of rare events (i.e., small probability).
58
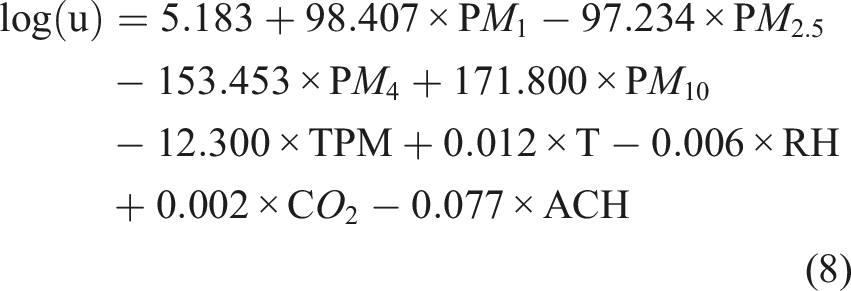
The indoor environment is not constant, and the bioaerosol concentration will change with external changes such as air circulation. Therefore, the bioaerosol concentration does not have a long-term linear relationship with other environmental parameters but more likely conforms to the probability model of Poisson regression. The prediction model of bioaerosol concentration is developed through Poisson regression model to predict indoor microbial concentration. The Poisson regression prediction equation (3) of indoor microbial concentration is as follows:
Results and discussion
Sample data
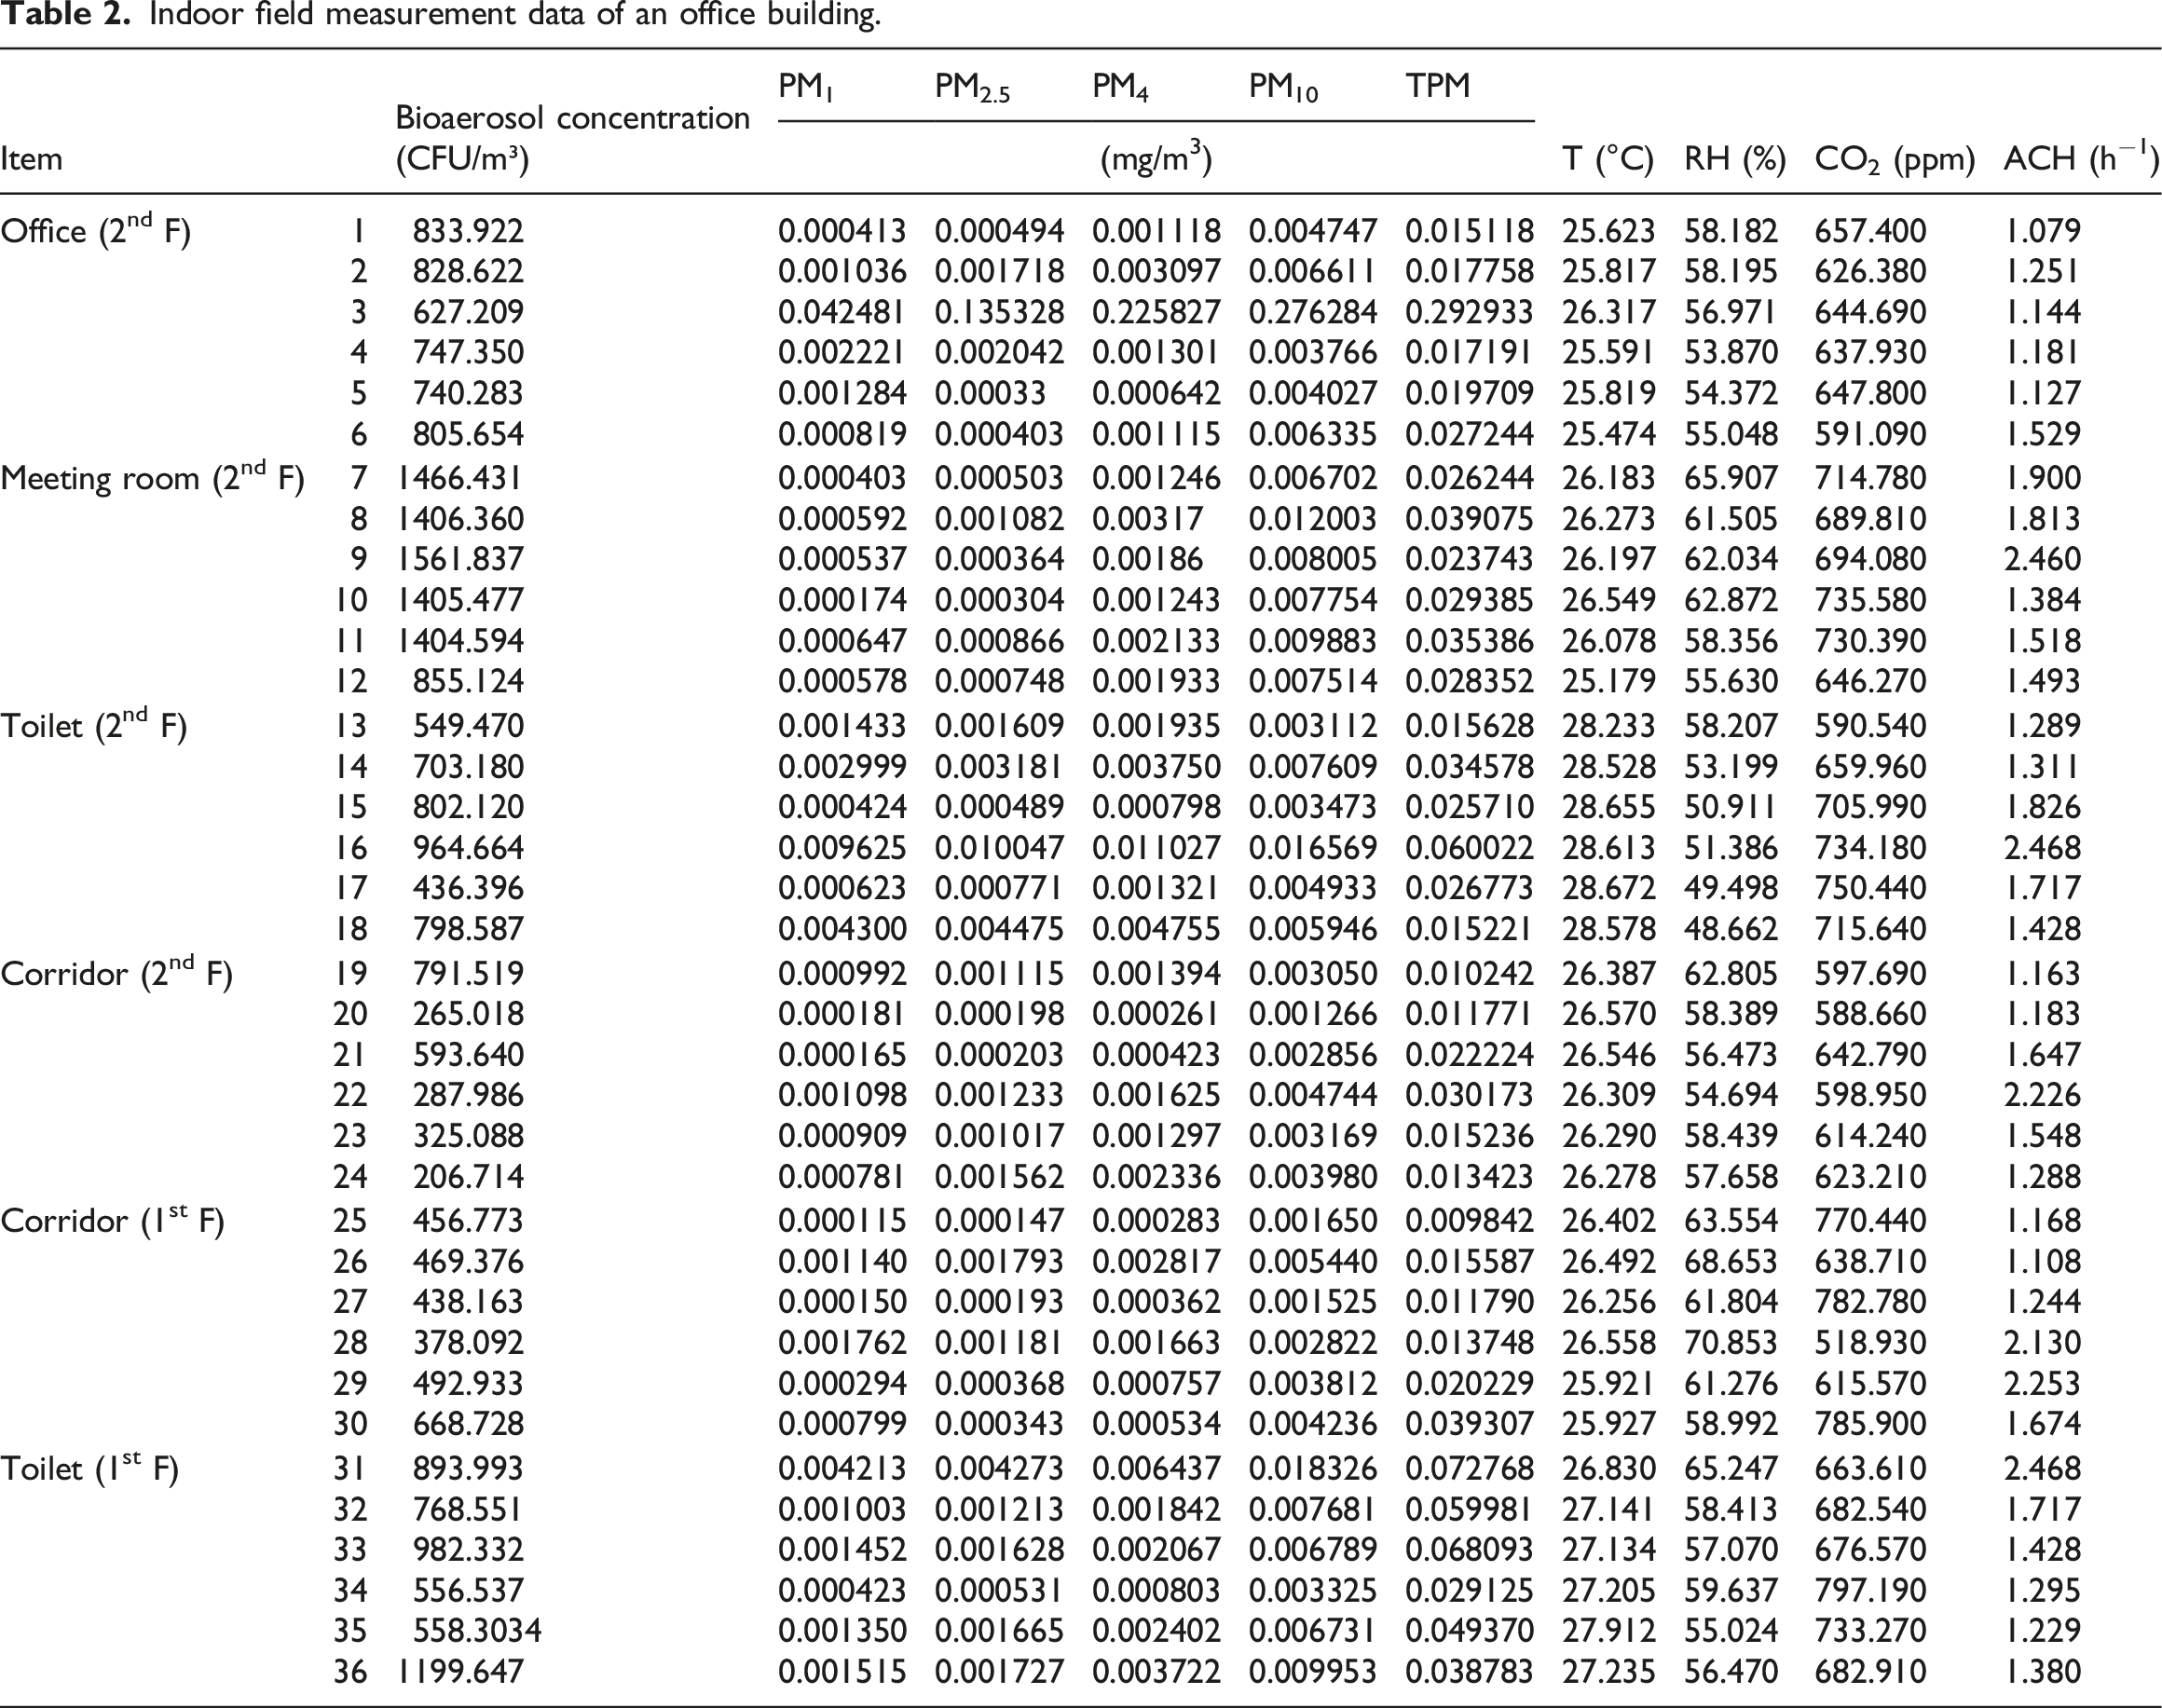
Indoor field measurement data of an office building.
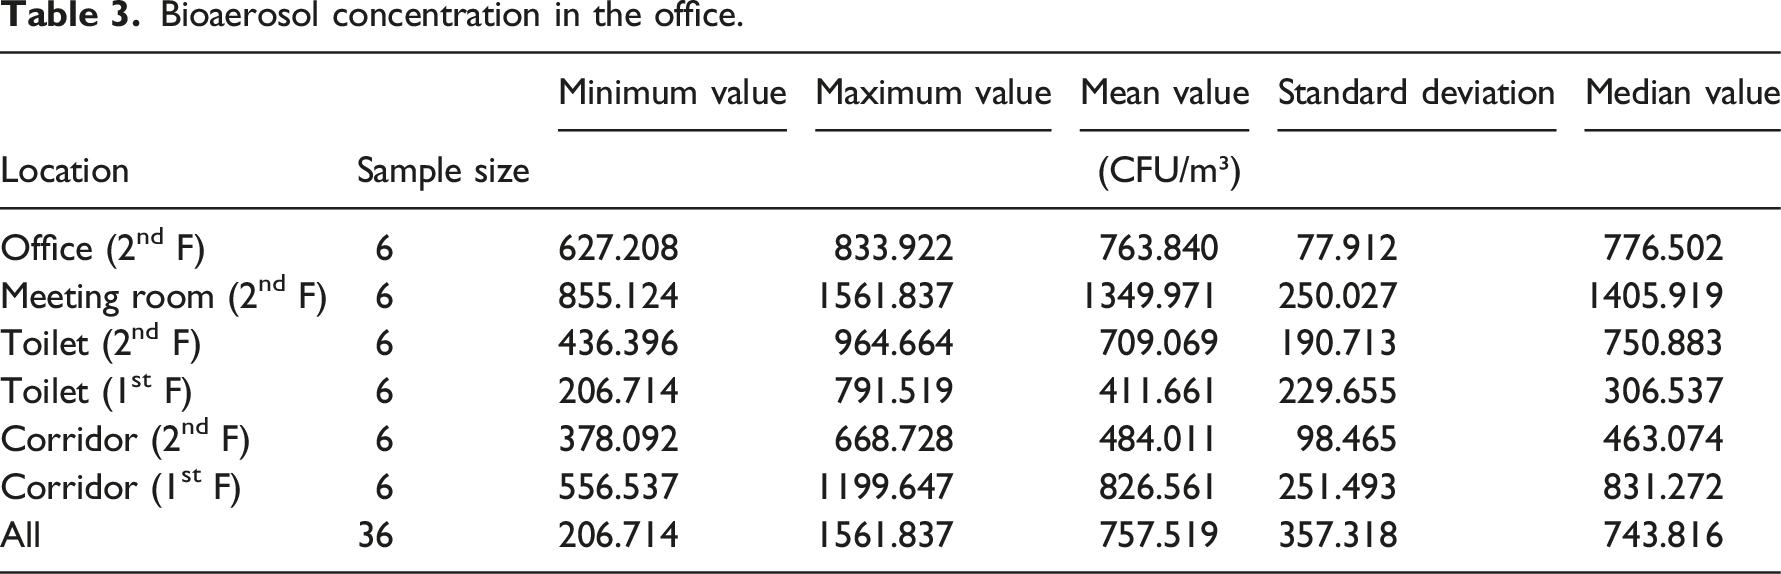
Bioaerosol concentration in the office.
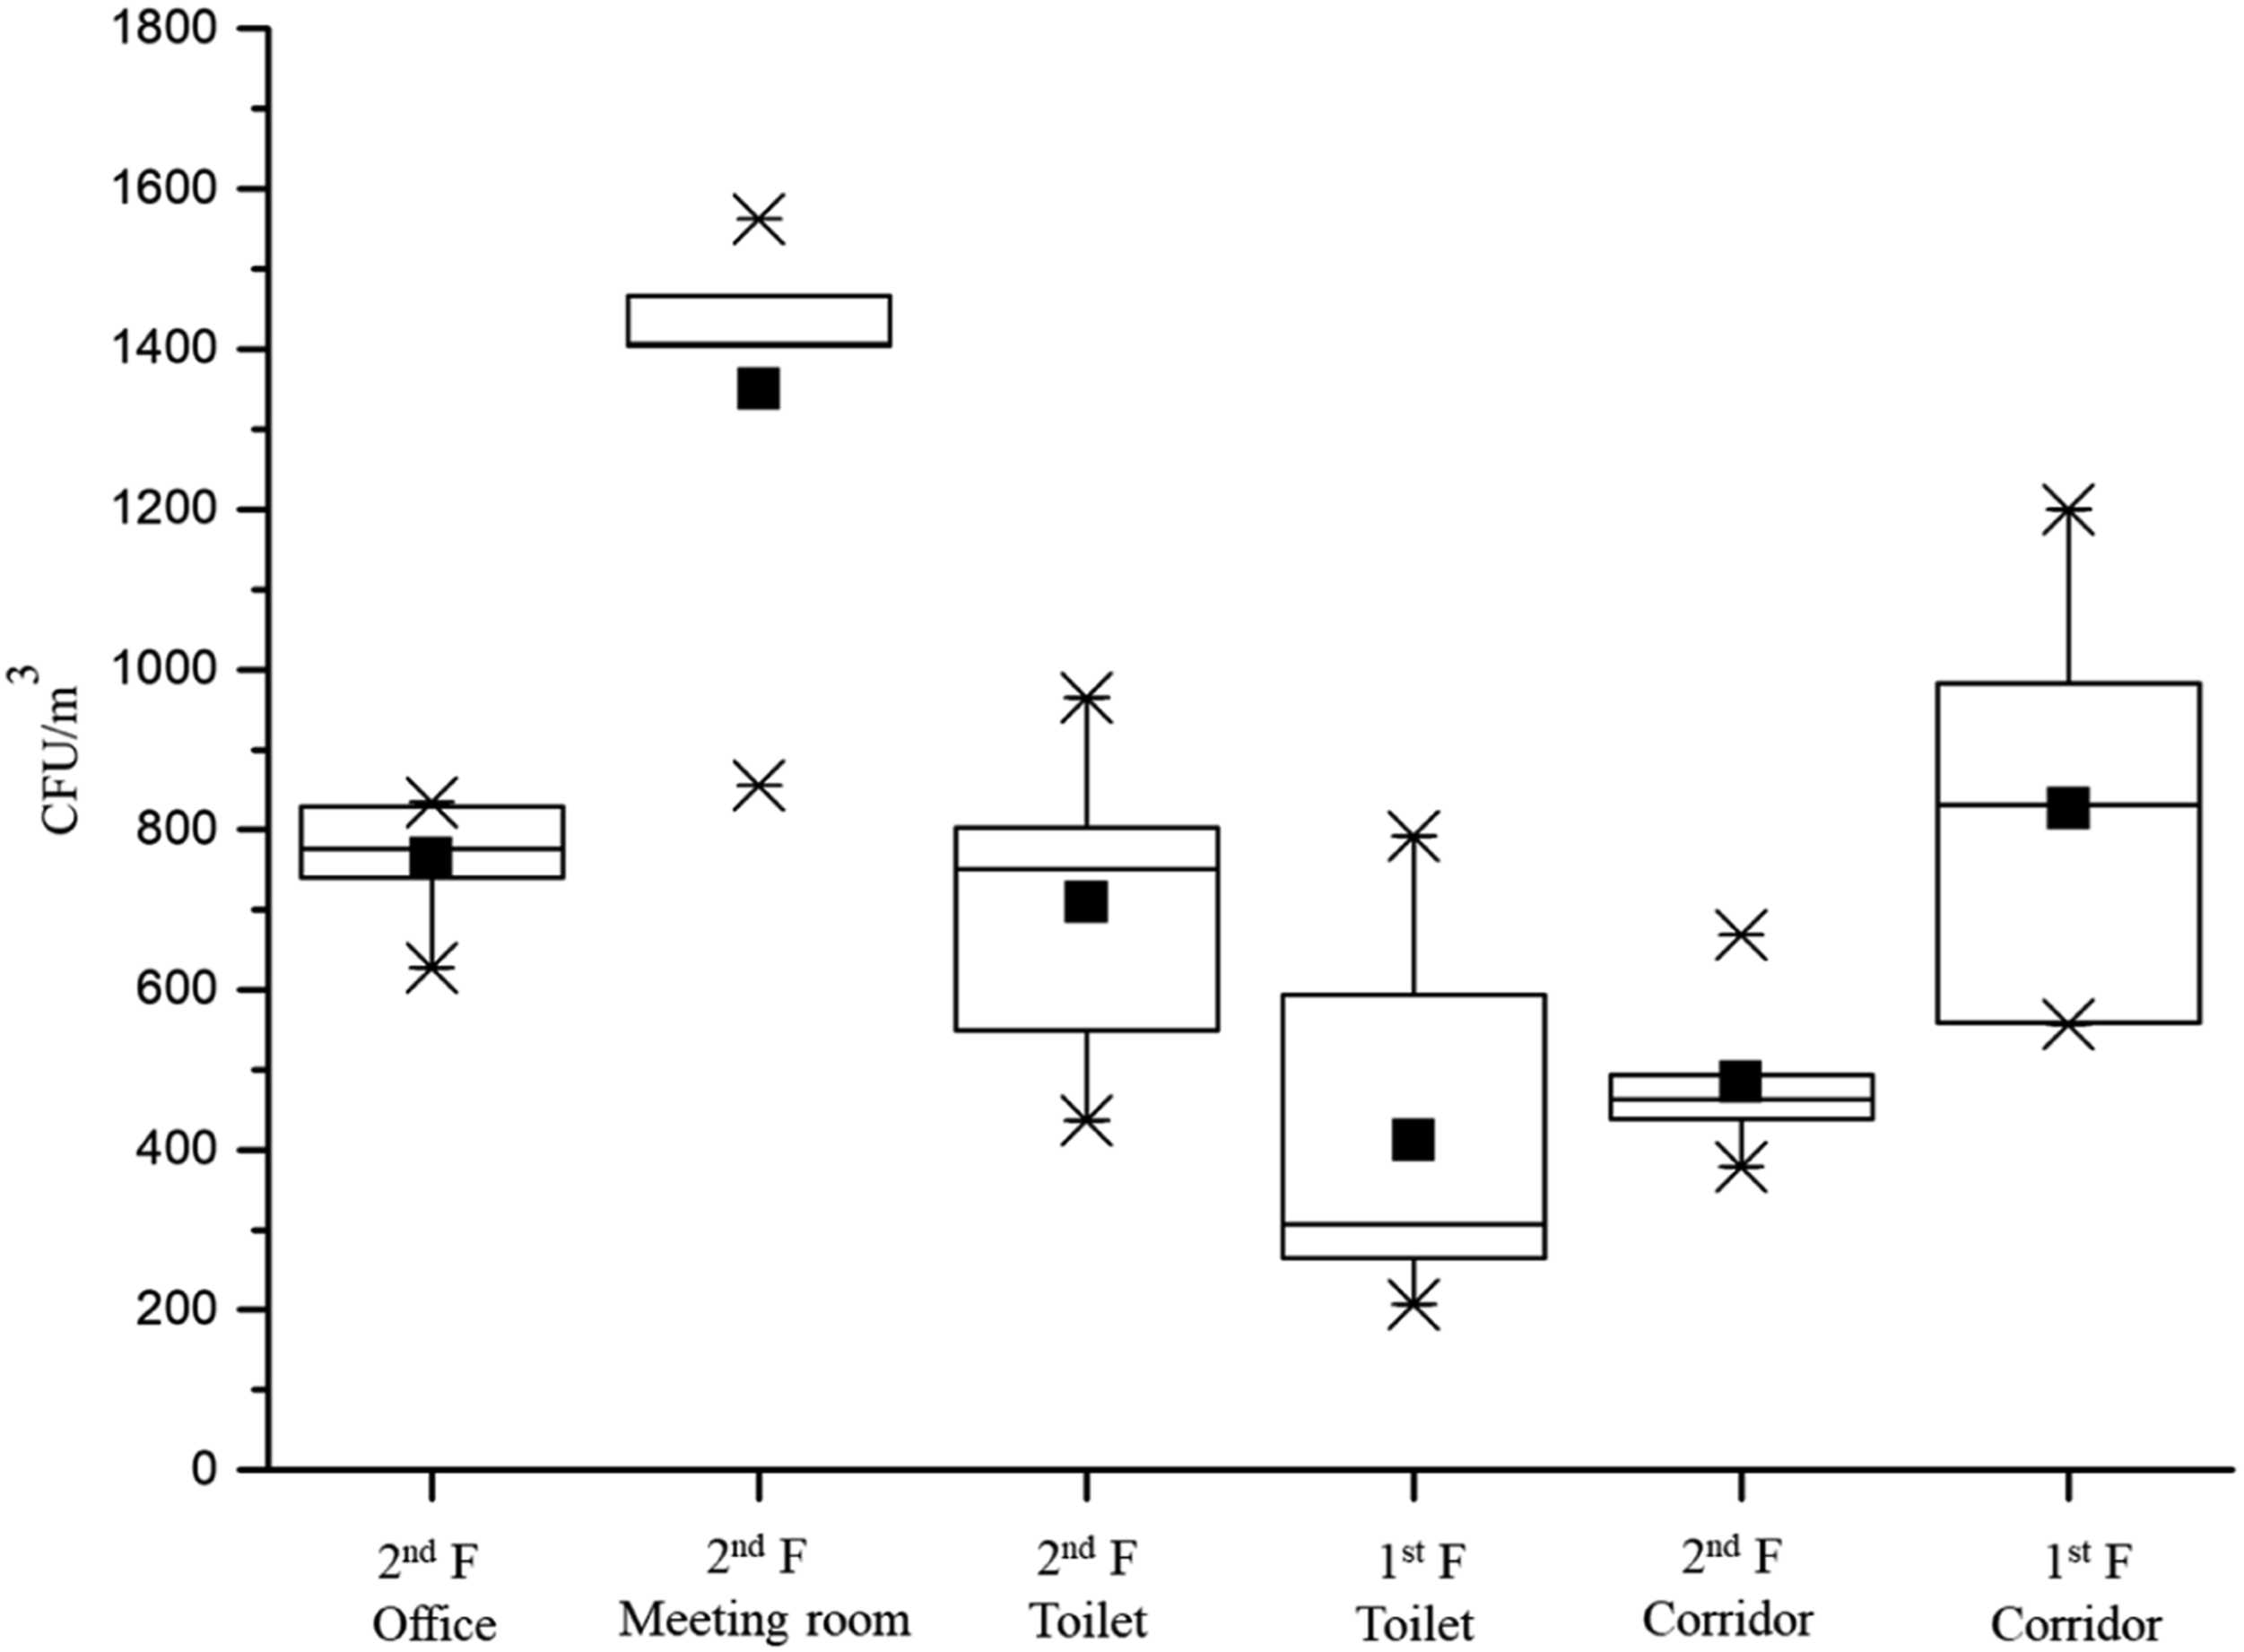
Building bioaerosol concentration quartile plot.
In addition, the measured microbial concentration is higher than in the study of Tseng et al. 49 and Li 59 but similar to the data obtained in the study of Wu et al. 60
Development and analysis of different prediction models
Table 2 presents the data from indoor measurements in this office building. The bioaerosol concentration was used as the dependent variable, and the particles with different particle sizes, CO2 concentration, ventilation rate, temperature, and humidity were entered into the model as independent variables to analyze the qualitative and quantitative relationships between different dependent variables and indoor bioaerosol concentration, and to establish other linear regression models and Poisson regression models.
Bioaerosols and particulate matter
Linear regression analysis
Linear regression analysis is a method of studying quantitative relationships between variables that are interdependent. 61 Linear regression uses the F-test for statistical test, which is used to compare whether the average between two or more groups is significantly different, to test whether the regression model is meaningful. If the model passes the F-test (p < .05), it indicates that the model is meaningful, and at least one independent variable will affect dependent variable. On the contrary, if the model does not pass the F-test (p > .05), it means that the model construction is meaningless, and independent variable will not affect dependent variable. In F (n1, n2), n1 is the molecular degree of freedom, and n2 is the denominator degree of freedom. Usually, they have no practical significance, and only the p-value needs to be checked for analysis. The p-value is the value corresponding to the T-test. When p < .01, it can be considered that the model is significant at α = 0.01 level, or with a confidence level of 99%. VIF is the variance inflation factor used to determine collinearity problems. When the value of VIF is greater than 5, it indicates the existence of collinearity problems. D-W is the value corresponding to the Durbin Watson test and is a test method for autocorrelation. If the D-W value is around 2 (between 1.7 and 2.3), it indicates that there is no autocorrelation and that the model is well constructed. R2 is a coefficient of determination and also a model fitting indicator, used to reflect how much proportion of the fluctuation of the dependent variable can be described by the fluctuation of the independent variable. Adjusted R2 is the adjusted coefficient of determination and also the model fitting index. Adjusted R2 is more accurate than R2 when there are many independent variables.
Results of linear regression analysis (n = 36).
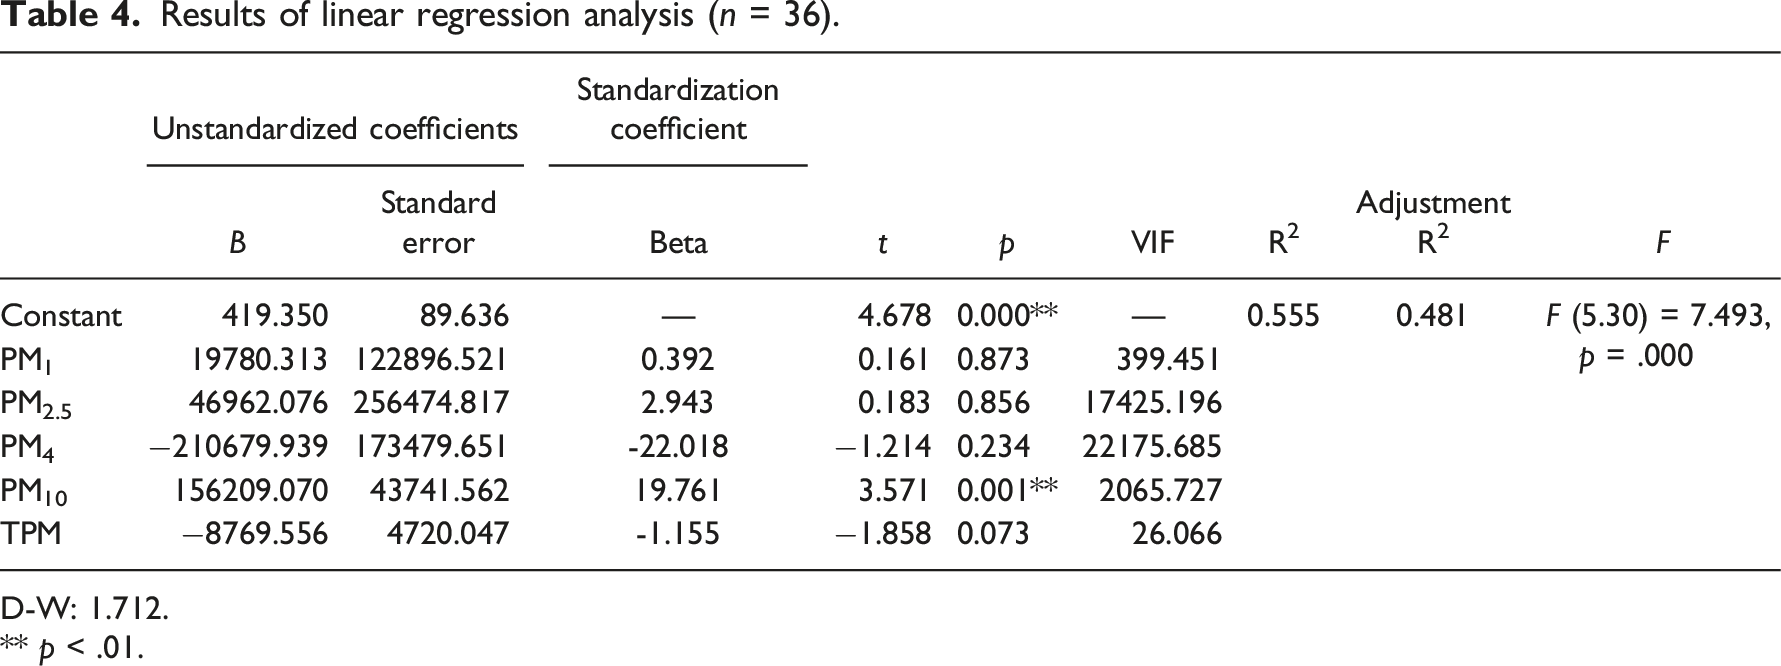
D-W: 1.712.
** p < .01.
As shown in Table 4, the model passed the F test (F = 7.493, p = .000<0.05), meaning that at least one PM1, PM2.5, PM4, PM10, and TPM would affect the indoor bioaerosol concentration. And the model equation is indoor biological aerosol concentration = 419.350 + 19780.313 × PM1 + 46962.076 × PM2.5 − 210679.939 × PM4 + 156209.070 × PM10 − 8769.556 × TPM. And the R2 value of the model is 0.555, meaning that PM1, PM2.5, PM4, PM10, and TPM could explain 55.5% of the change in indoor bioaerosol concentration. In addition, PM10 will have a very significant positive impact on the indoor bioaerosol concentration, but PM1, PM2.5, PM4, and TPM will not have an impact on the indoor bioaerosol concentration. Therefore, the closely related independent variables should be checked, and the closely related independent variables should be removed before re-analysis.
Results of linear regression analysis (n = 36).
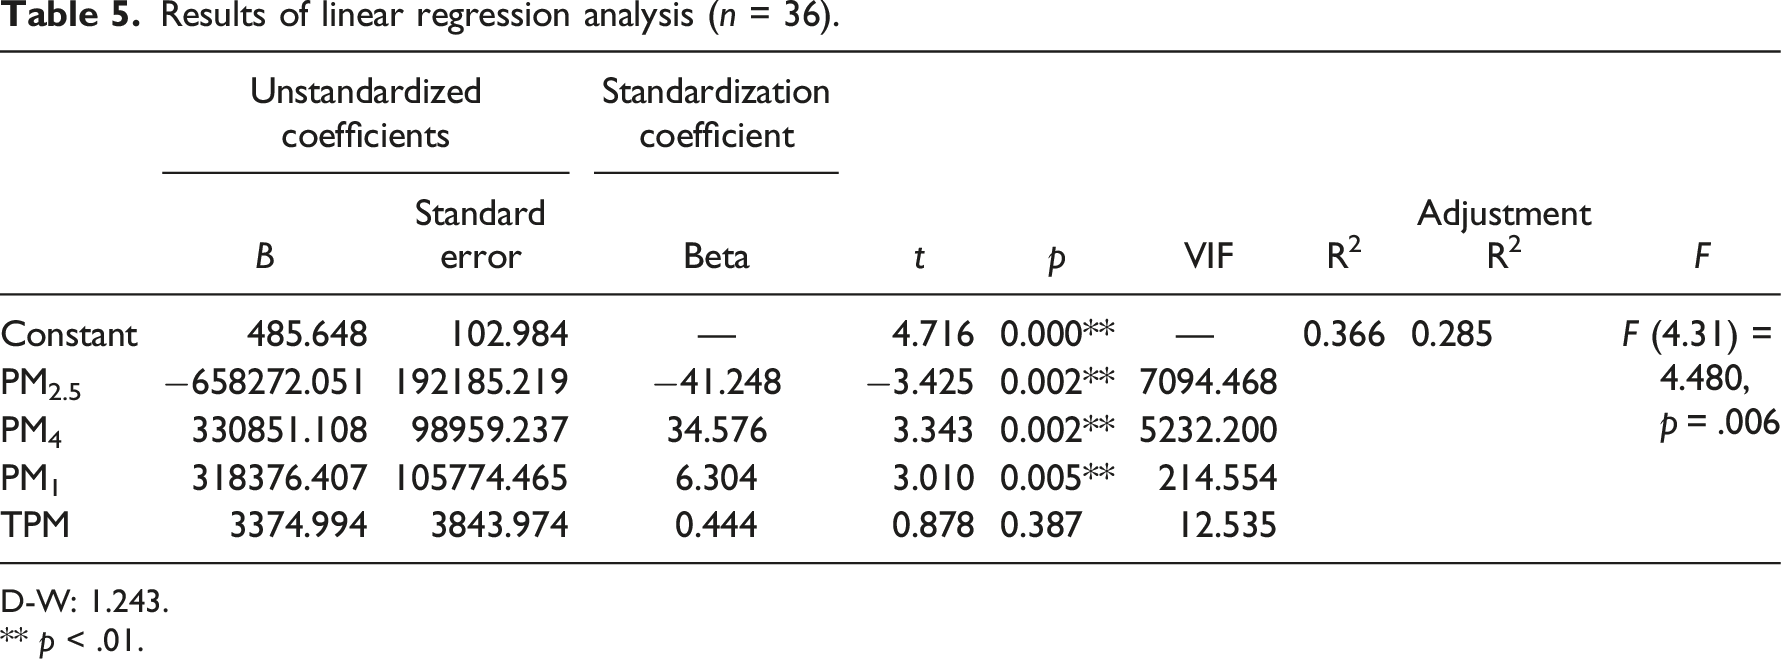
D-W: 1.243.
** p < .01.
Poisson regression analysis
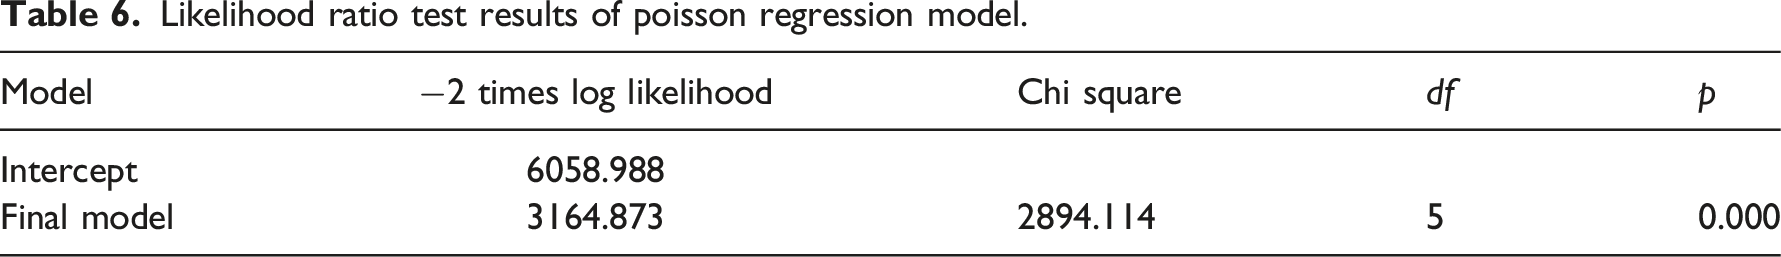
PM1, PM2.5, PM4, PM10, and TPM were taken as independent variables and indoor bioaerosol concentration was taken as dependent variables for Poisson regression analysis. The results showed that all models except PM10 could pass the F-test, meaning that different particulate matter could be used to conduct Poisson regression analysis on indoor bioaerosol concentration separately. However, the R2 of Poisson regression analysis with PM1, PM2.5, PM4 and TPM as independent variables is 0.002, 0.003, 0.002, and 0.004, respectively, interpreted poorly. Therefore, the particles (PM1, PM2.5, PM4, PM10, and TPM) are all analysed as independent variables.
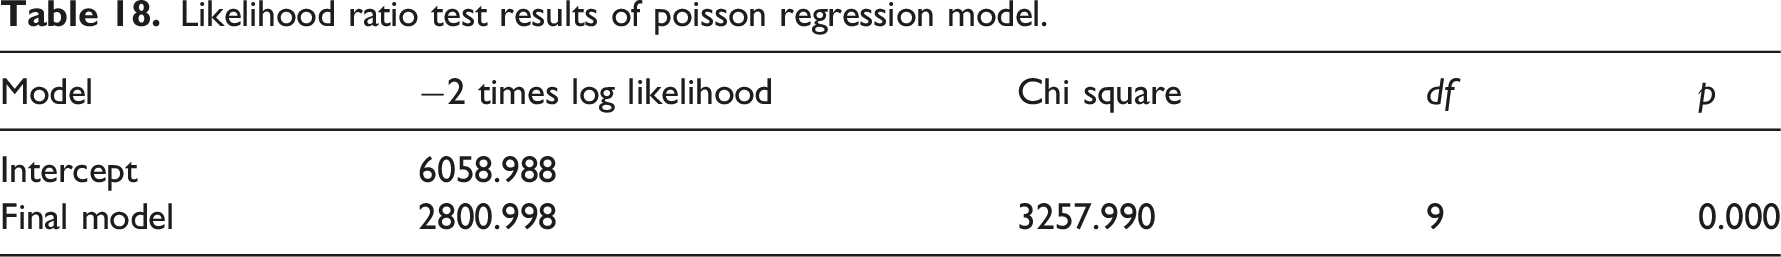
Likelihood ratio test results of poisson regression model.
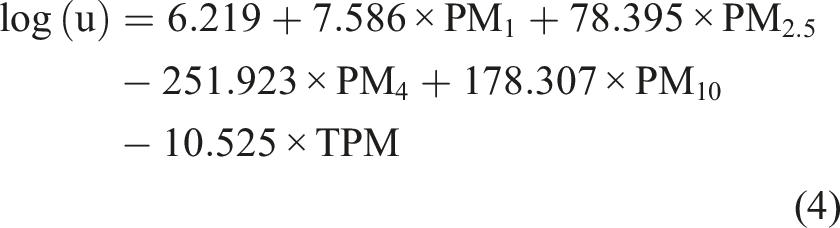
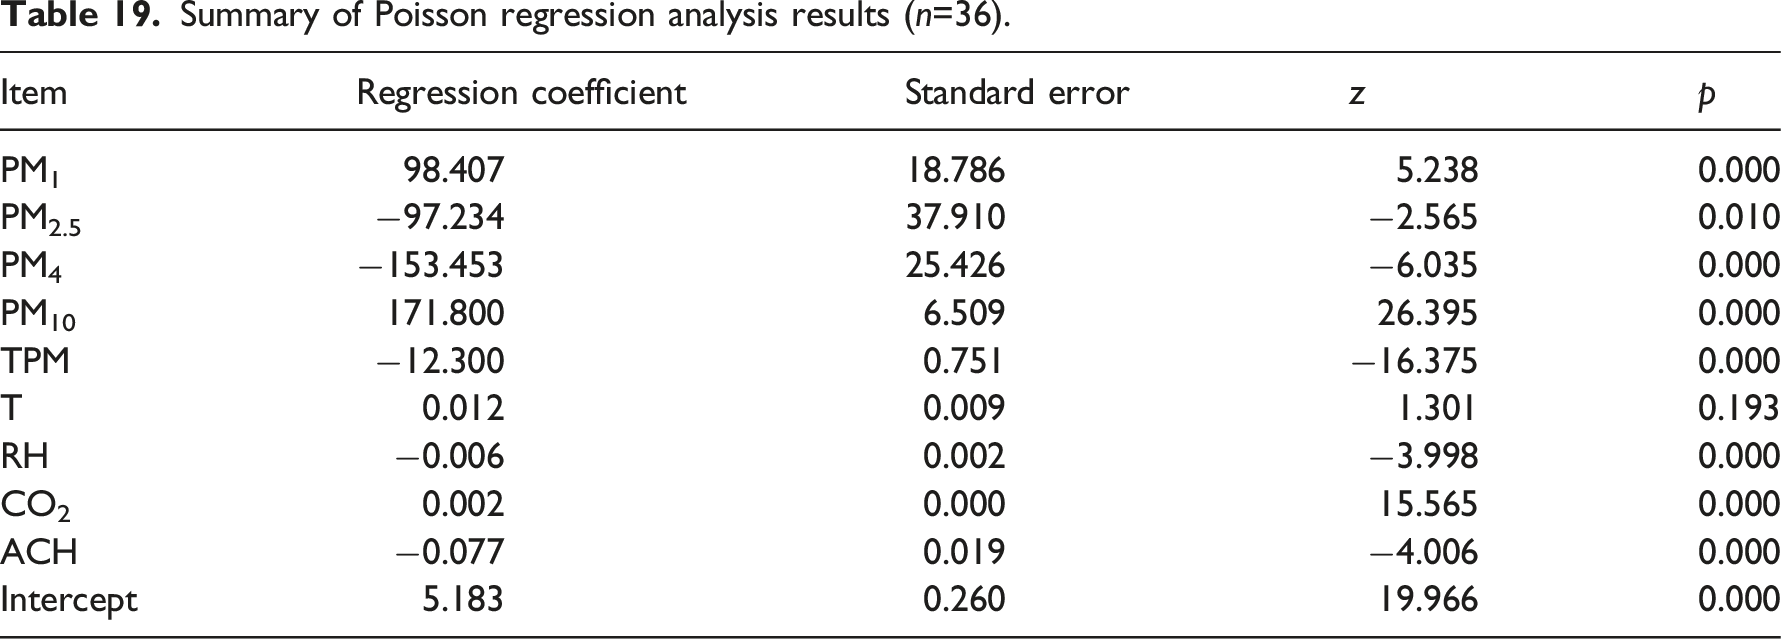
Summary of poisson regression analysis results (n = 36).
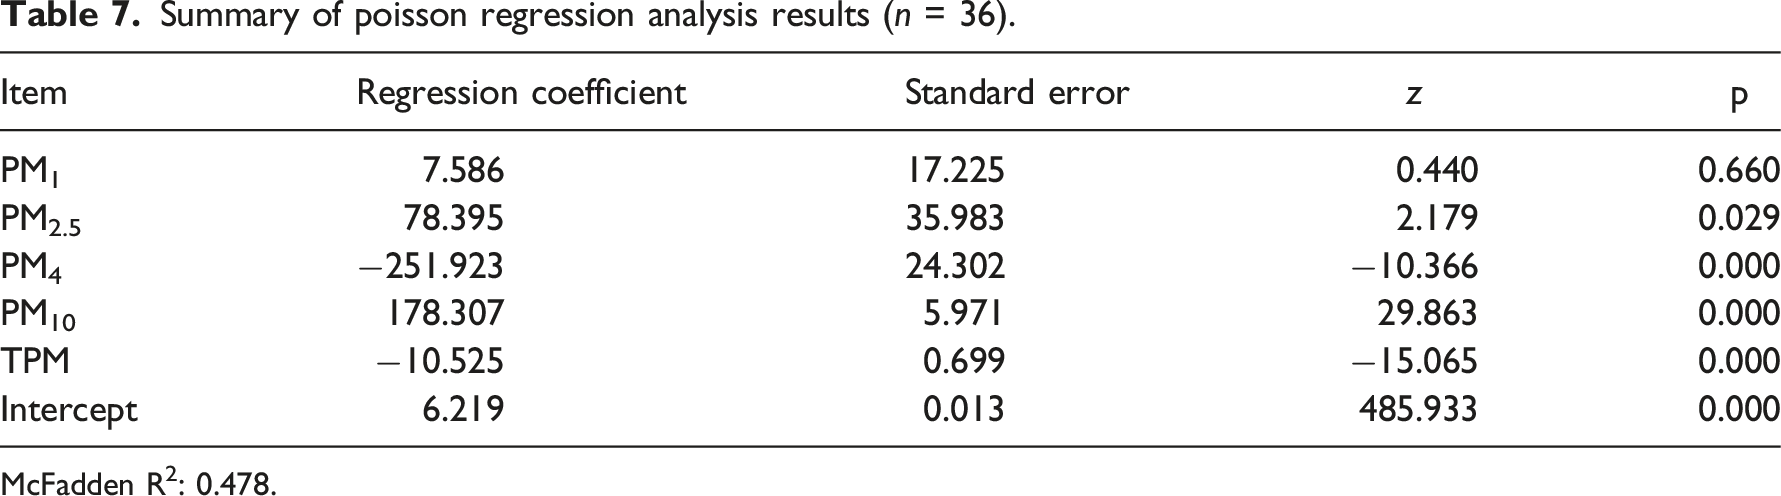
McFadden R2: 0.478.
PM2.5 and PM10 will have a significant positive impact on the indoor bioaerosol concentration, and PM4 and TPM will have a significant negative impact on the indoor bioaerosol concentration. However, PM1 does not affect the indoor bioaerosol concentration.
Bioaerosol and CO2 concentration, air exchange rate
Linear regression analysis
Results of linear regression analysis (n = 36).
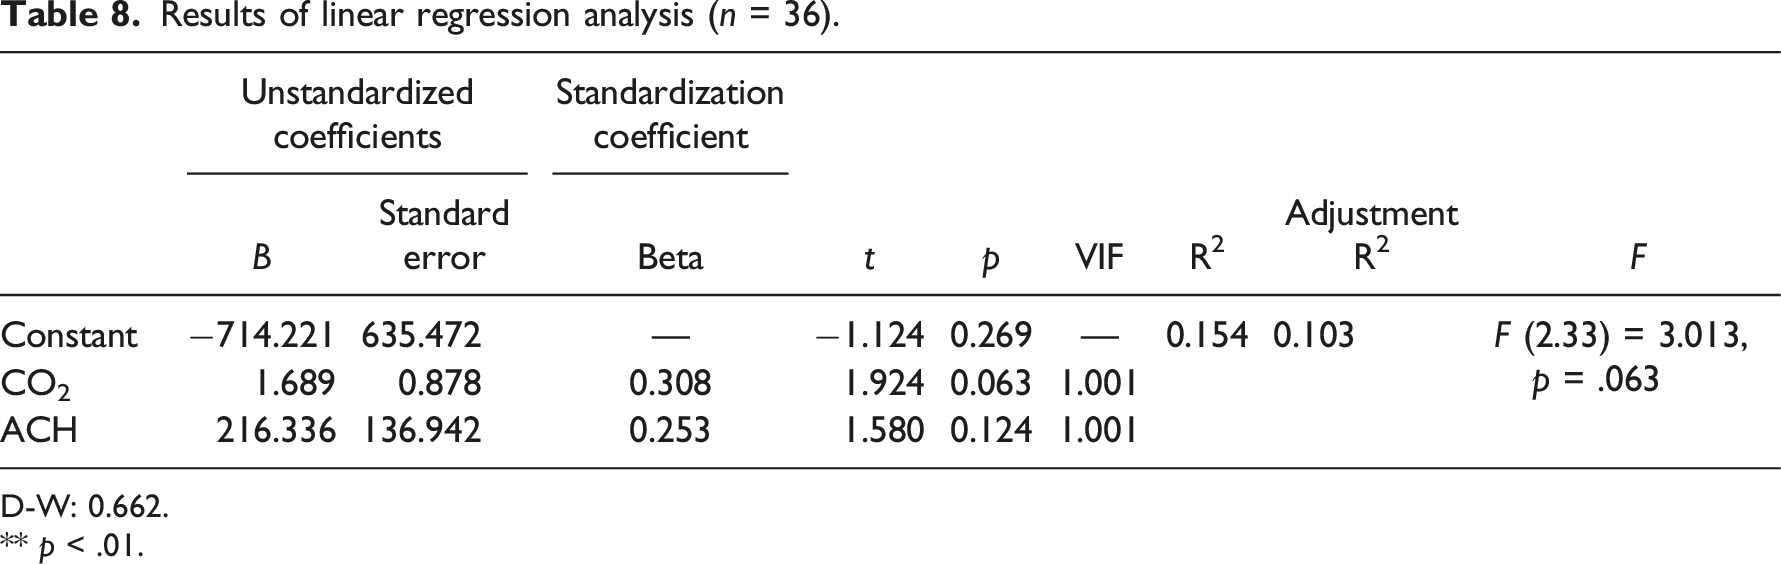
D-W: 0.662.
** p < .01.
Poisson regression analysis
Take CO2 concentration and ACH as independent variables and indoor bioaerosol concentration as dependent variables for Poisson regression analysis.
Likelihood ratio test results of Poisson regression model.
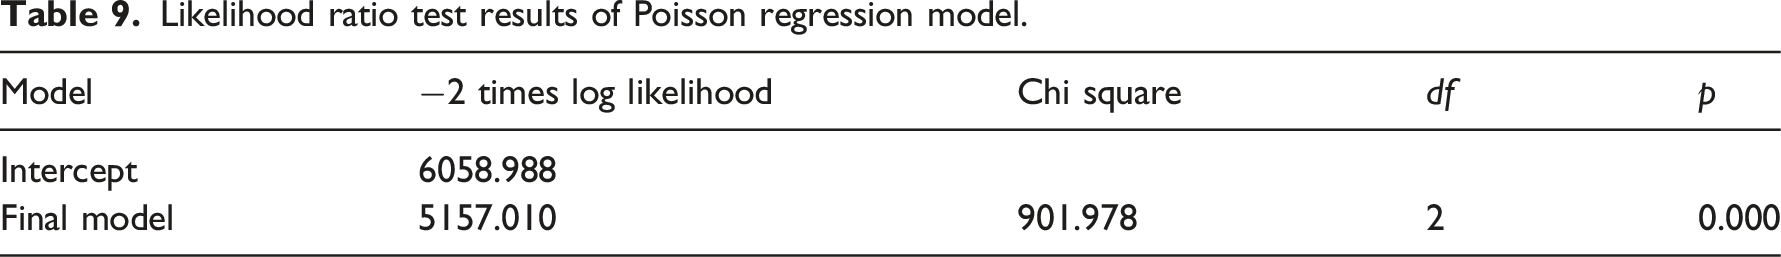
Summary of poisson regression analysis results (n = 36).

McFadden R2: 0.149.
Bioaerosol and temperature
Linear regression analysis
Results of linear regression analysis (n = 36).
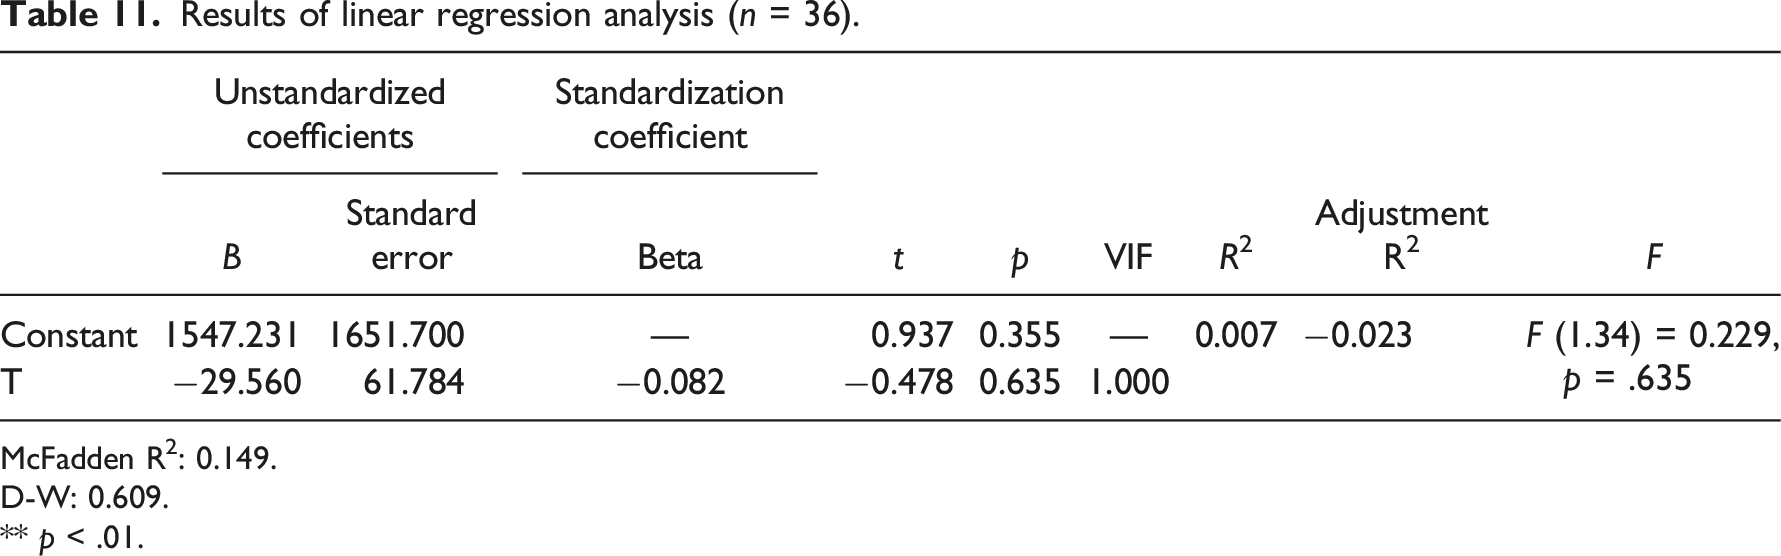
McFadden R2: 0.149.
D-W: 0.609.
** p < .01.
Poisson regression analysis
Poisson regression analysis was conducted with temperature as an independent variable and indoor bioaerosol concentration as a dependent variable.
Likelihood ratio test results of poisson regression model.
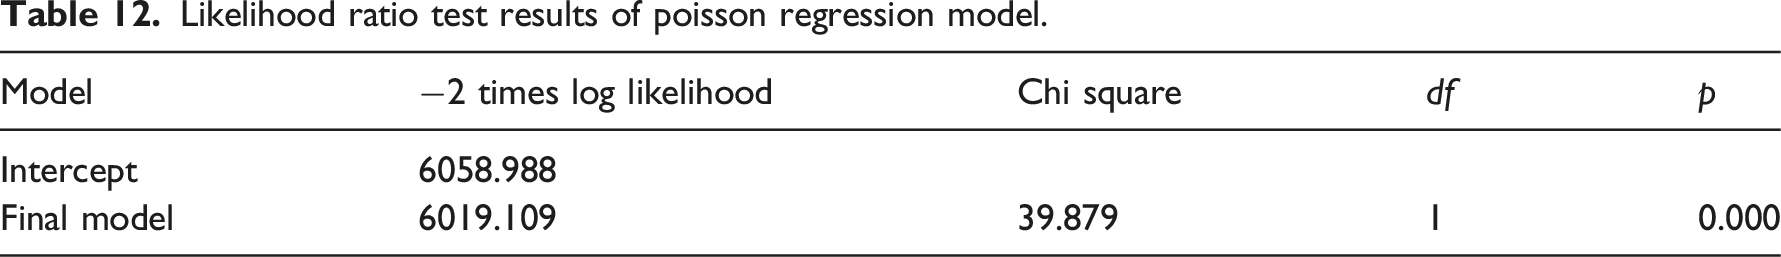

Summary of poisson regression analysis results (n = 36).
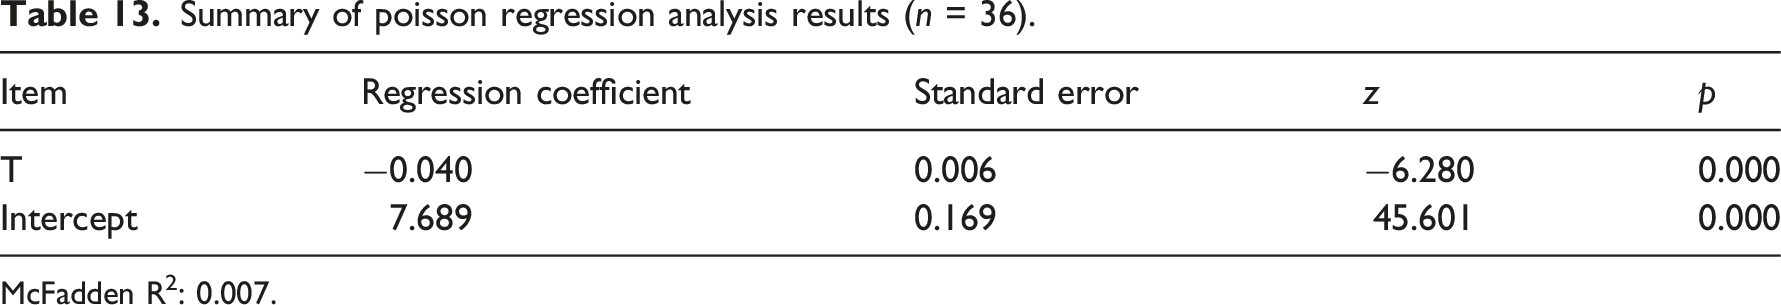
McFadden R2: 0.007.
And temperature will have a significant negative impact on the indoor bioaerosol concentration.
Bioaerosol and relative humidity
Linear regression analysis
Results of linear regression analysis (n = 36).
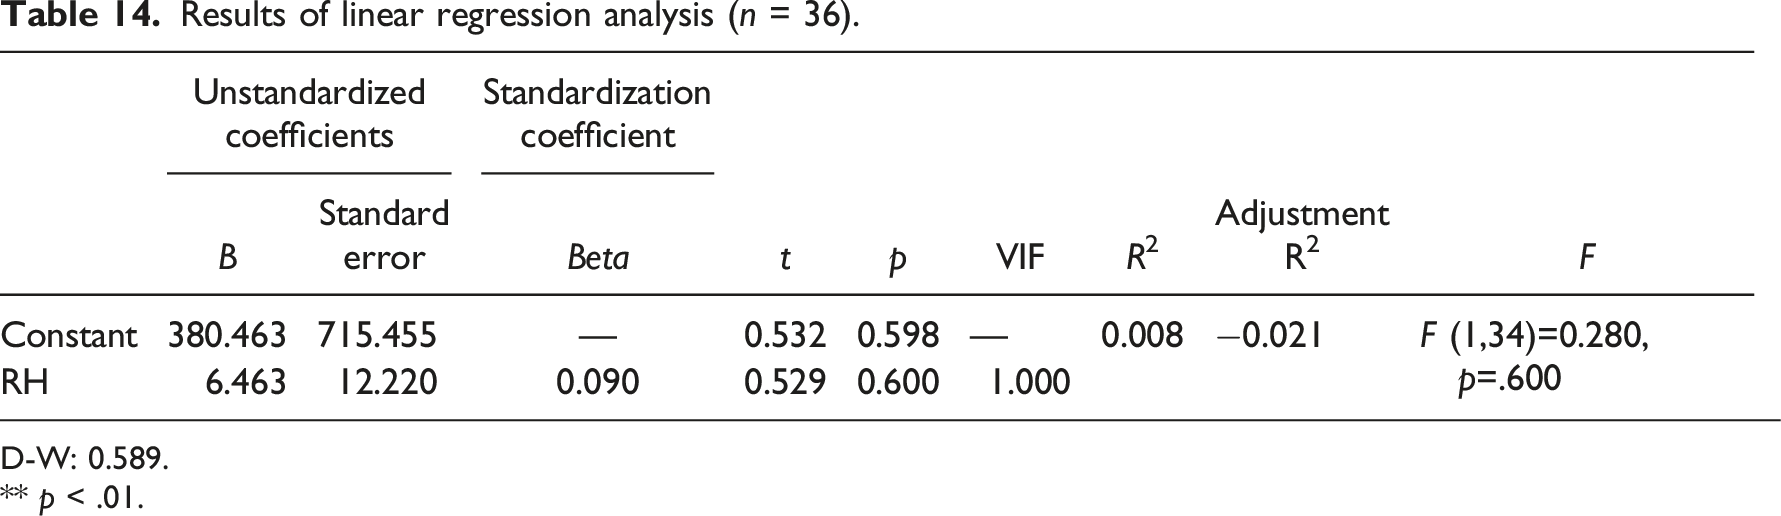
D-W: 0.589.
** p < .01.
Poisson regression analysis
The Poisson regression analysis was conducted to analyse the humidity as an independent variable and the indoor bioaerosol concentration as a dependent variable.
Likelihood ratio test results of poisson regression model.
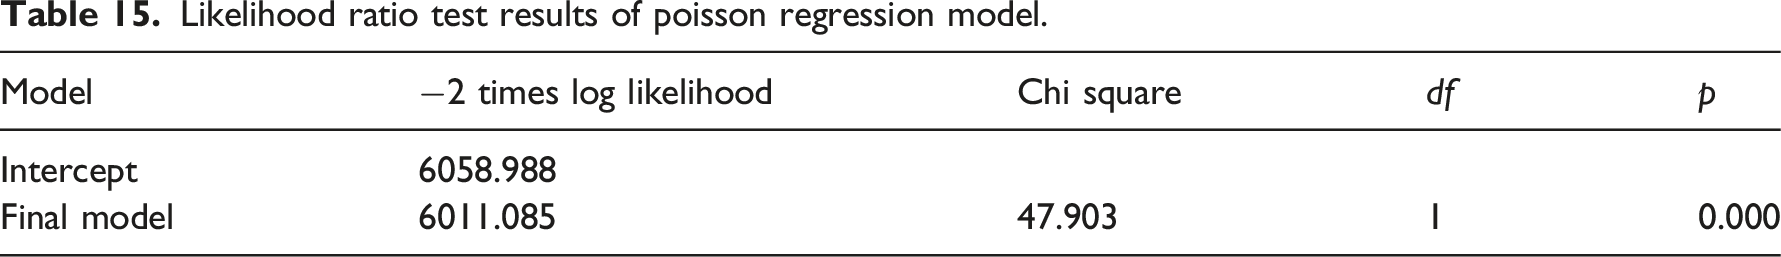

Summary of Poisson regression analysis results (n=36).
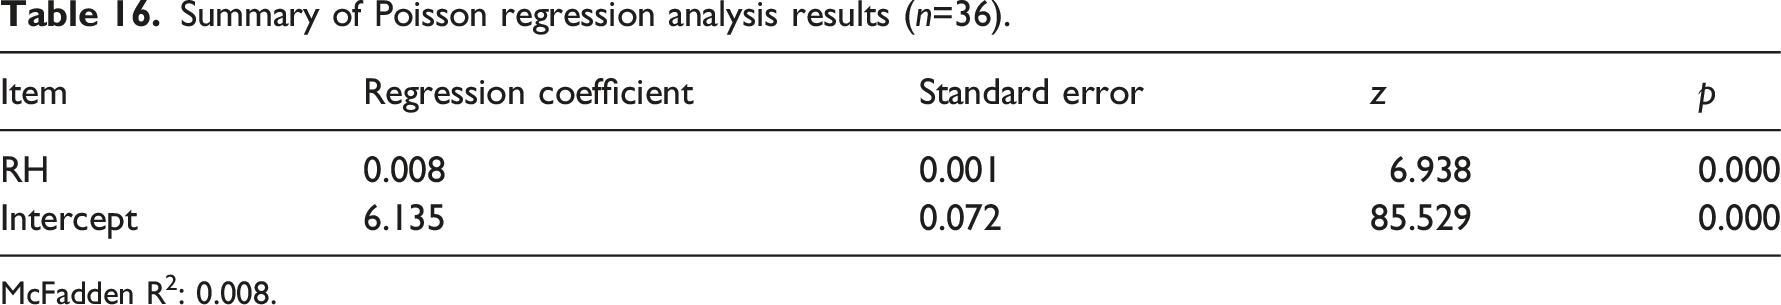
McFadden R2: 0.008.
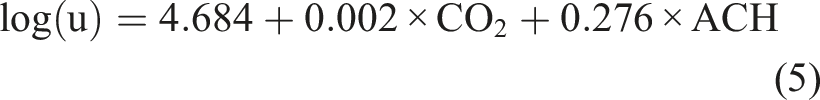
The final specific analysis shows that the regression coefficient value of RH is 0.008, and presents a significant level of 0.01 (z = 6.938, p = .000<0.01), which means that RH will have a significant positive impact on the indoor bioaerosol concentration.
Bioaerosol and all environmental parameters
Linear regression analysis
The linear regression analysis was carried out by taking particles with different particle sizes (PM1, PM2.5, PM4, PM10, and total particles), CO2 concentration, air exchange rate, temperature, and humidity as independent variables, and indoor bioaerosol concentration as dependent variables.
Results of linear regression analysis (n = 36).
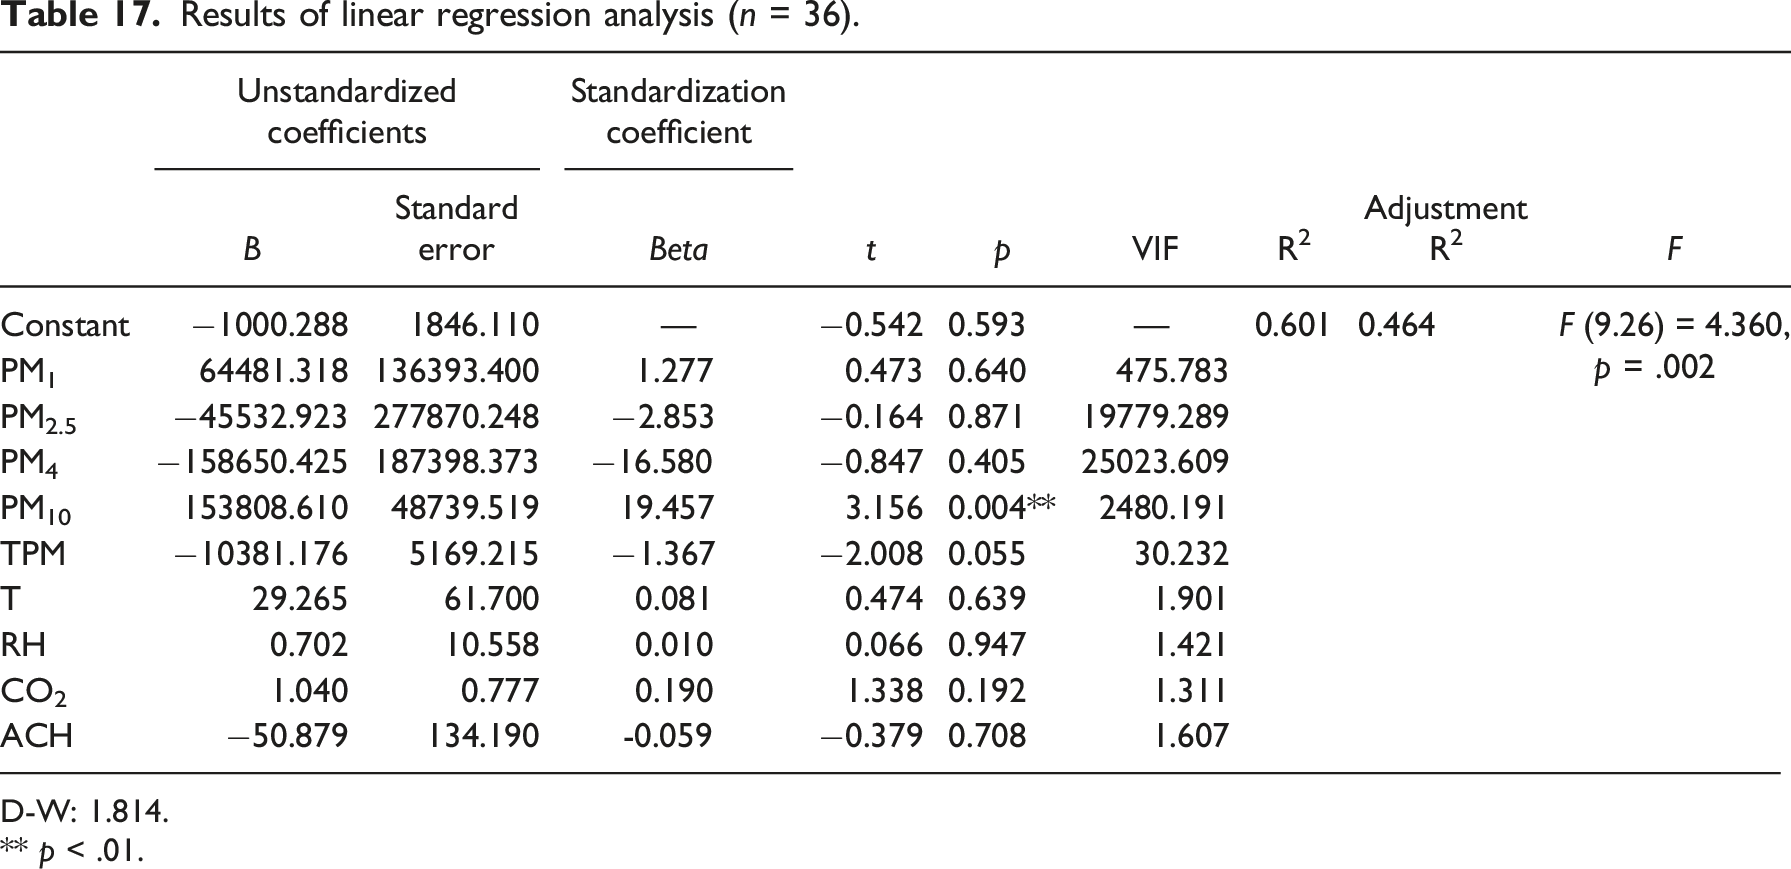
D-W: 1.814.
** p < .01.
Indoor bioaerosol concentration= −1000.288 + 64481.318 × PM1 − 45532.923 × PM2.5 − 158650.425 × PM4 + 153808.610 × PM10 − 10381.176 × TM + 29.265 × T + 0.702 × RH + 1.040 × CO2 − 50.879 × ACH.
And the model R2 value is 0.601, which means that these independent variables could explain 60.1% of the change in indoor bioaerosol concentration. And PM10 will have a significant positive impact on indoor bioaerosol concentration. However, PM1, PM2.5, PM4, TPM, T, RH, CO2, and ACH would not affect the bioaerosol concentration.
Therefore, linear regression may not be able to effectively use particles with different particle sizes, CO2 concentration, ACH, T, and RH to explain indoor bioaerosol concentration.
Poisson regression analysis
The Poisson regression analysis was carried out by taking different particle sizes (PM1, PM2.5, PM4, PM10, and TPM), CO2 concentration, ACH, T and RH as independent variables, and indoor bioaerosol concentration as dependent variables.
Likelihood ratio test results of poisson regression model.
Summary of Poisson regression analysis results (n=36).
PM1, PM10, and CO2 will have a significant positive impact on indoor bioaerosol concentration, and PM2.5, PM4, TPM, RH, and ACH will have a significant negative impact on indoor bioaerosol concentration. However, temperature does not affect the indoor bioaerosol concentration.
Analysis and establishment of prediction model for bioaerosol concentration
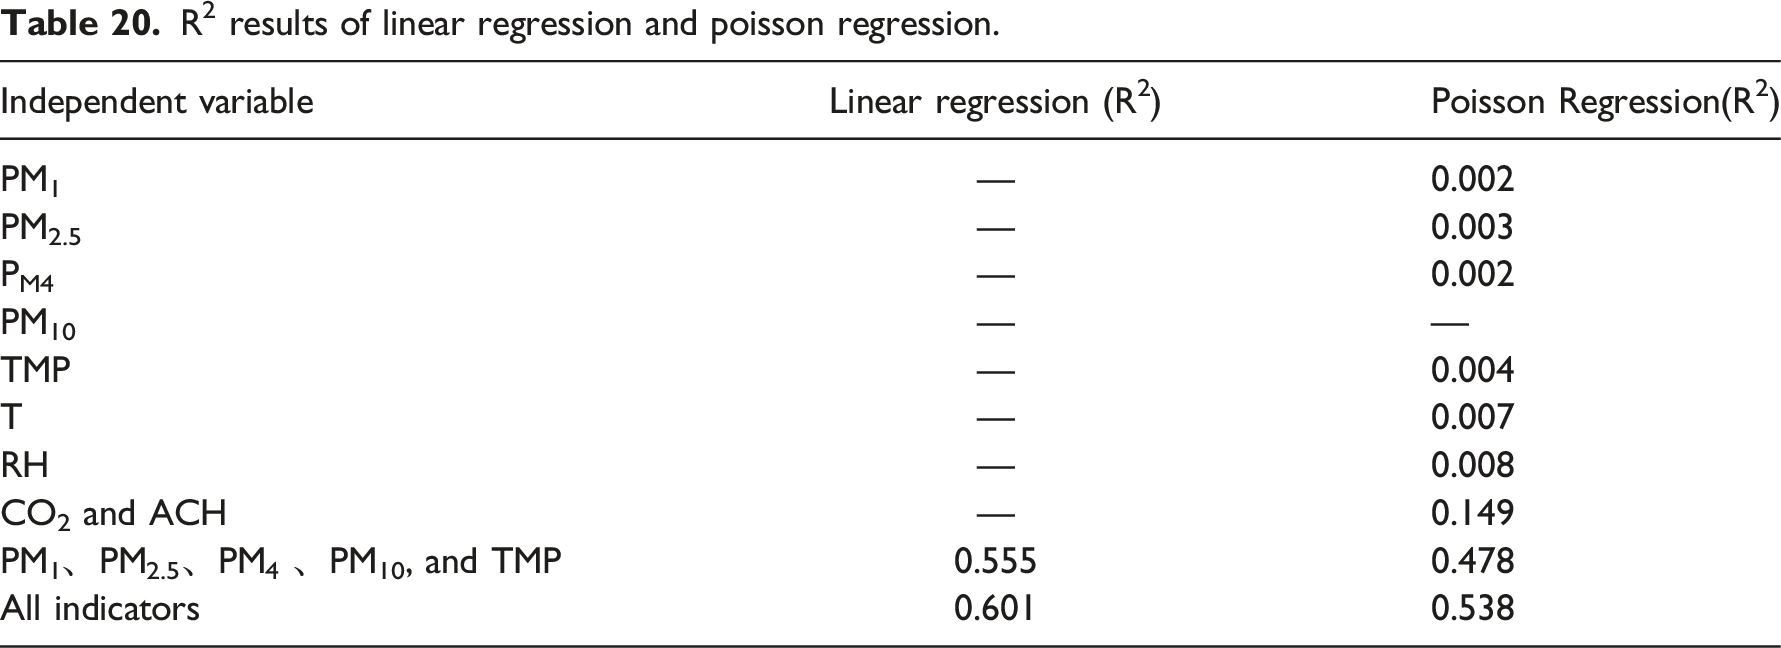
The R2 results of linear regression and Poisson regression between bioaerosols and independent variables are shown in Table 20, and the following results are obtained: 1. A single indicator may not be able to use linear regression to explain the bioaerosol concentration. Although most single indicators could use Poisson regression to explain the bioaerosol concentration, compared with multiple indicators, the effect of a single indicator to explain the bioaerosol concentration is not significant. 2. The correlation between particulate matter (especially PM10) and bioaerosol concentration is the best, consistent with the Aileen’s research.
62
3. The more indicators describing the concentration of bioaerosols, the higher the model’s explanatory power. 4. Poisson regression could basically explain the concentration of biological aerosols. When T and RH are regarded as single independent variables in relation to the concentration of biological aerosols, Poisson regression and linear regression have the same degree of interpretation, and linear regression cannot perform single-factor analysis on each particle separately. 5. In multifactor analysis, multiple linear regression has a slightly higher interpretation of indoor bioaerosol concentration than Poisson regression, consistent with Tseng's research.
49
However, only PM10 will have a very significant positive impact on indoor bioaerosol concentration in multiple linear regression. At the same time, PM1, PM2.5, PM4, and TPM indicators do not play their due role, and Poisson regression effectively uses all indicators. Hence Poisson regression is more suitable than linear regression to explain indoor bioaerosol concentration. R2 results of linear regression and poisson regression.
Summary of poisson regression analysis results (n = 36).
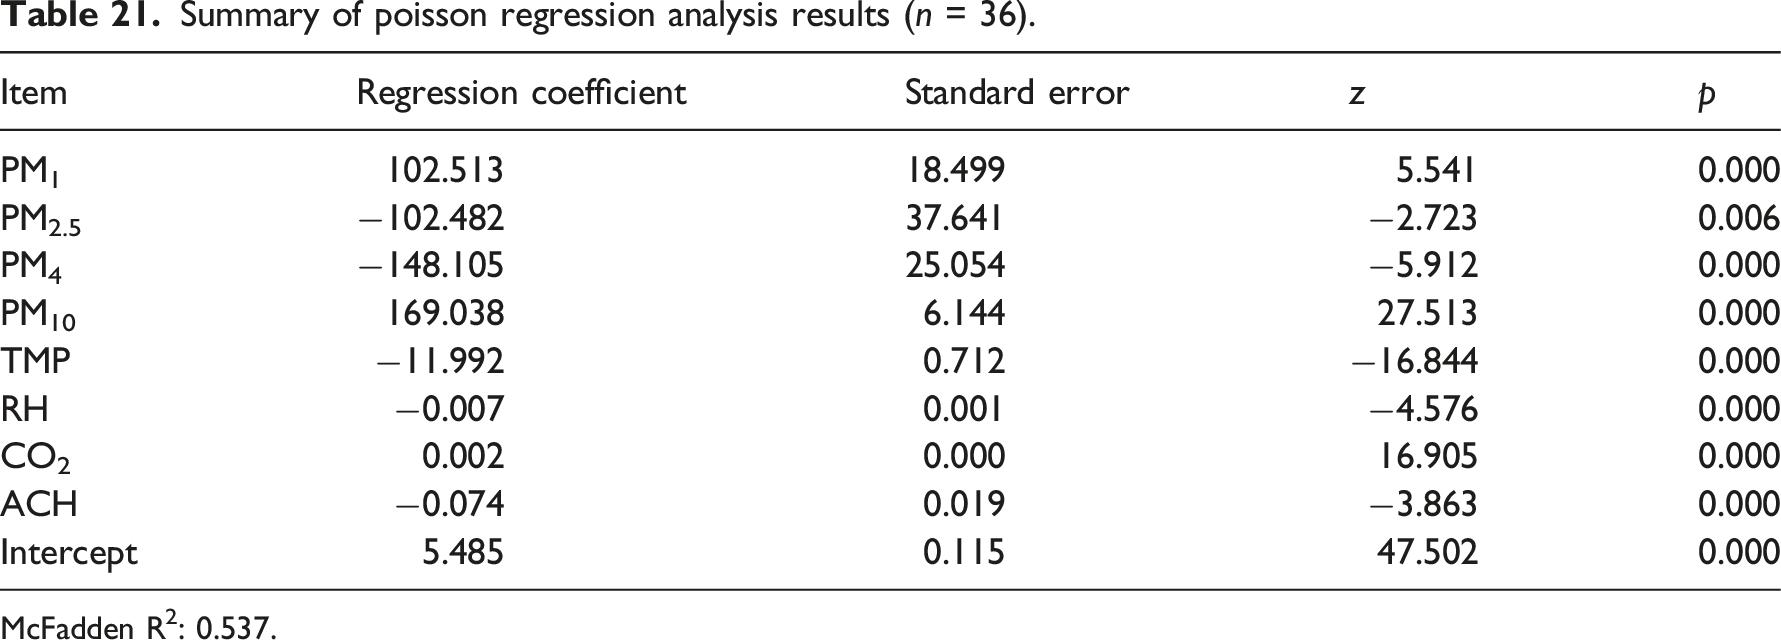
McFadden R2: 0.537.
As shown in Table 21, PM1, PM10, and CO2 will have a significant positive impact on indoor bioaerosol concentration, and PM2.5, PM4, TPM, RH, and ACH will have a significant negative effect on indoor bioaerosol concentration. And the model McFadden R2 is 0.537, meaning PM1, PM2.5, PM4, PM10, TPM, RH, CO2, and ACH can explain 53.7% of the change of biological aerosol concentration, so the fitting effect is significant.
According to the regression coefficient, the indoor bioaerosol concentration is linked to the particle diameter. The regression coefficient of particles is significantly greater than that of other parameters, and the regression coefficient is gradually increasing with the increase of particle radius. This shows that particles may have a greater impact on indoor bioaerosol than other indicators, and with the increase of particle radius, the impact on the concentration of bioaerosol gradually increases, of which PM10 has the largest impact on indoor bioaerosol concentration. The possible reason is that the particle size of PM10 is larger than PM2.5 and PM1, and it has a larger surface area and mass, so bacteria are more likely to attach to PM10. 13
However, the influence of oversize particles on bioaerosol concentration may be reduced. When the particle concentration is greater than 10 μm, the effect on indoor bacterial concentration decreases with the increase in particle size 63 Therefore, PM10 may be the indicator that has the greatest impact on indoor bioaerosol concentration and may be used as an indirect indicator of indoor bioaerosol concentration.
The fitting equation of the final indoor bioaerosol concentration is equation (9).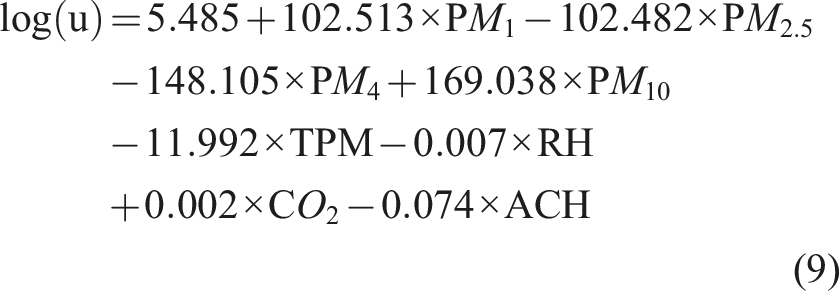
The original data is substituted into the validation and corrected according to equation (3). The corrected indoor bioaerosol concentration prediction equation of the office building is equation (10).
As shown in Figure 6, compared with the original data, the average error rate of the modified analogue data is −0.02% and the absolute error is 181 CFU/m³, and the median is similar. Therefore, the revised simulation prediction data is accurate and reliable. However, the absolute error of the seventh and ninth groups of data (measured at 9:00 and 11:00 in the 2nd F conference room) is −567.59 CFU/m³ and −518.57 CFU/m³. The reason may be that on the day of measurement, workers entered the air conditioning for maintenance at 9:00 and 11:00 respectively. Although researchers promptly stopped it, it still brought in external microorganisms, particulate matter, etc., damaging the original indoor environment. Similarly, the measurement error of the 31st group of data (measured at 9:00 am in the 1st F restroom) is 676.25 CFU/m³. The office building's working time is 9:00, and the time for people to go to the bathroom is relatively concentrated. The measurement results show (see Table 2) that the particle concentration in the 1st F toilet is significantly higher than that in the 2nd F toilet (the researchers ensure that no one goes to the bathroom on the day of measurement except the researchers), which may lead to higher predicted values of bioaerosol concentration. The most likely cause of these three groups of abnormal data is the influence of human factors.
22
Therefore, this reflects the influence of human behaviour on indoor bioaerosol concentration from the side, and human behaviour can be included in the prediction model, which may further improve the accuracy and effectiveness of the prediction model. Error diagram of corrected analog data and original data.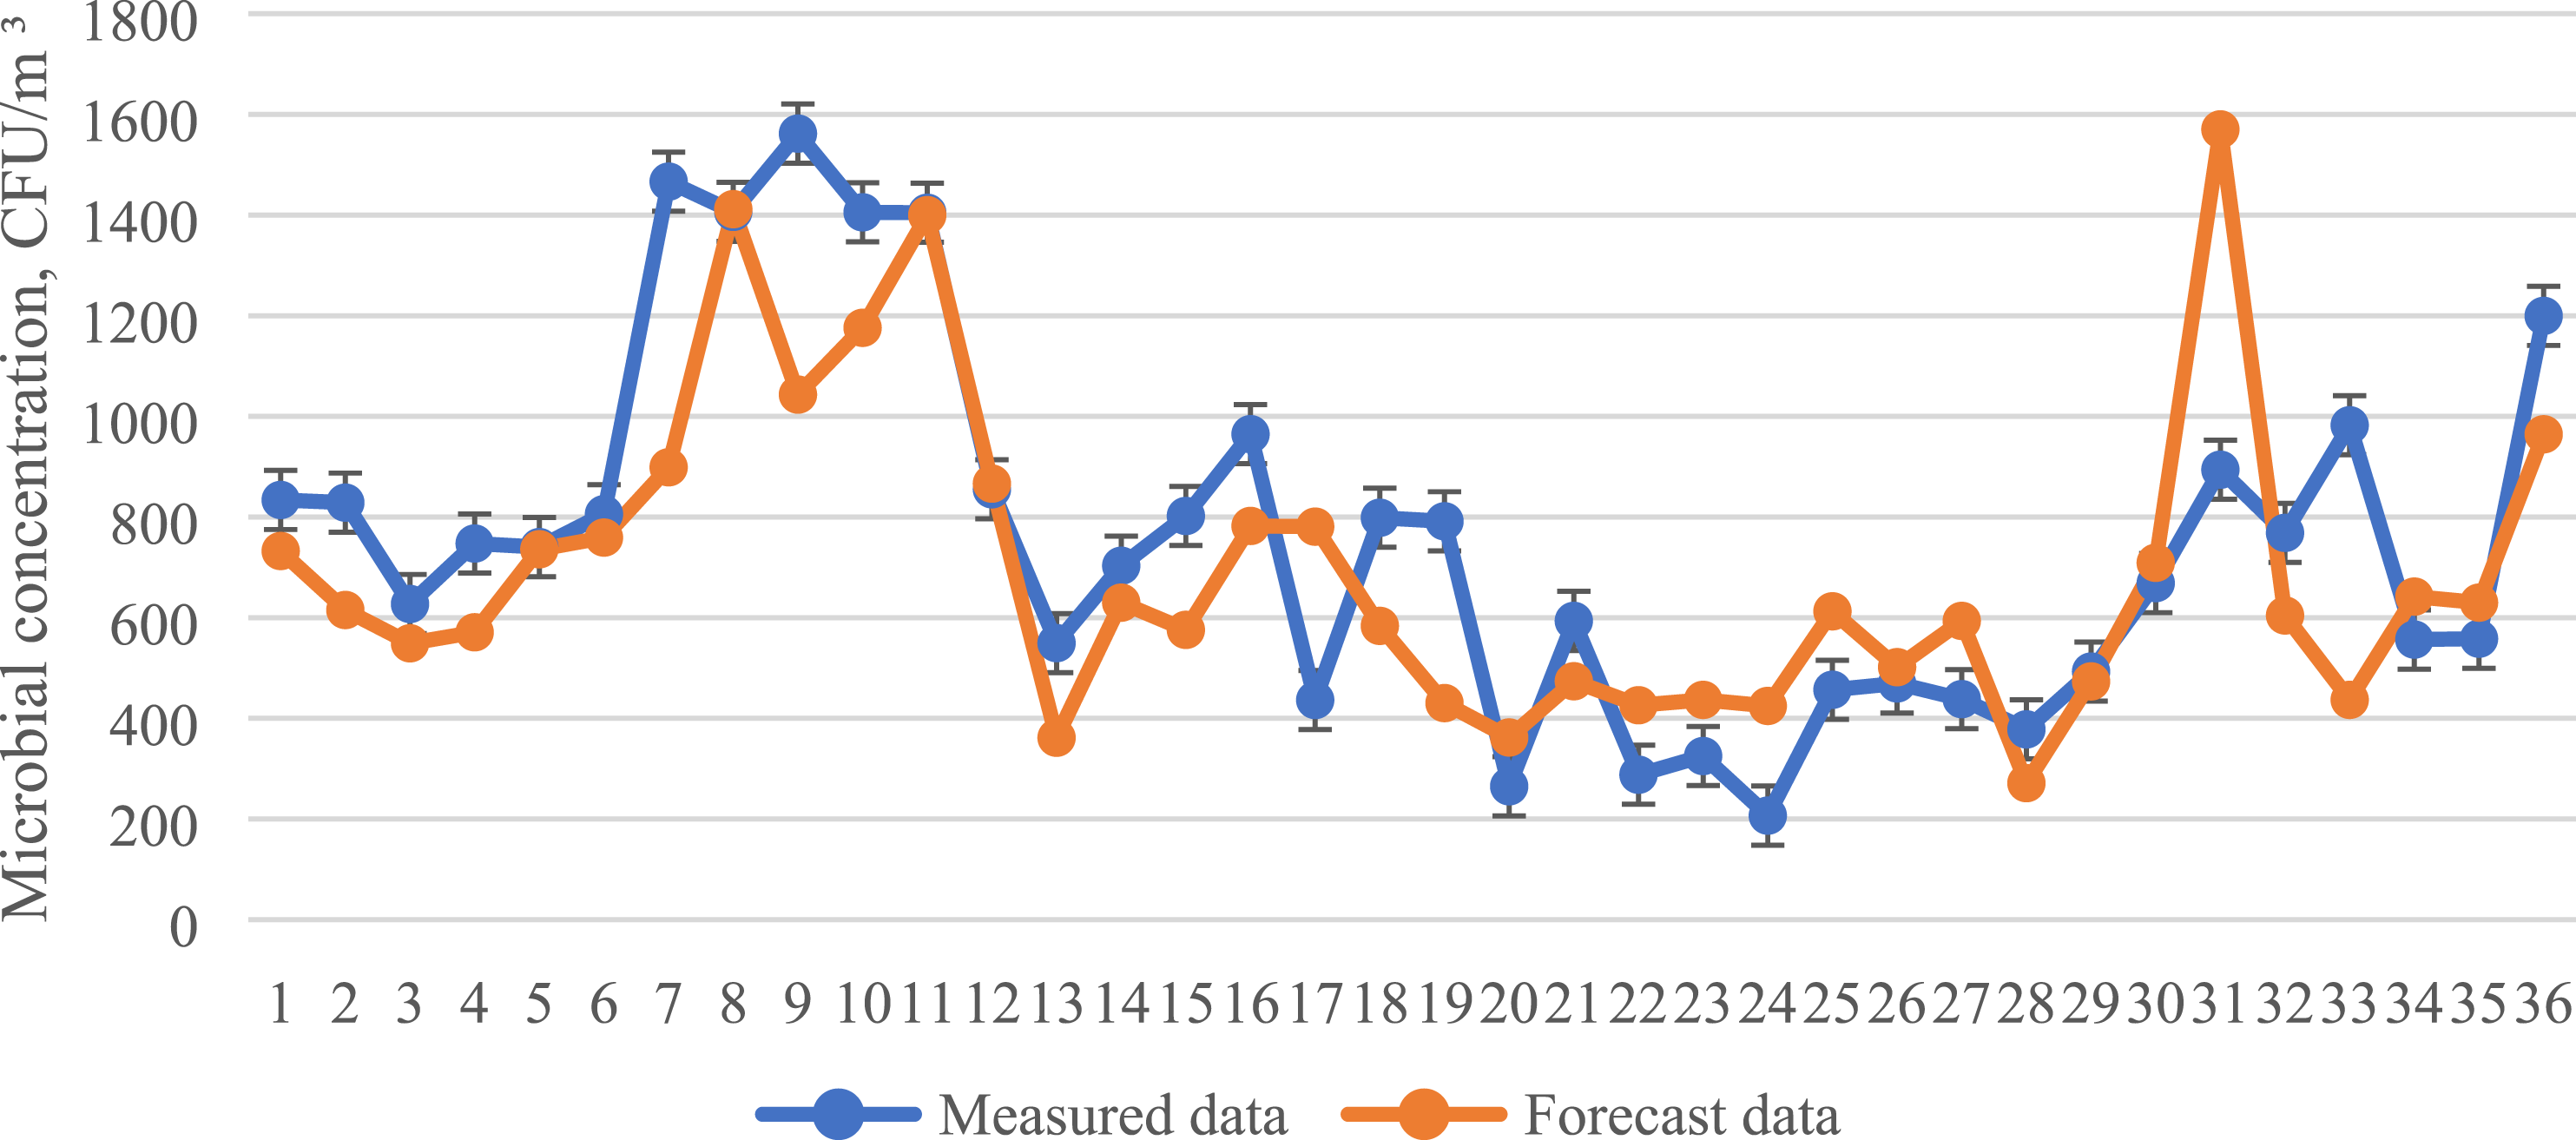
Conclusions
In this study, the indoor air quality of six typical spaces in an office building in Shenzhen, China, was measured. The influential factors of indoor bioaerosol concentration were studied using linear regression analysis and Poisson regression analysis methods. The results show that the Poisson regression has better prediction of the bioaerosol concentration. PM1, PM10, and CO2 will have a significant positive impact on the indoor bioaerosol concentration, i.e., mean bioaerosol concentration increases with increasing PM1, PM10, and CO2. Conversely, PM2.5, PM4, TPM, RH, and ACH are associated with reduced indoor bioaerosol concentrations. In addition, PM10 may be the most influential indicator of indoor bioaerosol concentration. A simple, fast, and low-cost online monitoring method for indoor microorganisms was developed and a prediction model for indoor bioaerosol concentration in an office building in Shenzhen was established.
Whilst results are promising, it is prudent to outline the limitations of the work. Firstly, the model only applies indoor factors as input parameters. The relatively few input features indeed simplify model training and enhance repeatability, however, other characteristics that may affect indoor bioaerosol concentration, such as outdoor environment, seasonal and meteorological conditions,64,65 human occupancy levels22,66,67 or behaviour activities,22,68,69 are not taken into account as model inputs. These characteristics thus should be included in the model to further improve the prediction accuracy. Then, since the sampling points in this study are all located in the office buildings in Shenzhen, the empirical equation in this study is only applicable to the office buildings in Shenzhen but can be used as the research basis and basic model of prediction models for other similar climate regions and indoor spaces. It is likely that model training based on specific field monitoring data may be necessary. Thirdly, although the cost of environmental sensors is affordable, there are still inherent uncertainties through the measurement and calibration of these instruments, which may reduce the predictive accuracy of the model. 70 Finally, the study used only indoor bioaerosol concentrations, rather than specific viruses. As a result, further research is needed to understand the classification and composition of indoor air microorganisms, to determine whether there are pathogenic fungi species in the research site, which will allow a more detailed assessment of the exposure risk of staff in different office buildings.
Accepting the potential limitations to the study, this study does establish a relationship between the indoor measurable parameters of the office building and bioaerosol concentration and demonstrates that the concentrations of indoor bioaerosols can be determined and predicted based on observed parameters (including particulate matter, CO2 concentration, ACH, T, and RH) using the real-time environmental monitoring sensors in a real office building. Because the prevention of epidemic spread in the indoor environment is key, there is an urgent need for a simple, fast, low-cost, and efficient technology that can accurately monitor the concentration of bioaerosols in the air, so that bioaerosol monitoring and forecasting systems can be widely used in the indoor environment. This prediction will enable remedial measures to be evaluated and implemented (such as increasing fresh air supply) to maintain indoor air quality and timely predict the risk of indoor epidemic transmission.
Footnotes
Acknowledgements
Thanks to Shenzhen Lemniscare Medical Technology Co., Ltd., China, for their support in instrument and equipment, and thanks to the Research Institute of Tsinghua University in Shenzhen, Shenzhen Lihe Technology Co., Ltd. for their support in the microbiology laboratory and measurement site. The authors are grateful to Mr. Yezhao Cai of Tsinghua Innovation Centre in Zhuhai for his English proof reading.
Declaration of conflicting interests
The author(s) declared no potential conflicts of interest with respect to the research, authorship, and/or publication of this article.
Funding
The author(s) disclosed receipt of the following financial support for the research, authorship, and/or publication of this article: This research is financially supported by Practical Research on Low Carbon and Healthy Building System in Fujian and Guangdong for China Construction Fangcheng Investment& Development Group Co., Ltd. (CSCECFC-2022-KJZX--06), Research on Intelligent Systems of Healthy Residential Buildings for Smart Building Research Centre of China Real Estate Association, Industrial Transfer, Environmental Regulation and Industrial Ecological Development: A Case Study of Anhui Province.(SK2020A0572). Key Research Project of Humanities and Social Sciences in Universities in Anhui Province: Research on Green Finance Development from the Perspective of Regional Economic Development and Carbon Tax Mechanism Constraints--Taking Anhui Province as an Example (SK2020A0570) and Research and Verification of Epidemic Prevention System of Residential Buildings (Shenzhen science and technology plan project in engineering construction field in 2021).