
Abstract
Indoor lighting system is one of the significant contributors of building’s energy consumption. This study aims to improve indoor lighting system efficiency by developing an adaptive lighting control system that integrates the spatial dimensions of DF and real-time outdoor illuminance sensing based on soft sensors in two educational rooms in Yogyakarta, Indonesia. The research developed the system using in situ measurements, developed predictive and control algorithms, integrated them into a building energy management system, and validated its performance. The soft sensor algorithm demonstrated good predictive performance with MAE and RMSE distributions of
Practical application
The proposed DF-based soft sensor system offers a practical and scalable solution for adaptive indoor lighting control with a cost-effective yet accurate, reliable, and applicable approach. The system was developed using a calibrated outdoor illuminance sensor, an embedded microcontroller, and integration with a Building Energy Management System (BEMS), and thus allows real-time prediction of indoor illuminance without the need for costly hardware sensor networks. This approach reduces installation complexity and operational costs and is applicable to both existing and new buildings, is flexible, and is scalable for other types of buildings, occupant and activity patterns, and climates and regions.
Keywords
Introduction
The International Energy Agency (IEA) report shows that greenhouse gas (GHG) emissions from the energy sector reached a record high of 37.4 GtCO2e in 2023.1,2 The building sector, in particular, contributes around 37% of global energy-related GHG emissions, where approximately 27% of this number comes from building operations, such as cooling, heating, and lighting systems. 3 Building energy consumption itself has been increasing significantly in recent decades, in line with population growth, the intensification of indoor activities, and rising demands on Indoor Environmental Quality (IEQ). Modern buildings serve functions beyond shelter but also as work, study, and activity spaces, increasing the demand of various supporting systems such as lighting, air conditioning, and electronic equipment. 4 Among these systems, lighting remains a major contributor to energy consumption, accounting for approximately 15–20% of a building’s total energy use.5–7 Optimizing the lighting system thus plays a crucial role in improving building energy efficiency and reducing overall energy consumption.
Efficiency in lighting systems has been an important focus in sustainable buildings. In the context of Indonesia, green building certification has adopted lighting system efficiency as a key indicator. The Indonesian Ministry of Public Works (PUPR) has launched an official green building rating system (BGH) through the Ministerial Regulation No. 21: 2021, where daylighting becomes a key parameter in its assessment. 8 The Green Building Council Indonesia (GBCI) also includes this parameter in the Greenship rating system. 9
Daylighting strategies typically involve dividing lighting systems into groups. Areas closest to the space fenestration are typically controlled based on readings from a light intensity sensor (luxmeter) installed at a representative point in the area. However, the remaining two-thirds of the area is thus illuminated via artificial lighting, regardless of any fluctuations in natural light that may reach those areas. Mangkuto 10 demonstrated that daylight distribution in Indonesia may cover areas larger than one-third of a room, thus single-sensor approach may pose a reliability issue. Since spatially uniform control strategies do not account for local variations in daylight availability across the space, such strategies may pose inefficiency towards lighting operation. To further improve energy efficiency, adaptive lighting control systems were developed by integrating occupancy information and natural light contributions. These systems have been shown to reduce energy consumption by 61–91% in open office spaces.11,12
The recent application of Artificial Intelligence (AI) and Internet of Things (IoT) further advances the potential for energy-efficient lighting systems. Seyedolhosseini 13 proposed an Artificial Neural Network (ANN)-based lighting control system that actively adjusts the dimming level of each luminaire based on the variation of daylight supply at different task planes. This system quickly and efficiently responds to changes in natural lighting and saves up to 37% energy with a relatively lower illuminance deviation (<10%) while reducing the number of sensors required per zone. Machine learning and IoT-based approaches expanded this system by adding real-time connectivity and adaptive decision-making capabilities to balance energy consumption and visual comfort.14–16 While those systems have significantly improved the temporal efficiency and intelligence of control systems, they lack consideration of the spatial dimension. Current advancements predominantly address temporal adaptation. However, spatial representation remains insufficiently resolved, as these systems are capable of adapting to changes over time (day–night cycle) and to weather conditions, yet they do not account for variations in illuminance between zones due to fenestration position, room geometry, and surface reflectance.
Spatial representation of daylighting profiles requires detailed measurements at multiple points within a room, thus requiring a higher number of sensors. 17 Such an approach brings in complexity, as more sensors mean more calibrations and potential disruptions to occupant activities. Thus, researchers come up with ideas to simplify the system without sacrificing spatial accuracy. Feyzi and Mojallali 18 proposed a sensor position optimization method using Battle Royale Optimization (BRO) algorithm to balance energy efficiency and visual comfort, while Jo and Jang 19 developed a linear regression-based illuminance model that connects two reference sensors to other points within the room. While both approaches improve the efficiency of daylight measurement and reduce the number of sensors, they still rely on specific sensor locations and cannot depict the spatial distribution of daylight in real time. These approaches remain dependent on predefined sensor locations and are unable to comprehensively reconstruct real-time spatial daylight distribution.
On the other hand, Van De Meugheuvel et al. 20 and Peruffo et al. 21 proposed the concept of decentralizing lighting control functions by placing illuminance and occupancy sensors at each luminaire, thus allowing each unit to adjust luminance flux locally. However, this system can only represent a small portion of the area under the luminaire and does not account for spatial variations in daylight across different zones. As a result, the system is unable to assess the differences in illuminance between areas around windows, the center, and the back of the room. Lee et al. 22 utilized the Relative Illuminance Influence Level (RIIL) metric to demonstrate significant potential in connecting the illuminance contribution of each luminaire to the actual room conditions. Although effective for localized control, these approaches lack a comprehensive mapping of the spatial distribution of daylight and fail to capture the overall spatial variability of daylight within a space.
Gentile et al. 17 proposed a combination of finite measurements and numerical simulation to obtain a larger daylight introduction while reducing sensor load. Although this approach simplifies installation complexity, it fails to capture real-time daylight fluctuations due to assumptions on static daylight distribution and instantaneous measurements. Acosta et al. 23 proposed a metric called Continuous Overcast Daylight Autonomy (Dao.con) that predicted the spatial representation of daylight using simulated overcast sky and historical meteorological data. This metric does improve daylight predictions, but still has poor daylight predictions due to fluctuations from the weather, environmental reflections, or user interventions.
The literature described above demonstrates that previous research has not successfully combined the spatial and temporal dimensions of daylight in a single, responsive, real-time adaptive control system. They remain limited in representing the real-time spatial variability of daylight under dynamic environmental conditions, since they rely either on limited sensor configurations or on predictive models based on simplified assumptions. Existing systems only provide average estimates or predictive projections, but fail to represent actual daylight distribution in a space at any given time.
This study addresses the current limitations by integrating a Daylight Factor (DF)-based soft sensor with real-time outdoor illuminance measurements to capture both spatial and temporal variations of daylight. This study integrates soft sensors into an adaptive lighting control system to better combine the spatial and temporal dimensions of daylight. The use of soft sensors based on mathematical models allows for real-time prediction of indoor environmental conditions at a lower cost and with higher reliability. 24 The soft sensing approach has been widely used in the building context to reconstruct the distribution of indoor environmental parameters, such as airflow, based on a combination of outdoor sensor data and predictive models. 25 The principles lie in the comparable phenomena of indoor airflow and daylight distribution that are simultaneously shaped by the building’s external boundary conditions and the spatial characteristics of the indoor spaces.
Indoor lighting conditions are significantly influenced by variations in outdoor illumination, which can be measured continuously using outdoor illuminance sensors. Based on this principle, this study proposes a Daylight Factor (DF)-based adaptive lighting control model combined with outdoor illuminance sensors as real-time input. This approach transforms static daylight distribution into a dynamic parameter capable of estimating daylight illuminance at each point in a space based on changes in actual outdoor illumination conditions. Thus, the daylight serves as a soft sensor model that utilizes outdoor illuminance data to represent the spatial distribution of daylight in a space in real time, enabling the system to construct a daylight distribution map without the need for additional sensors within the space.
As a control function, outputs from the soft sensor are integrated into a Building Energy Management System (BEMS) via an intelligent switch, forming an adaptive daylight-linked lighting control system. The predicted daylight distribution is used to automatically adjust artificial lighting settings according to the actual daylight conditions in the space. This approach enables a lighting control system that adapts to daylight dynamics throughout the day by using information about the spatial distribution of daylight, maximizing the energy-efficiency potential of a building’s lighting system without relying on numerous physical sensors. It also bridges the gap between spatial daylight modelling and real-time adaptive lighting control in practical building applications. While the proposed system is intended to support energy-efficient lighting operation, this study focuses on the development and validation of the control framework and does not directly quantify energy savings.
This study further develops and validates a prototype of an adaptive lighting control system based on daylight-linked control that integrates the spatial dimensions of DF and real-time outdoor illuminance sensing through soft sensors in a BEMS. The focus of this study includes the design of a DF-based soft sensor model, its integration into the lighting control system architecture, validation of its results, and the evaluation of the system’s performance in representing the distribution of natural lighting in a room as a basis for lighting control decision making.
Methodology
Research workflow
This study consists of three main stages, as shown in Figure 1: (1) field observations to obtain data regarding space characteristics and measurements of outdoor and indoor illuminance; (2) development of predictive and control algorithms; and (3) development of an integrated intelligent lighting system. The lighting system developed in this study comprises two main components: a soft-sensor-based natural lighting distribution monitoring system and an intelligent-switch-based adaptive lighting control system. Both systems are designed to operate in real time to support building energy efficiency by optimizing daylight utilization and are integrated into the Building Energy Management System (BEMS) platform as part of a data-driven energy management strategy. Research workflow.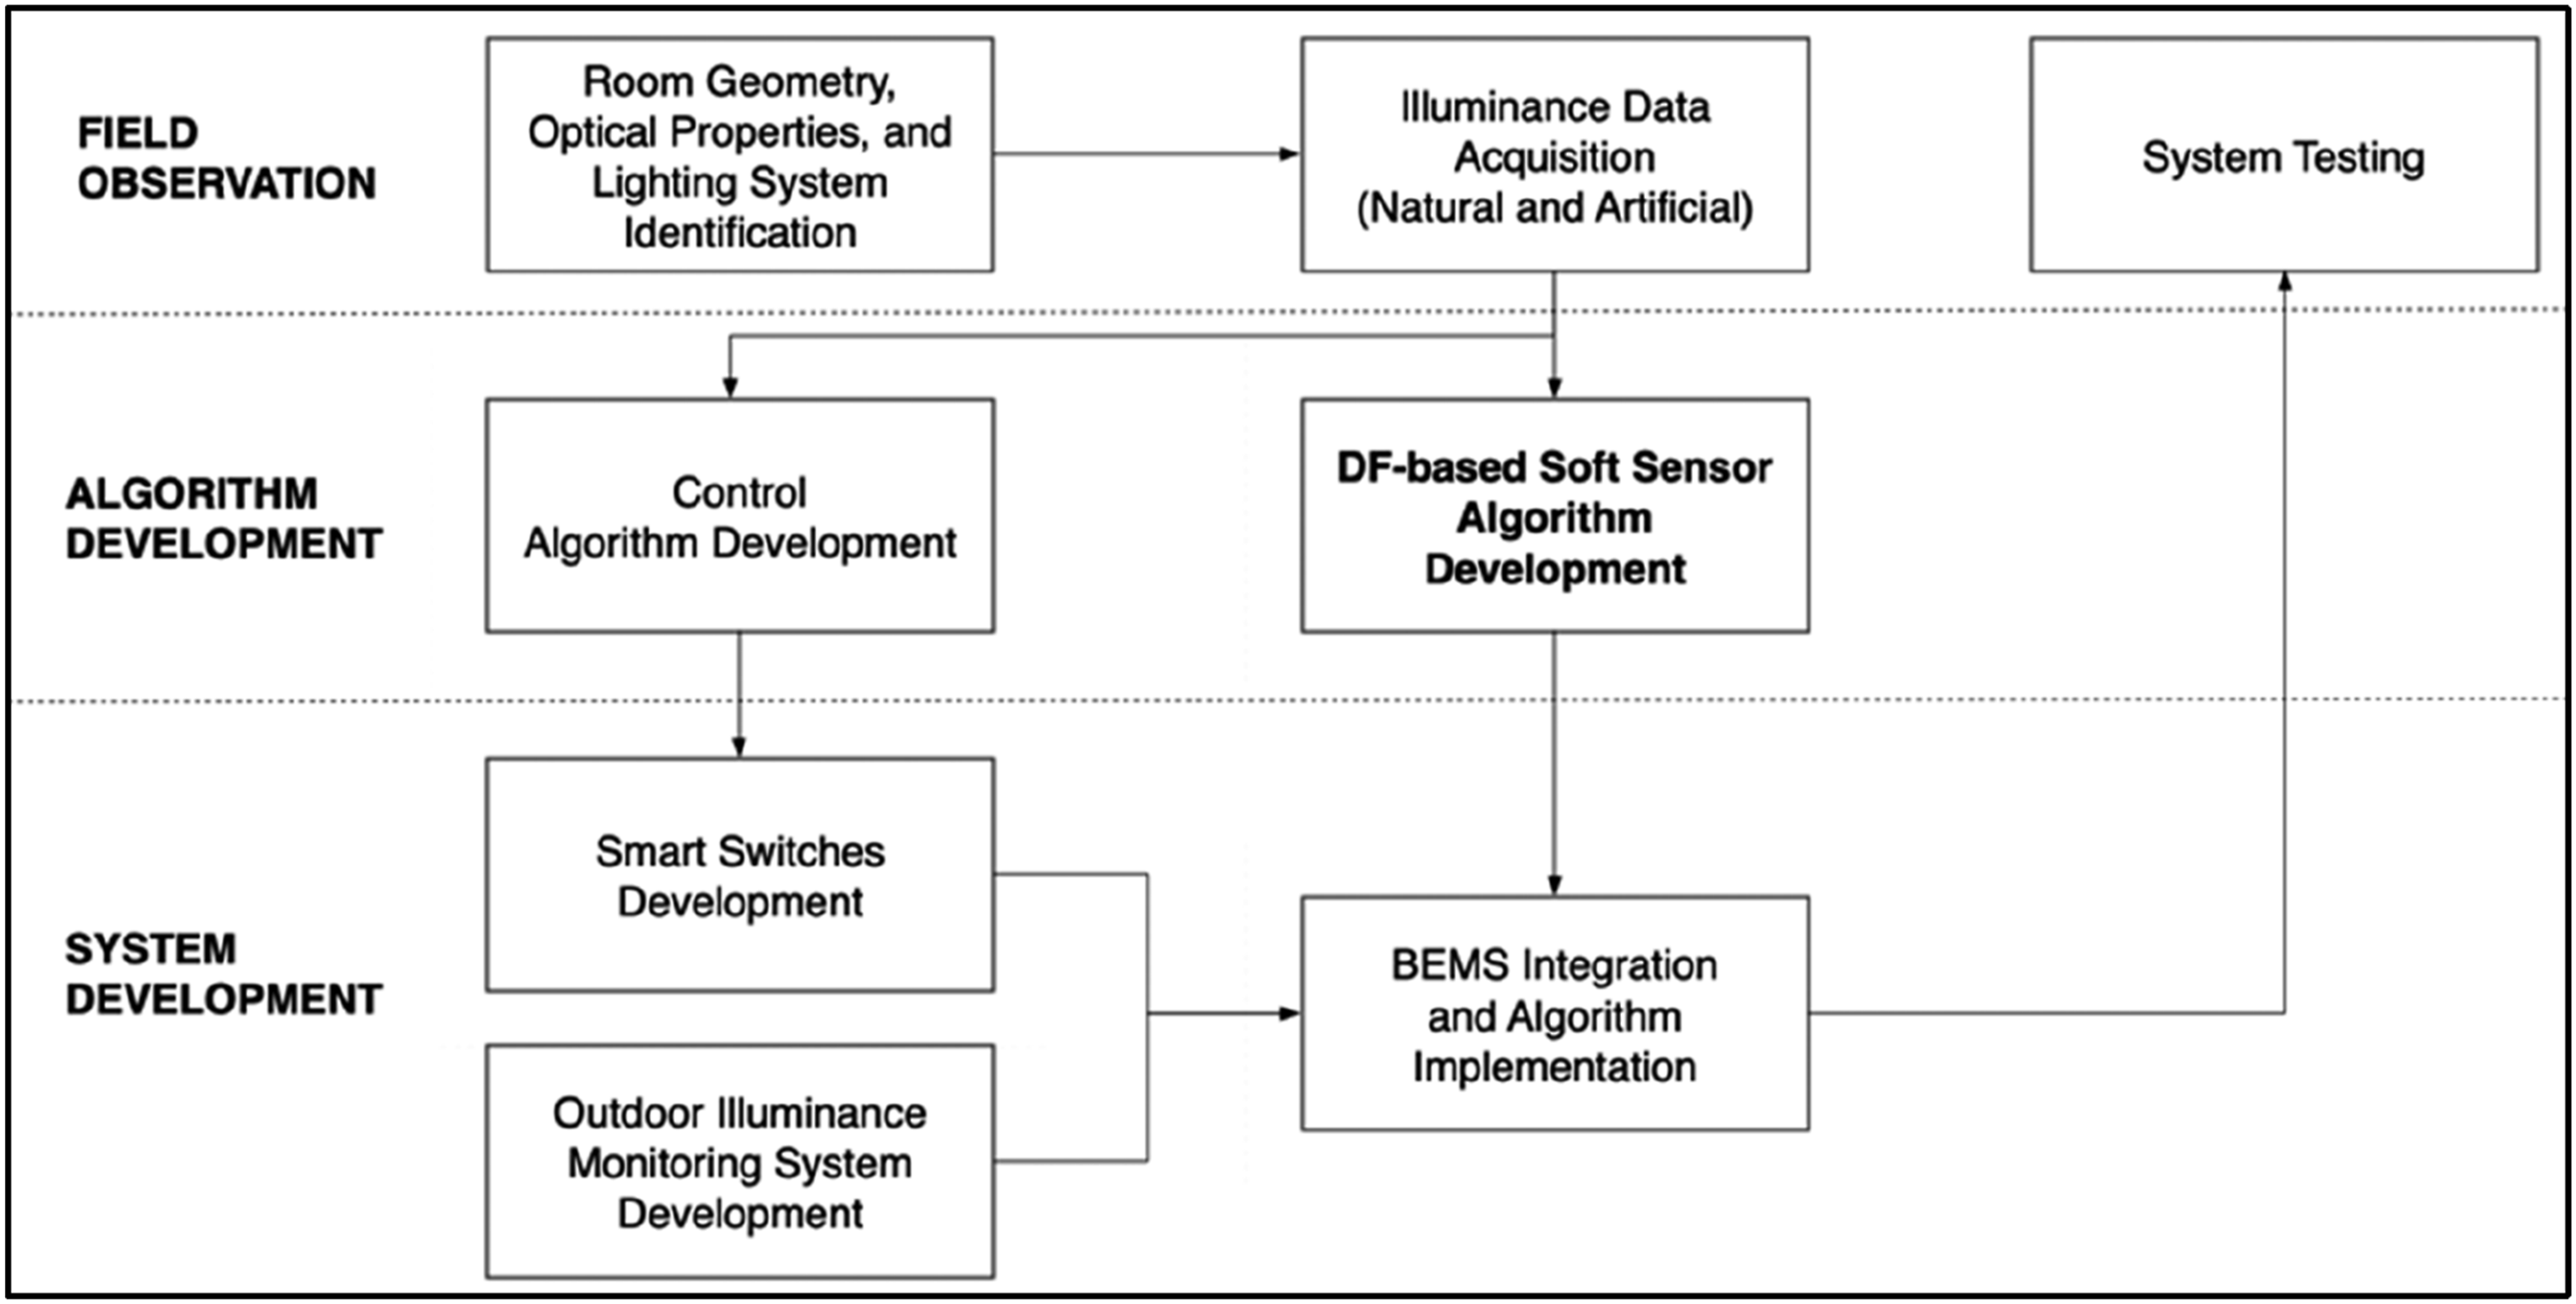
Figure 2 shows the schematic diagram of the system developed in this study. The system consists of two parts: the monitoring and control of indoor illuminance. The indoor illuminance at a point Schematic diagram of the system.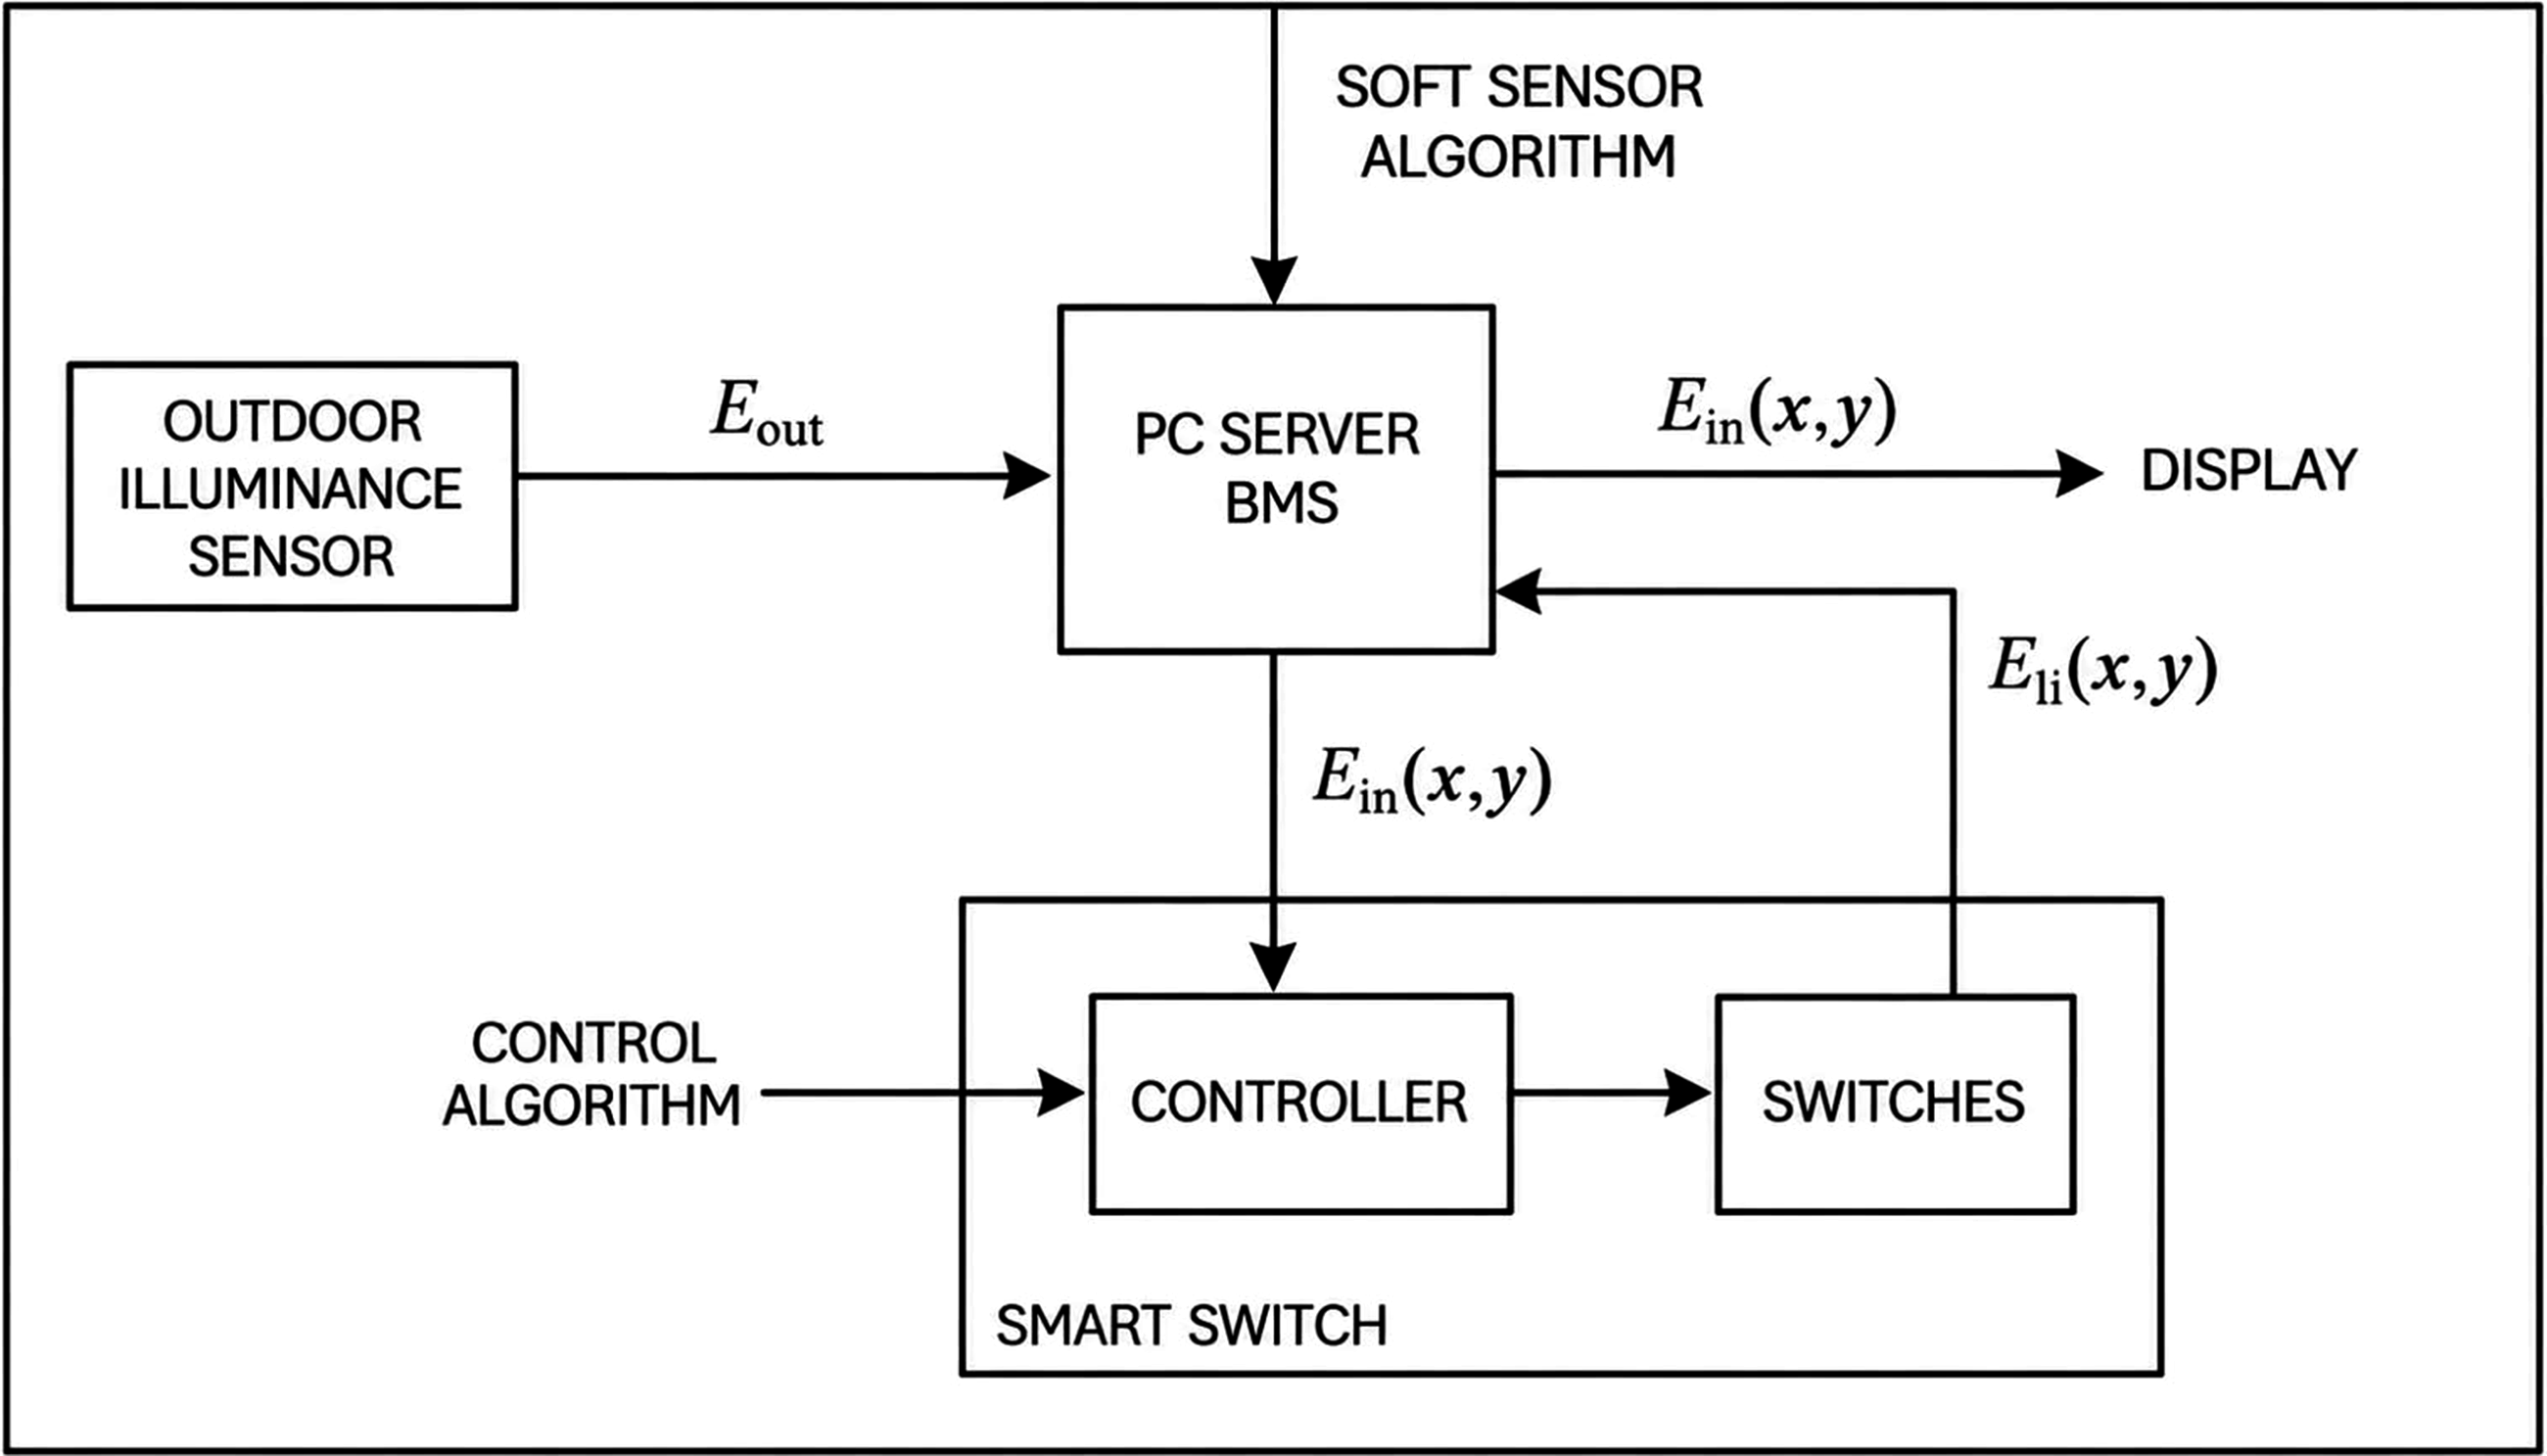

Daylight factor (
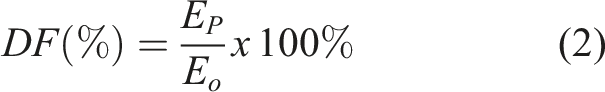
Daylight Factor is a static parameter that describes the potential distribution of daylight within a space for a given building design, which is shaped by the space geometry, the size and position of openings, and the reflectance properties of interior surfaces.27,28 As a static metric, daylight factor does not account for temporal variations in daylight due to changes in time, season, or weather conditions; therefore, for a given building configuration, its value can be considered relatively constant as long as there are no changes in building geometry or materials.29,30 Thus,
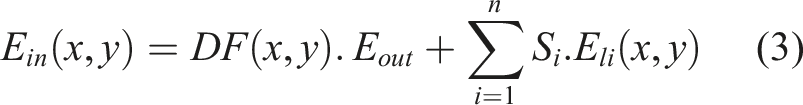
Soft sensor technology using the DF model is utilized to monitor the distribution of indoor illuminance by making use of the measured outdoor illuminance detected by sensors and the on-off status of the light switches, as expressed:
The algorithm for indoor illuminance control is constructed by comparing the real-time illuminance value predicted by the soft sensor against a given set point. The intelligent switch will manipulate the lighting in the space according to the controller output to make sure it remains at the desired condition.
Case study
This study involved two different rooms in a single building, i.e., the Sensor and Telecontrol Systems Laboratory (SSTK) and the TN-7 Classroom (TN-7). Both rooms are located on the second floor of the Department of Nuclear Engineering and Engineering Physics (DTNTF), Faculty of Engineering, Universitas Gadjah Mada (UGM), see Figure 3(a). Layout of the 2nd floor at the DTNTF UGM building for (a) overall floor; and details of the (b) SSTK laboratory; and (c) TN-7 classroom showing their layout, elevation, and furniture arrangements.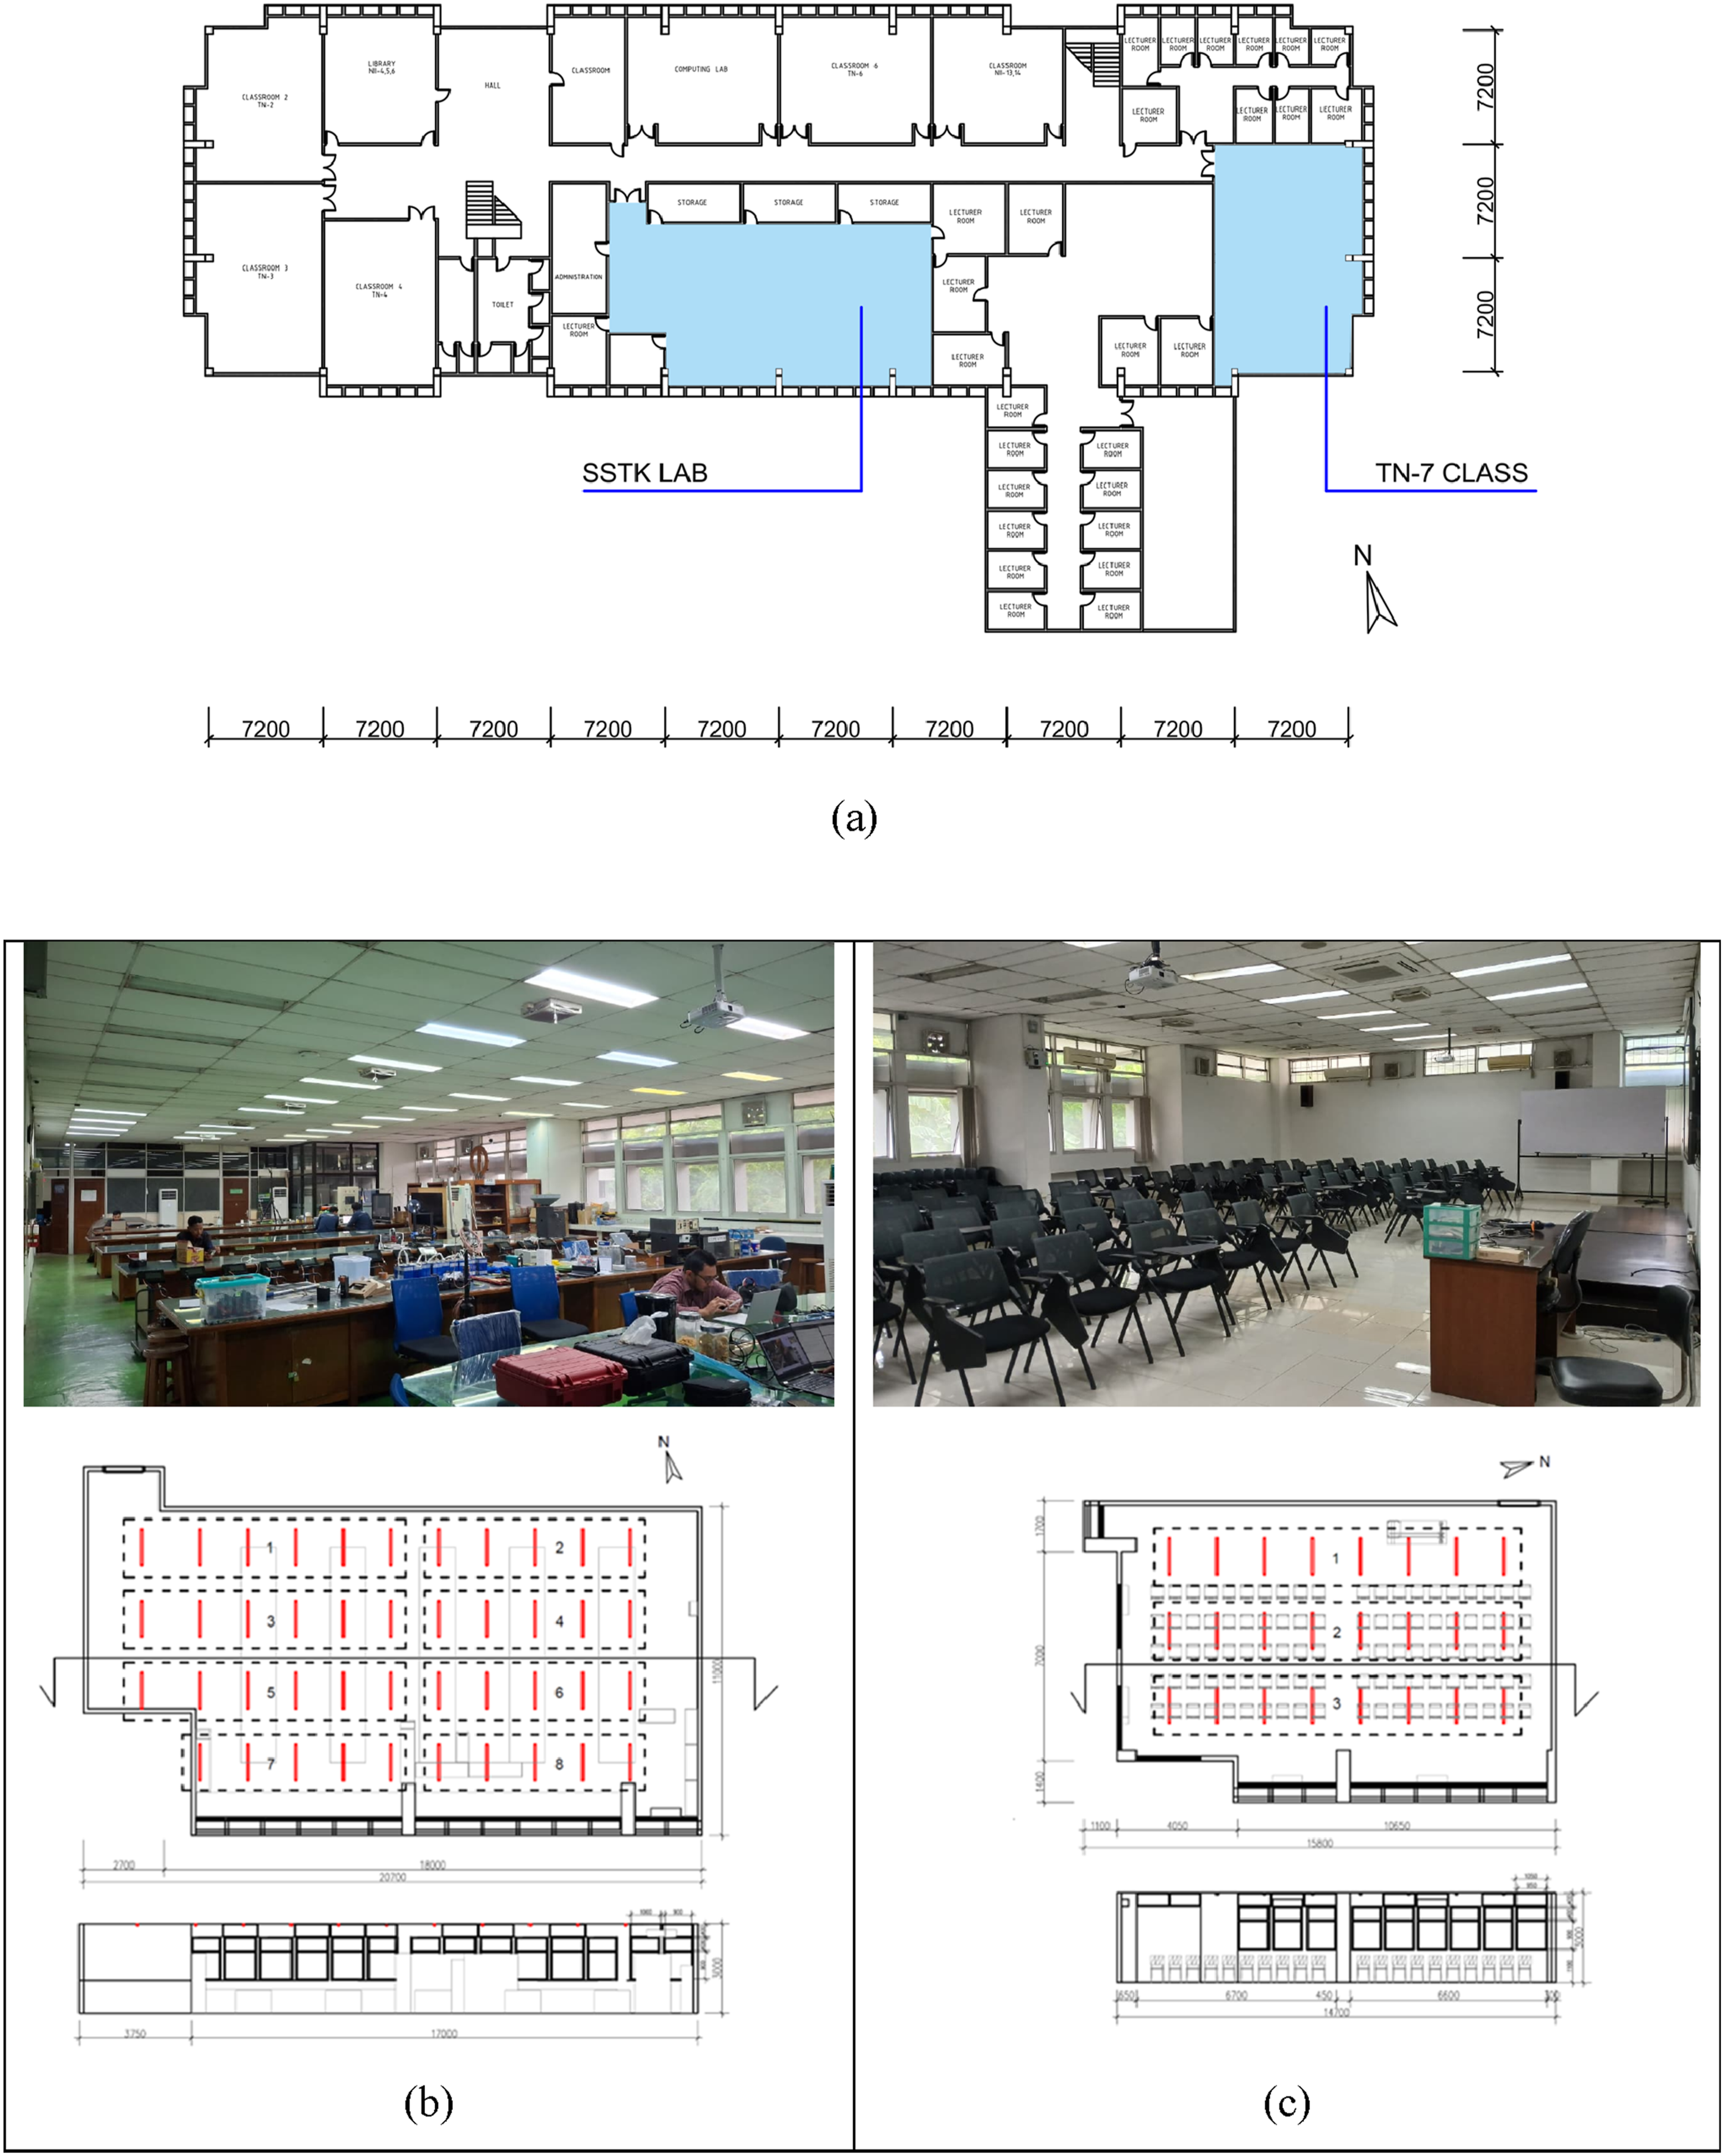
Figure 3(b) and (c) display interior layouts and elevation of the studied rooms indicating the positions of windows, desks, and luminaires. The SSTK laboratory has an area of 206 m2 and is located on the southern side of the building, with natural light entering through glass windows on the south-facing wall. Meanwhile, the TN-7 classroom is located on the eastern side of the building, with an area of 129 m2 and is equipped with window openings on the east-facing wall, allowing natural light to enter the room. The control strategy is designed to maximize the use of natural daylight during building operation, and no shading devices (e.g., blinds or curtains) were used. Both spaces are equipped with 20 W LED artificial lighting systems, installed uniformly on the ceiling in a grid configuration adapted to the space’s function and area. The artificial lighting system uses Philips Ecofit LED Tubes E8 luminaires with a power rating of 16 W, a colour temperature of 6500 K, and a luminous flux of 1600 lumens. The luminaire has a wide beam angle distribution that suits general lighting requirements in educational and laboratory spaces. 32
The artificial lighting systems in both spaces were designed using a luminaire grouping scheme into several control groups to support operational flexibility and efficiency. All luminaires in each space were grouped into several lighting zones, each connected to an independent switch. The luminaires in the SSTK were grouped into eight lighting groups, and those in TN-7 into three (see Figure 3). This configuration enabled stepwise lighting control in accordance with activity requirements within the space as well as natural lighting conditions.
Development of DF-based soft sensor algorithm
The soft sensor algorithm used in this study was constructed based on equation (3) using measurement data of Measurement points in (a) SSTK; and (b) TN-7.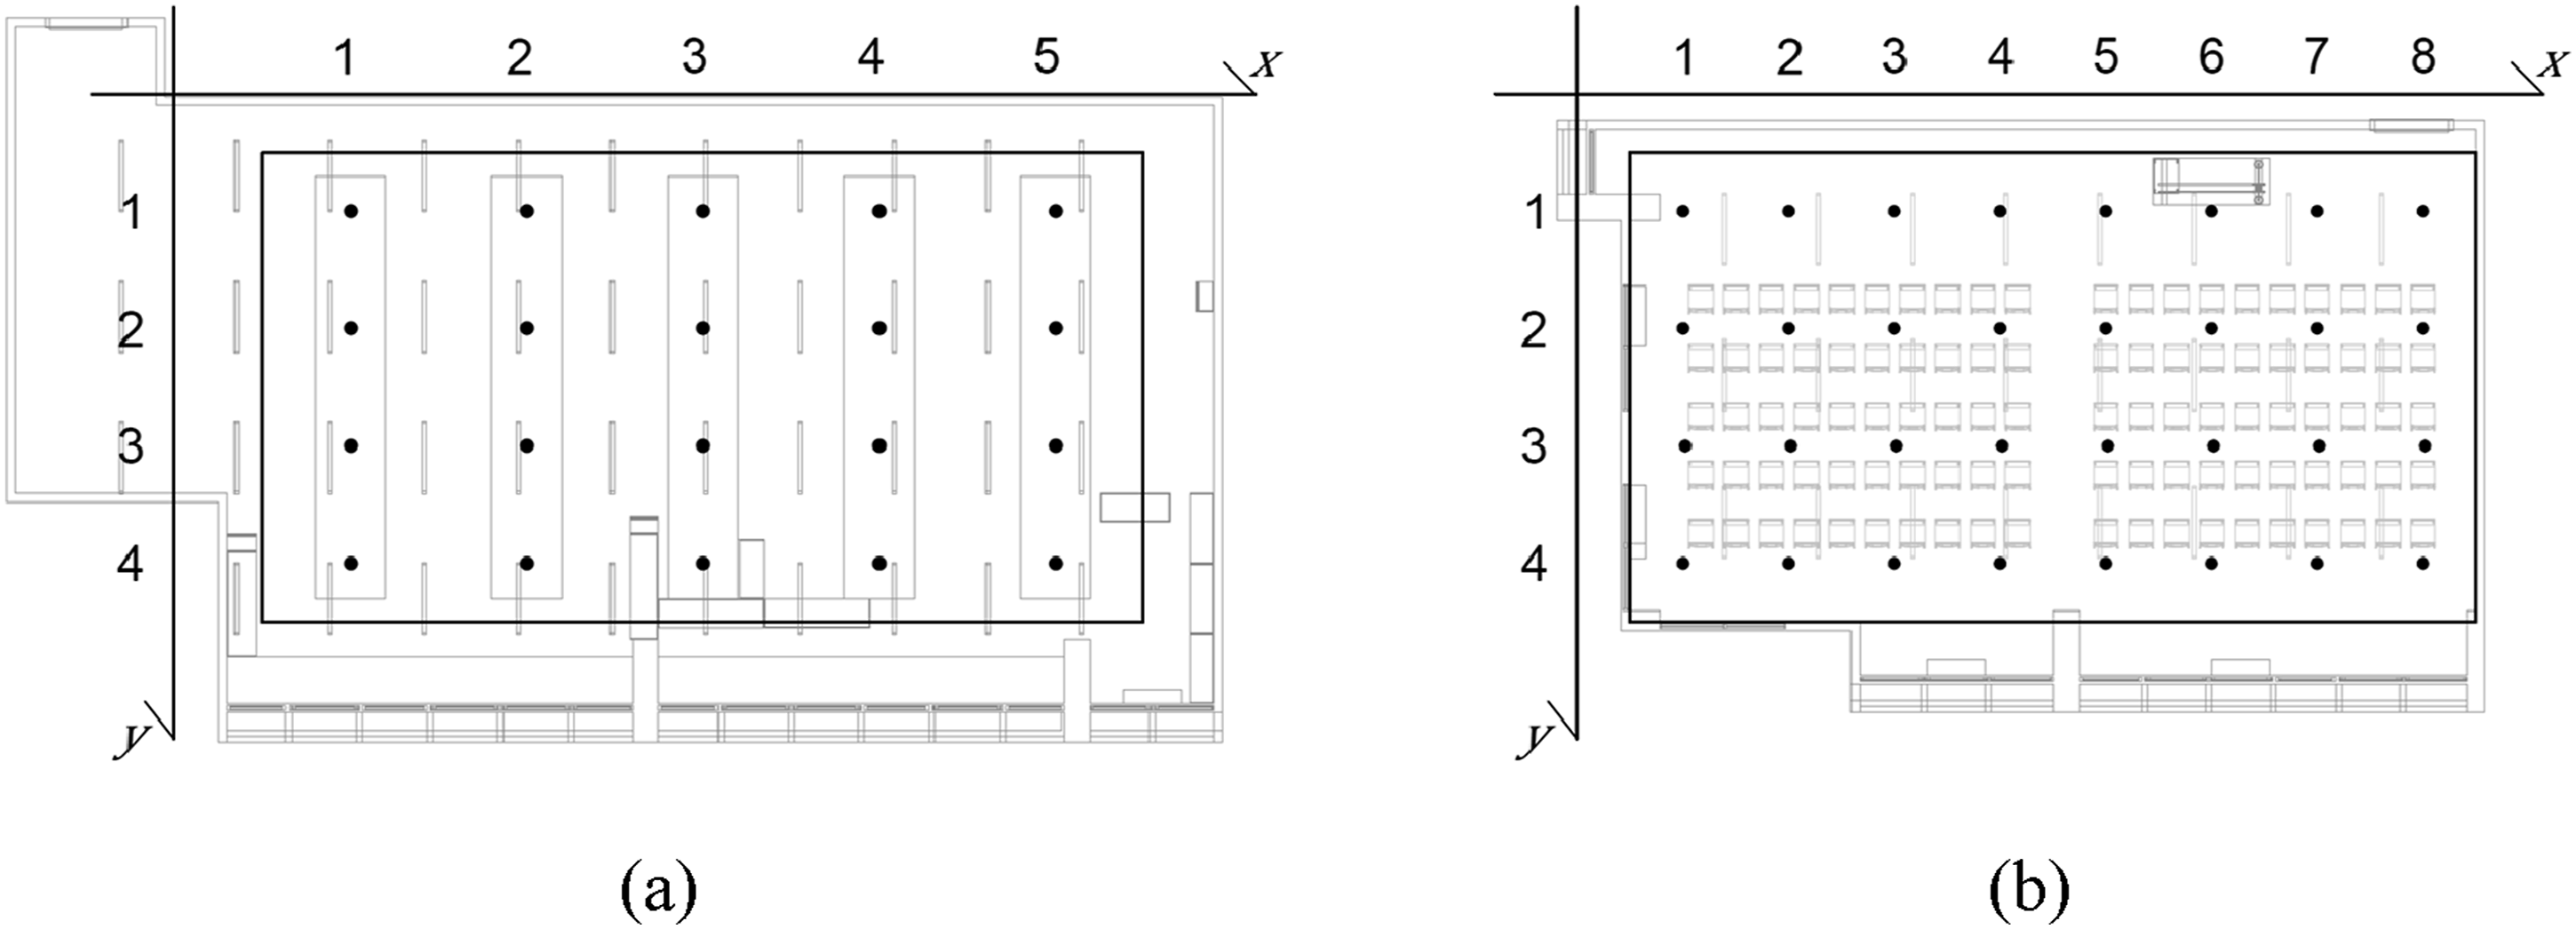
Natural and artificial lighting simultaneously shape indoor lighting characteristics. Therefore, measurements were taken for both outdoor illuminance
On the other hand, artificial lighting characteristics are shaped by its luminance distribution. To isolate the artificial lighting profiles without being influenced by natural light, measurements were conducted at night by switching the lighting groups on sequentially, thus obtaining data on the artificial lighting contribution from a lighting group
Furthermore, validation was performed to assess the lighting prediction results generated by the soft sensor algorithm. The validation was conducted by comparing the results with actual indoor illuminance measurement results were evaluated using two parameters: Mean Absolute Error (MAE) and Root Mean Square Error (RMSE). MAE represents the average error physically experienced by the system, while RMSE represents the intensity of fluctuations or the dominant error energy in the system, particularly due to large errors.37,38
Development of control algorithms
Figure 5(a) demonstrates the decision-making process of the lighting control algorithm to directly respond to the predicted illuminance values generated by the soft sensor. Each lighting group is associated with a specific lighting zone that includes several measurement points beneath it (Figure 5(b)). For each zone, the illuminance value of the zone Flowchart of the control algorithm for (a) every lighting zone; and (b) in SSTK.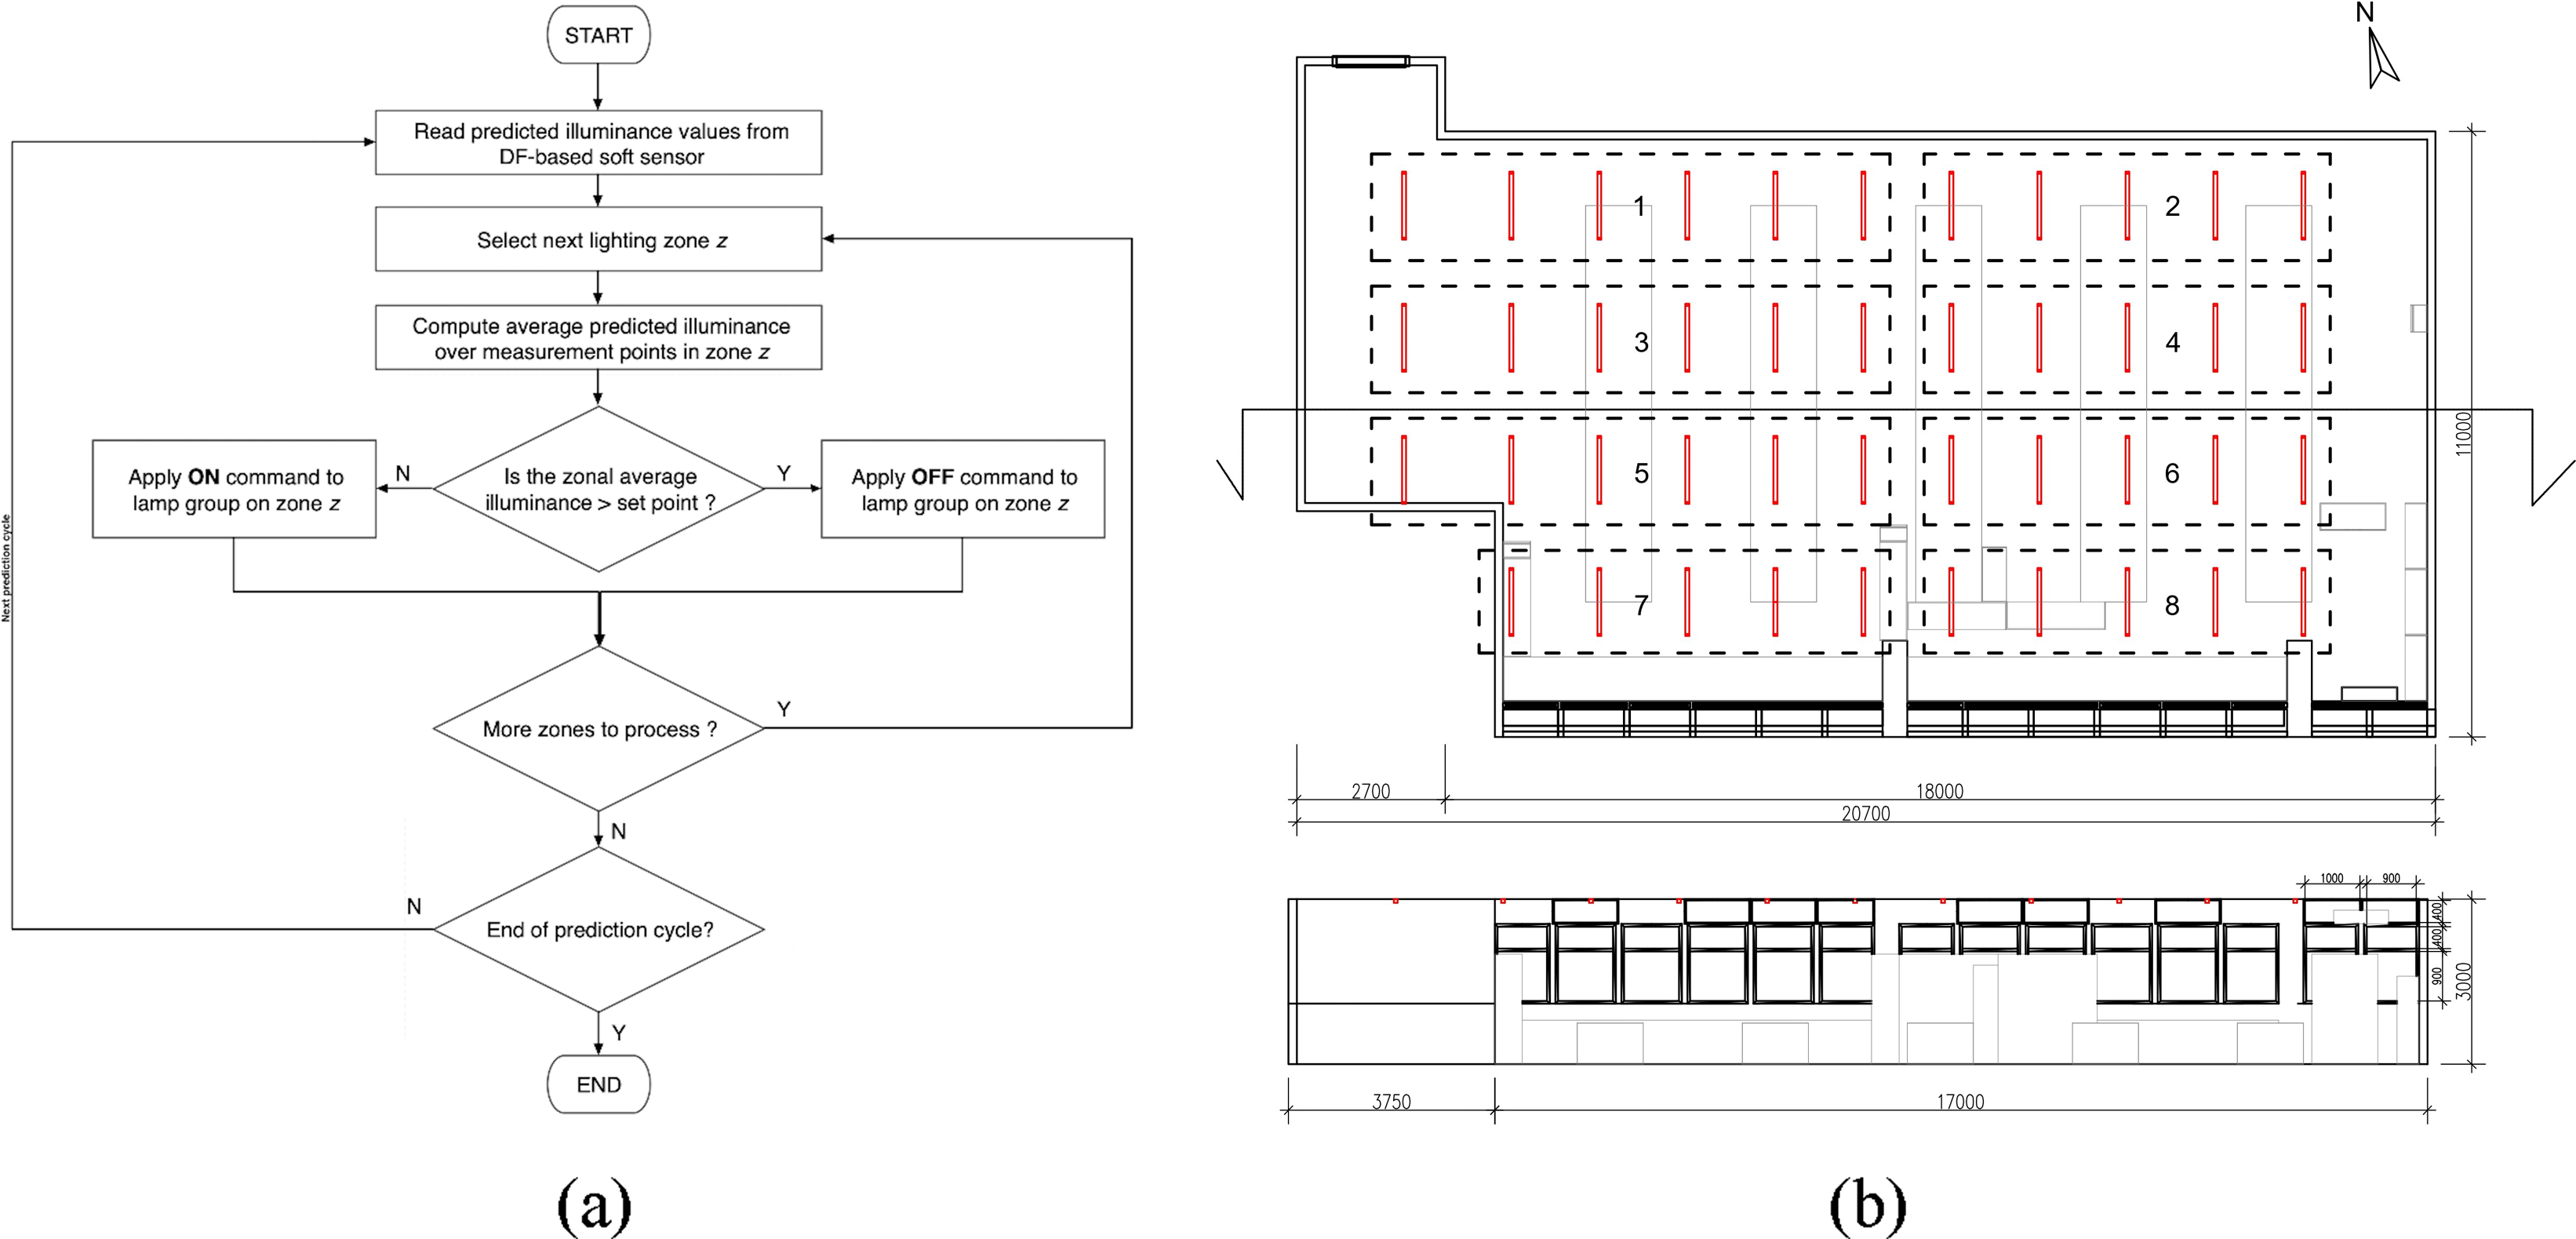
System development
The soft sensor and control algorithms developed in the previous stages were embedded into an actual real-time lighting monitoring and control system and were integrated into the existing BEMS. The development includes the design and implementation of an outdoor illuminance monitoring system, the construction of smart switches as lighting actuation devices, and the integration of all system components into the BEMS platform.
The DF-based indoor lighting control system requires real-time outdoor illuminance data as the primary input to the soft sensor algorithm that predicts indoor lighting (see equation (3)). Thus, an Outdoor Illuminance Monitoring System was developed to fetch real-time data consisting of a lux sensor integrated with a Raspberry Pi microcontroller and was installed at a representative, unshaded rooftop location, enabling accurate capture of natural lighting fluctuations. The measurement data were transmitted via a wired Local Area Network (LAN) using the Modbus communication protocol and stored in a server database as part of the BEMS platform.
The smart switch feature was developed as an actuator device for lighting control and monitoring the room’s operational status and was integrated into the BEMS. The operational communication between the smart switch and the BEMS was directed via the MQTT protocol, thus allows bidirectional exchange of data and control commands. Subsequently, all subsystems, including the outdoor illuminance monitoring system with the DF-based soft sensor prediction algorithm and the smart switch with the lighting control algorithm, were integrated into the BEMS platform. This platform functions as a centralized system for monitoring lighting conditions and making zonal lighting control decisions based on real-time data.
System validation
System testing was performed to assess the performance of the developed system, covering both monitoring and control aspects. The tests focused on accuracy, real-time characteristics, and system reliability, and were performed under actual operational conditions. Measurement accuracy was evaluated using Mean Absolute Percentage Error (MAPE), by comparing system measurement results with reference data. 39 Real-time characteristics were evaluated by measuring the average system latency, which represents the time delay from the sensor data acquisition process until the data are successfully received and stored in the BEMS database. System reliability was evaluated by comparing the number of data successfully stored in the database with the number of data acquired by the sensors during the testing period.
Testing on the control system focused on evaluating the performance of the smart switch as a lighting actuator within the BEMS. This testing included both functional and operational tests to ensure the reliability of control responses and status monitoring through the BEMS. The functional testing included validation of the ON/OFF control function and load status feedback mechanism, testing of system configuration via WiFi and BLE connectivity, as well as testing of the power supply/battery indicator. The operational testing included evaluation of response delay, smart switch current consumption, and system operating time. The operating time test was conducted by considering relay conditions in both connected and disconnected states to assess their influence on the smart switch’s duration in standby and active modes, thereby enabling a comprehensive evaluation of system reliability for long-term operation.
Result and discussion
Indoor daylight characterisation
Figure 6 shows the mean DF distributions at SSTK and TN-7, revealing a differences in both magnitude and spatial uniformity. The SSTK room is dominated by low DF values at most measurement points, ranging approximately 0.03–0.06%, with only a few points exhibiting higher DF values up to 0.176%. In contrast, the TN-7 room exhibits relatively higher and more evenly distributed DF values, with most points falling within the range of 0.04–0.07% and a similar maximum value of approximately 0.176%. This difference indicates that the TN-7 room has greater potential for utilizing daylight compared to the SSTK room. Spatial distribution of average DF at (a) SSTK; and (b) TN-7.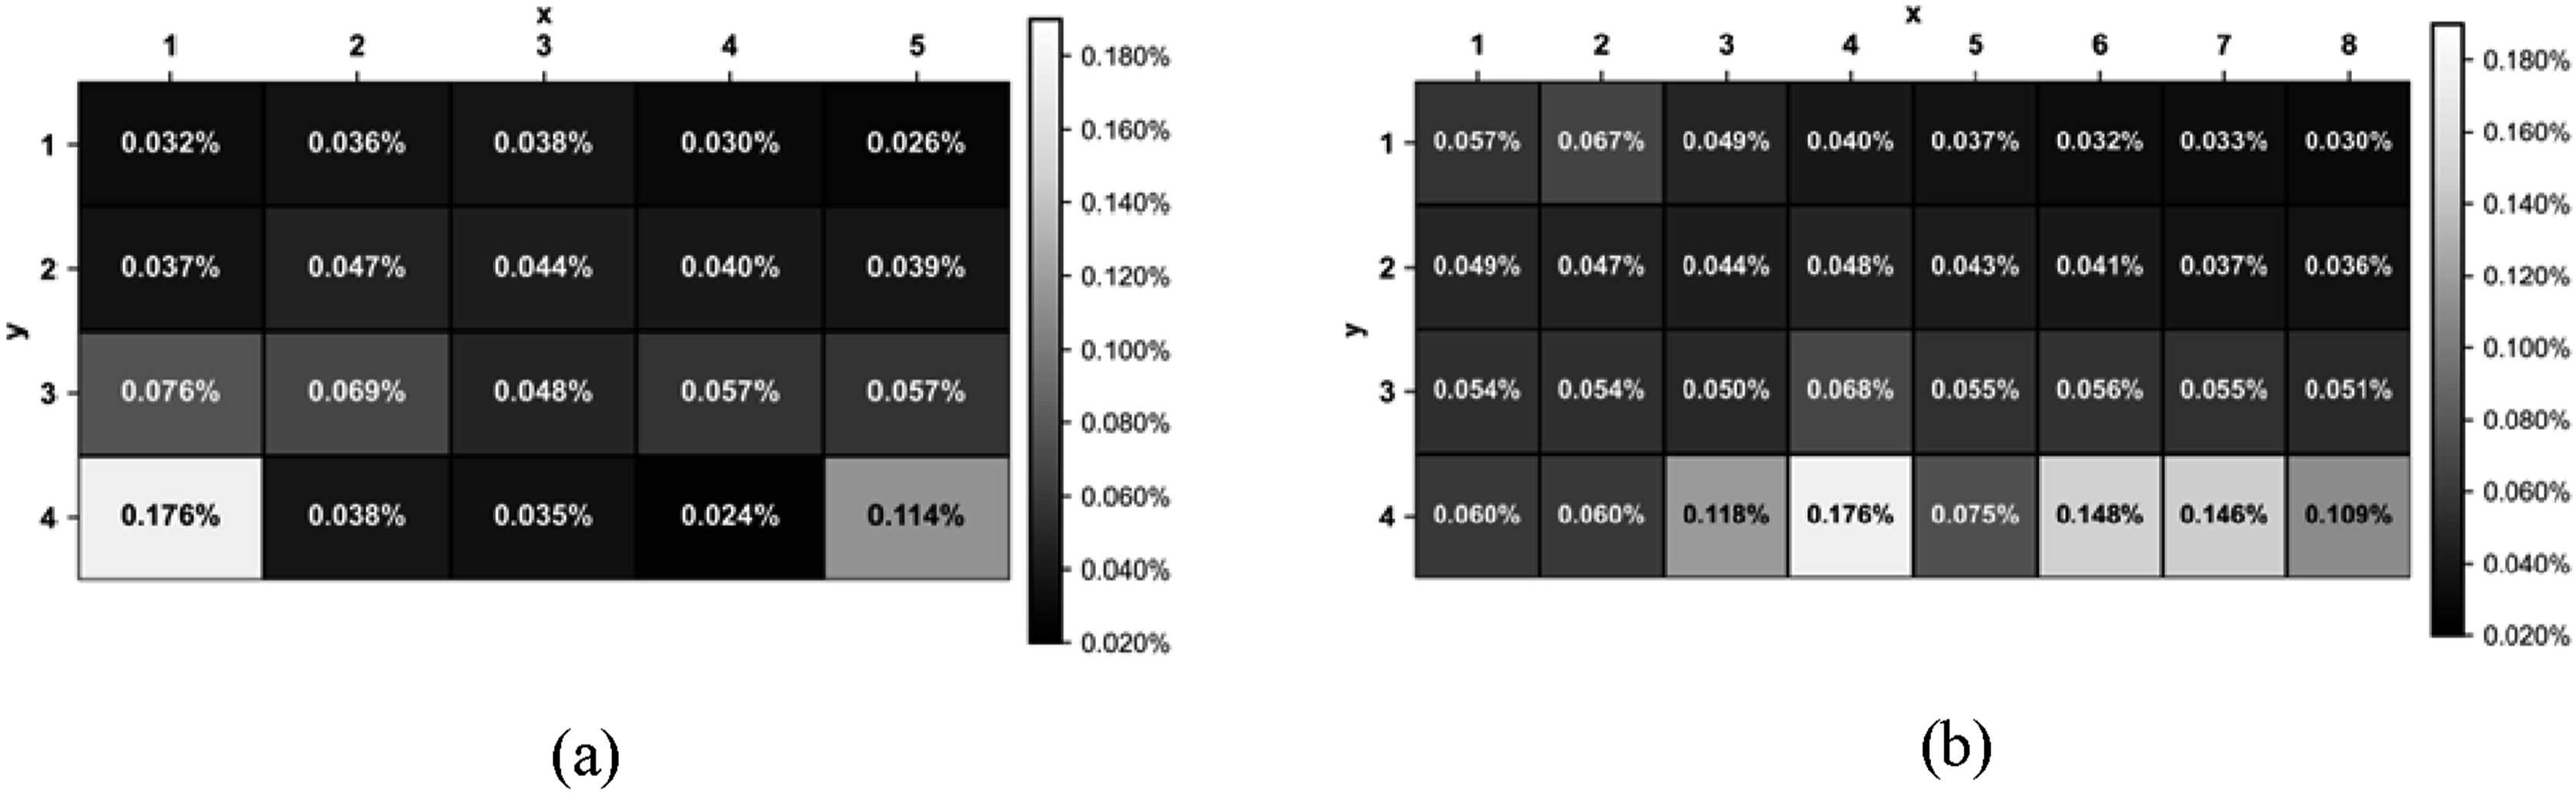
Differences in DF distribution are strongly correlated with the room layout and interior configurations (Figure 3). In SSTK, storage cabinets and other interior elements aligned parallel to the window plane act as visual obstructions that block daylight penetration indoors. In contrast, the more open layout of TN-7, with minimal obstructions around the openings, allows daylight to spread more evenly across the work area. These findings confirm that daylighting performance is not determined solely by window position and size, but is also influenced by interior layout. Therefore, interior configuration should be considered in DF modeling and in the design of adaptive lighting control systems based on building energy management systems (BEMS).
Fluctuations in DF values at each measurement point are caused by variations in the sky conditions during data acquisition, where the sky might be uniform overcast, partly cloudy, and clear conditions.26,35 These variations lead to changes in the intensity and direction of incoming daylight, thereby affecting daylight illuminance at points that receive direct sunlight from outside the building, typically near windows. Figure 7 displays the phenomena, where wider DF ranges in repeated measurement boxplots reflect higher sensitivity to changes in outdoor lighting conditions. Distribution of DF measurement results at each measurement point in (a) SSTK; and (b) TN7.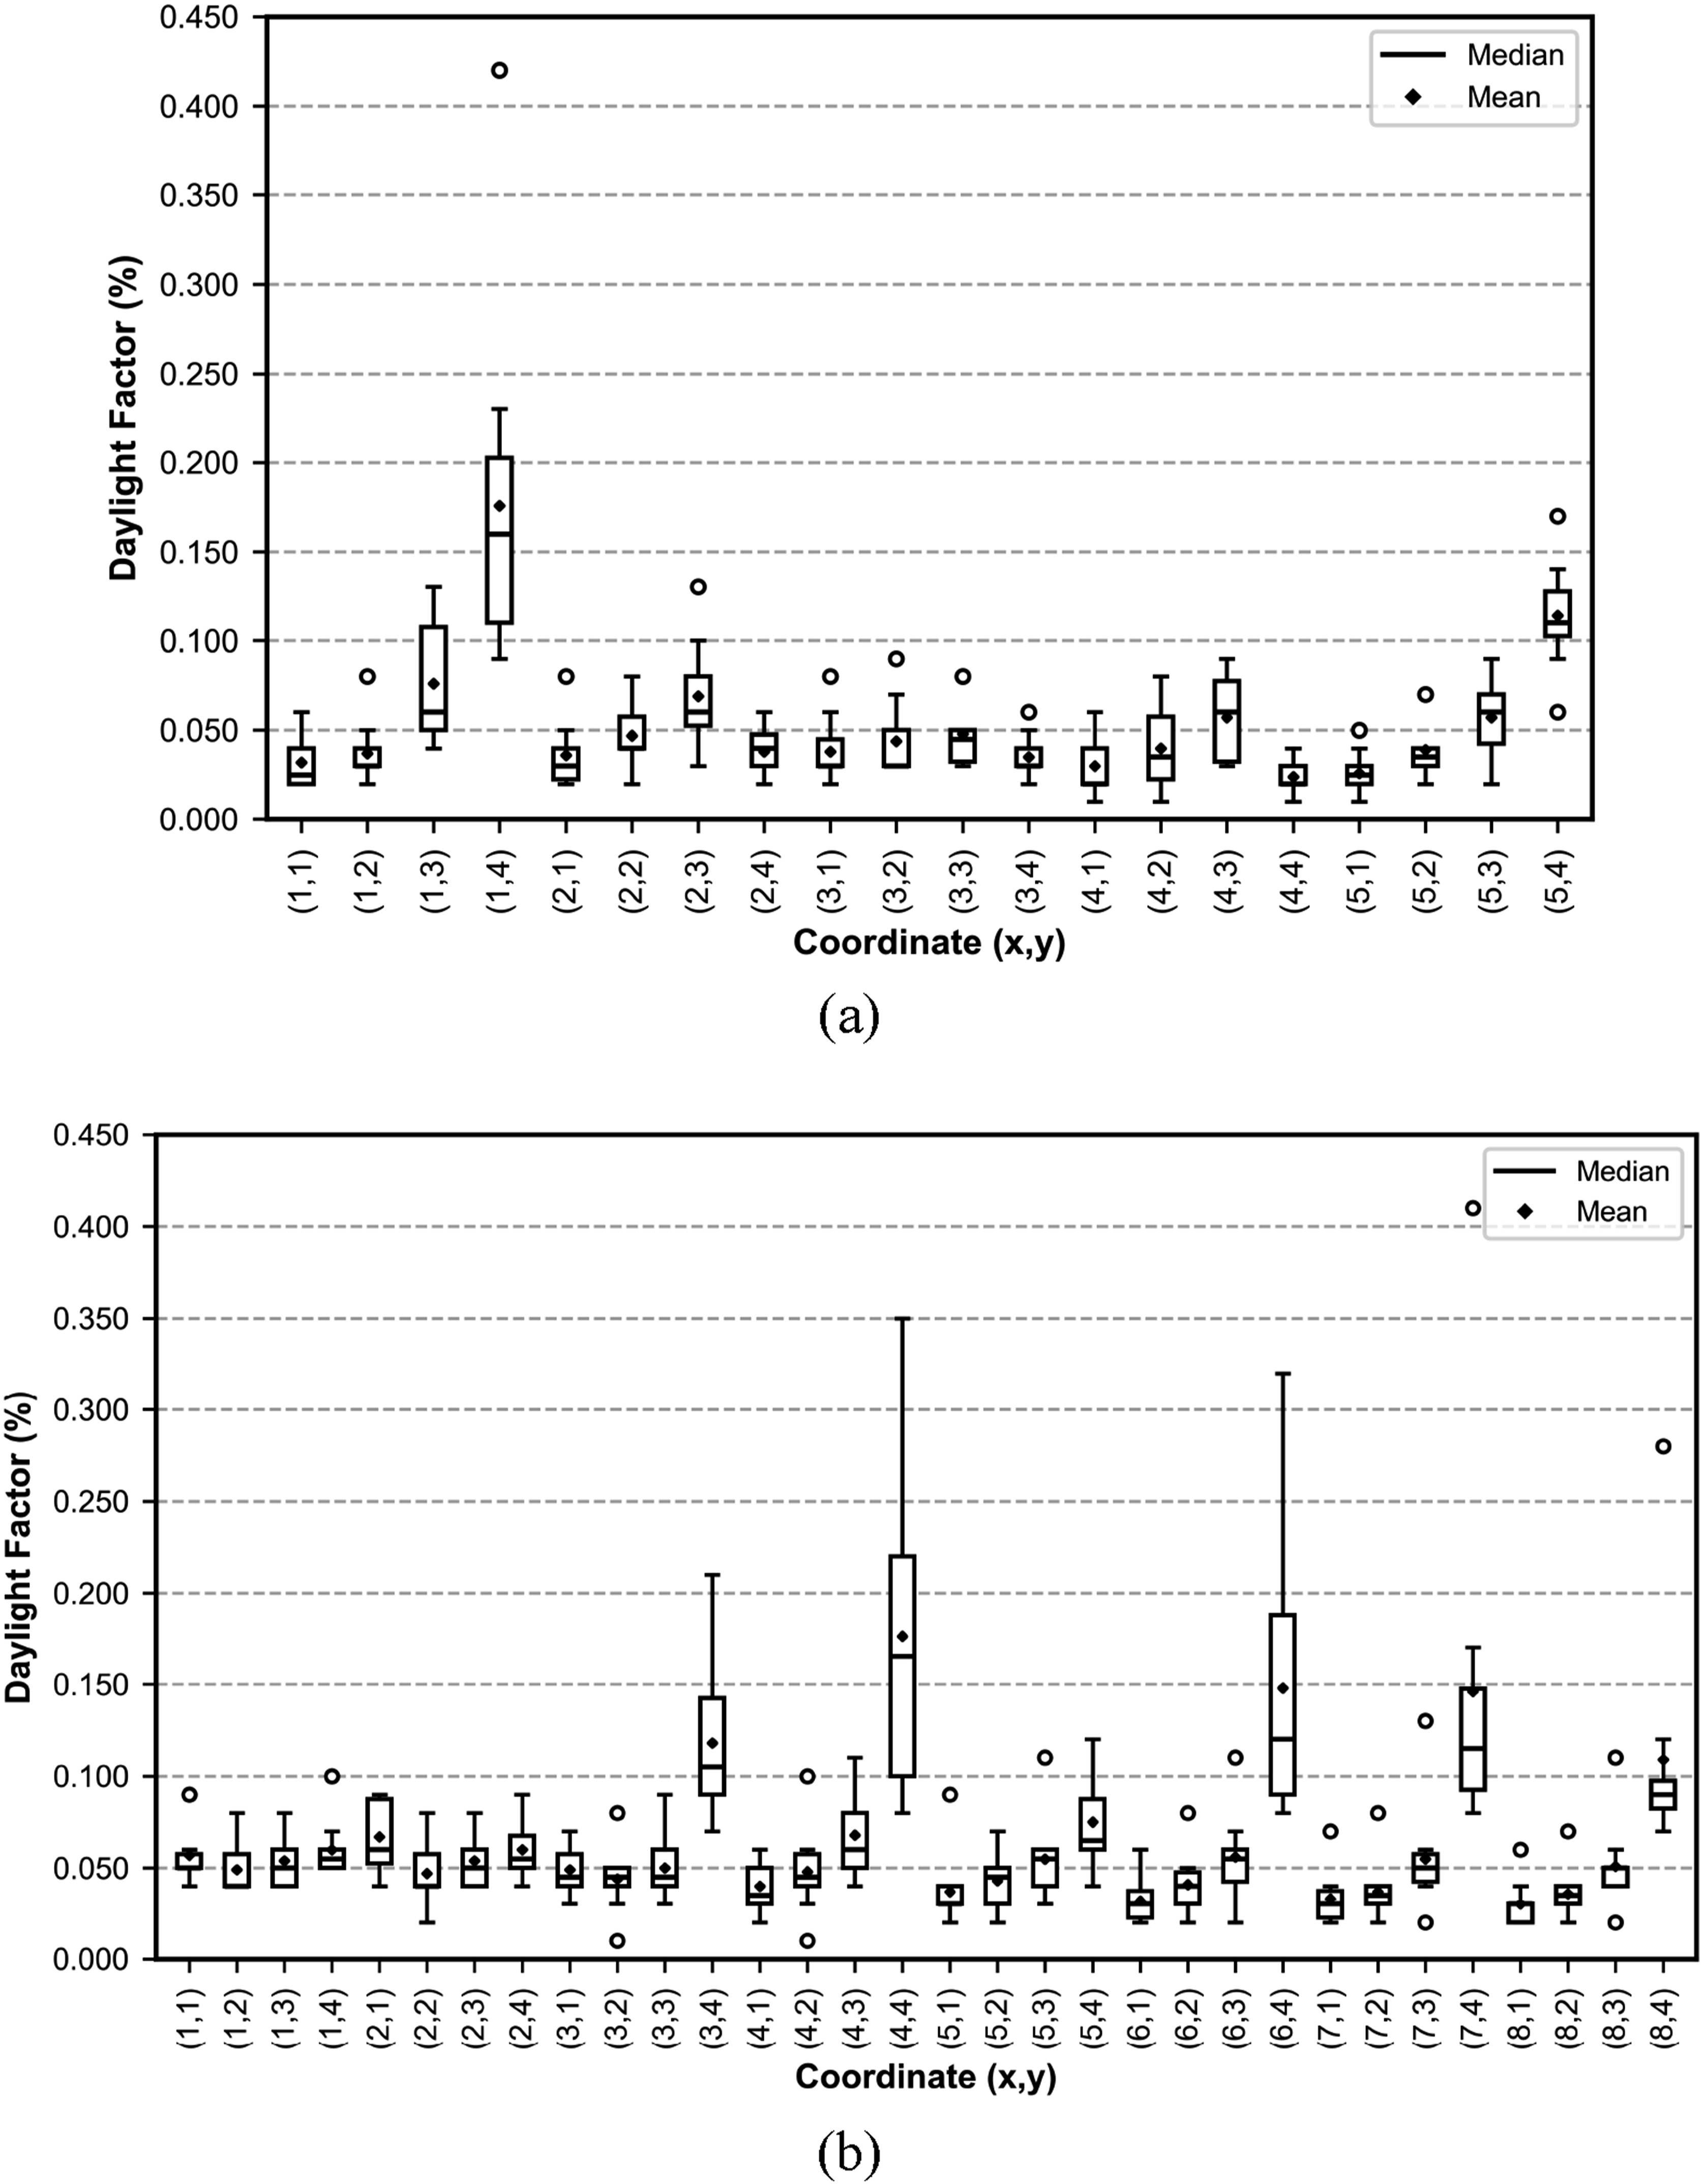
In SSTK (Figure 7(a)), the highest DF fluctuations are identified at points (1, 3) and (1, 4). These points are located near the windows and are unobstructed by interior elements, making them highly responsive to changes in daylight intensity and incident angle. In contrast, points such as (2, 4), (3, 4), and (4, 4), although relatively close to the windows, exhibit lower fluctuations due to the presence of interior elements that obstruct direct sunlight. Meanwhile, point (5, 4) shows relatively low DF fluctuation compared to other points in the same row. This is due to its position being obstructed by the eastern wall, as shown in the room layout in Figure 3. As a result, the daylight received at this point is dominated by reflected and diffused light, leading to smaller DF variations despite changing sky conditions.
In TN-7, the greatest DF fluctuations occur at points (3, 4), (4, 4), (6, 4), and (7, 4), which are located near the east-facing windows and are not obstructed by interior elements. The east-facing window orientation causes these points to receive direct sunlight that is highly sensitive to changes in sky conditions, resulting in wider DF fluctuation ranges compared to SSTK. Point (5, 4), although close to the window, exhibits lower DF fluctuation due to the presence of surrounding interior walls that obstruct direct sunlight entry and cause the lighting to be dominated by diffused light.
Indoor artificial lighting characterisation
Figure 8 displays the illuminance distribution measured when all artificial lighting groups were switched on. The SSTK room has an average illuminance of 340.35 ± 35.06 lux, with smaller spatial variation across measurement points. In contrast, TN-7 shows a lower average illuminance of 288.97 ± 80.74 lux, with a substantially larger standard deviation, indicated by low uniformity and widely distributed illuminance between 120 lux and 450 lux. Distribution of artificial lighting illuminance in (a) SSTK; and (b) TN-7.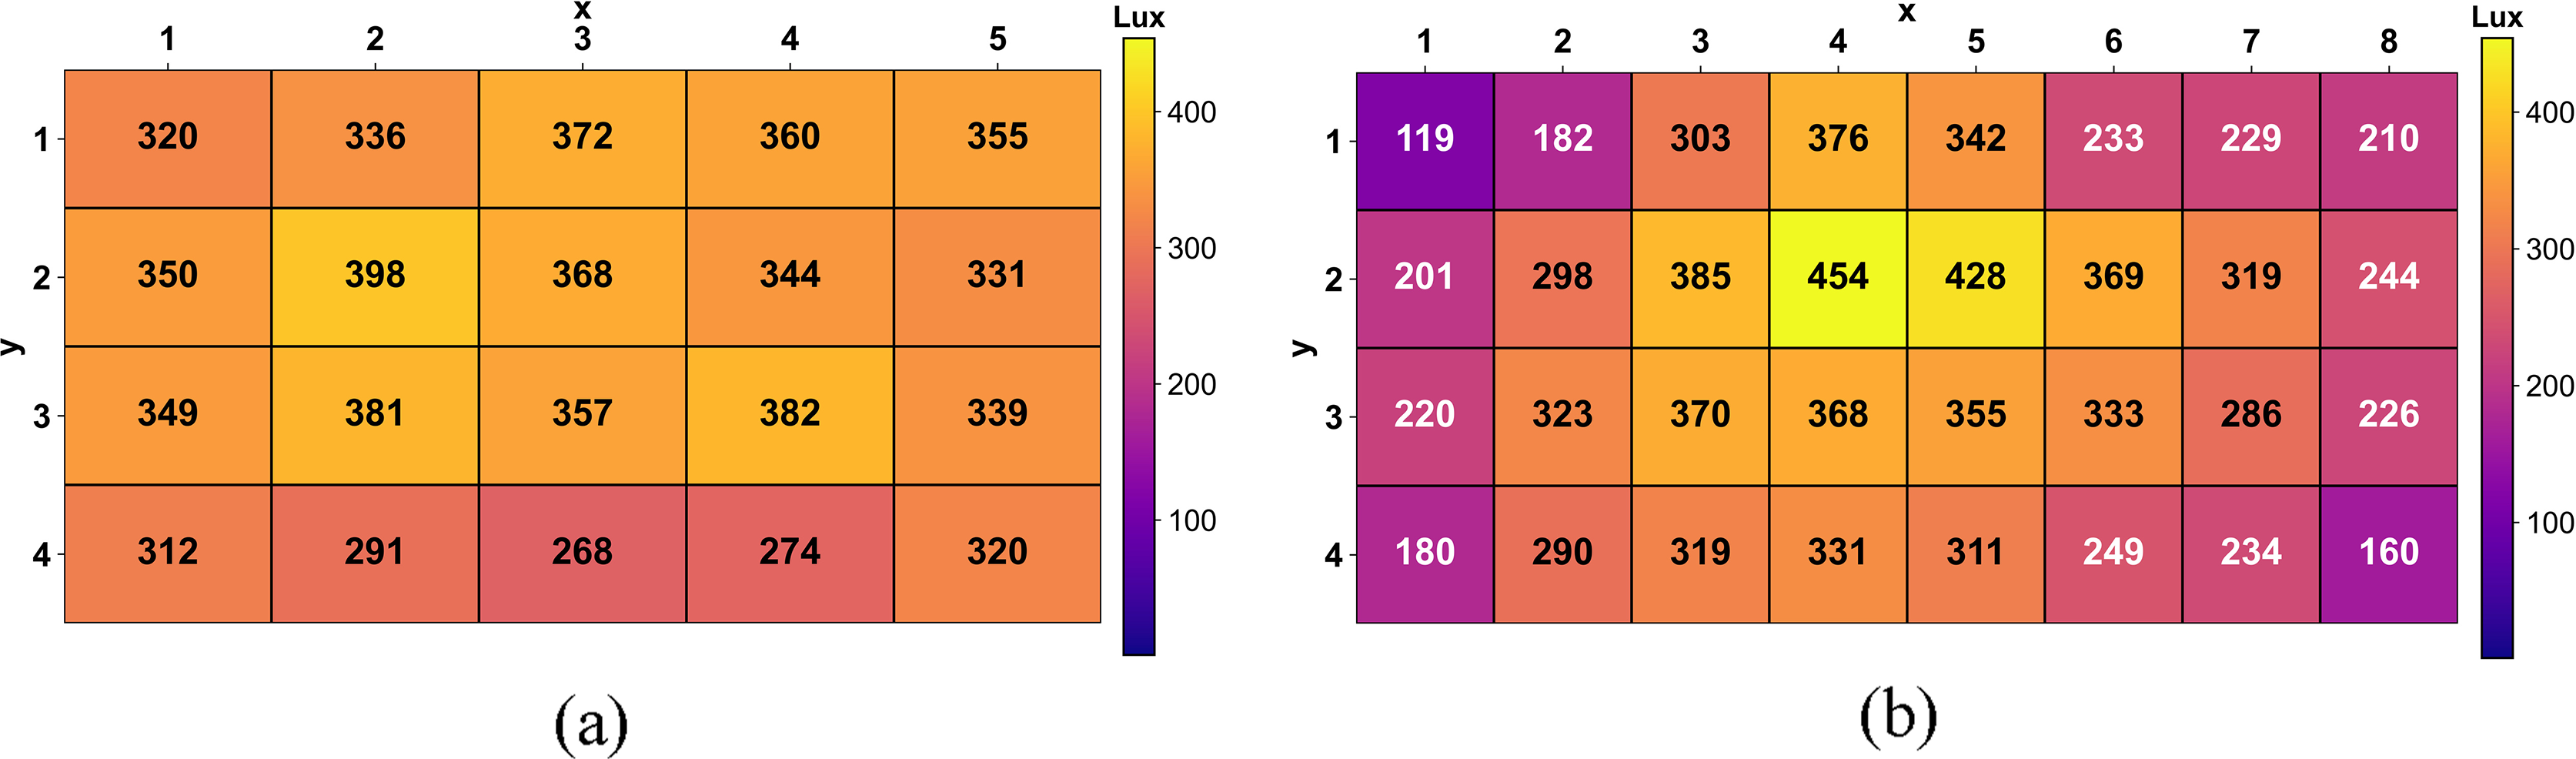
The differences in illuminance variation are caused by a combination of geometric factors and operational characteristics of the artificial lighting system. Beside the influence of the distance between measurement points and luminaires and the lighting zoning configuration, differences in luminaire age and performance degradation contribute significantly to nonuniform light output, even when all lighting groups are operated simultaneously.
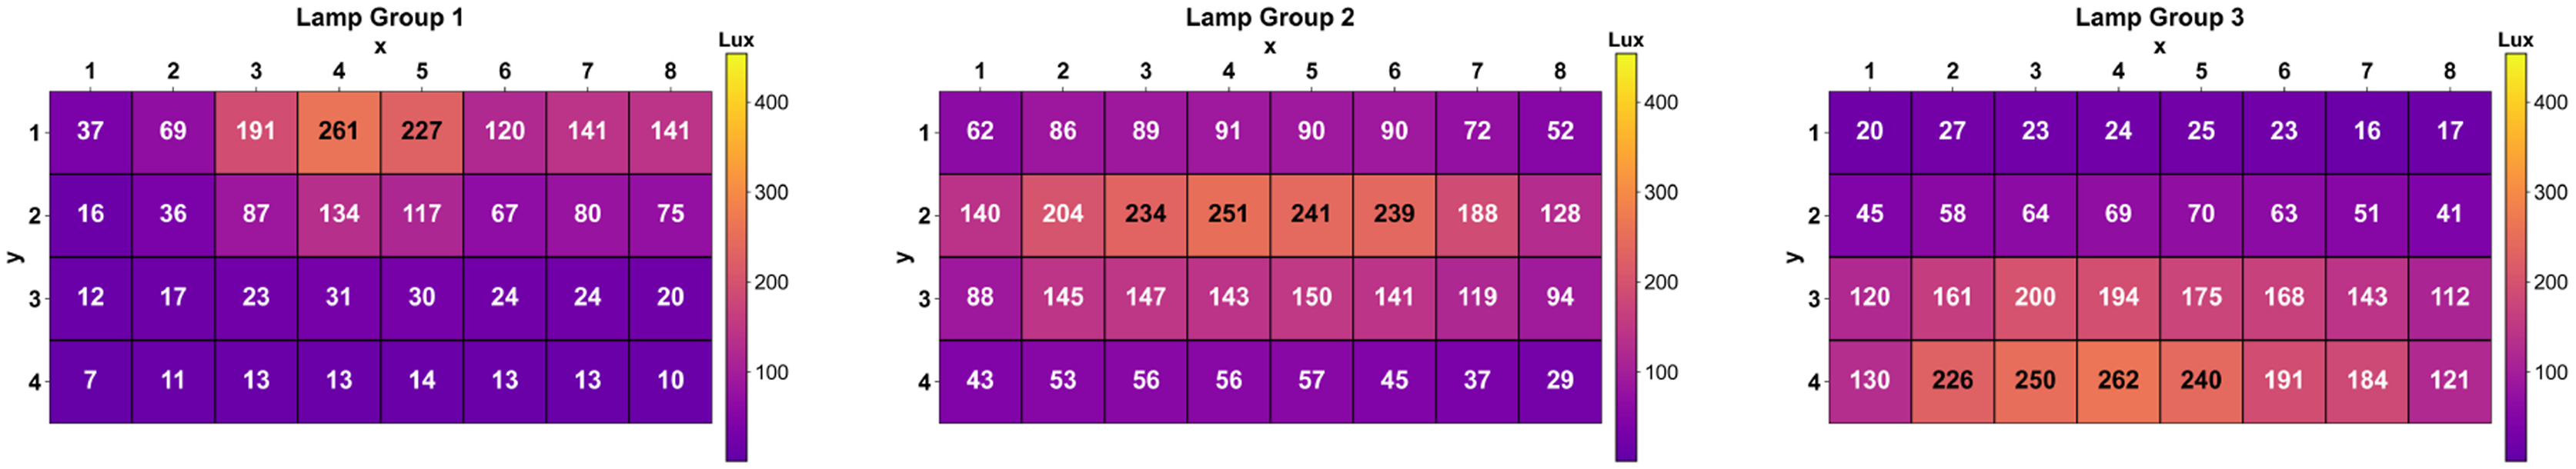
The distribution of artificial lighting illuminance by each lighting group in the SSTK Lab (Figure 9) and TN-7 (Figure 10) shows zonal contribution patterns, consistent with the lighting group divisions in the room layout. In SSTK, each lighting group achieves the highest illuminance in the area surrounding the luminaires within its respective zone, with a sharp decline beyond zone boundaries, resulting in a relatively controlled inter-group distribution contribution. In contrast, in TN-7, inter-group illuminance contributions show greater variations, caused by differences in distance and zoning configuration, differences in luminaire age, and performance degradation, which lead to variations in luminous flux among groups even under identical operating conditions. This effect is further amplified by the location of several measurement points on the north and south sides, which are relatively farther from the main luminaires, resulting in significantly lower illuminance and increased spatial variation compared to SSTK. Illuminance distribution of each artificial lighting group in SSTK. Illuminance distribution of each artificial lighting group in TN-7.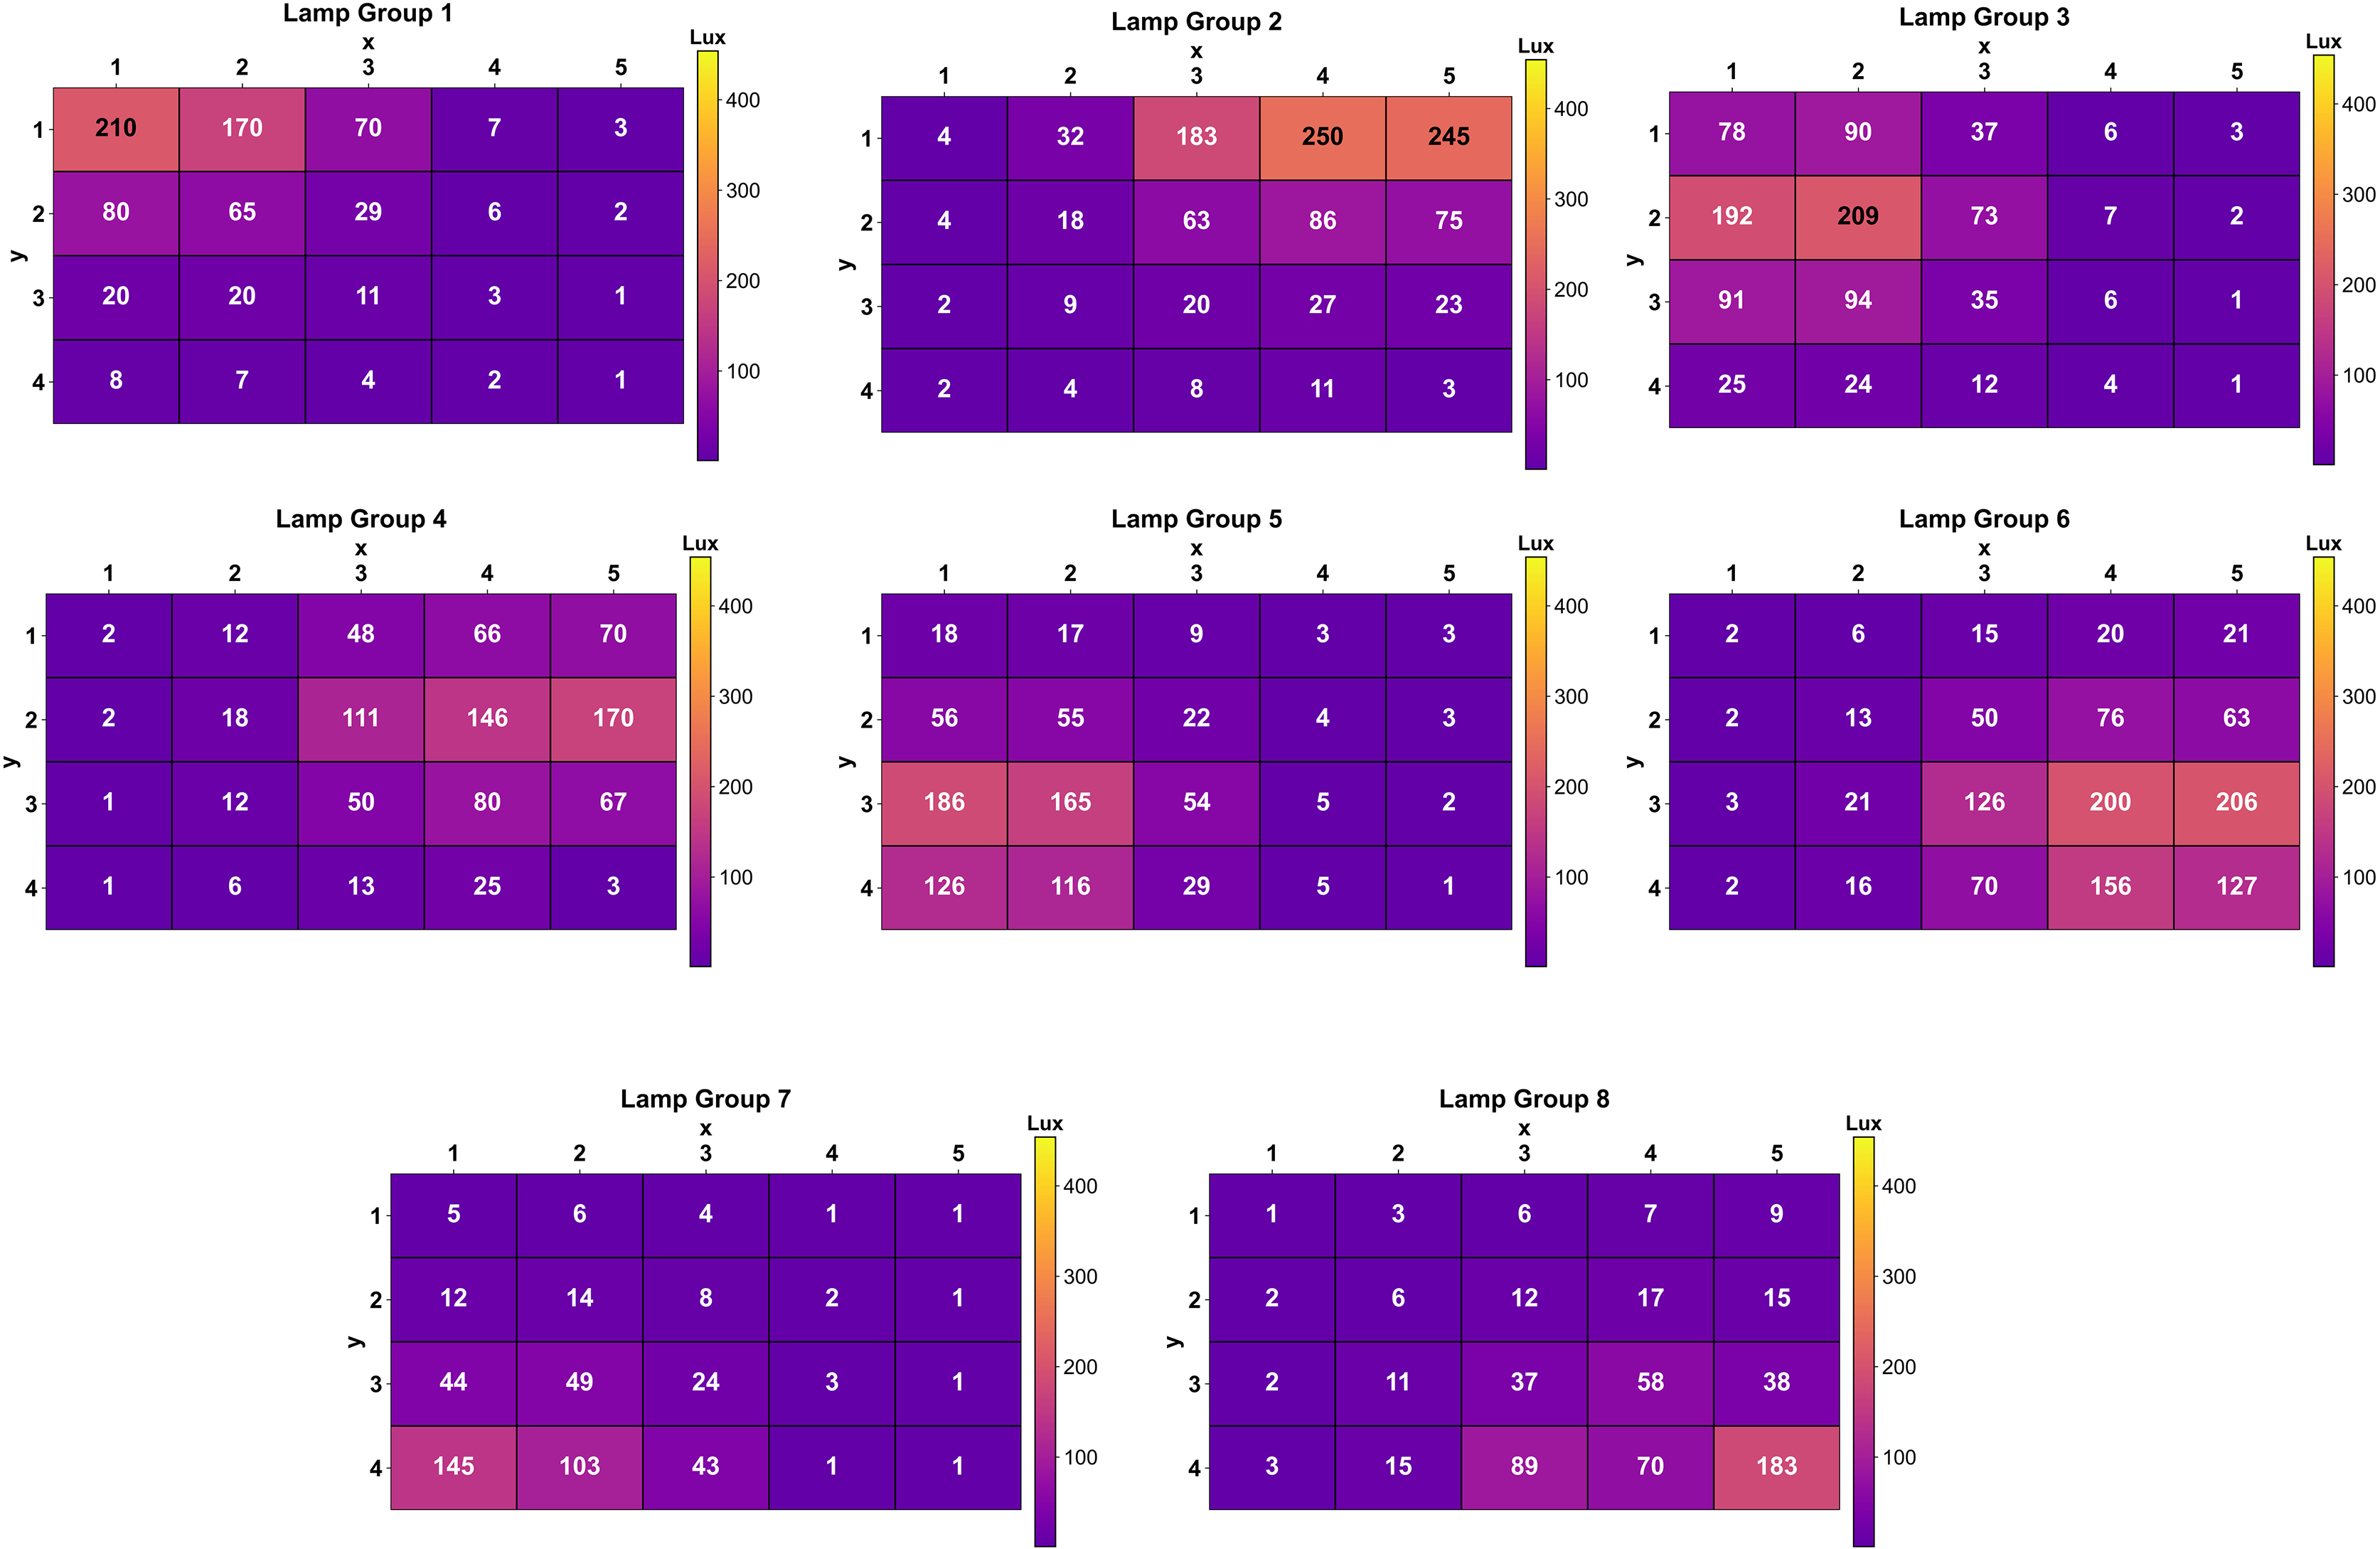
Performance of the soft sensor algorithm
Figure 11 demonstrates the MAE and RMSE distribution maps of the DF-based soft sensor algorithm in SSTK and TN-7. The map demonstrates good predictive performance at most measurement points in both rooms. In the SSTK room, the MAE and RMSE distributions are Distribution of MAE and RMSE of the soft sensor algorithm in (a) SSTK; and (b) TN-7.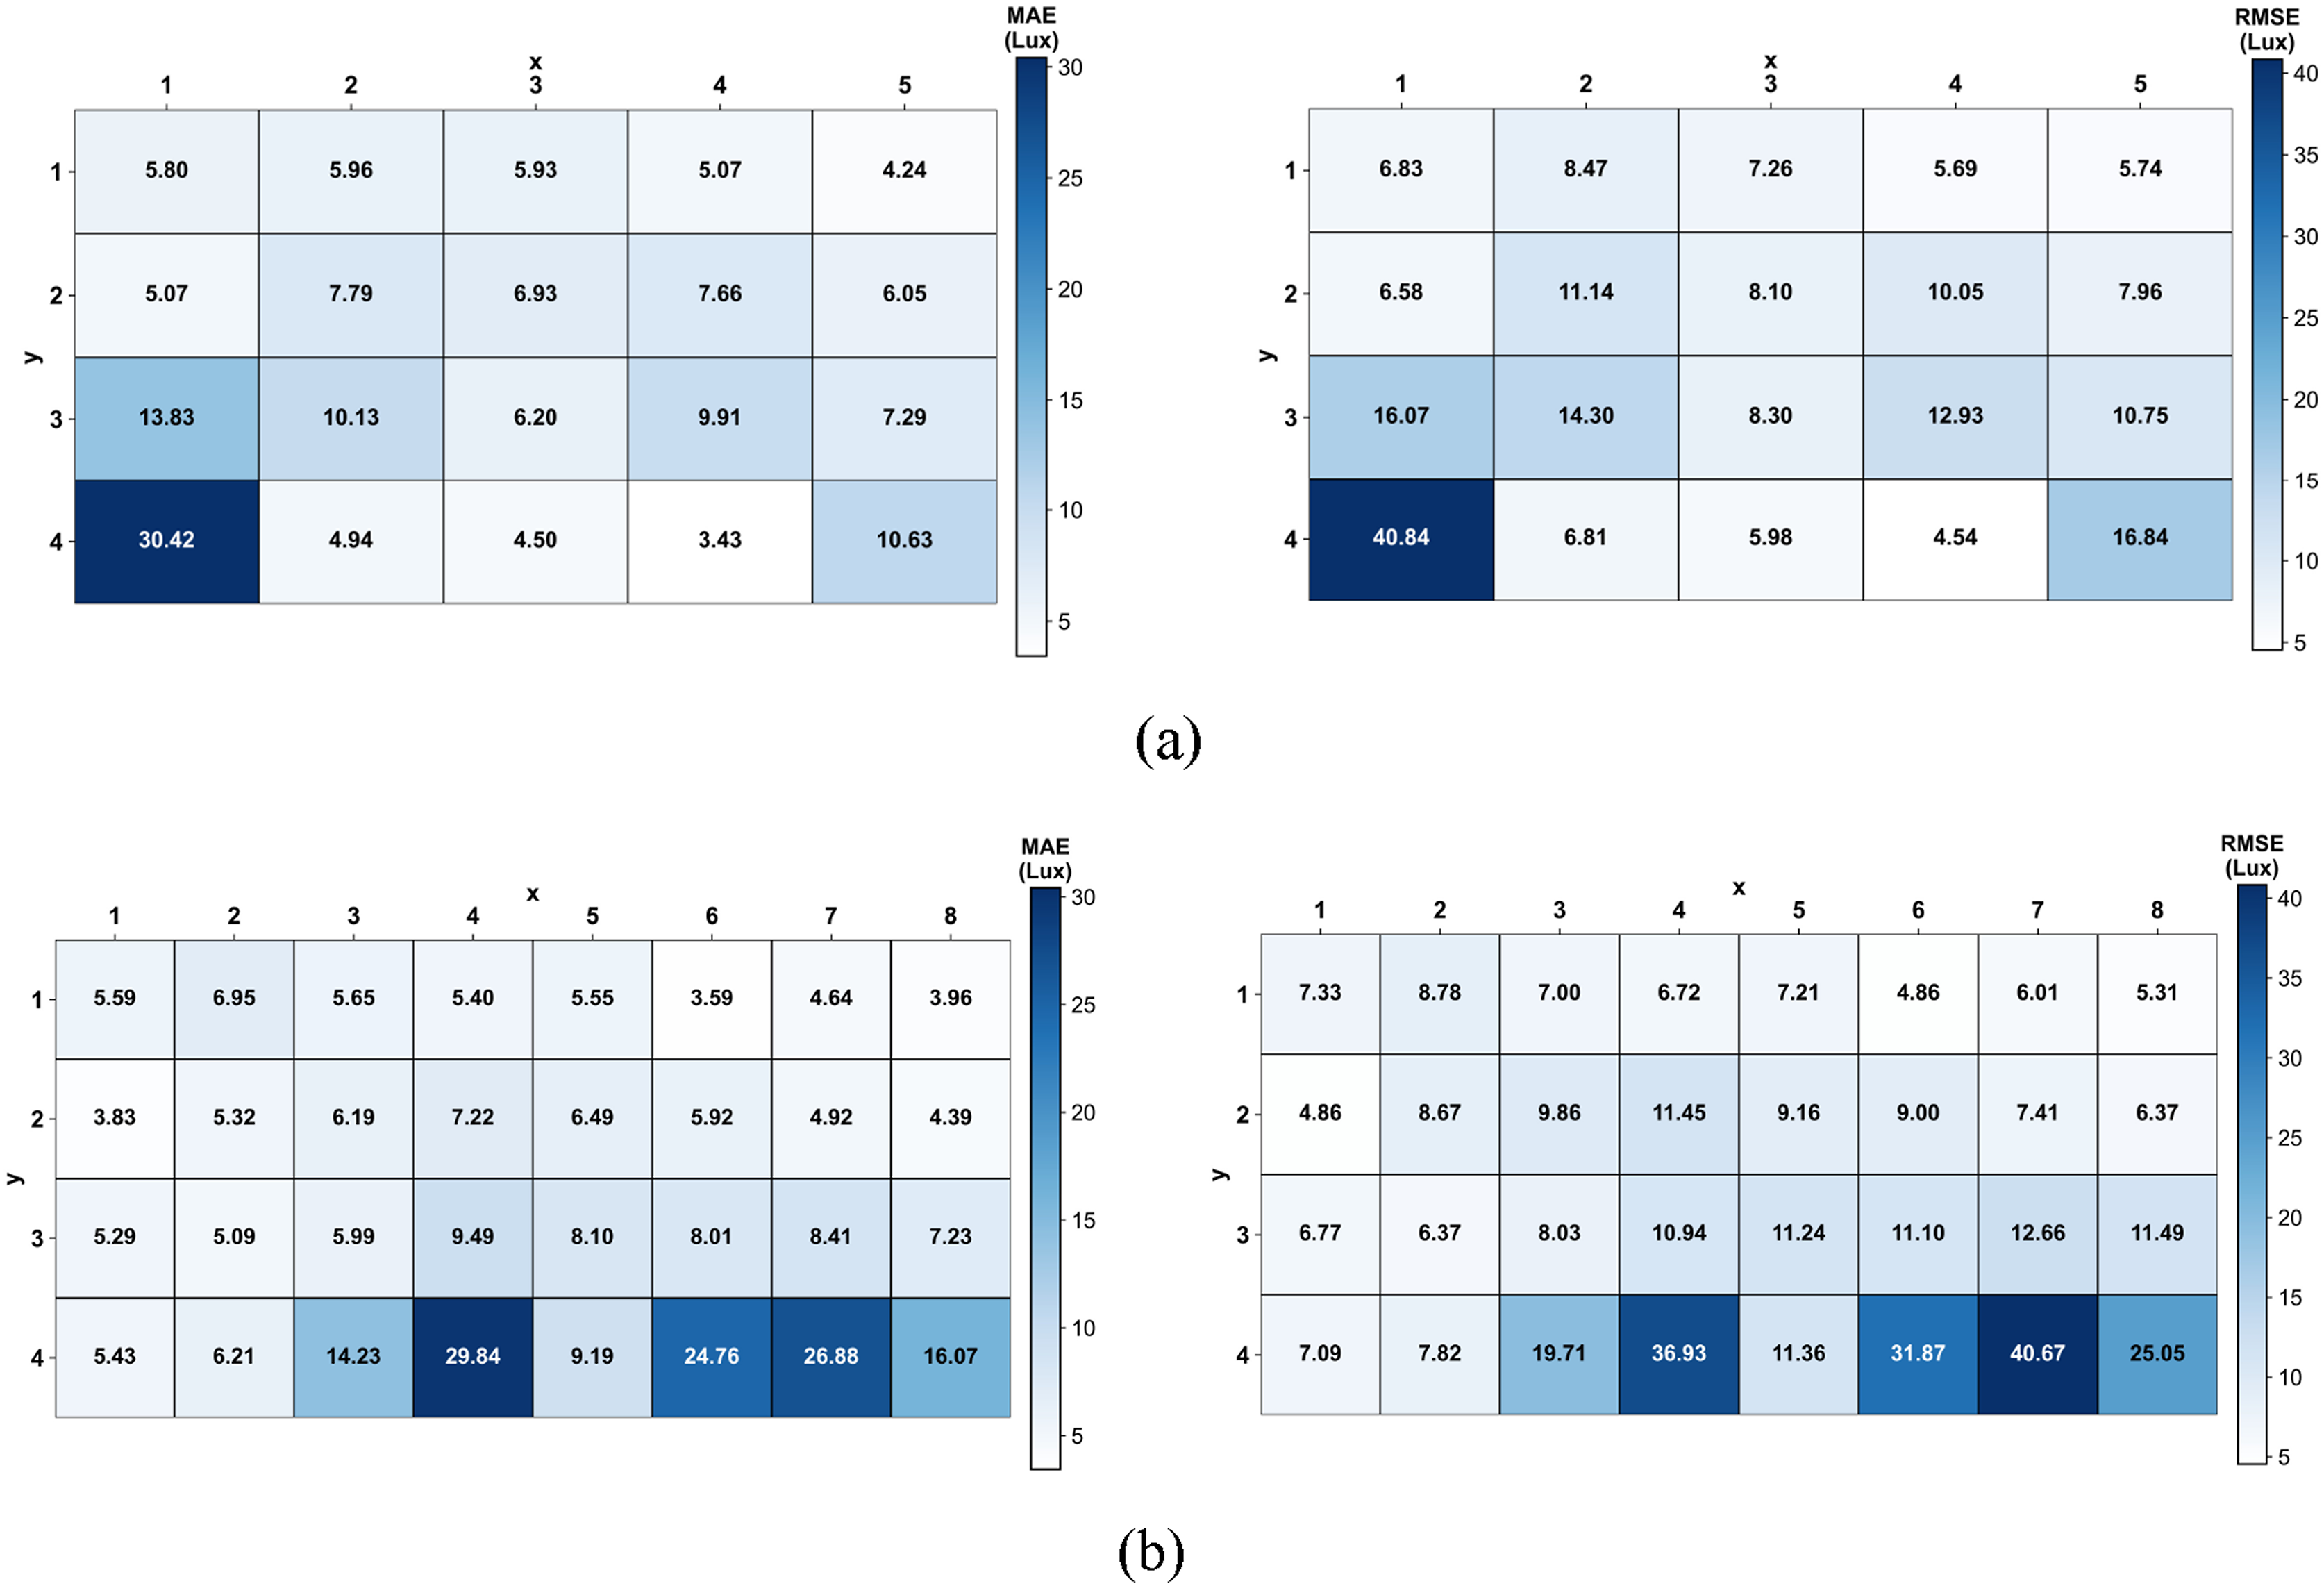
In TN-7, the MAE and RMSE distributions are
Most measurement points in both SSTK and TN-7 have MAE values below 10 lux, indicating that the average prediction errors are relatively small and consistent with the actual measurement results. The error patterns are spatial rather than random and are closely related to the spatial position of the measurement points within the room. These MAE values are far below the working illuminance levels recommended by SNI 6197:2021 and IES guidelines (350–500 lux),35,40 such that a 10 lux deviation represents only 1–3% and is not significant for visual comfort. These findings are consistent with previous studies emphasizing the dominant role of lighting distribution and uniformity over small absolute illuminance variations.41–43
The observed spatially structured error can be interpreted in relation to variations in the characteristics of Daylight Factor (DF) distributions discussed in the previous subsection. Variations in sky conditions alter the intensity and direction of incoming daylight, directly causing fluctuations in DF values at specific measurement points. These fluctuations directly contribute to variations in prediction error in the DF-based soft sensor algorithm, particularly at locations with high daylight sensitivity. This effect is particularly evident at measurement points located near window openings, where direct solar radiation increases prediction errors due to its exclusion from the Daylight Factor (DF) formulation. As a static parameter, DF has a known limitation of not explicitly accounting for dynamic sky conditions such as direct sunlight and sky luminance distribution, especially in tropical climates with frequent clear or partly cloudy skies.44,45
The influence of these variations on prediction accuracy is illustrated in Figure 12 through a comparison between the measured and predicted distributions of natural lighting. In the best-prediction scenario, the DF-based soft sensor algorithm consistently captures the pattern of natural lighting distribution, with spatial gradients and the locations of relatively high and low illuminance values in the prediction maps aligning with the actual measurements. In the worst-case scenario, prediction deviations become larger, particularly at measurement points with high MAE and RMSE values. In the worst-case scenario, larger deviations are observed near window openings under direct solar exposure. Despite these localized errors, the predicted illuminance distribution still preserves the overall spatial pattern, and the resulting performance remains acceptable for practical lighting control applications. Comparison of measured and predicted natural lighting distributions under best- and worst-case scenarios for (a) SSTK and (b) TN-7.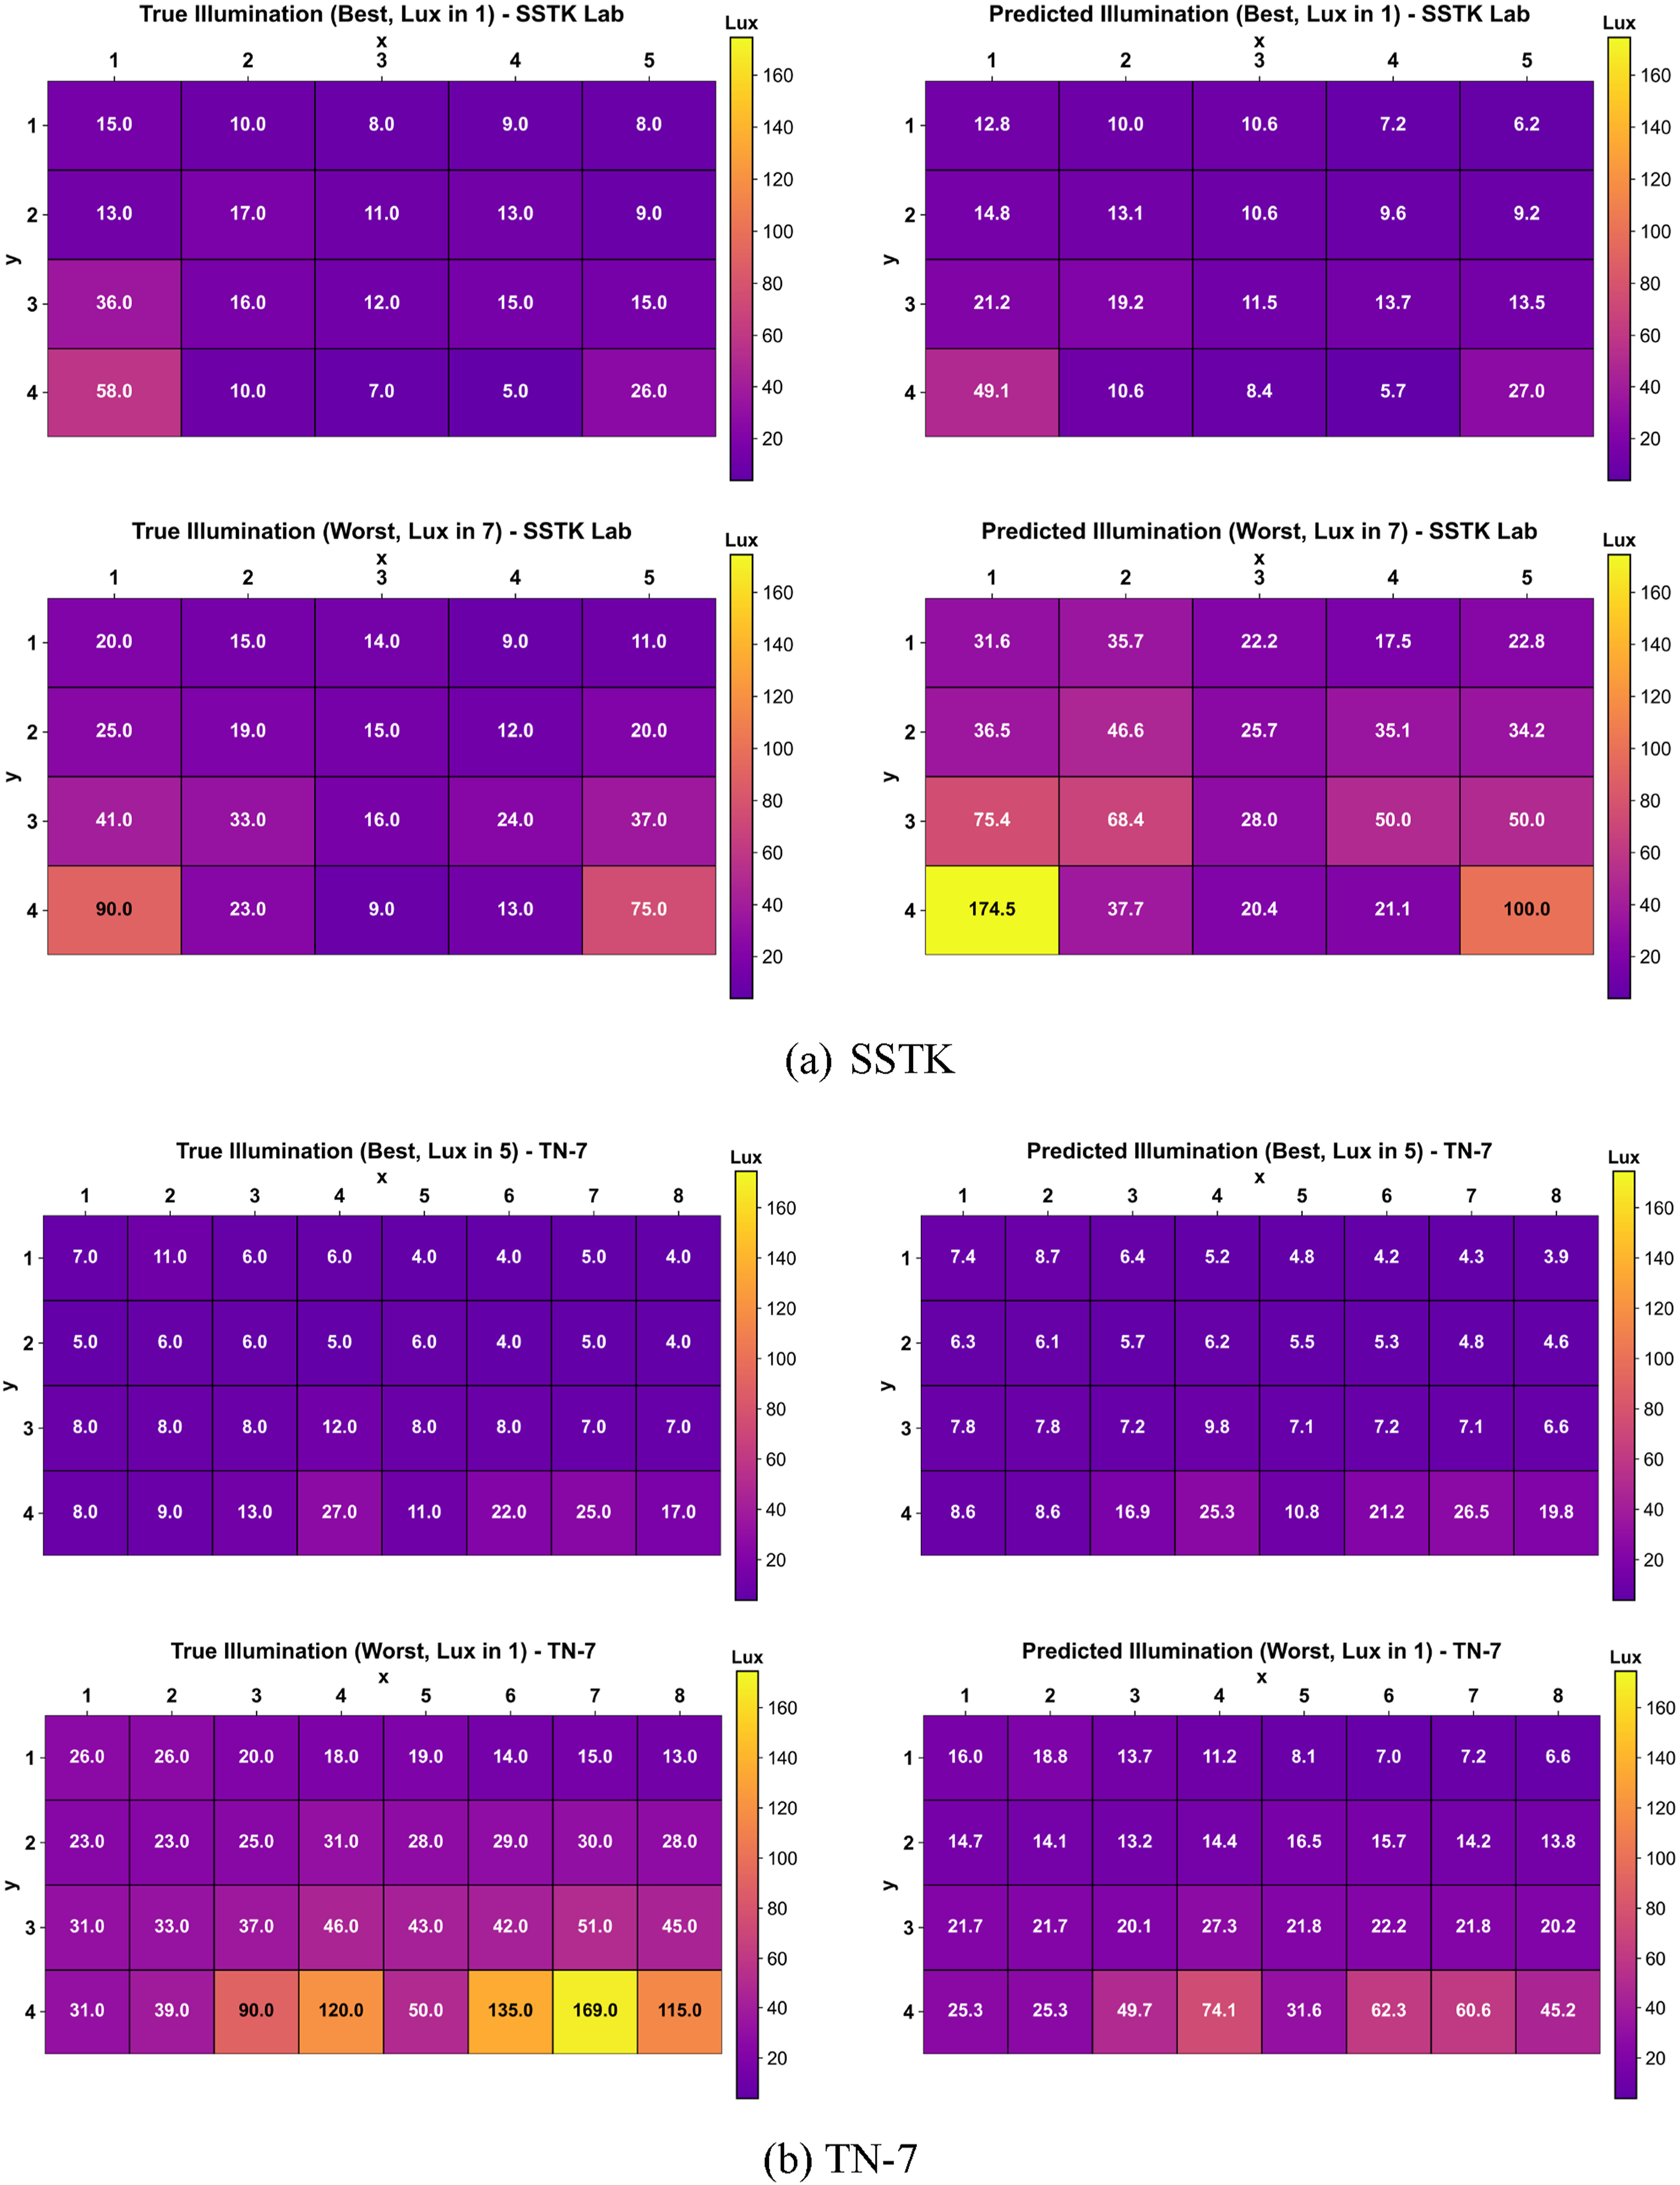
System development
The outdoor illuminance monitoring system was successfully implemented to provide real-time The WN90LP sensor installed on the rooftop.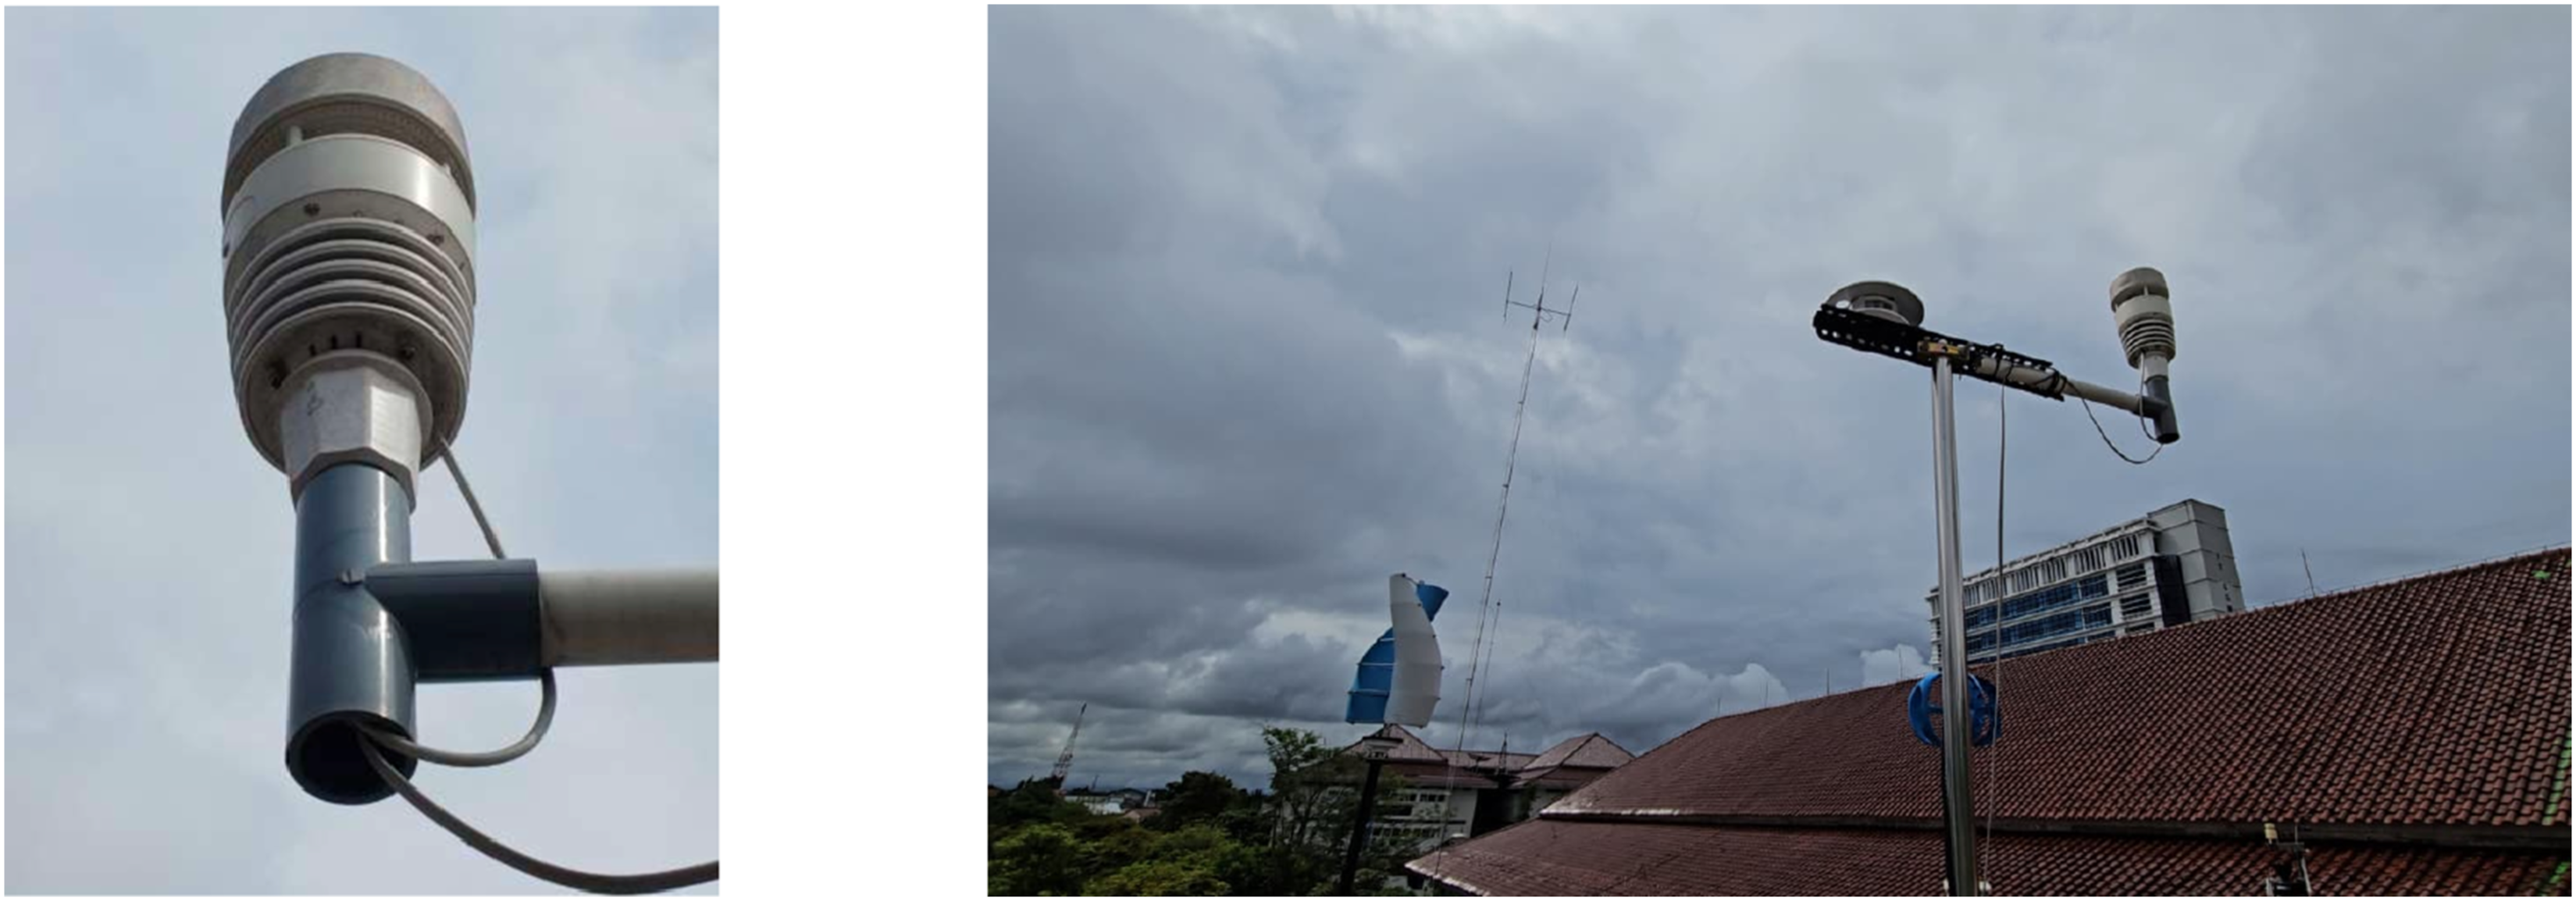
To ensure the sensor’s accuracy across the illuminance range, calibration was performed by comparing the sensor’s reading with a Luxtron LX-1128SD luxmeter, which has higher accuracy ±4.00%. Figure 14 displays the comparison results between the WN90LP and LX-1128SD, where the regression results indicate a very strong linear correlation with the reference luxmeter ( Correlation of measurement results between the WN90LP and LX-1128SD.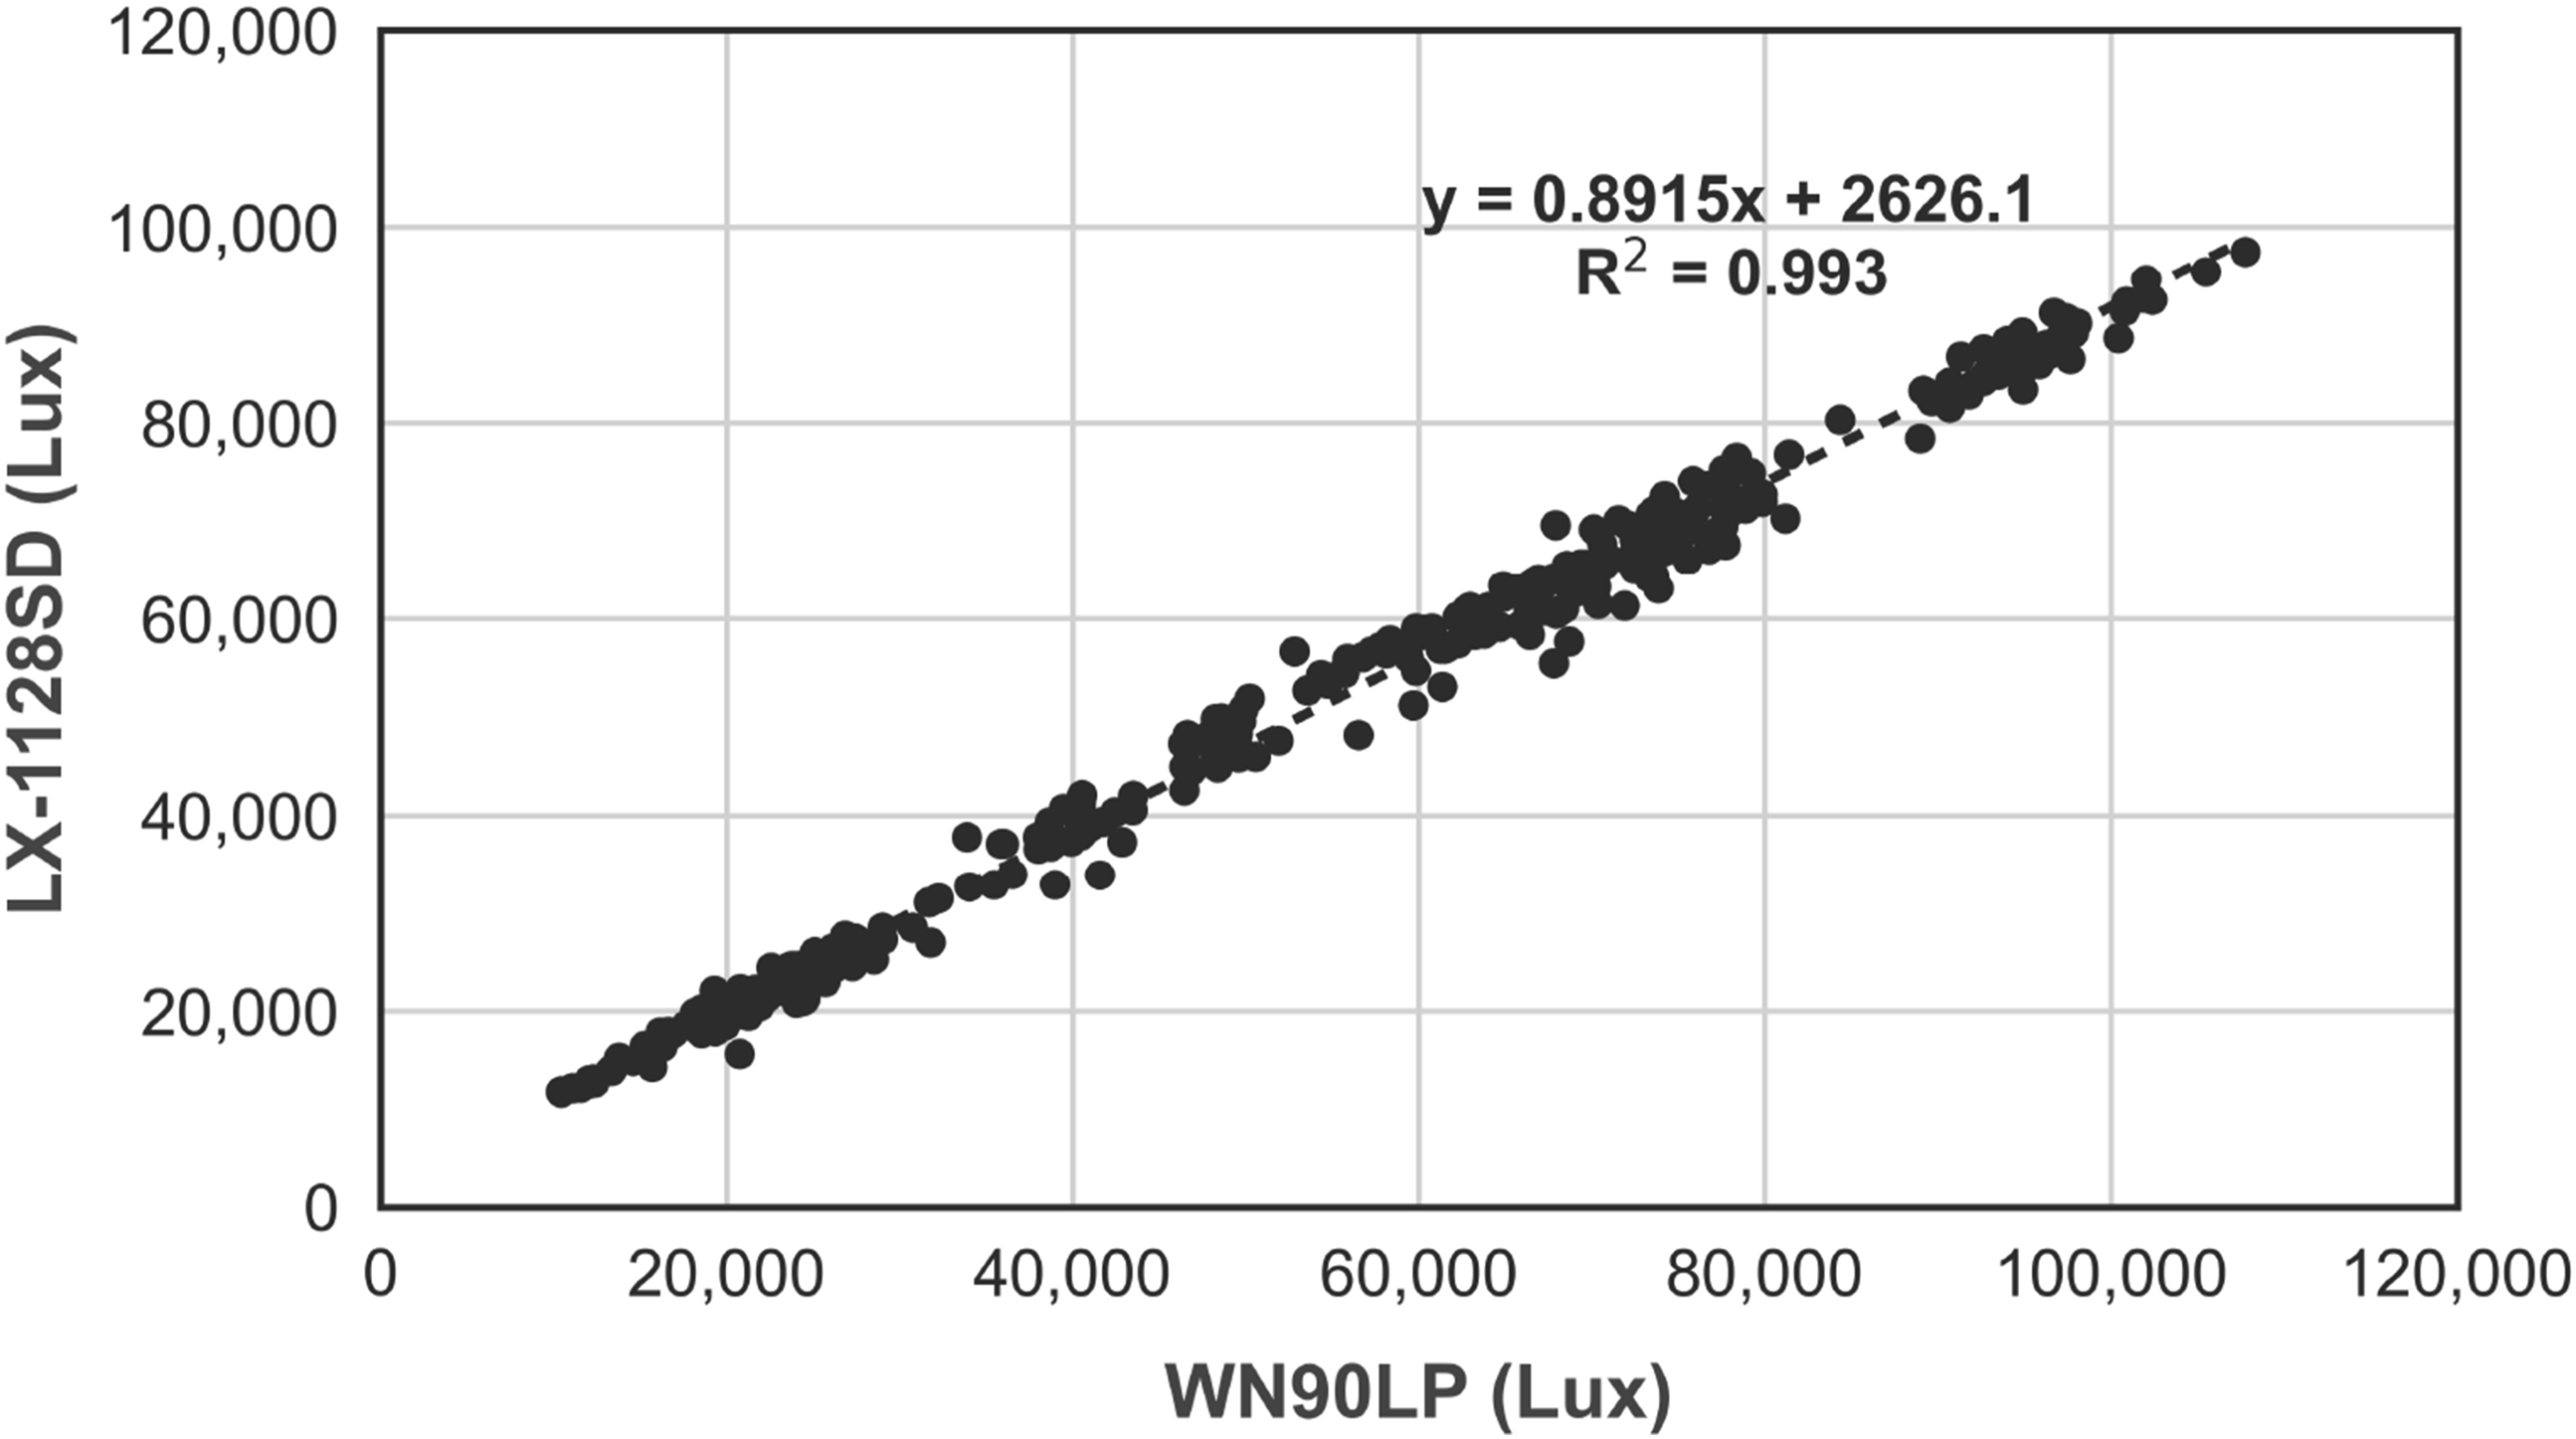
Photographs of the smart switch circuitry and its installation in the SSTK room are shown in Figure 15. The device was successfully implemented as a microcontroller- and Internet of Things (IoT)-based lighting control and actuation system integrated with the BEMS platform. ON/OFF control of lamp groups was implemented via a relay module driven by a relay driver, providing safe isolation between the low-voltage logic circuit and the AC power circuit. The microcontroller executed control logic based on the lighting set point and predictions from the soft sensor, while current sensors installed on the supply line of each lamp group enabled continuous verification of actual ON/OFF conditions as well as estimation of power and energy consumption. This study limits the control implementation to ON/OFF operation to ensure robustness and simplicity in real-time BEMS operation. However, although the proposed DF-based soft sensor can be expanded to support proportional control strategies, this approach does not fully utilize the dimming capabilities of modern LED systems, which are known to improve energy efficiency and visual comfort.46,47 The entire system receives a stable DC supply from an internal power module that converts AC mains voltage to the operational level required by the control circuitry. Smart switch implemented in the study showing (a) its block diagram; (b) hardware components inside the equipment; and (c) its installation in SSTK room.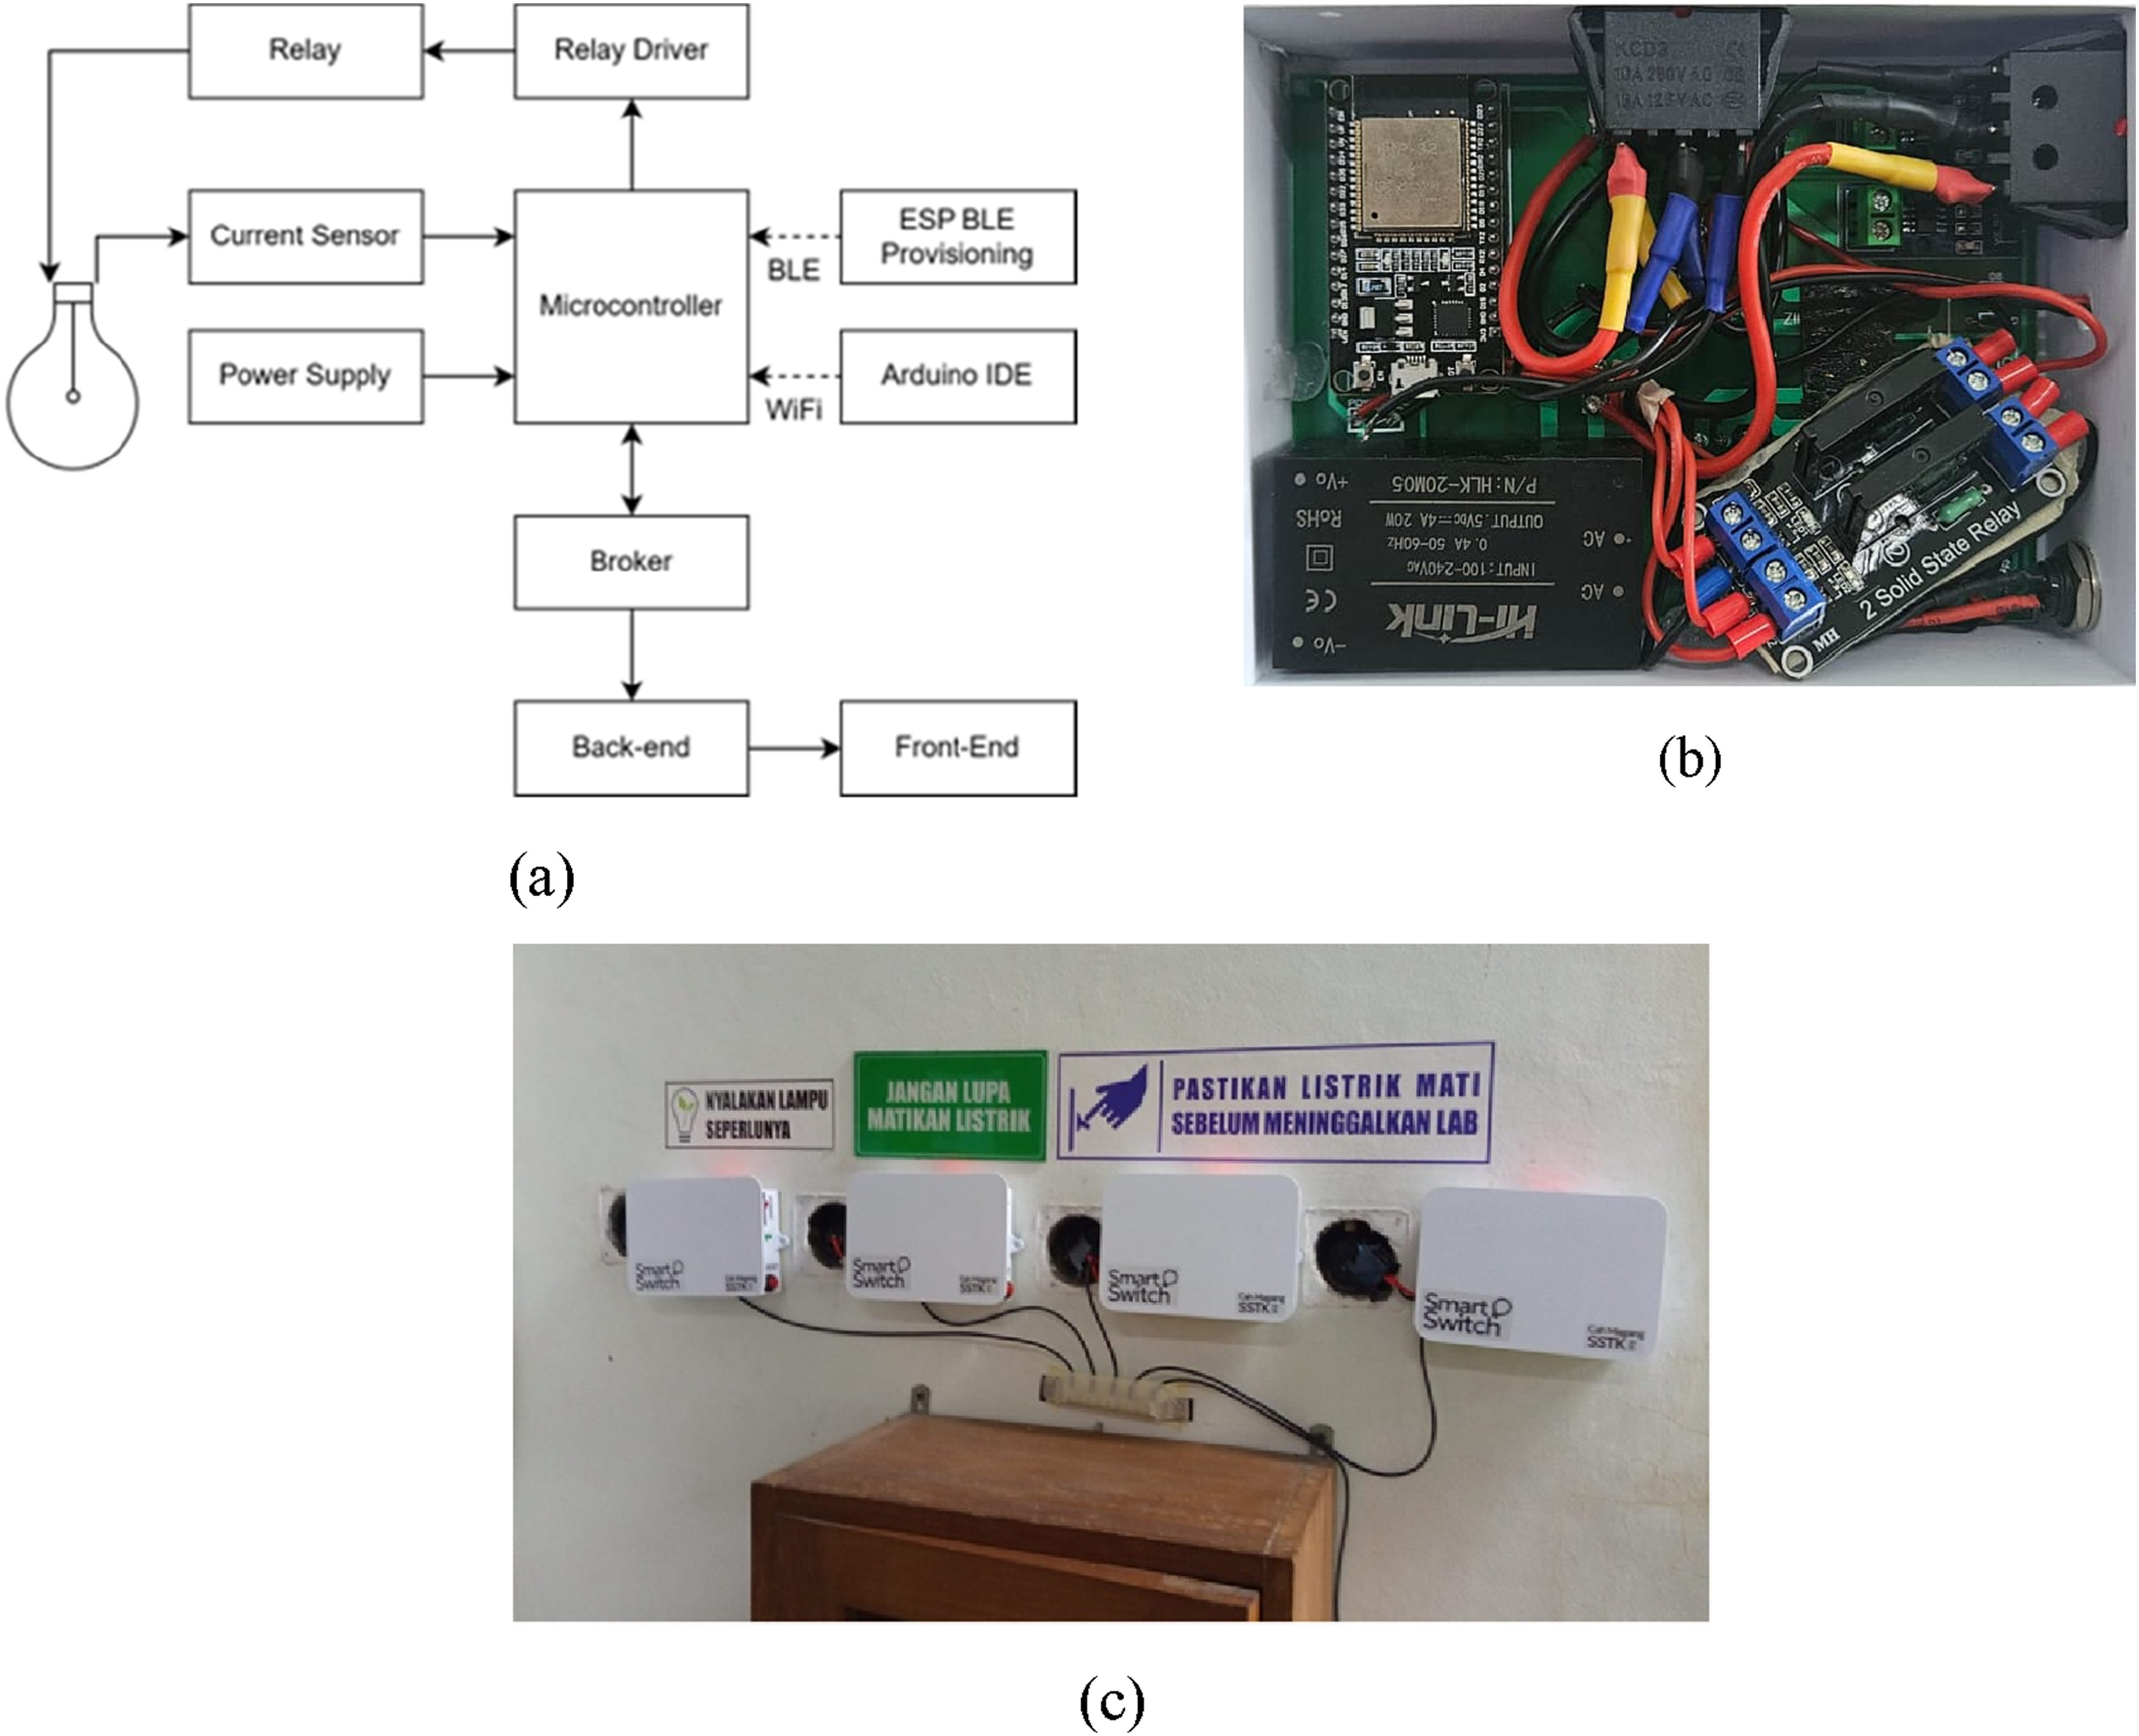
WiFi connectivity enabled bidirectional data exchange between the smart switch and BEMS via an MQTT broker. Control commands based on the soft sensor prediction results were transmitted from BEMS to the smart switch to control lamp group status, while actual ON/OFF status and current data were sent back to BEMS for monitoring. Communication operated continuously without significant connection loss during testing. Meanwhile, BLE communication was used during the initial configuration stage for setting network parameters such as set point, SSID, and password.
Figure 16 shows an example of the system output display for indoor lighting condition control. These data represented the integration results of the outdoor illuminance monitoring module, the prediction algorithm for Output display of the lighting control system in BEMS displaying (a) GUI of outdoor illuminance monitoring (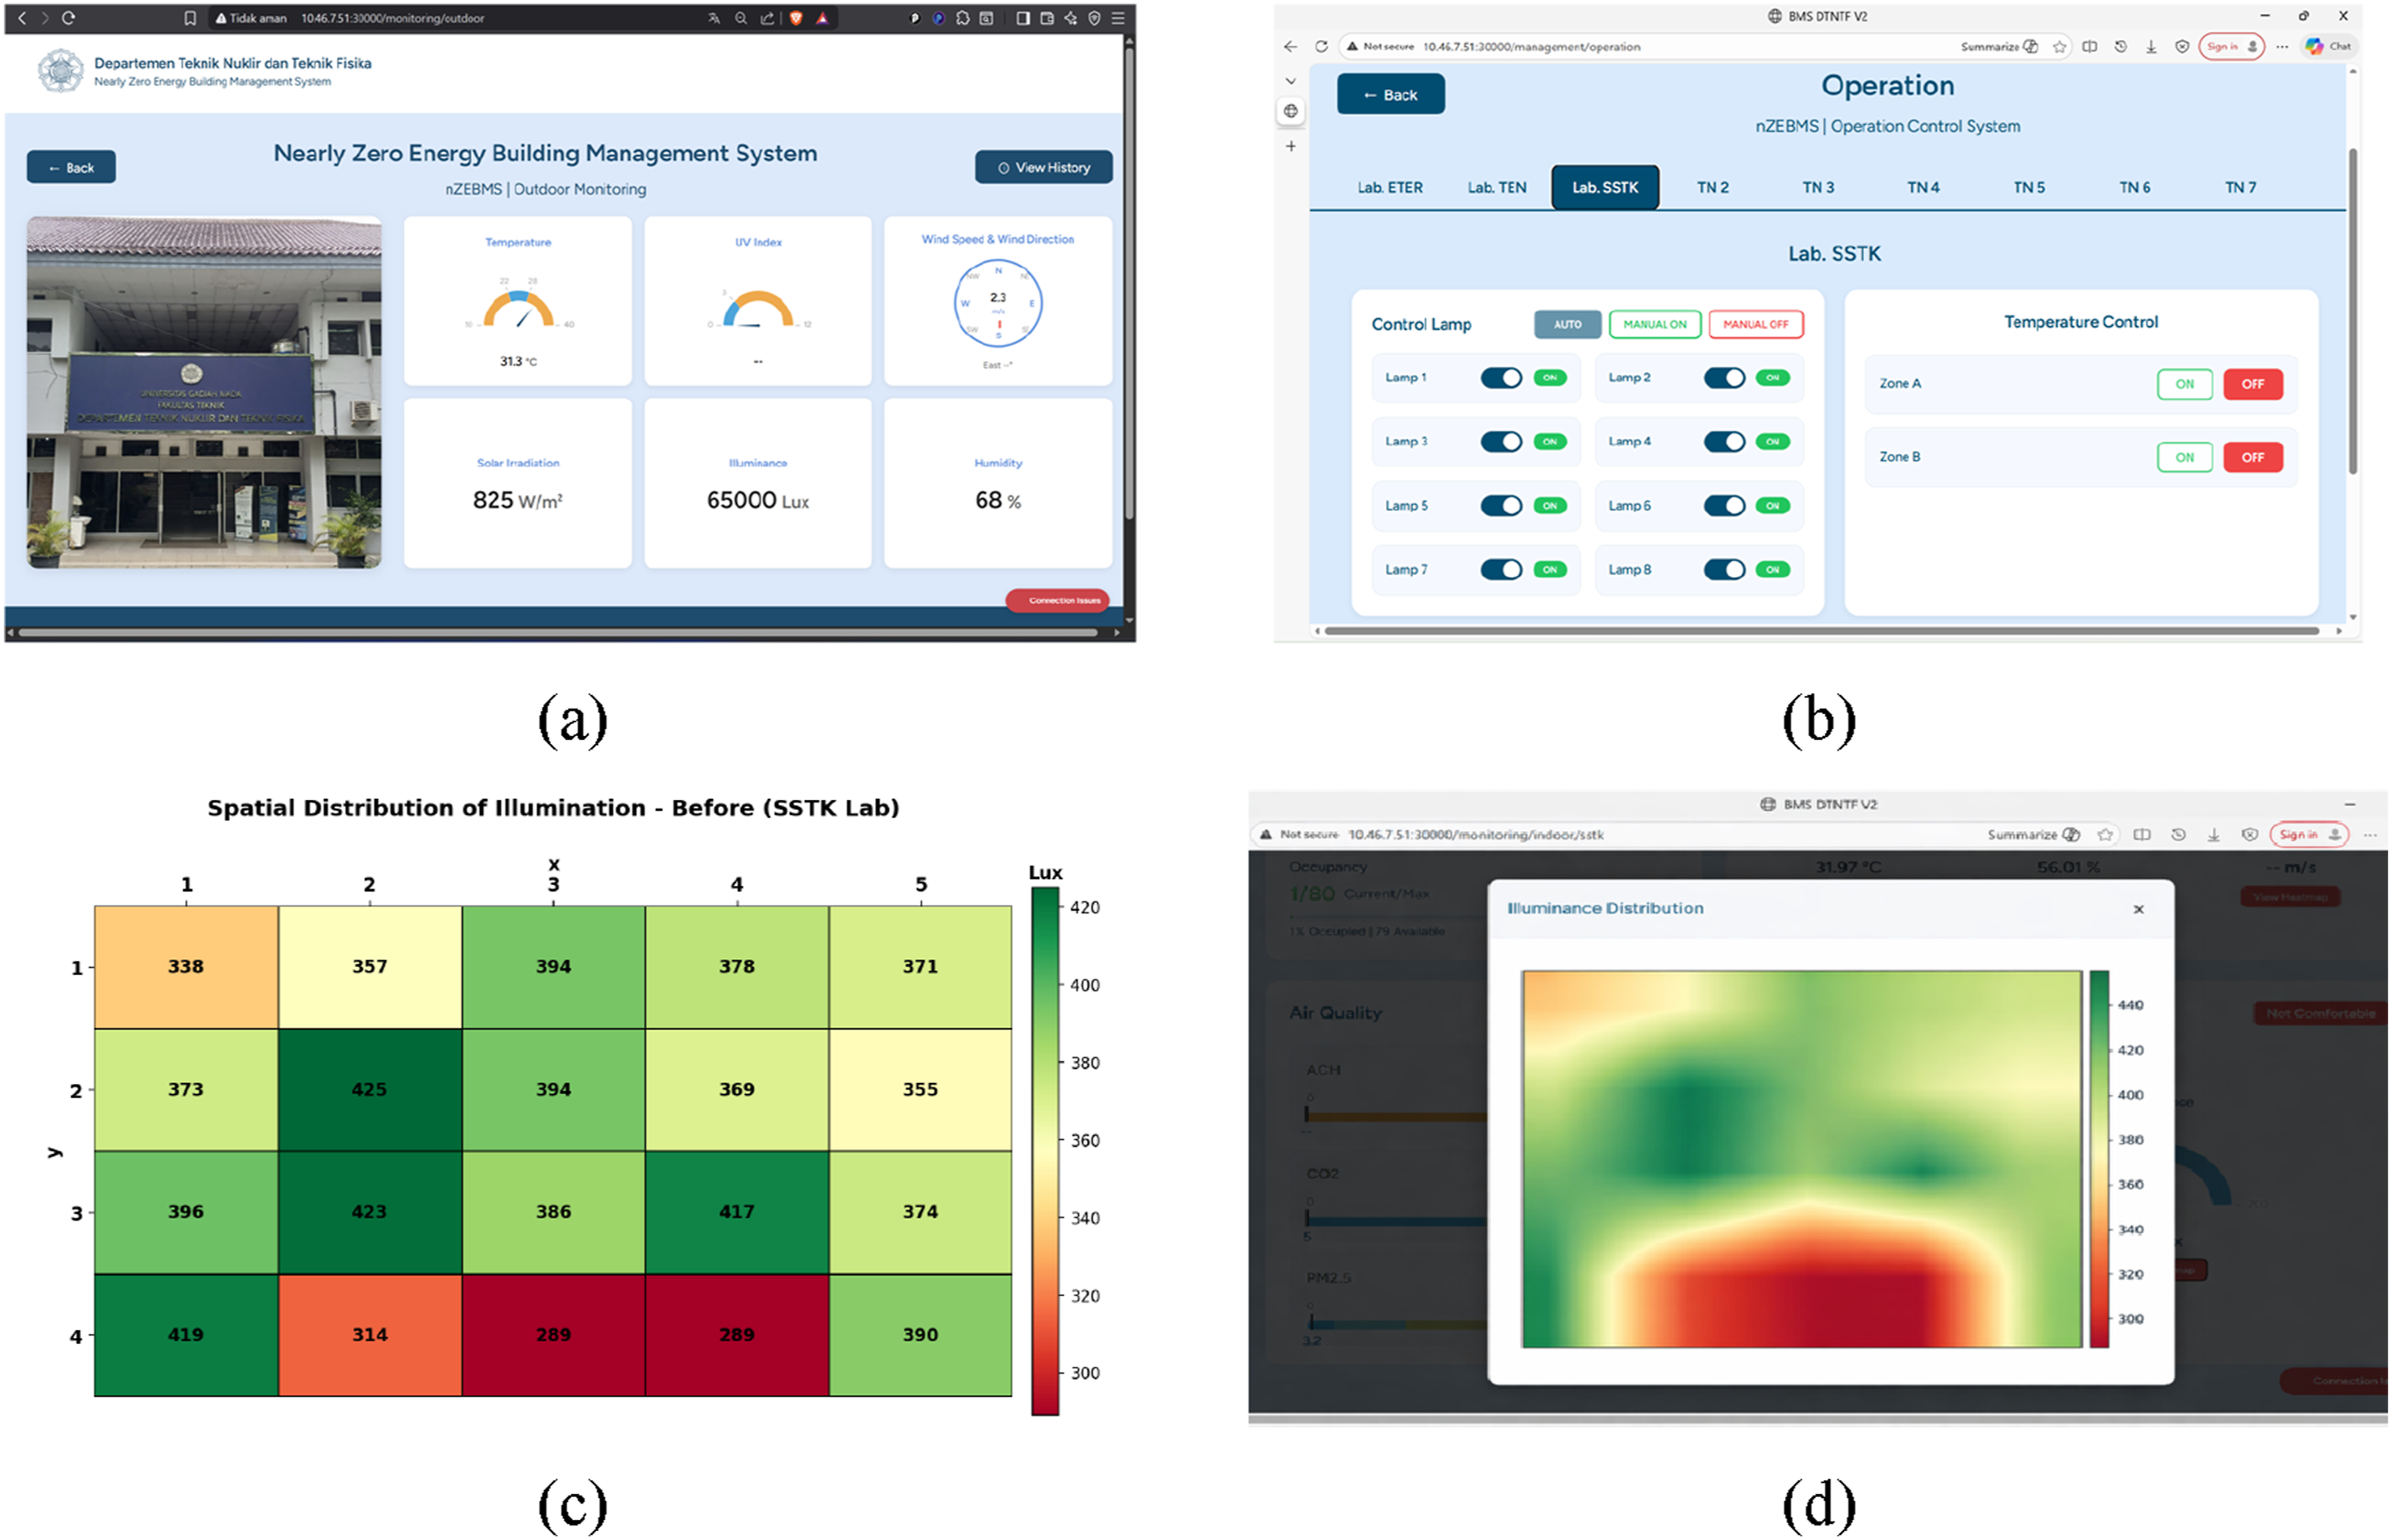
System evaluation
The performance of the monitoring system in the DF-based soft sensor was assessed by evaluating its accuracy, real-time capability, and reliability. System accuracy evaluation was conducted using MAPE under various combinations of active lamp groups and outdoor illuminance variations between 10,000 and 80,000 lux. Test results showed MAPE values of
The system’s real-time characteristics were assessed by measuring data acquisition, communication, and algorithm computation duration: Distribution of DF-based soft sensor delay test results.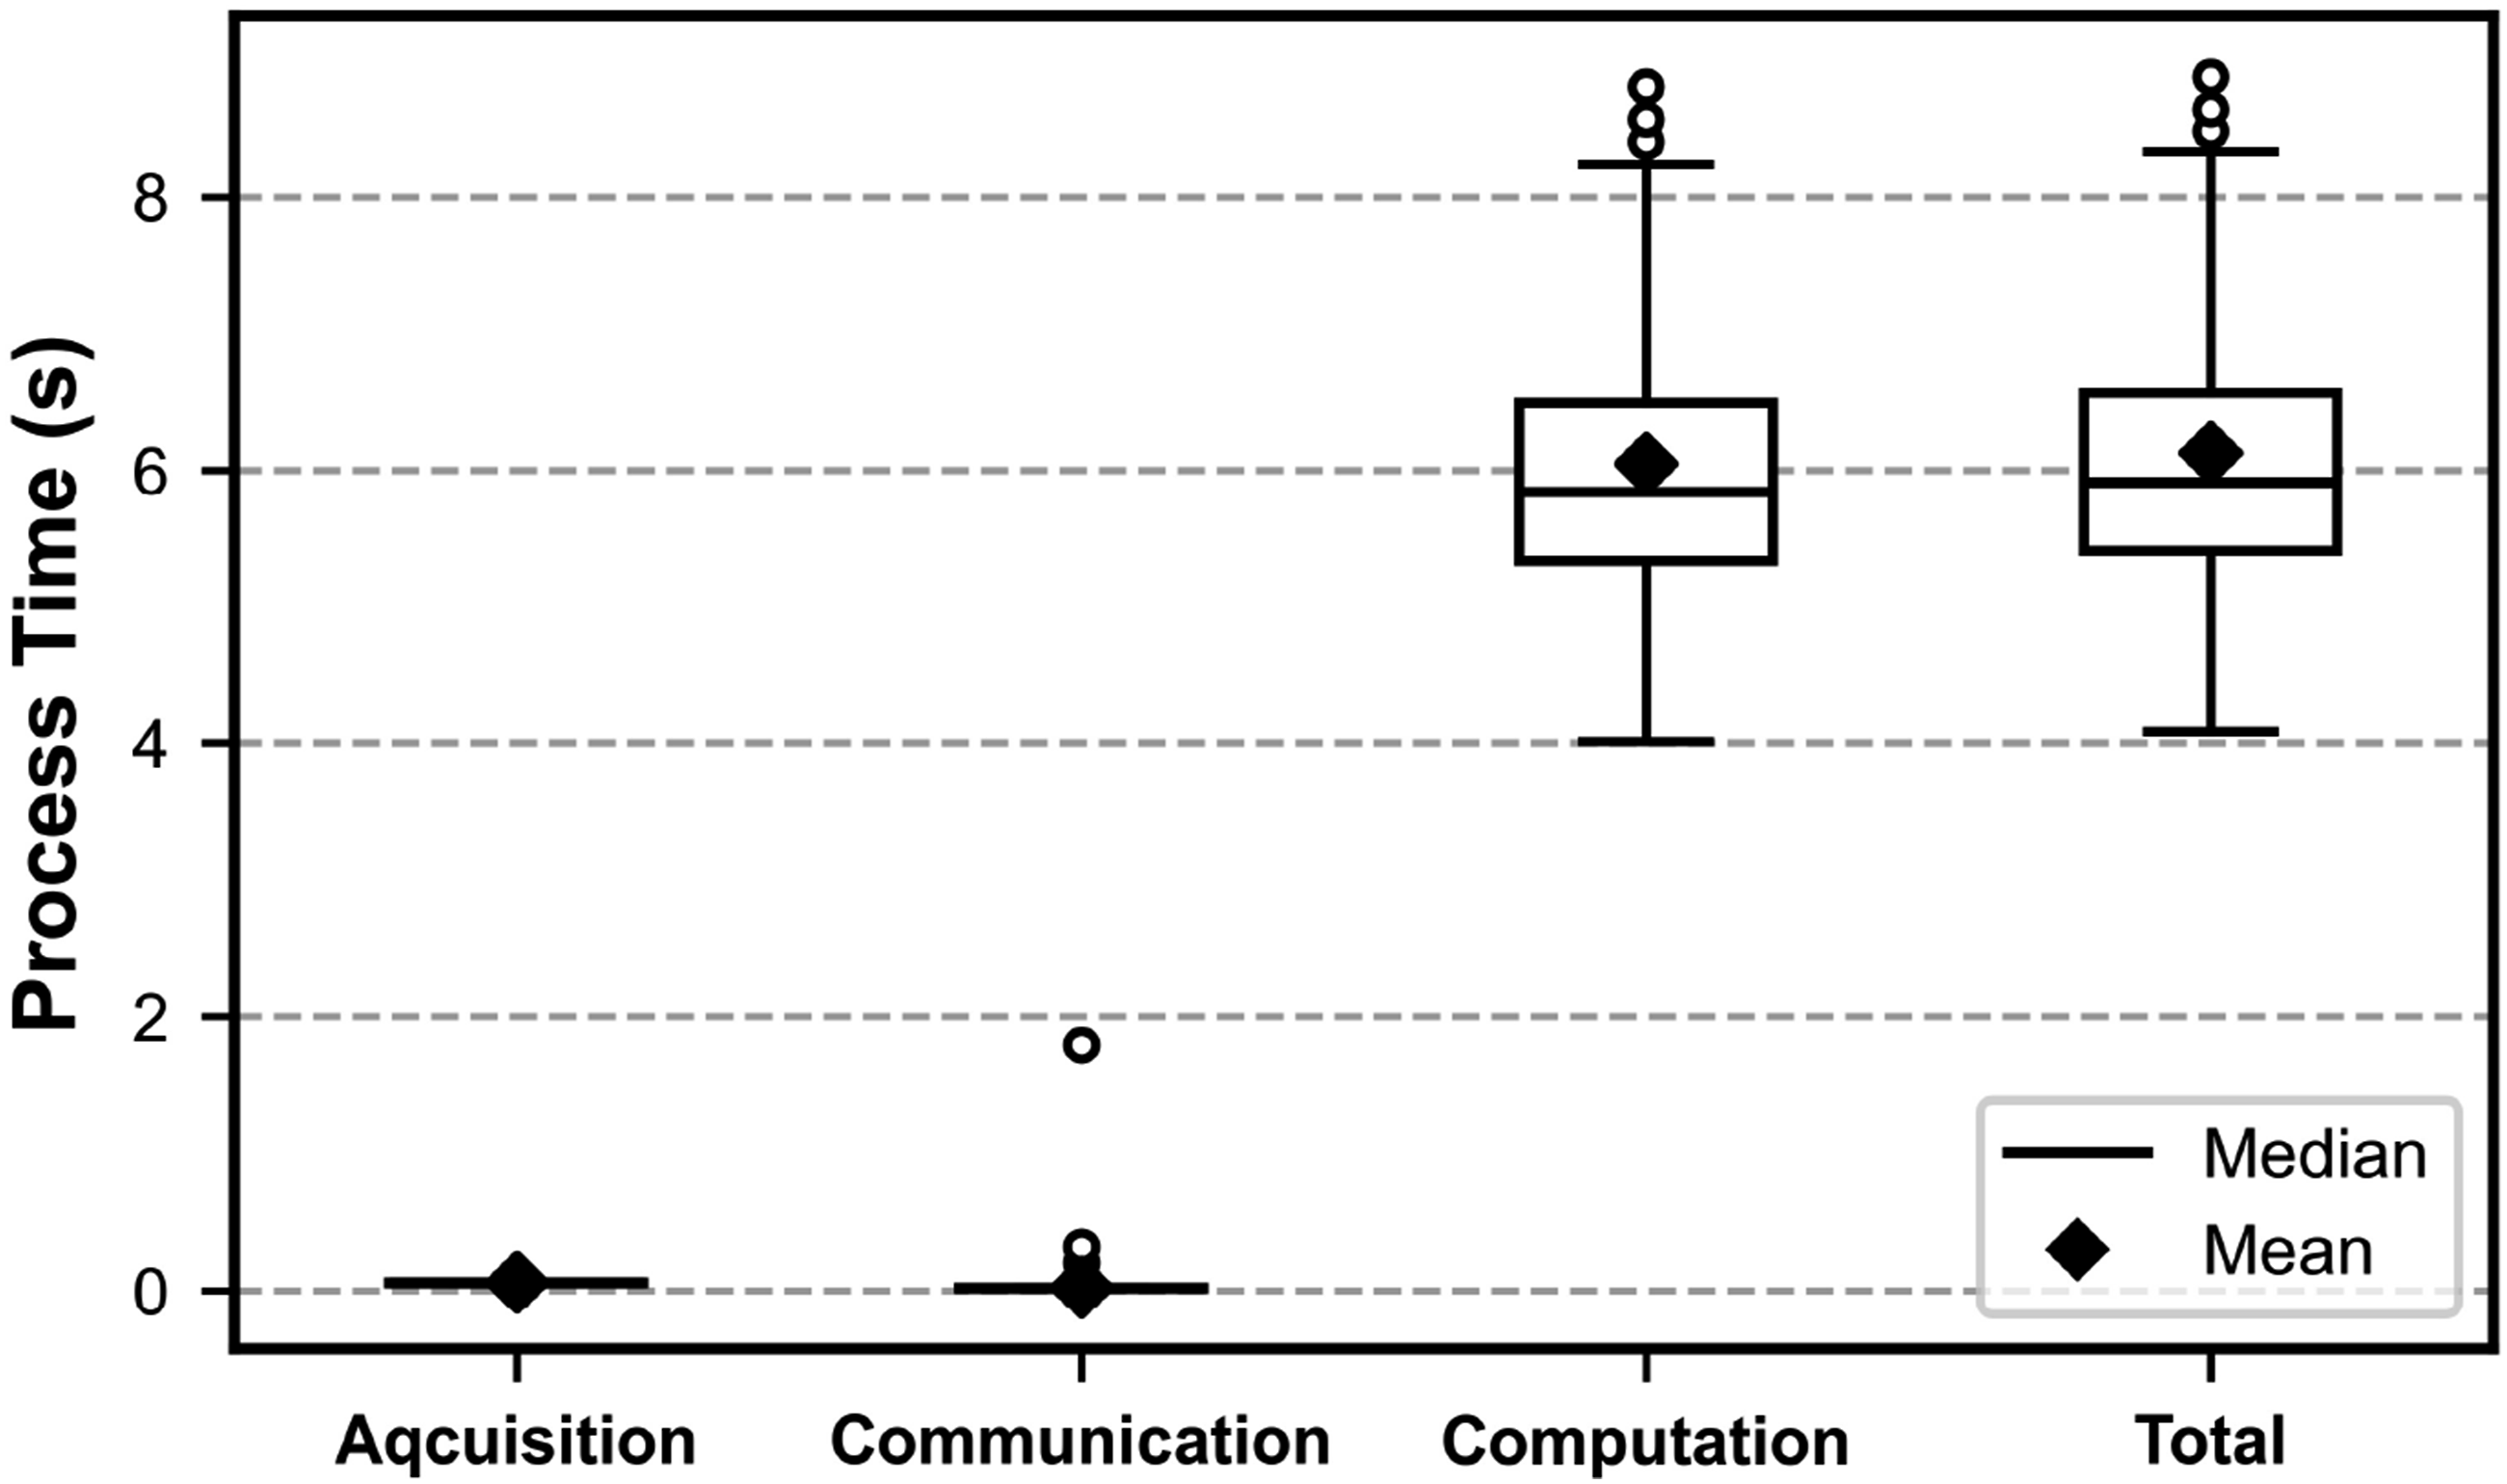
Meanwhile, reliability testing was performed over eight consecutive time intervals with a total of 480 data transmissions from the outdoor illuminance sensors, with all data successfully received and stored in the BEMS database (480/480, success rate = 100%). No data loss was detected (packet loss = 0%), indicating the stability of LAN-based communication and integration with MySQL under real operational conditions. This reliability is crucial in demonstrating that the implemented communication system is capable of supporting continuous operation without performance degradation during the measurement period.
Functional testing of the smart switch, including ON/OFF control, feedback transmission, system configuration (WiFi and BLE), and battery monitoring, demonstrated consistent and reliable operation. All test scenarios achieved a 100% success rate across multiple repetitions, indicating stable bidirectional communication, accurate control execution, and reliable system performance under real-world operating conditions. The 100% success rate confirms that the hardware and communication components are sufficiently robust to support the implementation of the DF-based soft sensor within the BEMS framework.
The operational test results could be indicated by the delay time under relay ON and OFF conditions. The smart switch delay time was calculated as the interval between command issuance and receipt of lamp status feedback on the BEMS dashboard. The test results conducted during working hours indicated that the feedback delay time was consistently higher than the control delay time under both conditions. The command delay for turning the lights ON was 1.8 ± 1.0 s, with a maximum of 4.5 s, while for turning the lights OFF was 1.6 ± 0.7 s, with a maximum of 3.3 s. The feedback delays were 3.4 ± 0.9 s for the ON condition and 3.5 ± 1.3 s for the OFF condition, with maximum values of 6.1 s and 9.0 s, respectively. This variation might be attributed to the bidirectional communication mechanism, which includes device status reading, internal processing, and retransmission via MQTT to the BEMS, whereas control delay time involves only instructions to the actuator. Despite these variations, the response time remains within a few seconds, acceptable for building automation systems that do not require hard real-time control. 50
The measurement results of smart switch current consumption for the two conditions of relay OFF and relay ON, show that during the OFF condition the average current was 95.22 ± 2.04 mA, while it increased to 164.39 ± 1.91 mA during the ON condition. This increase was due to additional energy required to maintain relay coil activation. During the measurement period, the current in both conditions remained relatively stable, with no significant fluctuations, indicating stable device operation. Finally, the relay condition affected the smart switch operating duration in one battery cycle. When the relay was ON, the system operated for 10.61 h, whereas when the relay was OFF, the duration increased to 27 h due to the continuous energy consumption of the relay coil. The voltage drop of the Lithium 18,650 battery during the final discharge phase occurred more rapidly due to limitations in electrochemical reactions that maintain voltage stability.
Soft sensor applicability
The DF-based soft sensor developed in this study is highly suitable for application in existing buildings since the algorithm was constructed based on measurements of actual building conditions. This approach allows the model to represent the building’s actual spatial characteristics, including geometry, surface reflectance, opening distribution, and environmental conditions. By using empirical data as the training basis, the system can accommodate actual lighting variations, producing illuminance estimates that are representative of the building’s operating conditions.
As for new buildings, the approach can be implemented at the design stage using daylighting simulation data, enabling the soft sensor algorithm to be developed prior to construction. A practical workflow would be as follows: (1) develop a building model and perform daylighting simulations; (2) derive the DF matrix from simulated illuminance data; (3) integrate real-time outdoor illuminance as model input; and (4) deploy the prediction and control algorithm within the BEMS. This approach enables adaptation to different geometries and layouts without extensive in-situ measurements. However, the use of simulation data may produce certain uncertainties, especially in areas near windows that receive direct sunlight. The issue may occur given that daylighting simulations generally calculate DF based on overcast sky conditions, thus the light distribution results are more uniform and do not fully represent clear-sky conditions with direct sunlight components. Consequently, differences between the estimated and actual conditions may occur in perimeter zones of the building. These localized discrepancies characterize the inherent limitation of the DF framework under non-overcast sky conditions, particularly in tropical environments with significant direct solar components. Needless to say, these deviations can be effectively mitigated through targeted calibration at selected perimeter points, allowing the DF-based model to better represent local lighting conditions without modifying the underlying modeling framework.
The performance of the proposed system is influenced by building-specific characteristics such as room geometry, window orientation, and façade configuration, which affect daylight distribution patterns and consequently the accuracy of the DF-based model. Despite these limitations, the DF-based soft sensor remains applicable for practical implementation, as the overcast sky assumption does not necessarily reduce the applicability of the model, but rather emphasizes the importance of integrating architectural design strategies and control systems to limit direct sunlight penetration. Optimization can be achieved through façade design and shading devices such as horizontal or vertical shading, light shelves, spectrally selective glazing, and adjustment of the window-to-wall ratio to reduce direct solar gains without eliminating diffuse light. In addition, spatial zoning arrangements that place primary work areas in the central (core) zone and use perimeter areas for secondary functions may increase illuminance stability in visually critical areas. Integration with adaptive control systems, such as automated blinds and dimmable LED lighting, may enable real-time compensation for light fluctuations, thus deviations remain within acceptable operational limits even under clear-sky conditions. Future studies shall investigate the system by incorporating these optimization strategies.
From a systems perspective, the DF-based soft sensor should be seen as an operational estimation framework for maintaining illuminance within a certain performance range, rather than as an absolute point-estimation model with high precision at every location. In adaptive lighting applications, maintaining illuminance within a target range is functionally more relevant than minimizing lux differences at highly dynamic local points. The study results demonstrate that deviations occurring in a small portion of perimeter areas do not significantly affect overall system reliability, especially when most occupancy zones exhibit good prediction agreement. Thus, the DF-based soft sensor framework has high flexibility for application in both existing and new buildings, is computationally efficient for real-time control, and remains reliable within standard illuminance ranges when supported by integrated design strategies. Future studies shall demonstrate these flexibility, efficiency, and reliability in different types of buildings, different occupants and activity patterns, as well as different climates and regions to assess the system better. The evaluation of actual energy savings is beyond the scope of this study and will be addressed in future work.
Conclusion
This study aims to develop and validate an adaptive lighting control system based on daylight-linked control that integrates the spatial dimensions of DF and real-time outdoor illuminance sensing through soft sensors in a BEMS. The research successfully integrates outdoor illuminance measurements, indoor DF-based illuminance predictions, and a smart switch to enable adaptive lighting controls. The investigated rooms exhibit different spatial characteristics and demonstrate the capability of the proposed methods to predict accurate spatial illuminance distributions.
The constructed DF-based soft sensor algorithm demonstrates good predictive performance at most measurement points in both studied rooms. The algorithm’s MAE and RMSE distributions in SSTK are
The constructed DF-based soft sensor performs satisfactorily in real-world implementations. The system shows high accuracy with MAPE values of
This study demonstrates a step-by-step approach to develop and implement an adaptive lighting control system based on a DF-based soft sensor that is reliable, scalable in its methodological framework, and applicable for both existing and new buildings. Optimizations via comprehensive façade design, shading installation, and spatial zoning arrangements may improve the indoor daylighting performance. The system should be treated as an operational estimation framework for maintaining illuminance within a certain performance range, rather than as an absolute point-estimation model with high precision at every location. Future studies shall incorporate various optimization strategies into the system, as well as apply the system in different building types, occupant and activity patterns, as well as climates and regions.
Footnotes
Acknowledgements
The authors would like to acknowledge the Department of Nuclear Engineering and Engineering Physics (DTNTF), Faculty of Engineering, Universitas Gadjah Mada (UGM), for their support throughout the research process.
ORCID iDs
Funding
This research was funded by the Faculty of Engineering, Universitas Gadjah Mada, through Internal Research Funding No. 1610402/UN1.FTK/SK/HK/2025.
Declaration of conflicting interests
The authors declared no potential conflicts of interest with respect to the research, authorship, and/or publication of this article.