
Abstract
Lifestyle interventions commonly measure psychosocial beliefs as precursors to positive behavior change, but often overlook questionnaire validation. This can affect measurement accuracy if the survey has been developed for a different population, as differing behavioral influences may affect instrument validity. The present study aimed to explore psychometric properties of self-efficacy and outcome expectation scales—originally developed for younger children—in a population of female college freshmen (N = 268). Exploratory principal component analysis was used to investigate underlying data patterns and assess validity of previously published subscales. Composite scores for reliable subscales (Cronbach’s α ≥ .70) were calculated to help characterize self-efficacy and outcome expectation beliefs in this population. The outcome expectation factor structure clearly comprised of positive (α = .81-.90) and negative outcomes (α = .63-.67). The self-efficacy factor structure included themes of motivation and effort (α = .75-.94), but items pertaining to hunger and availability cross-loaded often. Based on cross-loading patterns and low Cronbach’s alpha values, respectively, self-efficacy items regarding barriers to healthy eating and negative outcome expectation items should be refined to improve reliability. Composite scores suggested that eating healthfully was associated with positive outcomes, but self-efficacy to do so was lower. Thus, dietary interventions for college students may be more successful by including skill-building activities to enhance self-efficacy and increase the likelihood of behavior change.
Introduction
The transition to adulthood has been identified as an important time for intervention as many independent behaviors—including those related to health and nutrition—are being formed during this stage of life (Nelson, Story, Larson, Neumark-Sztainer, & Lytle, 2008). Diet, exercise, and other lifestyle behaviors are of particular interest, as some weight gain is common during the college years (Gropper et al., 2009; Levitsky, Halbmaier, & Mrdjenovic, 2004; Matvienko, Lewis, & Schafer, 2001; Racette, Deusinger, Strube, Highstein, & Deusinger, 2005). This weight gain is colloquially known as the “Freshman 15,” but weight changes are often variable (Matvienko et al., 2001; Morrow et al., 2006; Provencher et al., 2008; Racette, Deusinger, Strube, Highstein, & Deusinger, 2008; Wengreen & Moncur, 2009). On average, college students gain approximately 5 pounds (Crombie, Ilich, Dutton, Panton, & Abood, 2009). Although 5 pounds may not seem significant, this trajectory may continue after graduation and into adulthood. Ultimately, this puts young adults at risk for developing a myriad of health problems associated with excess weight, including cardiovascular diseases, diabetes and other metabolic disorders, some types of cancers, and psychological disorders (World Health Organization [WHO], 2000).
Specific to women, cardiovascular disease and cancer are the top causes of death and osteoporosis is another significant concern (Cox, Chapman-Novakofski, & Thomson, 2013). It is well known that weight management is an important factor in prevention of cardiovascular disease, and may also play a role in staving off cancer. However, being overweight may also increase risk for osteoporosis through obesity-related inflammatory effects (Greco et al., 2010). Thus, developing healthy weight maintenance behaviors early in adulthood may improve women’s health in the long term.
In the past decade, much research has focused on determining whether interventions can prevent this weight gain and improve student dietary habits (Clifford, Anderson, Auld, & Champ, 2009; Franko et al., 2008; Ha & Caine-Bish, 2009, 2011; Ha, Caine-Bish, Holloman, & Lowry-Gordon, 2009; Nelson et al., 2008; Poddar, Hosig, Anderson, Nickols-Richardson, & Duncan, 2010; Schnoll & Zimmerman, 2001). To improve outcomes of such interventions, theoretical frameworks are recommended as the basis for activities and materials employed in behavioral programs (Contento, 2008).
Social Cognitive Theory (SCT), developed by Albert Bandura, is one such framework used to elicit behavior change (Bandura, 1986). Indeed, a recent systematic review of interventions targeting healthy eating of college-aged adults found that most of the interventions were informed by SCT (Kelly, Mazzeo, & Bean, 2013). SCT states that personal, behavioral, and environmental factors influence each other in a dynamic way to affect our behavior. This interaction, termed reciprocal determinism, is the major organizational concept for understanding behavior.
Self-efficacy, or situational confidence in oneself to perform a behavior, is a central construct of SCT. The stronger one’s self-efficacy, the more likely one is to be committed to their goals and ultimately achieve those aspirations. In studies investigating mediating variables of eating behavior, self-efficacy has been found to be a crucial factor in proposed models to explain eating patterns across age groups (DeWolfe & Shannon, 1993; Shannon, Bagby, Wang, & Trenkner, 1990; Sheeshka, Woolcott, & MacKinnon, 1993), including young adults (Ball et al., 2009; Larson, Story, & Wall, 2006; Strong, Parks, Anderson, Winett, & Davy, 2008).
Outcome expectations comprise a related concept in SCT. This factor describes outcomes or events that a person associates with performing a given action (Bandura, 1997). The outcomes that one associates with a behavior may be positive or negative. Bandura posits that a person will be more likely to perform a behavior if it maximizes the positive outcomes while minimizing the negative.
Together, self-efficacy and outcome expectations have been explored as important variables in motivation to consume a healthy diet (Tudoran, Scholderer, & Brunsø, 2012). To accurately document change, it is essential that surveys both accurately and reliably measure the psychosocial constructs of the theory (such as SCT) that will be used as a framework for the program intervention. Using validated survey tools to compare pre- and post-test answers helps to assess whether the intervention has led to change in psychosocial variables. Ultimately, this can determine a program’s impact, which can guide program development and even provide feedback for theory refinement (Contento, Randell, & Basch, 2002).
The important first step of questionnaire validation for the population being studied is often overlooked (McMinn et al., 2009; Solberg, O’Brien, Villareal, Kennel, & Davis, 1993).While studies including survey validation for self-efficacy and/or outcome expectations related to healthy eating can be found for parents (Condrasky, Williams, Catalano, & Griffin, 2011), low income women (Chang, Nitzke, Brown, Baumann, & Oakley, 2003; Townsend & Kaiser, 2007; Wyker, Jordan, & Quigley, 2012), and parents with adolescents or children (Monge-Rojas et al., 2010; Tschann et al., 2013), few methodological studies have been published for college-aged adults. Indeed, most interventions included in Kelly et al.’s (2013) review that framed their work with SCT did not include reliability or validity of their instruments (Ha & Caine-Bish, 2009, 2011; Ha et al., 2009) or only included minimal descriptions. One included self-efficacy questionnaire internal reliability and test–retest reliability for fiber intake (Schnoll & Zimmerman, 2001); one included self-efficacy for fruits and vegetables where reliability was tested, but the results for these scales were not clearly reported (Clifford et al., 2009); one study included self-efficacy for fruits and vegetable using only three questions and reported a Cronbach alpha for this variable of .81 (Franko et al., 2008). Another article in this review, Poddar et al. (2010), included Cronbach’s alpha for positive (.81) and negative (.58) outcome expectations related to dairy reporting with three items each and self-efficacy of .79 (three items after excluding one item).
With this in mind, the present study aimed to yield a more in-depth exploration of the psychometric properties of scales measuring self-efficacy and outcome expectations. The surveys used in the current analysis were originally developed to target school-aged children between fourth and sixth grade but also included newly developed items related to lower-fat foods and calcium-rich foods. Thus, reliability and validity for measuring these constructs among female first-year college students needed to be assessed. A secondary aim was to characterize these constructs (e.g., whether self-efficacy tended to be strong) in the given population to identify potential areas to be targeted in future interventions.
Method
Participants and Procedures
Data for the current analysis were generated through Project PEER (Peer Education, Exercising, and Eating Right), a two-wave study that explored whether a behavioral intervention framed within SCT would affect health outcomes in female freshmen at a large Midwestern university. Details regarding study protocol and procedures are described elsewhere (Kedem, Evans, & Chapman-Novakofski, 2013) but eligibility requirements included, briefly: non-smokers, full-time first-year students living on campus, free from chronic conditions that would affect ability to exercise or change diet, not taking medications that would change adiposity or psychological outcomes, sedentary or recreationally active, and at a body mass index (BMI) of 17.5 to 31.5. Classifying overweight and obese status can be difficult in this transitional period, as some young women may still be undergoing hormonal and developmental shifts. The BMI range of 17.5-31.5 was chosen to be as inclusive as possible and account for individual variations in development and normalization of body weight.
As part of data collection, participants completed psychosocial surveys online through the Survey Monkey website. These surveys were to be completed during a window of approximately 2 weeks.
Questionnaire Adaptation
Outcome expectations
Items for outcome expectations were adapted from Baranowski et al. (2000). In the 3-year Gimme 5 study, these items only referred to fruits and vegetables as the intervention was aimed at improving fruit and vegetable intake in fourth and fifth graders. Answers presented were on a scale from 1 to 5, where 1 = I disagree very much and 5 = I agree very much. Cronbach’s α—a measure of internal consistency used to assess construct reliability—ranged from .76 to .81 for positive outcome expectations for fruits and vegetables (e.g., “if I eat fruit and vegetables every day, I will have more energy”). For items pertaining to negative outcomes (e.g., “if I eat fruit and vegetables every day, I will not enjoy eating that meal or snack”), Cronbach’s α ranged from .51 to .58 (Baranowski et al., 2000).
For Project PEER, sections on lower-fat foods and calcium-rich foods were added. Survey items were updated for an older audience by including outcomes that may be more relevant to young adults, such as cost concerns, body image, social norms, and health outcomes. These were based on data from focus groups that collected information on adolescent perceptions of factors that influence their food choices (Neumark-Sztainer, Story, Perry, & Casey, 1999).
In total, 10 items were presented for each food category (fruits and vegetables, lower-fat foods, calcium-rich foods).
Self-efficacy
Self-efficacy questions were adapted from Vereecken, Van Damme, and Maes (2005). These items were developed for use in a study investigating fruit and vegetable intake in 11- and 12-year-old Belgian children, and items were classified as belonging to one of two constructs: “difficult situations” or “making choices.” Vereecken et al. found alpha to be .86 and .91 for difficult situations for fruits and vegetables, respectively, and .78 for choosing fruits and vegetables over other items.
For Project PEER, items were adapted to be more relevant to the population based on previous research (Khan, Nasti, Evans, & Chapman-Novakofski, 2007a, 2007b). Certain “difficult situations” (e.g., “when you are not at home”) were excluded, while others were added (e.g., when you are really busy with school). Questions about selecting fruits and vegetables over other food items were made more specific for the population (e.g., “Can you choose vegetables instead of French fries” rather than “I can choose vegetables instead of a snack”). As with the outcome expectations survey, sections were added for lower-fat foods and higher-calcium foods. For all items, a 4-point scale was used, where 1 = rarely/never, 2 = sometimes, 3 = often, and 4 = almost always. In total, 12 items were each presented for fruits and vegetables, 14 items for lower-fat foods, and 10 items for higher-calcium foods.
Note that items pertaining to fruits and vegetables were distinct for self-efficacy questions but combined for outcome expectation items based on past literature. Vereecken et al. (2005) reported that self-efficacy for fruits and vegetables did not highly correlate (r = .52) but found a high Spearman’s correlation (r = .83) between fruit and vegetable outcome expectations. Baranowski et al. (2000), from whom outcome expectations were adapted for this study, combined fruit and vegetable items in accordance with Domel et al.’s (1995) findings during scale development.
Preparation of Data for Analysis
Questionnaire data were exported from the online Survey Monkey database into Microsoft Excel and then imported to SPSS 17.0 (SPSS Inc., Chicago, IL, 2008). Data for participants who did not meet eligibility requirements consistent with phone screening were excluded. After all exclusions, the total sample size from Wave 1 baseline data was 146 subjects, whereas the total sample size at baseline for Wave 2 was 122 subjects.
Baseline data for the two waves were compared using two-sample Kolmogorov–Smirnov tests. No items were significantly different according to wave, so the complete data sets for the two waves were combined (N = 268). All further analyses were run using combined data.
Some recoding was necessary to make certain questions from a section comparable with one another. As presented, answers for outcome expectation questions ranged from 1 to 5 in terms of the following scale: 1 = strongly agree, 2 = agree a little, 3 = unsure/don’t know, 4 = disagree a little, 5 = strongly disagree. After data importation to SPSS, the scale was reversed and participants’ answers recoded for items that contained positive outcome expectations (e.g., if I ate foods low in fat every day, I would have more energy), to make the scale consistent in terms of the positive and negative implications for healthy food choices. For example, strong disagreement with a positive outcome expectation was considered to be unfavorable. Conversely, strong disagreement with a negative outcome expectation was interpreted as favorable and comparable with strong agreement with a positive outcome expectation.
Statistical Analysis
Principal component analysis (PCA)
Exploratory PCA with varimax rotation was employed to examine the underlying structure of questionnaire data. PCA is a flexible statistical test that allows an unbiased evaluation of the multivariate association of many variables (Naes, Brockoff, & Tomic, 2010) and has been used in studies to identify optimal scales for measurement of food-related beliefs (Bozan, Bas, & Asci, 2011; Mainvil, Lawson, Horwath, McKenzie, & Hart, 2010). Comparison of item interrelationships in the current sample with previously published groupings provided an assessment of whether the latter were valid groupings for female freshmen. Furthermore, this provided insight into item correlations beyond the reliability results yielded from Cronbach’s α analyses, as discussed below. This process was similar to Gerolimatos, Gould, and Edelstein’s (2012) exploration of the factor structure of the Anxiety Control Questionnaire in a population of older adults, which had been previously validated with a younger participant sample.
Bartlett’s test of sphericity and the Kaiser–Meyer–Olkin measure of sampling adequacy confirmed that data were suitable for PCA. As Bandura describes outcome expectations and self-efficacy as related concepts in SCT, oblique rotation was selected as the initial extraction method. However, inter-factor correlations were low, so varimax rotation was henceforth applied. Scree plots and eigenvalues (>1.0) were used to determine the number of factors that would be retained. In addition, factors were retained as long as at least two items loaded on the factor (Hatcher, 1994). Factor loadings of at least 0.40 were used to assign items to a factor (Neill, 2013). Items that cross-loaded at 0.32 or higher on two or more factors were assigned to the factor with the higher factor loading if the difference between cross-loadings was approximately 0.2 or higher (Barrett, Plotnikoff, Raine, & Anderson, 2005). If an item was unable to be reasonably assigned to a factor, the item was removed and PCA run again to clarify the structure. This process was repeated until an interpretable factor structure was obtained. For brevity, only initial and final factor solutions are displayed in tables and discussed.
Vereecken et al. (2005) reported that items pertaining to making healthier food choices—which included items referring to choosing fruits, vegetables, and lower-fat options—were part of a single construct. A preliminary PCA analysis was run to determine whether these items tended to load together in this population. However, items for making healthier choices tended to load with others pertaining to the same food group. For example, the item “Can you choose fruit instead of sweets?” loaded more strongly with other self-efficacy items for fruit rather than other items for making healthier choices, such as “Can you choose vegetables instead of salty snacks?” Thus, all items for a food category (fruits and/or vegetables, lower-fat foods, higher-calcium foods) were tested together to identify subscales and compare factor structures related to these specific food groups.
Internal consistency
Cronbach’s α was used to assess internal consistency of groupings published by Baranowski et al. (2000) and Vereecken et al. (2005) to determine whether they would be similar in a sample of female college freshmen compared with grade school students. Adequacy is widely considered to be a score of .70 or higher (Garson, 2013), so this value was used as a cut-off for an acceptable α score.
Composite scores for population description
To address the secondary aim of characterizing these constructs within the female college-aged population, composite scores were calculated as the mean score for all items in a construct when the set of items had good internal consistency. This aspect of evaluation assessed baseline self-efficacy and outcome expectations regarding a healthy diet. If a respondent was missing data for an item needed to calculate a composite score, it was manually determined by adding answers for items that were available and taking the average. This maximized the amount of composite scores available for descriptive statistical analysis (N = 268 for all composite scores). After investigating data distribution, it was found that the data were non-normally distributed; thus, median scores rather than mean scores were reported and interquartile range (IQR) used to describe dispersion of data instead of standard deviation.
Results
Outcome Expectations
PCA
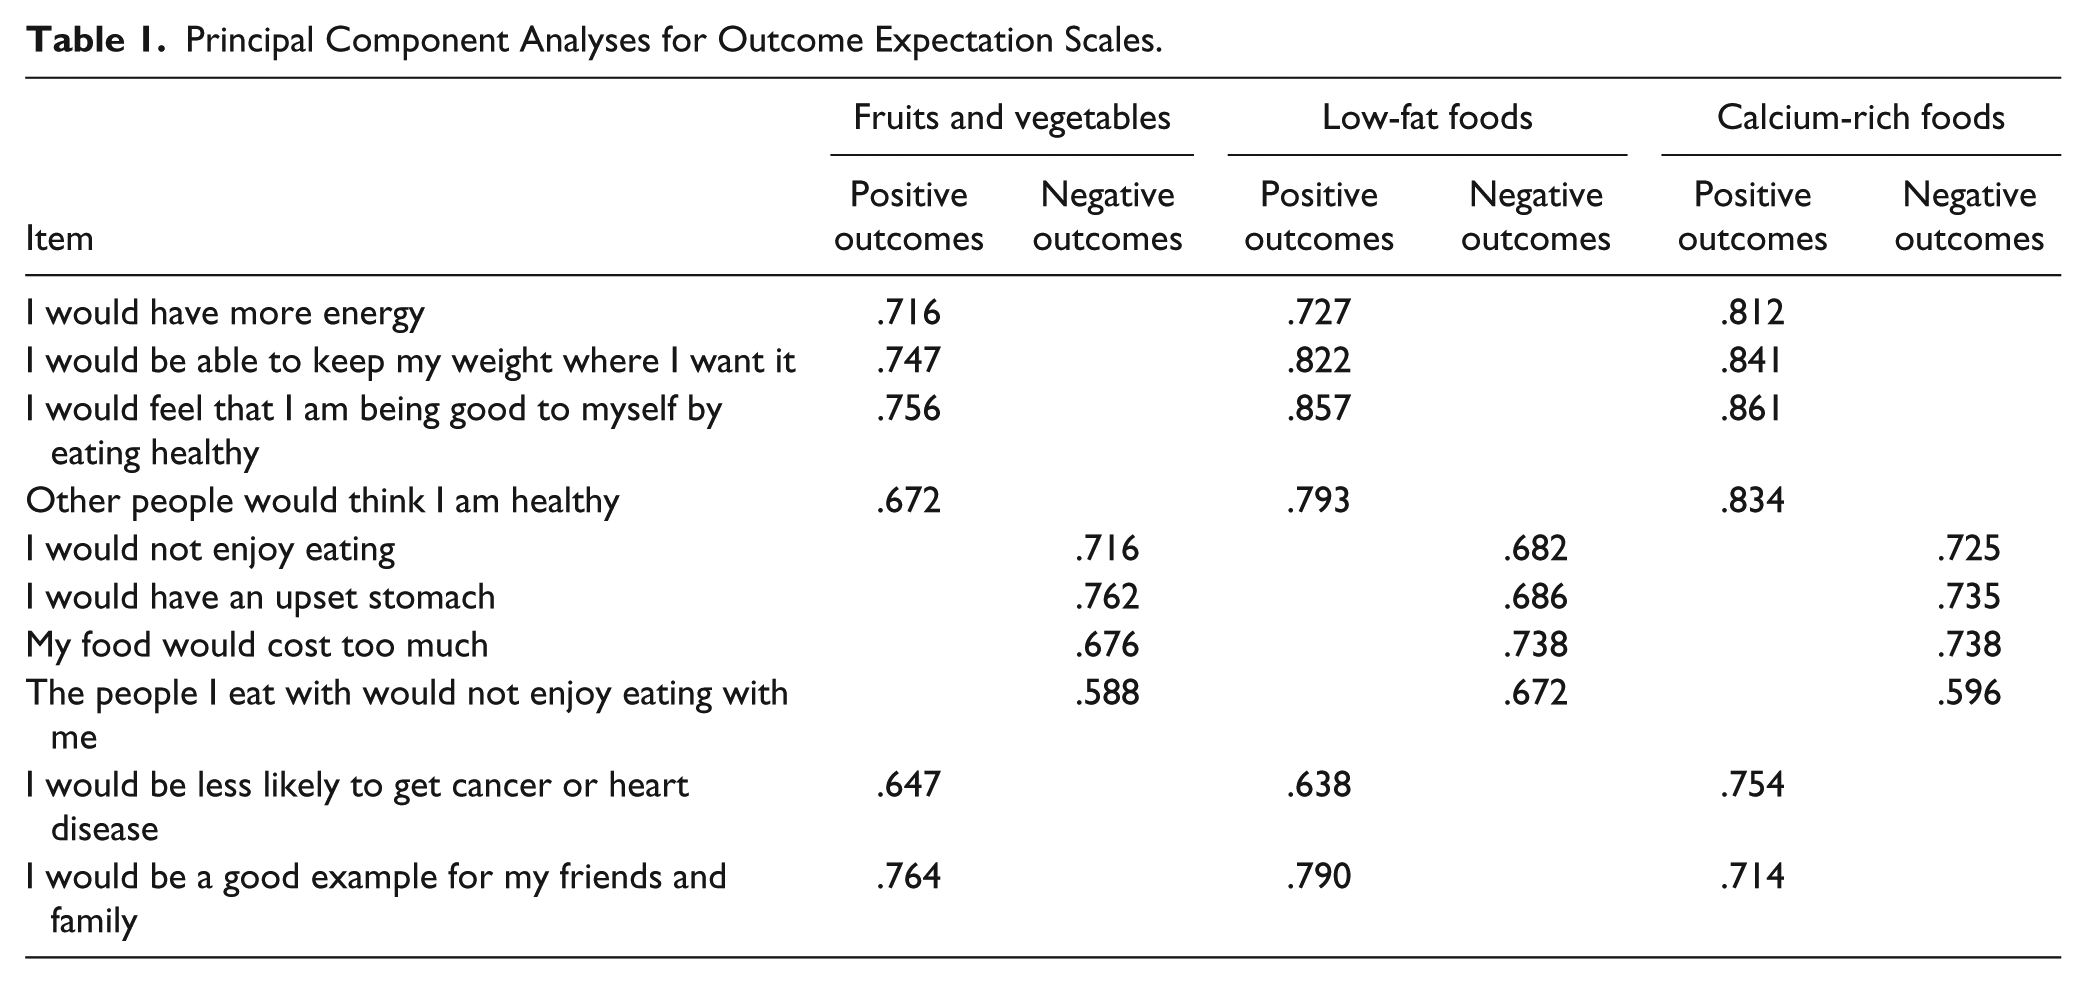
As shown in Table 1, PCA indicated that the factor structure of outcome expectation items included one factor for Positive Outcomes (six items) and one for Negative Outcomes (four items). This solution accounted for 52%, 59%, and 61% of the variance for fruits and vegetables, lower-fat foods, and calcium-rich foods, respectively. These were the same groupings described by Baranowski et al. (2000), so internal consistency was tested accordingly. These results are discussed below.
Principal Component Analyses for Outcome Expectation Scales.
Internal consistency
Cronbach’s α scores (Table 2) for Positive Outcomes were .81, .87, and .90 for fruits and vegetables, lower-fat foods, and calcium-rich foods, respectively. For Negative Outcomes, Cronbach’s α was .63 for fruits and vegetables, .67 for lower-fat foods, and .67 for calcium-rich foods. Although α scores for Negative Outcomes did not reach .70, scores could not be improved by removing any items. Furthermore, some sources have argued that such cut-offs may be arbitrary, and that these scores may not necessarily indicate poor reliability (Nunnally, 1978). Thus, all were retained for the calculation of composite scores in the sample.
Internal Consistency Analyses for Outcome Expectations Scales.
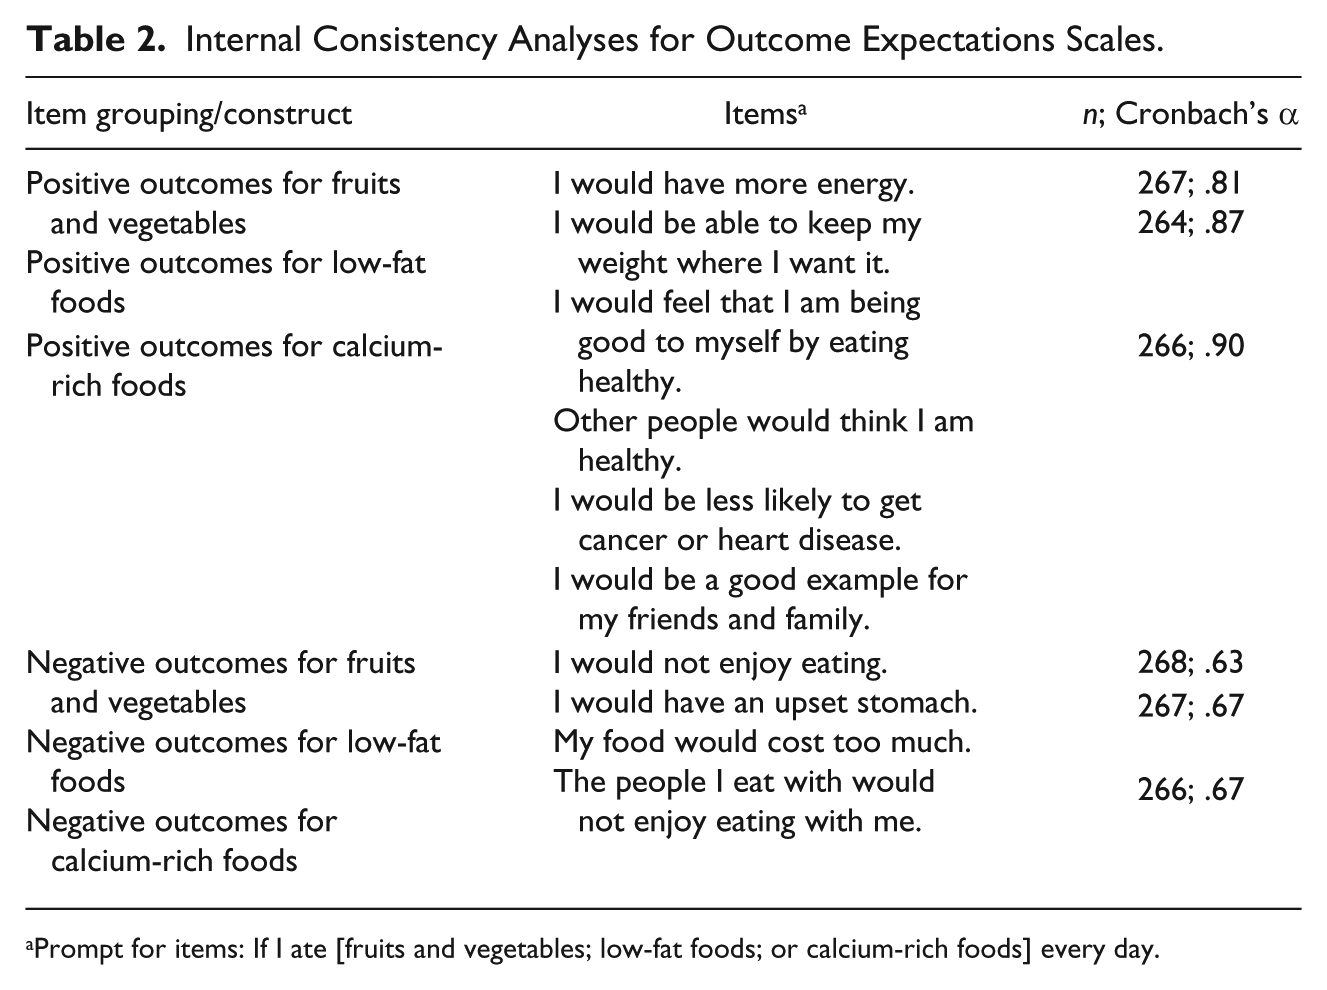
Prompt for items: If I ate [fruits and vegetables; low-fat foods; or calcium-rich foods] every day.
Composite scores for description of female freshmen outcome expectations
On a scale from 1 to 5 (Table 3), median composite scores were 4.50 (IQR = 4.00, 4.83), 4.33 (IQR = 4.00, 4.83), and 3.83 (IQR = 3.83, 4.83) for Positive Outcomes for fruits and vegetables, lower-fat foods, and calcium-rich foods. These scores indicate fairly strong positive outcome expectations. Scores were 4.00 (IQR = 3.50, 4.50), 3.75 (IQR = 3.25, 4.25), and 3.88 (IQR = 3.50, 4.25) for Negative Outcomes for fruits and vegetables, low-fat foods, and calcium-rich foods. As higher scores for negative outcomes indicate disagreement that there will be negative consequences when consuming healthy foods, these scores indicate that participants had moderately positive views regarding fruits and vegetables, low-fat foods, and calcium-rich foods.
Descriptive Statistics for Outcome Expectations Composite Scores.
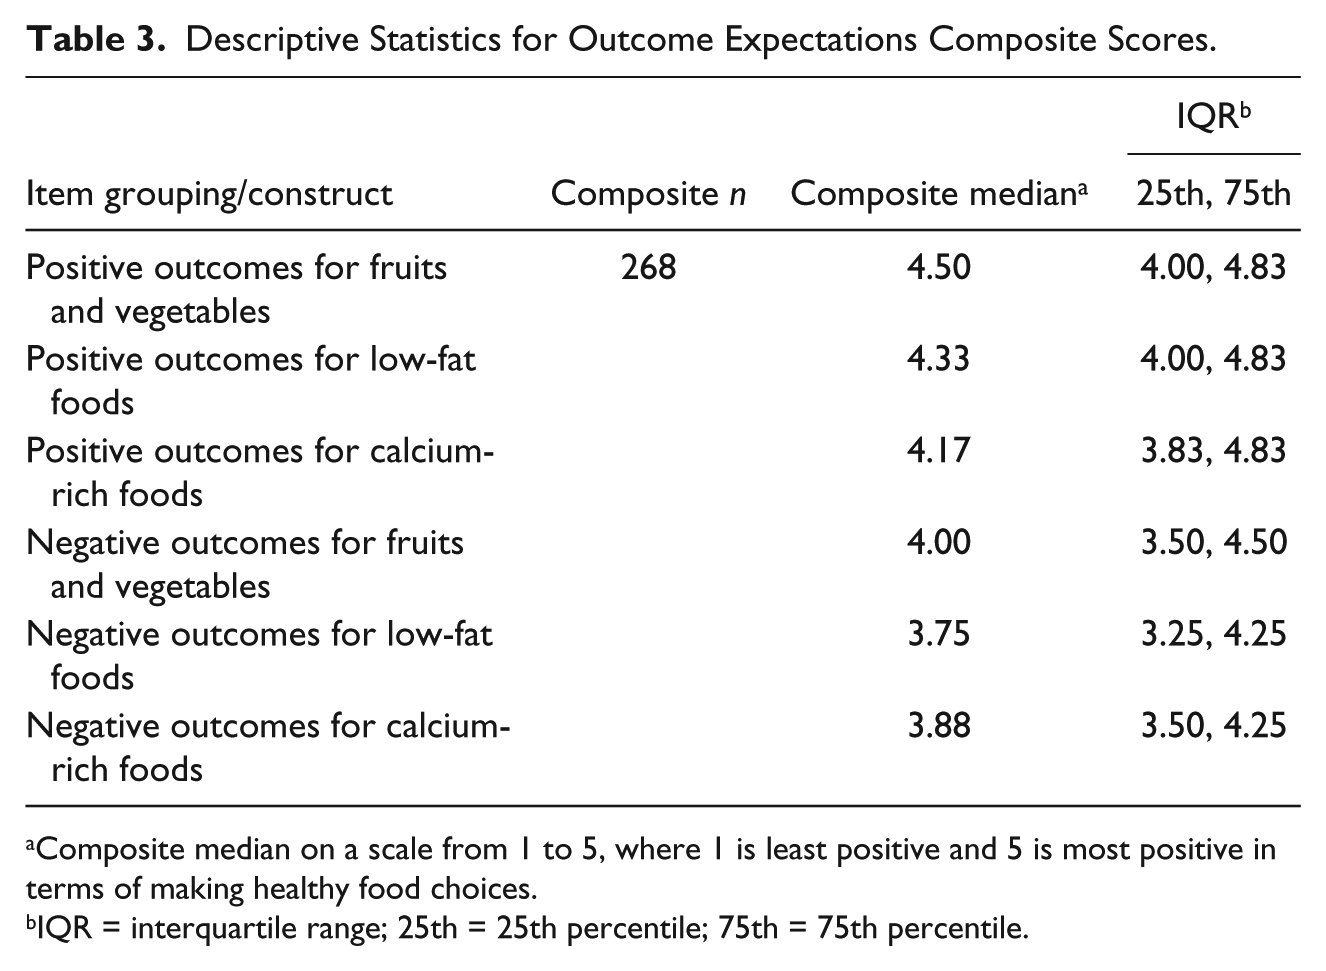
Composite median on a scale from 1 to 5, where 1 is least positive and 5 is most positive in terms of making healthy food choices.
IQR = interquartile range; 25th = 25th percentile; 75th = 75th percentile.
Self-Efficacy
PCA
Upon initial PCA, it was evident that items pertaining to hunger and availability were problematic. As shown in Tables 4 to 7, cross-loading was initially observed for one item within each food category: “when you are REALLY hungry” for both fruits and lower-fat foods, “when you are NOT hungry” for vegetables, and “when there are no higher-calcium foods available.” After removal of these items and PCA performed again, the other items referring to hunger and availability that did not initially cross-load began to do so, with the exception of higher-calcium foods. In general, it appeared that several common themes emerged: situations of low motivation, physical effort, and mental effort.
Principal Component Analysis for Self-Efficacy to Eat Fruits.
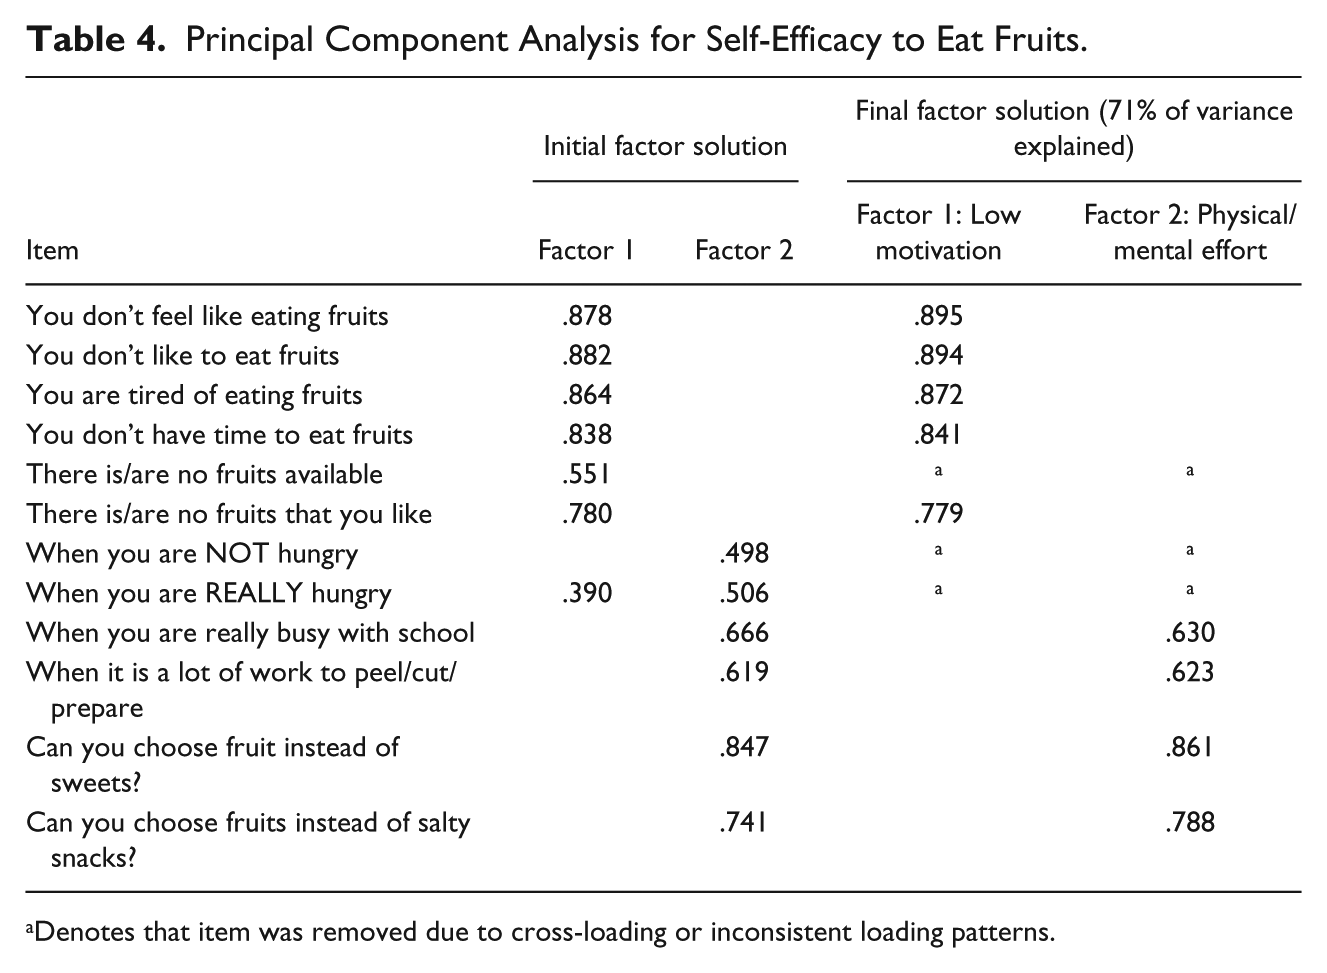
Denotes that item was removed due to cross-loading or inconsistent loading patterns.
Principal Component Analysis for Self-Efficacy to Eat Vegetables.
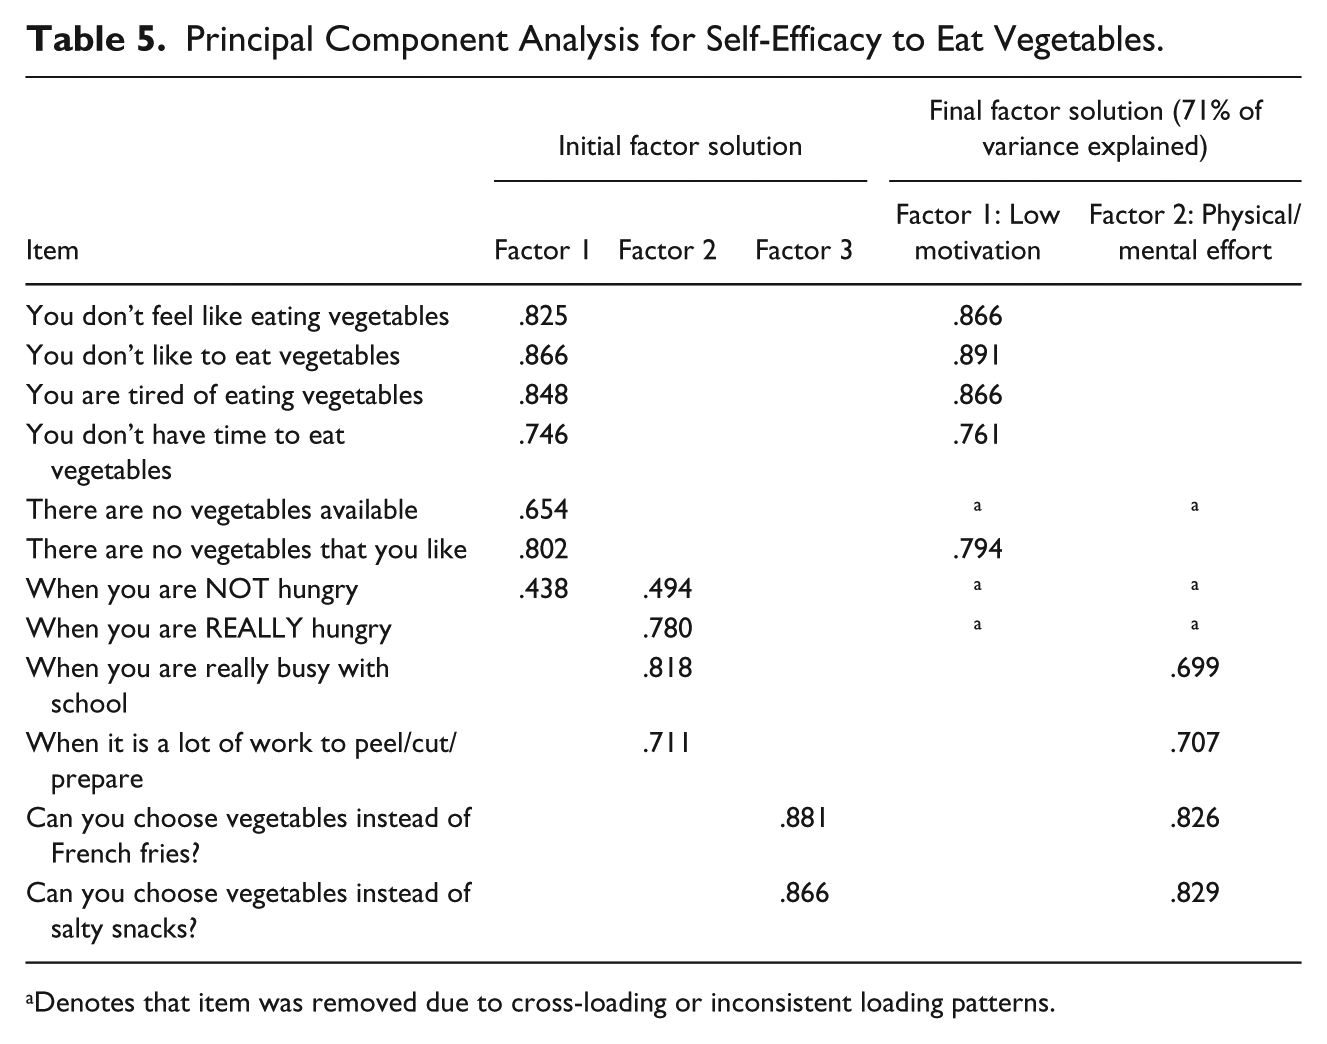
Denotes that item was removed due to cross-loading or inconsistent loading patterns.
Principal Component Analysis for Self-Efficacy to Eat Lower-Fat Foods.
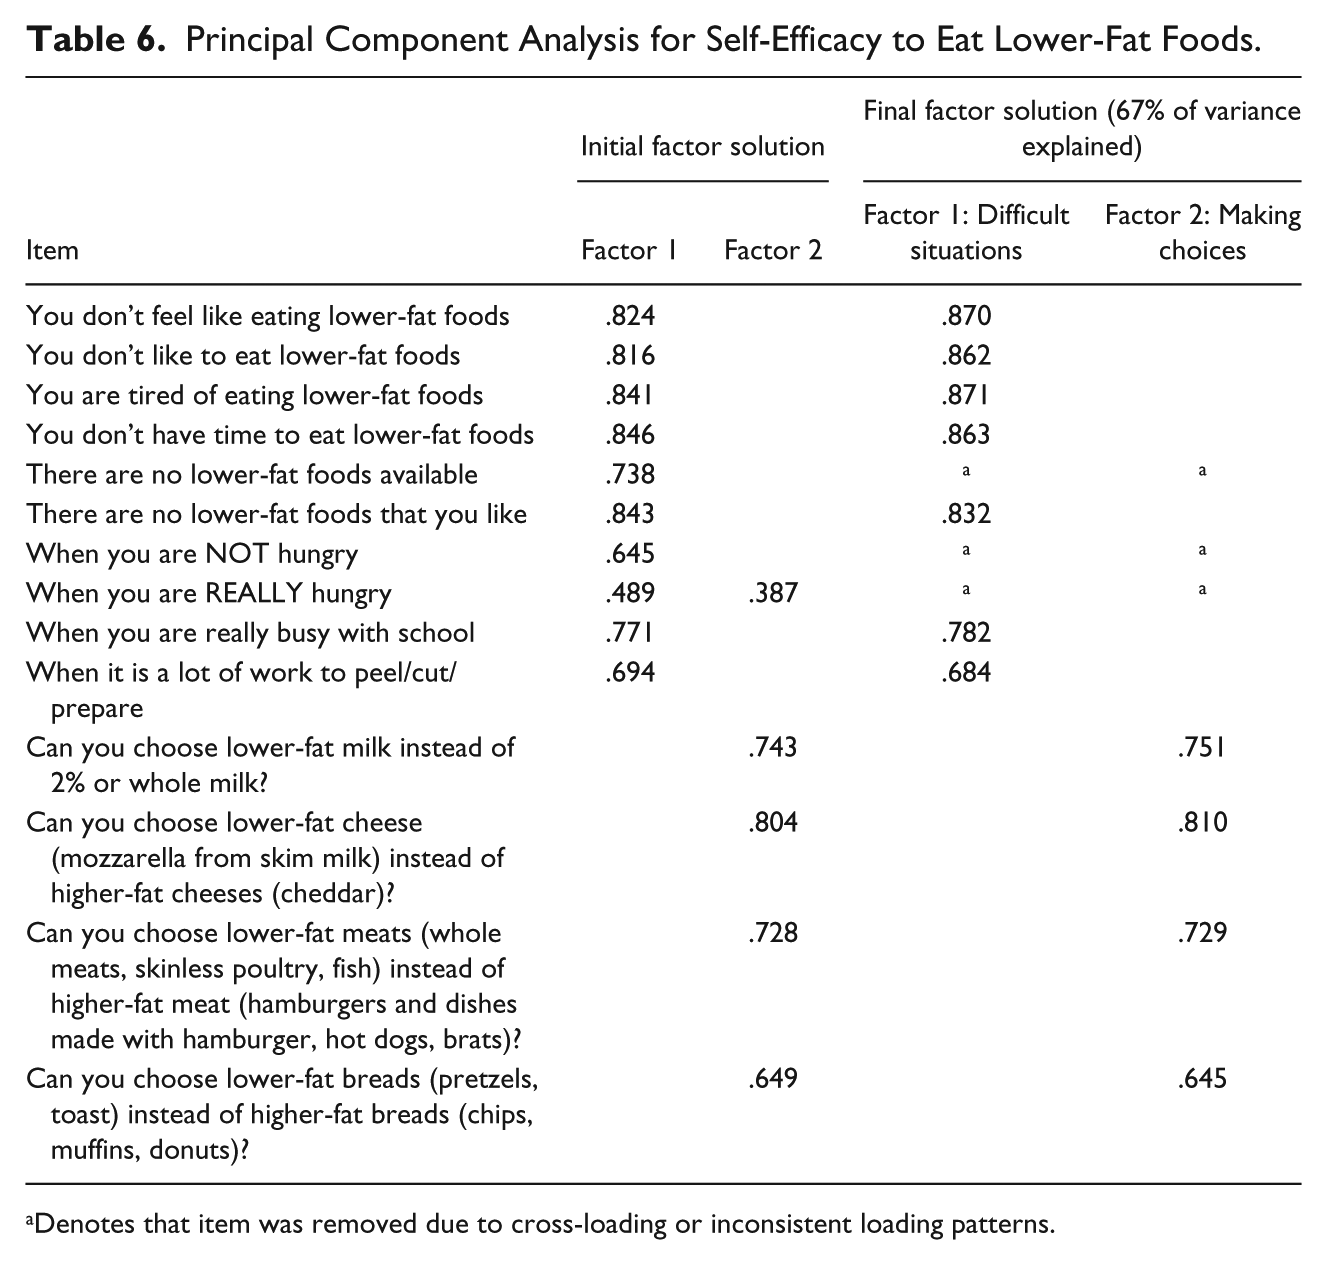
Denotes that item was removed due to cross-loading or inconsistent loading patterns.
Principal Component Analysis for Self-Efficacy to Eat Higher-Calcium Foods.
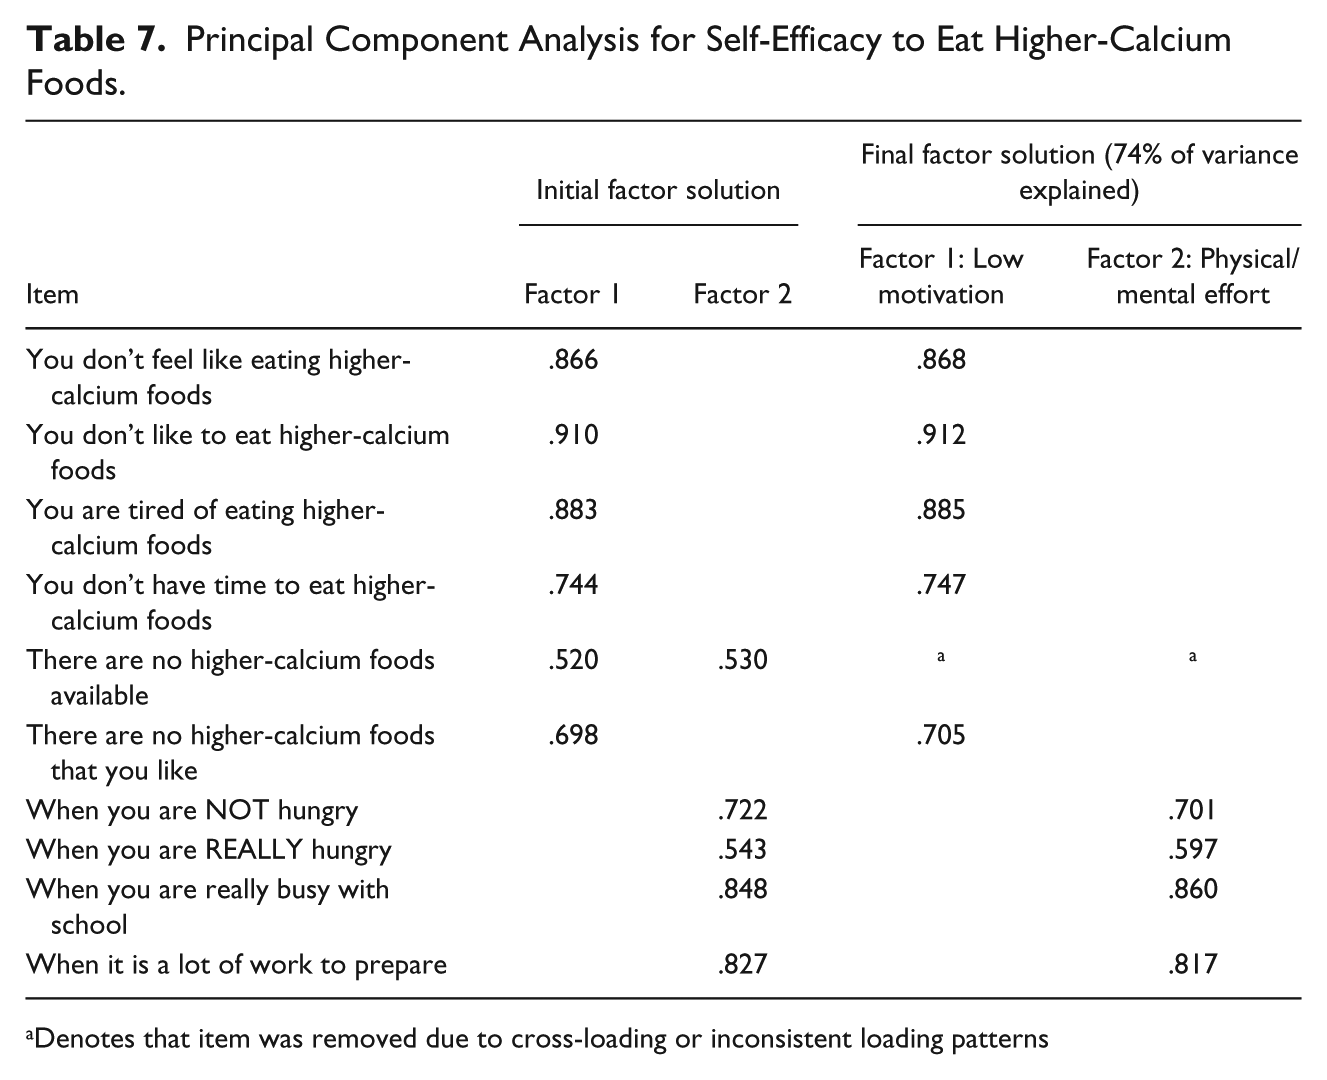
Denotes that item was removed due to cross-loading or inconsistent loading patterns
For both fruits and vegetables, the final factor solution accounted for 71% of the variance and included two factors; these were termed “Ability to Eat Fruits [or Vegetables] During Situations of Low Motivation” (five items for both fruits and vegetables) and “Ability to Eat Fruits [or Vegetables] When Physical/Mental Effort is Required” (four items for both fruits and vege-tables).
In contrast to fruits and vegetables, the factor structure for lower-fat foods was nearly the same as described by Vereecken et al. (2005); these factors were named “Ability to Eat Lower-Fat Foods in Difficult Situations” (six items) and “Ability to Choose Lower-Fat Foods” (four items). As with fruits and vegetables, however, items for hunger and availability cross-loaded and were removed and are not included in the final factor structure, which accounted for 67% of the variance.
There were no items for making healthier choices among higher-calcium foods, but physical/mental effort items clustered together and comprised its own factor (Ability to Eat Higher-Calcium Foods When Physical/Mental Effort is Required; four items), similar to fruits and vegetables and different from lower-fat foods. Another difference between items for higher-calcium foods and the other food groups is that those referring to hunger were able to be retained in the final factor solution. Hunger items were part of the factor termed “Ability to Eat Higher-Calcium Foods During Situations of Low Motivation” (six items). The final factor solution accounted for 74% of the variance.
Internal consistency
Previously published groupings for self-efficacy items were based on self-efficacy in difficult situations (for each food category) and ability to choose healthier options (incorporating all food groups). Using these groupings (Table 8), Cronbach’s α values were .91 (n = 267), .91 (n = 267), .93 (n = 265), and .93 (n = 268) for eating fruits, vegetables, lower-fat foods, and higher-calcium foods in difficult situations, respectively. For making healthier choices, α was .82 (n = 267).
Internal Consistency Analyses for Self-Efficacy Scales.
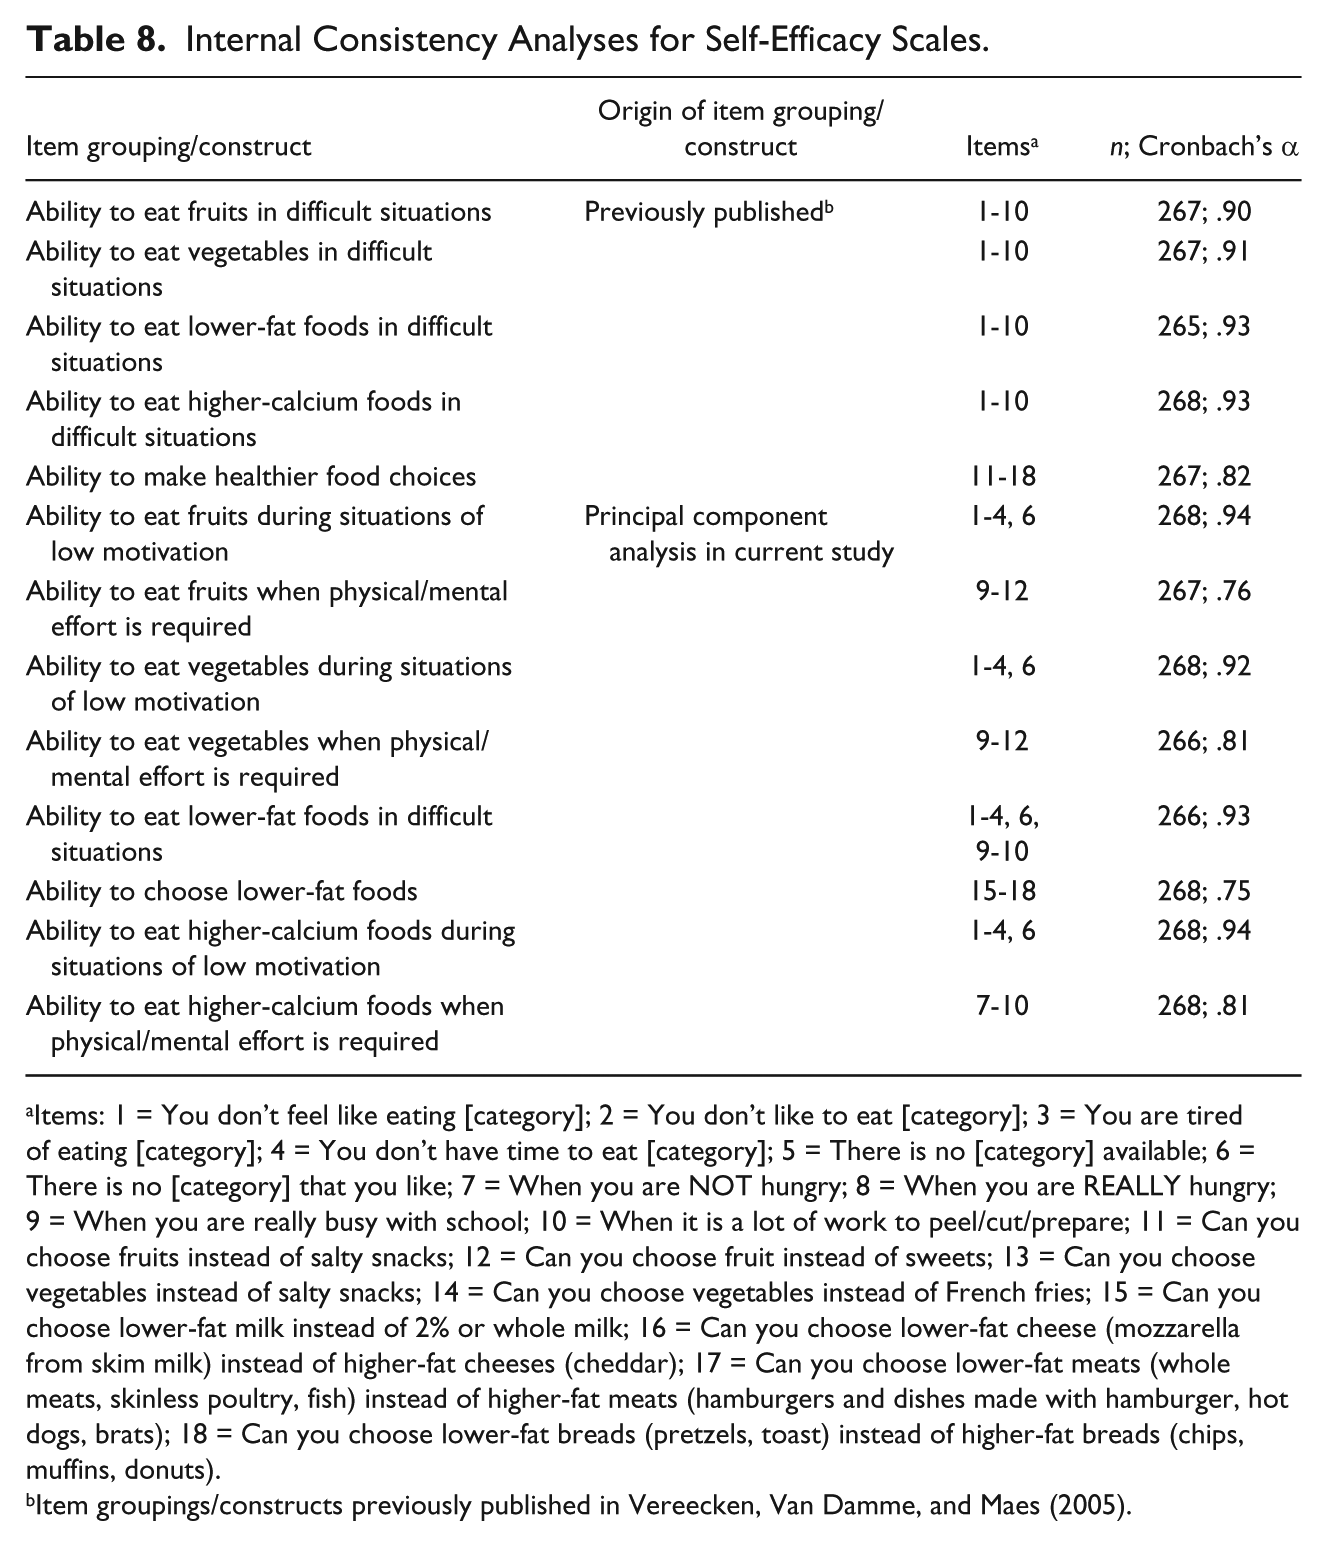
Items: 1 = You don’t feel like eating [category]; 2 = You don’t like to eat [category]; 3 = You are tired of eating [category]; 4 = You don’t have time to eat [category]; 5 = There is no [category] available; 6 = There is no [category] that you like; 7 = When you are NOT hungry; 8 = When you are REALLY hungry; 9 = When you are really busy with school; 10 = When it is a lot of work to peel/cut/prepare; 11 = Can you choose fruits instead of salty snacks; 12 = Can you choose fruit instead of sweets; 13 = Can you choose vegetables instead of salty snacks; 14 = Can you choose vegetables instead of French fries; 15 = Can you choose lower-fat milk instead of 2% or whole milk; 16 = Can you choose lower-fat cheese (mozzarella from skim milk) instead of higher-fat cheeses (cheddar); 17 = Can you choose lower-fat meats (whole meats, skinless poultry, fish) instead of higher-fat meats (hamburgers and dishes made with hamburger, hot dogs, brats); 18 = Can you choose lower-fat breads (pretzels, toast) instead of higher-fat breads (chips, muffins, donuts).
Item groupings/constructs previously published in Vereecken, Van Damme, and Maes (2005).
As shown in Table 8, internal consistency was also strong based on groupings suggested by PCA and ranged from .76 to .94.
Composite scores for description of female freshmen self-efficacy
As shown in Table 9, self-efficacy trended toward lower scores compared with outcome expectations. One finding of note is that median scores for Ability to Eat Vegetables During Difficult Situations (median = 2.10; IQR = 1.90, 2.70) and Ability to Eat Higher-Calcium Foods During Difficult Situations (median = 2.15; IQR = 1.80, 2.70) appeared to be lower than for fruits (median = 2.30; IQR = 1.90, 2.90) and lower-fat foods (median = 2.20; IQR = 1.90, 2.80). The median score for Making Healthier Choices was highest at 3.00 (IQR = 2.63, 3.50).
Descriptive Statistics for Self-Efficacy Composite Scores.
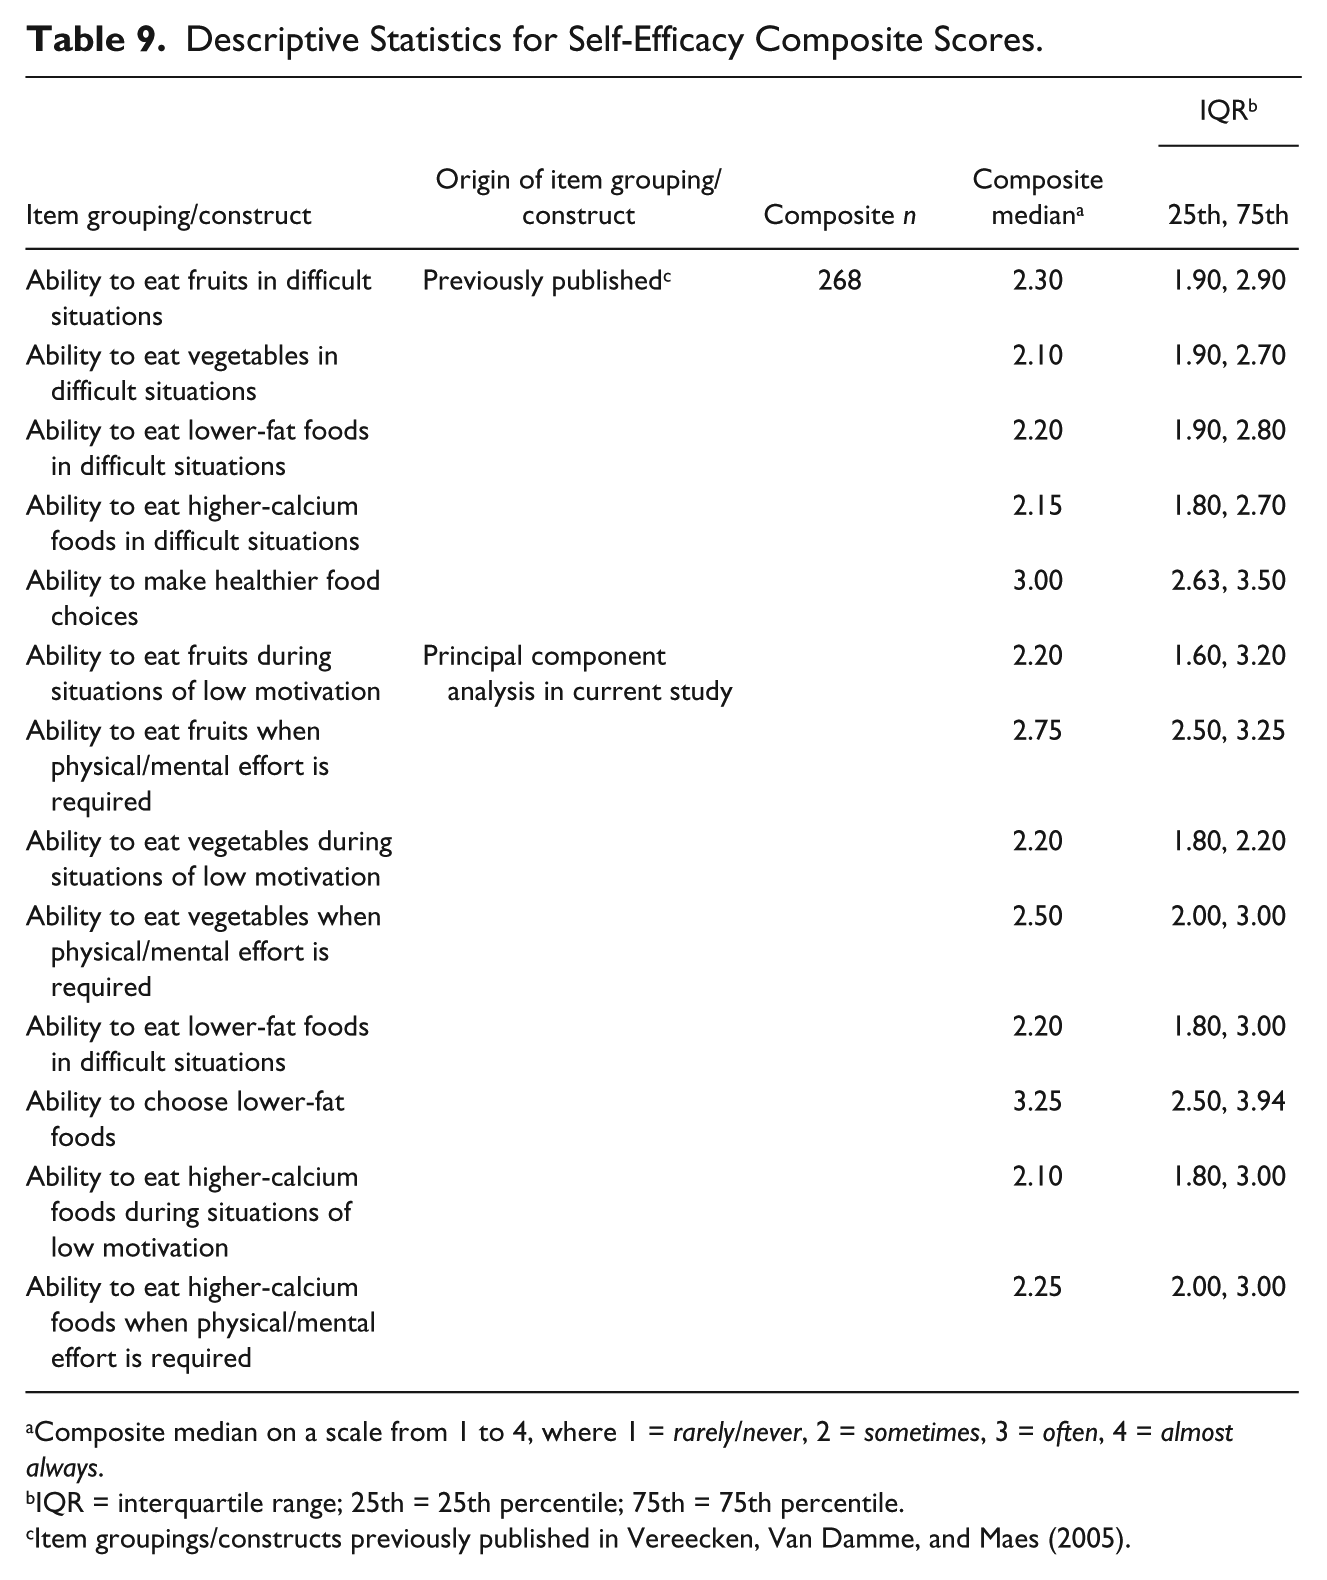
Composite median on a scale from 1 to 4, where 1 = rarely/never, 2 = sometimes, 3 = often, 4 = almost always.
IQR = interquartile range; 25th = 25th percentile; 75th = 75th percentile.
Item groupings/constructs previously published in Vereecken, Van Damme, and Maes (2005).
Discussion
One purpose of this study was to evaluate the psychometric properties of questionnaires used in a weight gain intervention for female freshmen. PCA revealed that factor structures for outcome expectations were the same as previously reported in a much younger population; items pertaining to positive outcomes grouped together, while negative outcomes loaded together as a factor. Internal consistency scores based on these item groupings compared favorably with previously reported values as well (Baranowski et al., 2000). High Cronbach’s α scores were also observed for new sections on low-fat and calcium-rich foods. It appears that the surveys first used in fourth and fifth graders but updated by including outcomes more relevant to young adults, such as cost concerns, body image, social norms, and health outcomes, are robust enough to be used in this older population of females. However, subscales pertaining to negative outcomes could be improved, as Cronbach’s α values were lower than .70. Focus groups could be conducted to identify negative outcomes that college students associate with consuming these foods. These perceived outcomes should be incorporated into the survey while evaluating whether current items should be kept verbatim, modified, or eliminated.
Strong internal consistency was maintained for self-efficacy items based on previously published groupings in a younger population. For fruits, vegetables, and higher-calcium foods, however, factor structures were not exactly the same as in Vereecken et al.’s (2005) sample of fifth-grade Belgian students. They reported that all “difficult situation” self-efficacy items for a given food category loaded together, while items for choosing healthier options comprised a separate factor. Items for choosing healthier options did indeed cluster together in this analysis, but for fruits and vegetables this factor also included items pertaining to being busy with school and preparation. This departure may be a reflection of variations in influences on eating patterns among school-aged children compared with young adults. Self-efficacy in younger children may not vary much due to limited control over what they eat (Hendrie et al., 2012). Meanwhile, college-aged students have more autonomy, which can affect levels of self-efficacy. Furthermore, self-efficacy to eat healthier foods likely differs depending on the circumstances. Therefore, it is not completely unexpected that these items did not simply load with other items for “difficult situations.”
Further supporting this is the fact that items related to availability and hunger tended to cross-load or load onto different factors rather than strongly loading with other items pertaining to “difficult situations.” Availability of healthy foods may differ if one is referring to the dormitory, the general campus, when visiting one’s parents, and so on; thus, these items may not have been clear in their meaning. Consequently, self-efficacy items may need to be more specific regarding location.
In terms of hunger, being food-deprived may increase the chance of eating anything offered to alleviate discomfort, including less preferred items such as fruits and vegetables (Hoefling & Strack, 2010). However, less healthy options are often readily available. University students often keep a variety of snacks and beverages in their rooms (Nelson & Story, 2009), many of which are less healthy choices (e.g., sweetened beverages, salty snacks). Dormitory cafeterias and fast food restaurants also include a wide array of options. Students may find palatable items such as fried foods or ice cream to be more attractive and difficult to resist when hunger is an immediate concern (Nelson, Kocos, Lytle, & Perry, 2009). These items may be improved by more clearly describing the given situation and incorporating dining location and food availability.
People also eat for many reasons besides hunger, which has been described by Theim, Brown, Juarascio, Malcolm, and O’Neil (2013) as hedonic hunger. Female college students in particular may eat unhealthier foods because of temptation, lack of discipline, being bored, and being stressed (Greaney et al., 2009). This multidimensional concept may not have been adequately measured in the survey as only one item pertained to eating healthier foods “when you are NOT hungry.” Therefore, self-efficacy items pertaining to these factors could be added to the scale to tap into additional barriers that may affect dietary behavior, especially as hedonic hunger may be related to weight control (Theim et al., 2013).
Overall, composite scores for outcome expectations were quite high, suggesting that the benefits of a healthy diet are understood in this cohort. Although Strong et al. (2008) used a different measure, this is consistent with their finding that college students tended to highly agree with positive items and disagree with negative items regarding an overall healthful diet.
Compared with outcome expectations, self-efficacy scores were low to moderate; most composite scores corresponded to only being able to consume the healthier food “sometimes” during difficult situations. Scores were higher for making healthier choices and corresponded to being able to pick the healthier option at least “often.” Based on all groupings, self-efficacy scores for vegetables and higher-calcium foods appeared to be lower than others, especially compared with relatively higher self-efficacy for fruits and lower-fat foods. This supports Franko et al.’s (2008) finding that at baseline, students participating in an online intervention had low self-efficacy to eat vegetables, although they also had low self-efficacy to eat fruits. Elevated self-efficacy for lower-fat foods compared with vegetables is consistent with Strong et al.’s (2008) finding that college students had lower self-efficacy for increasing fruits and vegetables compared with decreasing fat intake. Targeting self-efficacy by helping students develop strategies to overcome barriers and increase skills in meal planning and cooking may help improve their diets.
As described previously, fruits and vegetables were considered to be one food group for outcome expectations, while they were separated for self-efficacy scales. This was based on reports that in school-aged children, self-efficacy for fruits and vegetables does not highly correlate (Vereecken et al., 2005). In the current study, Spearman’s rho indicated that self-efficacy to consume fruits and vegetables did appear to be correlated (r = .73; p < .001). Thus, self-efficacy to consume these items may differ in younger children, but may become more similar as development progresses.
Developmental changes in self-perception, skill development, and learned behaviors may be possible contributors to the observed variations in factor structure. In their study of social cognitive influences on fruit and vegetable intake among African American and Caucasian adolescents, Granner et al. (2004) found that older adolescents had lower self-efficacy to eat fruits and vegetables compared with those who were younger. They proposed that this may be due to older adolescents having more accurate perceptions of their abilities, and that their fluctuating social and environmental conditions may negatively affect self-efficacy.
Studies examining the factor structure of scales designed to measure other psychological constructs, such as worry (Hopko et al., 2003) and anxiety control (Gerolimatos et al., 2012), have also demonstrated age-related differences in factor loadings. Aging can lead to alterations in physiological processing of stimuli and resultant emotional activation, as well as changes in emotional regulation strategies (Gerolimatos et al., 2012). This may extend to dietary behaviors, as adolescence is associated with less reliance on cognitive strategies to regulate eating. Decisions tend to be driven more by emotional factors such as peer normative beliefs and impulsivity, which may be related to neurological development (Killgore & Yurgelun-Todd, 2005). As college freshmen are bridging the development gap between adolescence and young adulthood, these issues may need to be considered when measuring dietary beliefs in this population.
This study is not without limitation. As respondents were volunteers likely already concerned about their health and weight, the sample was, in effect, self-selected. Participants were not screened for mental conditions that could affect views on diet and health, such as eating disorders or depression. Respondents were predominantly Caucasian and recruited from a large, public university in the Midwest, so results may not be applicable to all ethnicities or to students in other regions or countries. The surveys in question should be tested with more diverse samples to widen their applicability in this age group.
Despite limitations, the current study demonstrated that self-efficacy and outcome expectation scales met acceptable levels of validity and reliability in this sample of female freshmen. Importantly, these questionnaires have not previously been tested in a college-aged population. In addition, these surveys included previously untested items for lower-fat and higher-calcium foods. Comparison between PCA and previously published groupings provided insight into their validity. Subscales for outcome expectations were the same as previously described, suggesting these groupings to be valid reflections of outcome expectation constructs in this sample.
While internal consistency scores were high for self-efficacy scales based on previous groupings, they may not be valid measures of subscales. Items may need to be grouped differently to obtain a more reliable measure. The outcome expectation and self-efficacy scales themselves could be modified to obtain more robust measures of such psychosocial constructs in this population. As the number of items for each construct only ranged from 4 to 6, additional items could be added to improve reliability. However, care should be taken to not excessively increase participant burden and not artificially inflate Cronbach’s alpha values.
As the current study utilized only baseline data, further testing should include test–retest reliability to confirm results. Furthermore, confirmatory factor analyses could be conducted to compare model fit of previously published factor structures with those identified in the current study. Ultimately, such refinement of these surveys could help better capture psychosocial data in this population and inform the development of more successful weight management interventions.
Human Subjects Statement
This study was approved by the university institutional review board and conducted in accordance with regulations; all subjects gave informed consent to participate.
Footnotes
Authors’ Note
The manuscript was developed from a master’s thesis. Portions of the manuscript have been published and presented in abstract form.
Declaration of Conflicting Interests
The author(s) declared no potential conflicts of interest with respect to the research, authorship, and/or publication of this article.
Funding
The author(s) disclosed receipt of the following financial support for the research, authorship, and/or publication of this article: This work was supported by the National Institute of Food and Agriculture (formerly the Cooperative State Research, Education, and Extension Service), at the United States Department of Agriculture [AG 2008-55215-18828].