
Abstract
Token economy systems have been widely used as an evidence-based classroom management strategy to reinforce and improve prosocial responses. While token economies have been widely applied to educational settings, there have been mixed results regarding the effectiveness depending on the classroom type. To better understand the components contributing to the effectiveness, the researchers analyzed 24 token economy studies conducted in general and special education classrooms from kindergarten to fifth grade between 2000 and 2019. Eight token economy components and effect sizes were identified for each study and compared across different classroom types. The results showed that the token economy intervention yielded large effect sizes for both general and special education classroom types. There were differences in the usage of token components including backup reinforcer types, token production rate, and exchange production rate based on classroom types. Implications for future research and practice for educators and clinicians are discussed.
Educators are encouraged to use research-based strategies to manage student behavior in school settings (Gresham, 2004). Token economies have been identified as an effective evidence-based classroom management strategy (Simonsen et al., 2008) and a well-established psychological procedure by the American Psychological Association, Task Force on Promotion and Dissemination of Psychological Procedures (1993). In classrooms, educators implement token economies by choosing specific behaviors to increase, delivering tokens contingent on students emitting that behavior, and students exchanging tokens for various goods, activities, or privileges at a scheduled time (Ayllon & Azrin, 1968). A basic token economy consists of six primary features or components (Hackenberg, 2009; Ivy et al., 2017; Kazdin & Bootzin, 1972) including (a) target behavior, (b) tokens that function as conditioned reinforcers, (c) backup reinforcers, (d) token-production schedule, (e) exchange-production schedule, and (f) token-exchange schedule. These components are essential in making a token economy system flexible and adaptable to various settings and populations.
Given this flexibility, several studies have demonstrated successful application of token economies across different settings and populations with varying age, gender, disabilities, and disorders (Doll et al., 2013; Ivy et al., 2017; Kazdin & Bootzin, 1972; Soares et al., 2016). Token economies have been implemented in primary and secondary schools (Maglio & McLaughlin, 1981; McLaughlin & Malaby, 1977), universities and colleges (Boniecki & Moore, 2003), prisons (Kazdin, 1977), detention centers (Bippes et al., 1986), inpatient programs (Milby, 1975), and residential treatment center (Murray & Sefchik, 1992). Further, there have been systematic reviews and meta-analyses on token economy documenting the effectiveness of this technology. Previous reviews have focused on token economy use with specific populations, including individuals with schizophrenia (Dickerson et al., 2005), students with challenging behavior (Maggin et al., 2011), and psychiatric inpatients (Milby, 1975). Reviews also highlighted the historical and modern use of token economy with suggestions for future development. Topics include issues and barriers with the application of token economy (Kazdin, 1982; Kazdin & Bootzin, 1972; O’Leary & Drabman, 1971), historical development and modern usage (Carlson et al., 1972; Doll et al., 2013; Hackenberg, 2009; Matson & Boisjoli, 2009), procedural components (Ivy et al., 2017), and effect sizes in classrooms (Soares et al., 2016).
Specifically, Ivy et al. (2017) evaluated token economy studies published between 2000 and 2015 to evaluate the procedural descriptions of token economies implemented in applied settings. The results showed that token economy components were often omitted or vaguely described, which may negatively affect future research or applications. Given that token economies are often used in educational settings, it is imperative to evaluate the procedural components of token economies implemented in classrooms. Further, to date, research suggested mixed results regarding the effectiveness of interventions such as token economies across different educational settings (DuPaul & Eckert, 1997; Soares et al., 2016). While interventions in general had greater effects when implemented in special education classrooms compared to general education classrooms for within-subject design studies (DuPaul & Eckert, 1997), token economies have been shown to have comparable effects in general and special education classrooms (Soares et al., 2016). The findings together suggest that an evaluation of the procedural description and effectiveness of the intervention across general and special education classrooms is needed. Thus, the purpose of this study was to compare token economy components and the effectiveness of token economies implemented in general and special education classrooms.
In our systematic review and meta-analysis, we calculated effect sizes per study and aggregated effect sizes according to type of classroom (general and special education classrooms). The eight token economy components selected (see Table 1) were an extension of the components identified by Ivy et al. (2017). We incorporated target behavior, token production schedule, exchange production schedule, and token exchange schedule from Ivy et al. (2017) and added types of tokens, types of backup reinforcers, response cost, and unit of contingency to the components to be analyzed. This review extended Ivy et al. (2017) by (1) examining a larger range of token economy components, (2) focusing on token economy studies conducted in K-5 educational settings, (3) focusing on token economy studies published in years between 2000 and 2019, and (4) reporting effect sizes of treatment outcomes. This review focused on K-5 grade level because token economies were most commonly used in elementary school classroom settings (Doll et al., 2013; Ruesch & McLaughlin, 1981). This review also used studies published between 2000 and 2019 to better reflect the updated literature on token economy. This study aimed to address the following two research questions. First, what are the variations of the token economy components that produce better outcomes in each classroom type? Second, are token economy systems effective in each classroom type?
Definitions of Article Analysis Components.
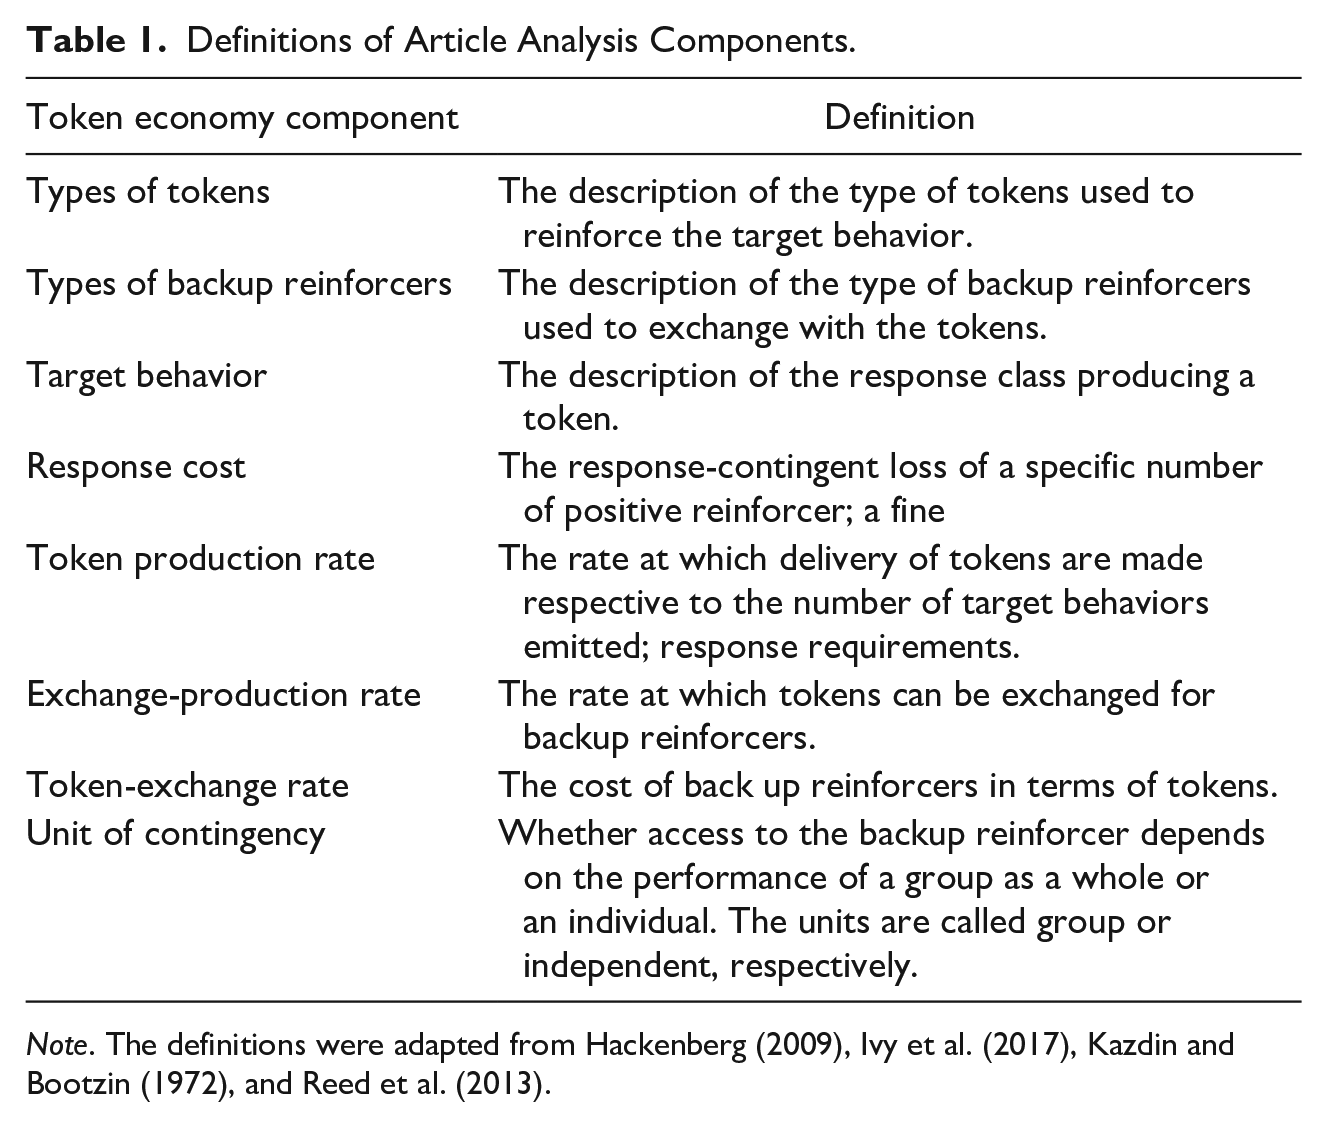
Note. The definitions were adapted from Hackenberg (2009), Ivy et al. (2017), Kazdin and Bootzin (1972), and Reed et al. (2013).
Method
Data Search
The search included three stages. Figure 1 summarizes the stages with number of articles identified and included in each stage.
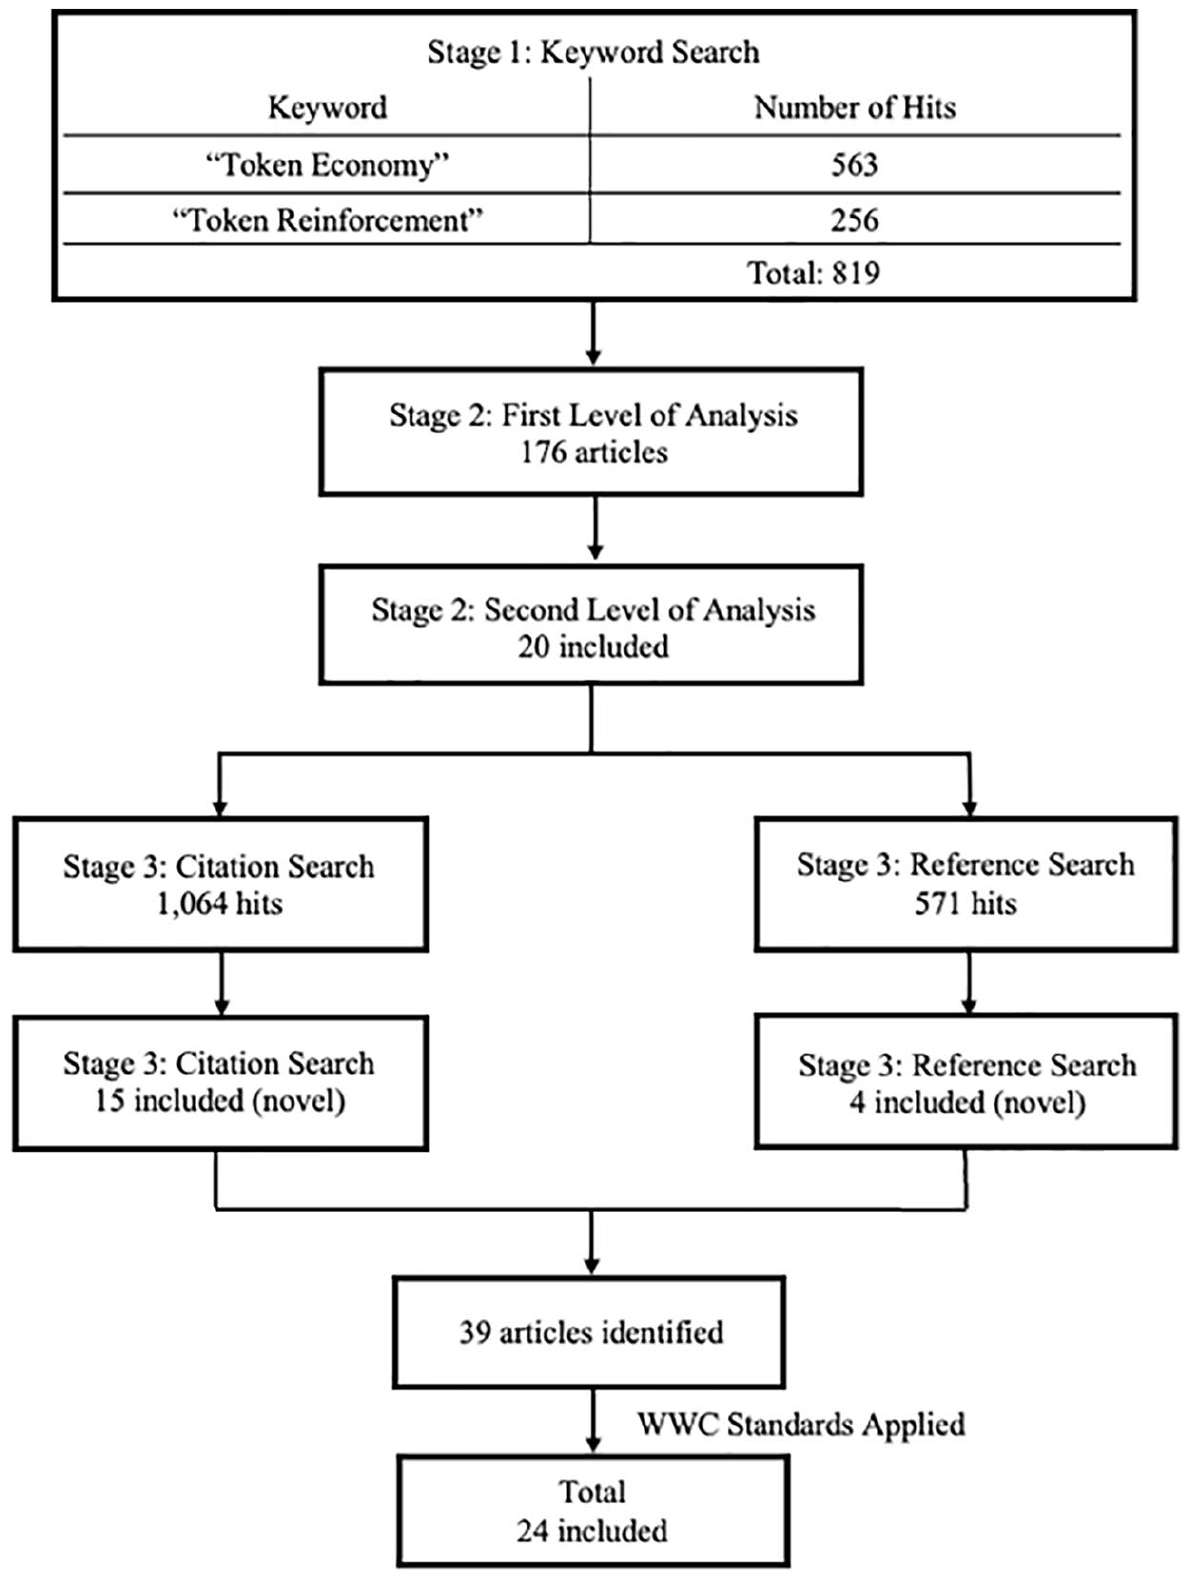
Schematic overview of the data search and data analysis process.
Inclusion and Exclusion Criteria
The researchers evaluated the articles identified through the data search procedure to evaluate for inclusion in the analysis. The researchers reviewed the title and abstract first and then the full article to evaluate the inclusion eligibility. To be included, a study had to (a) use a token economy system as the intervention or in a treatment package, (b) implement the intervention in a general or special education setting with students’ grade-level ranging from kindergarten to fifth grade with the age ranging from 3 to 12 years old, (c) be published between the years of 2000 and 2019, and (d) have the intervention conducted in the participants’ regular classroom setting (i.e., not a laboratory setting).
The researchers excluded studies that (a) were literature reviews, conceptual papers, and basic research, (b) implemented a reinforcement system similar to token economies for parent or staff training or drug use treatment, (c) implemented token economies outside of a regular school or classroom setting (e.g., research laboratory setting, private clinic, hospital, detention centers, summer programs, universities, rehabilitation centers, or prison), (d) had the student removed from his or her regular classroom to implement the intervention (e.g., small room, intervention room, and alcove), (e) included participants who were adolescents, preschoolers, adults, older population, and non-human animals, and (f) did not specify the type of classroom the intervention was conducted.
Stage 1: Keyword search
The researchers searched PsycINFO and Education Resources Information Center (ERIC) database using the keywords token economy and token reinforcement. No other search terms were used. The researchers set the parameters of the search to identify articles published from January 2000 through December 2019 in peer-reviewed English language journals. The search yielded 819 articles in total (563 for token economy and 256 for token reinforcement).
Stage 2: Article search
Stage 2 consisted of two levels of analysis. The researchers applied the inclusion and exclusion criteria for articles identified in Stage 1 through a two-level analysis. Duplicates were excluded. During the first level of analysis, the researchers reviewed the title and abstract to determine if the article would fit the inclusion criteria. During the second level of analysis, the researchers reviewed the articles identified through the first level of analysis and eliminated those that did not fit the inclusion criteria. The researchers identified 176 articles through the first level of analysis and 20 through the second level of analysis. Thus, there were 20 articles at the end of Stage 2.
Stage 3: Citation and reference search
The researchers used the 20 articles identified through Stage 2 and conducted a citation search using the Google Scholar database and a hand-reference search by inspecting the reference section of each article to locate additional articles that may have been missed through the first round of search. The two-level analysis was applied for the citation and reference searches. Figure 1 shows the number of articles included in each level of analysis. Articles the researchers were unable to obtain through the database and university interlibrary loan service were excluded from the study. The citation search yielded 15 novel articles and reference search yielded 4 novel articles. In total, the 39 articles were identified. There were three articles excluded from our review because the researchers were unable to obtain them through the database and university interlibrary loan service, and the authors’ email addresses were unavailable.
Out of the 39 articles, the researchers applied the What Works Clearinghouse (WWC) standards for single-case design (Kratochwill et al., 2010) and identified 24 studies that meet the evidence standards or meet evidence standards with reservations. This process was used to ensure that the current review only included studies meeting the minimal standards for high quality research. Each study had to meet the evidence standards or meet evidence standards with reservations across standards including (1) systematic manipulation of independent variables, (2) sufficient interobserver agreement (IOA) across phases (i.e., an independent second observer assessing at least 20% of the data points in each condition with a minimal 80% agreement for inter-assessor agreement and 60% for Cohen’s kappa), (3) at least three demonstration of intervention effects at three different points in time, and (4) each phase with at least three data points or at least five repetitions of alternations if an alternating treatments design was used. If a study did not meet all four standards with at least meet evidence standards with reservations status, the study was excluded from the review. Fifteen studies were excluded during this process. The most common reasons of exclusions were in the order of insufficient IOA for each condition, less than three data points in each phase, and demonstration of an intervention effect in less than three points in time. None of the included 24 articles contained multiple experiments. Thus, the researcher analyzed 24 unique studies for the current review.
Data Search Intercoder Agreement
Intercoder agreement (ICA) data were collected for each stage. For Stage 1, a second reviewer independently conducted a keyword search by repeating the procedure described in Stage 1. To calculate ICA, the researchers conducted a total count ICA (Cooper et al., 2019) by dividing the smaller number of found articles by the larger number of found articles and multiplied the result by 100. ICA was 96% for the keyword search. For Stage 2, an independent reviewer repeated the procedure described in Stage 2 by applying the inclusion and exclusion criteria for 60% of articles identified through the first level of analysis. The first author randomly selected the articles, using a list randomizer website (random.org/lists/). To calculate ICA, the researchers used a trial-by-trial (study-by-study) method, where the number of articles with agreement were divided by the number of items with agreement and disagreements and multiplied by 100. ICA was 94% for Stage 2. For Stage 3, an independent reviewer repeated the procedure described in Stage 3 by conducting the search and applying the inclusion and exclusion criteria for 30% of articles identified through the Citation and Reference Search. To calculate ICA, the researchers used the methods described for Stage 1 and 2. The ICA for the search was 100% and applying the inclusion criteria was 92%.
Data Analysis
Following the identification of 24 studies that meet the evidence standards or meet evidence standards with reservations (Kratochwill et al., 2010), the researchers reviewed each article to extract data on each article that met criteria. Along with the basic study information (i.e., authors, name of the article, year of publication, journal, year), the researchers coded the data on the following categories: (a) types of tokens, (b) types of backup reinforcers, (c) target behavior, (d) response cost, (e) token production rate, (f) exchange-production rate, (g) token-exchange rate, and (h) unit of contingency (see Table 1 for definitions of each component).
Data Analysis Intercoder Agreement
A second reviewer independently analyzed 38% of the articles identified by the first author through the data search. The first author randomly selected the articles, using a list randomizer website (random.org/lists/). Trial-by-trial analyses was used to calculate ICA (Cooper et al., 2019) for each of the following variables: (a) setting, (b) target behavior, (c) token type, (d) backup reinforcer type, (e) response cost, (f) token production rate, (g) exchange production rate, (h) token exchange rate, and (i) unit of contingency. Overall ICA was 95%.
Effect Size Calculations
The researchers calculated the effect size using the improvement rate difference (IRD; Parker et al., 2009) to quantify the strength of the treatment in each study. IRD has several advantages including available confidence intervals, successful applications in hundreds of evidence-based medical research studies, and strong correlation with well-known parametric and nonparametric effect sizes including R2, Kruskal-Walis W effect size, percent of nonoverlapping data (PND), phi, and percent of all over nonoverlapping data (PAND; Parker et al., 2009). IRD is commonly used in medical research for risk analysis and represents a nonparametric effect size for single-case research based on the risk analysis of baseline and intervention data (Parker et al., 2009). Specifically, the difference between two proportions of data overlap provides IRD. The first proportion represents the number of baseline data overlapping with treatment data, and the second proportion represents the total number of baseline data overlapping with baseline data.
To calculate omnibus IRD for each study, the researchers followed the procedures described by Parker et al. (2009). The researchers excluded secondary measures not targeted through the token economy for IRD calculation (e.g., teacher praise). An IRD value is reported on a scale from 0 to 1.00, and a value less than 0.50 indicated a small effect, a value between 0.51 and 0.70 indicated a moderate effect, and a value greater than 0.71 indicated a large effect (Parker et al., 2009; Rakap, 2015). IRD effect sizes and confidence intervals were hand-calculated first and then cross-checked using an online confidence interval calculator (VassarStats; http://www.vassarstats.net/prop2_ind.html).
Effect Size Intercoder Agreement
ICA data for effect sizes were collected for 25% of the total included articles. The first author randomly selected the articles, using a list randomizer website (random.org/lists/). To calculate ICA, the researchers used point-by-point method (Cooper et al., 2019). ICA was calculated by dividing the lower effect size by the larger effect size and multiplying by 100. Mean agreement was 99% (range, 97%–100%).
Results
General Characteristics of the Literature
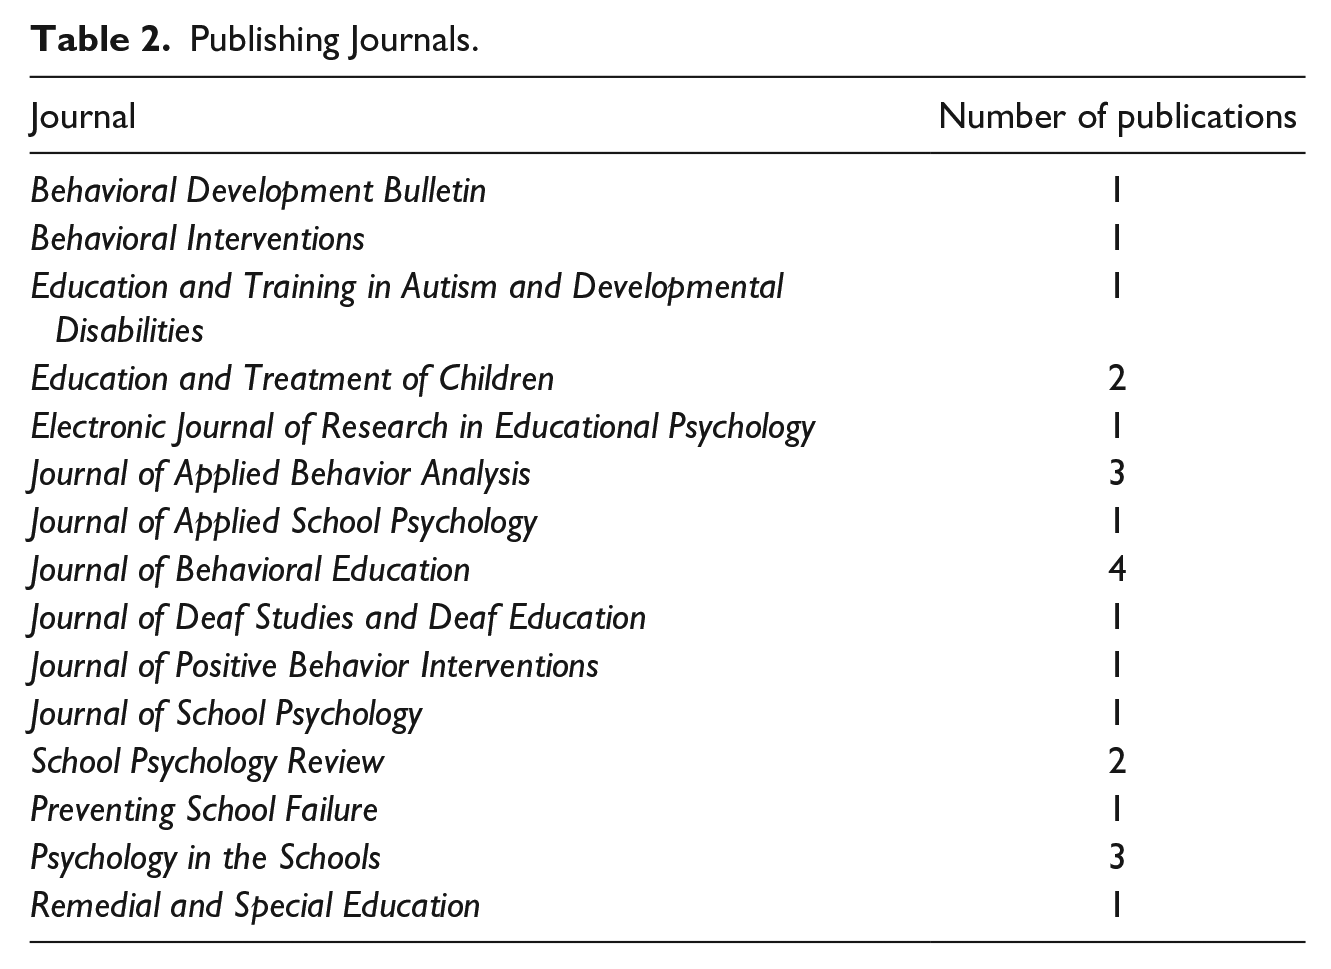
The 24 studies included in this review were published in 19 journals during the 2000 to 2019 time period. The journals with the highest number of studies (N = 4; 17%; see Table 2) was Journal of Behavioral Education, followed by Psychology in the Schools, and Journal of Applied Behavior Analysis (N = 3; 13%; see Table 2). Studies were conducted most frequently in general education classroom setting (N = 15; 63%), followed by special education (N = 9; 38%) classroom. About 22 out of 24 studies (92%) targeted classroom behavior while 2 studies (8%) targeted academic skills such as math word problems (Alter, 2012) and reading (Shepley et al., 2016).
Publishing Journals.
Question (1): What are the Variations of the Token Economy Components That Produce Better Outcomes in Each Classroom Type?
General education classroom
The search identified 15 studies with a token economy system implemented in a general education classroom setting. Table 3 displays the token economy components of each study conducted in general education classrooms. Overall, points and small marks or items (e.g., tick marks, chips, smiley faces, and dots) were implemented as tokens. For backup reinforcers, studies employed edibles and small tangibles most often (N = 7; 47%) followed by mystery rewards/motivators (N = 3; 20%) and activities (N = 2; 13%). Most studies reported that these backup reinforcers were communal rather than individualized. In other words, a group of students shared the same backup reinforcers instead of having them individualized per student based on individual preferences. Four studies (27%) did not report the specific back up reinforcers (Battaglia et al., 2015; Christensen et al., 2004, 2007; Petursdottir & Ragnarsdottir, 2019), but three out of the four studies stated that they determined the reinforcers through a functional behavior assessment (FBA), reinforcer survey, or preference assessment. 1 All 15 studies investigated the effects of the intervention on classroom behavior and academically related behaviors—such as following classroom rules, socially appropriate behavior, disruptive behavior, and on- and off-task behavior—rather than academic responding, specifically. Five out of 15 studies (33%) used response cost as part of the independent variable. Three studies that used response cost were comparison studies that used response cost in one of the conditions (Donaldson et al., 2014; Tanol et al., 2010; Wright & McCurdy, 2012).
Token Economy in General Education Classroom.
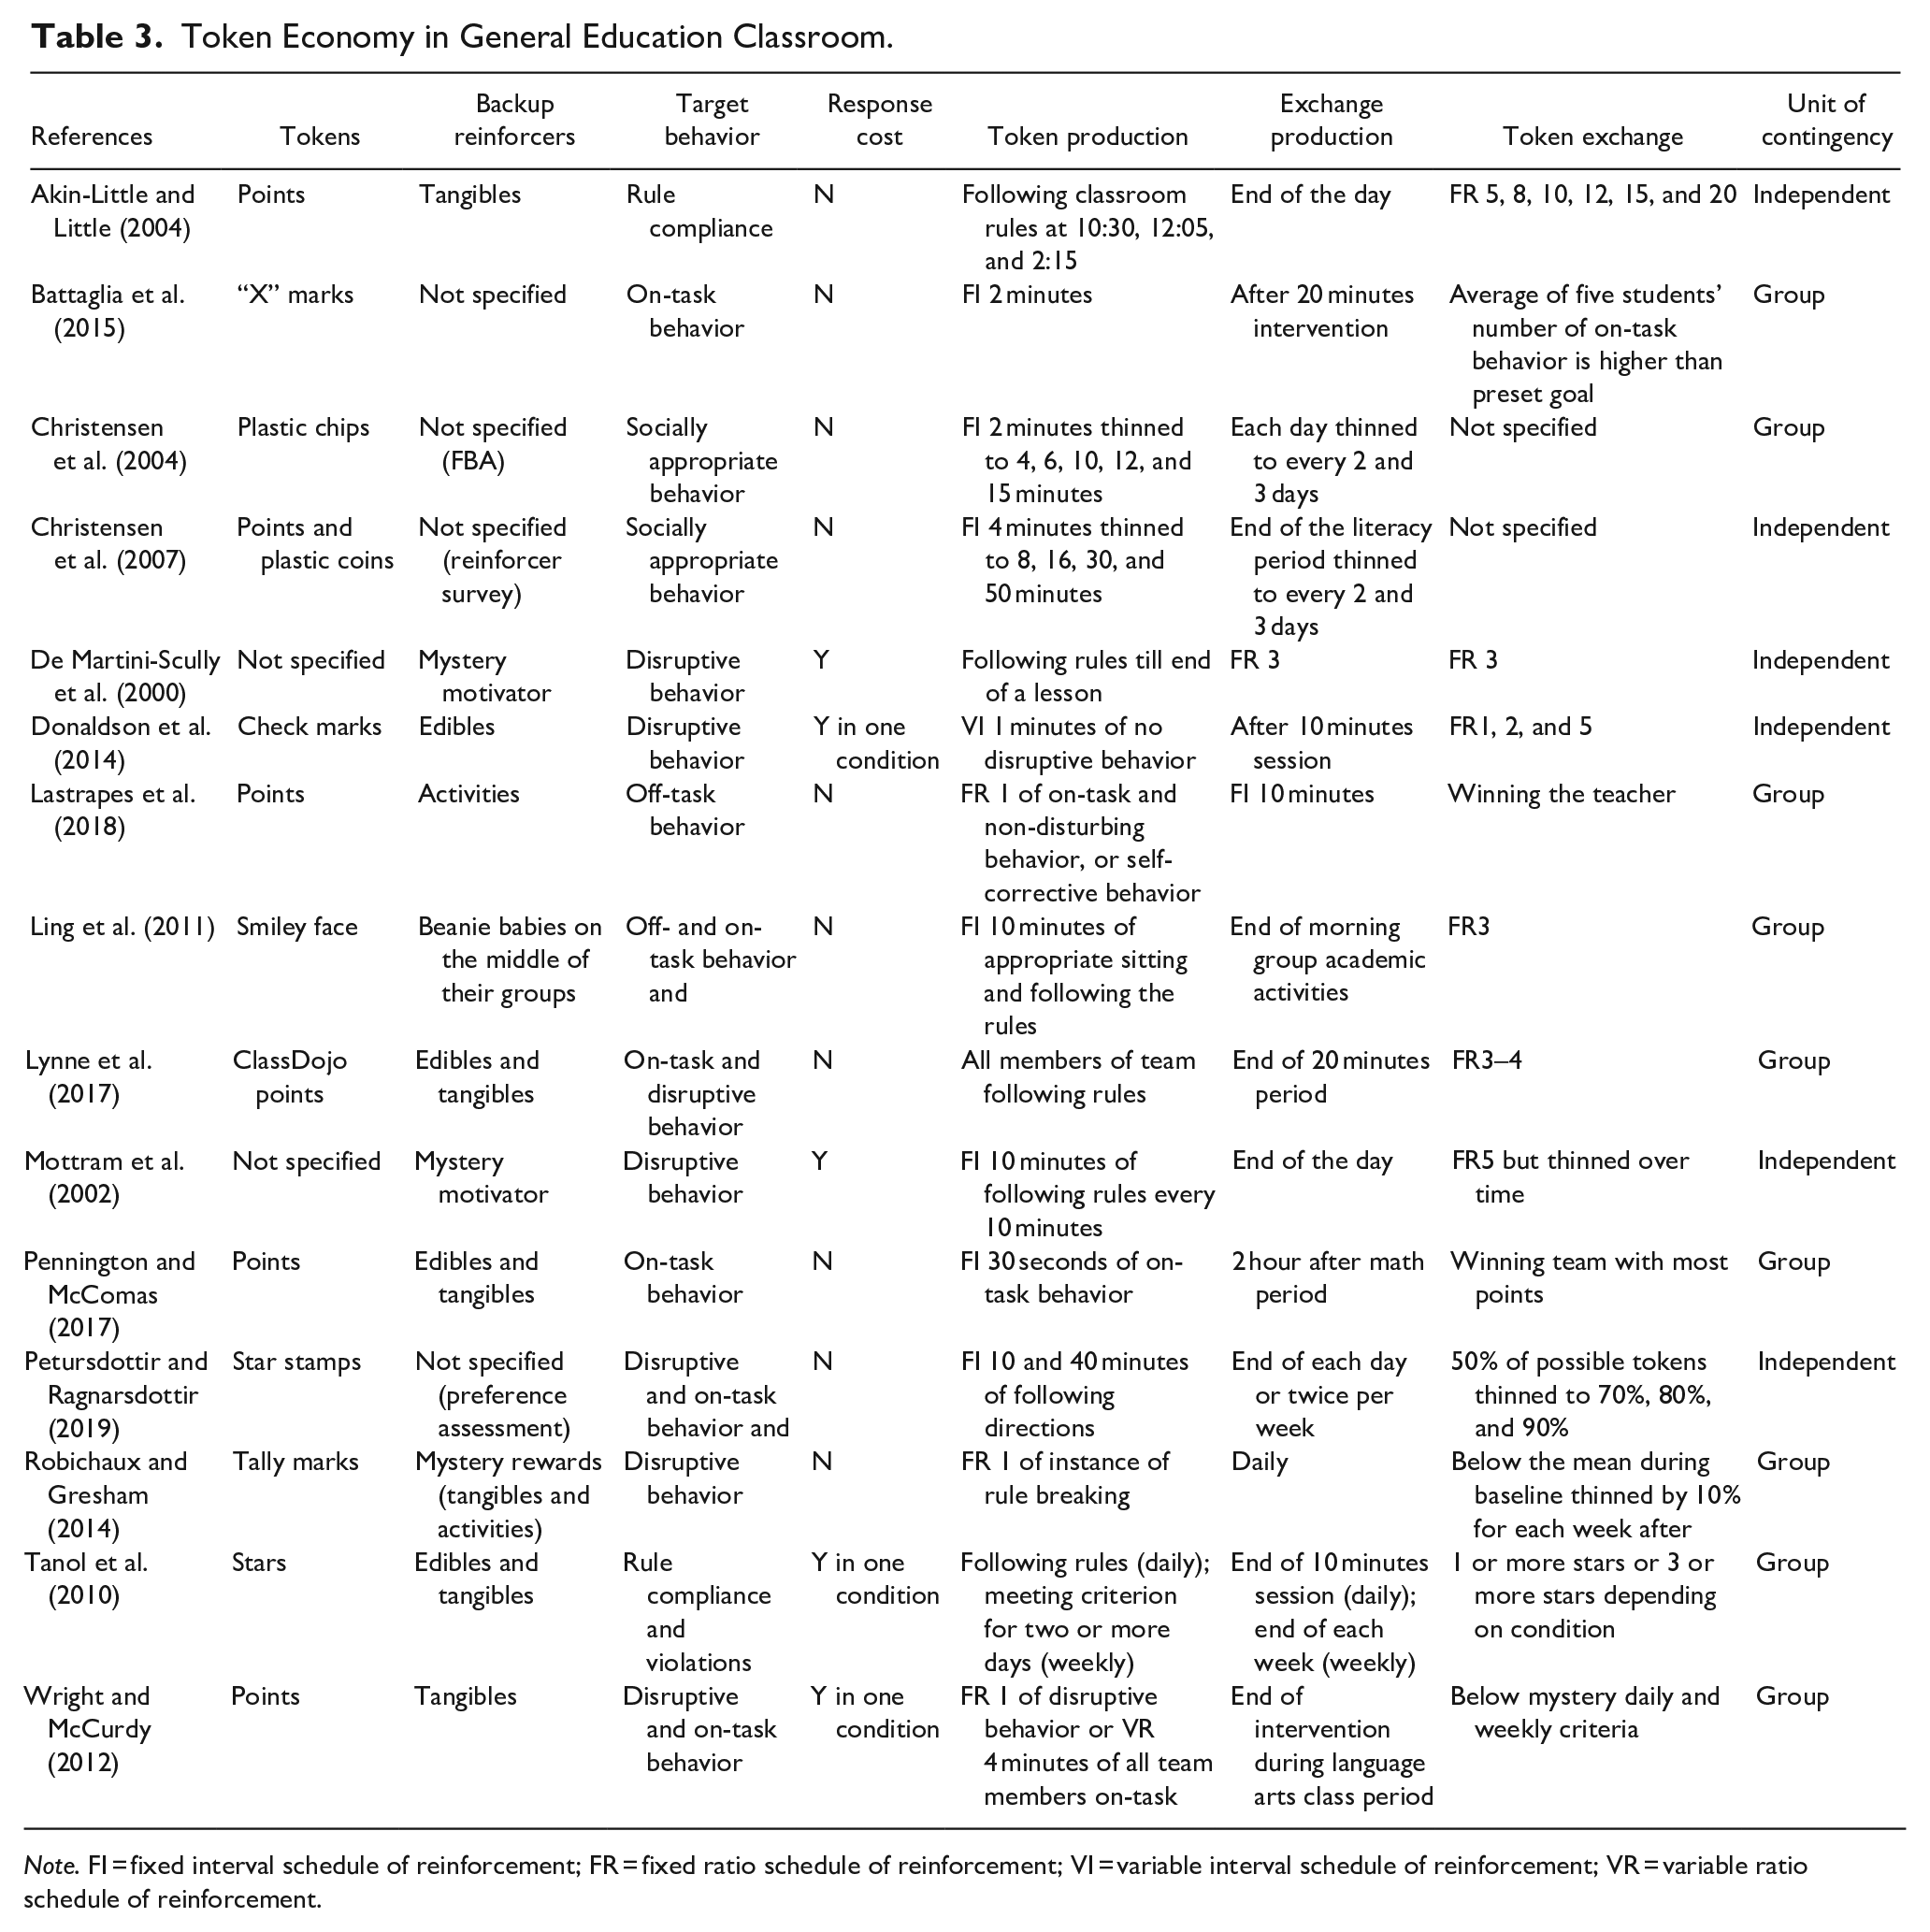
Note. FI = fixed interval schedule of reinforcement; FR = fixed ratio schedule of reinforcement; VI = variable interval schedule of reinforcement; VR = variable ratio schedule of reinforcement.
Regarding the token production rate, the studies mostly targeted instances of disruptive behavior and following rules for a pre-determined length of interval which ranged from 30 seconds to 50 minutes. Most studies implemented a 10 minutes interval (N = 4; 27%) for engaging in the appropriate behavior. One study used specific times for check-ins (Akin-Little & Little, 2004). The exchange production rate showed that students mostly traded-in at the end of an intervention session (N = 8; 53%) or at the end of the day (N = 5; 33%). Some studies provided the number tokens required before exchanging (De Martini-Scully et al., 2000) and a specific time after the intervention (Pennington & McComas, 2017). The token exchange rate was most commonly reported in the number of tokens (N = 9; 60%). Two studies (13%) used a system that allowed the students to trade in if they earned a number of tokens below a set criterion. The system incorporated positive punishment operations where teachers gave students a token when the student displayed undesirable behavior (Robichaux & Gresham, 2014; Wright & McCurdy, 2012). Two other studies (13%) allowed the students to trade in if they earned more points than the opponent team or the teacher (Lastrapes et al., 2018; Pennington & McComas, 2017). Two studies did not specify the token exchange rate (Christensen et al., 2004, 2007). The most commonly used cost of reinforcer was three or five tokens (N = 4; 27% each). Nine studies out of 19 (47%) utilized group contingency to provide access to a backup reinforcer.
Special education classroom
The search identified nine studies with a token economy system implemented in a special education classroom setting. Table 4 displays the token economy components of each study conducted in special education classrooms. All studies implemented points and small marks or items as tokens (e.g., stickers, pennies, and tickets). Most studies reported that backup reinforcers were individualized rather than communal. In other words, backup reinforcers were individualized per student based on individual preferences. Edibles and small tangibles were employed the most (N = 6; 67%) as backup reinforcers, followed by activities (N = 4; 44%) and mystery rewards/motivators (N = 2; 22%). Two studies (22%) did not report the type of back up reinforcers (Gann et al., 2015; Shepley et al., 2016), but one of the studies stated that they determined the reinforcers through student records and teacher recommendations (Shepley et al., 2016). 2 Seven of nine studies (78%) targeted classroom behavior and academically related behaviors while two studies (22%) targeted academic responding such as math word problems (Alter, 2012) and reading words (Shepley et al., 2016). One out of nine studies (11%) implemented response cost as part of the independent variable (Musser et al., 2001).
Token Economy in Special Education Classroom.
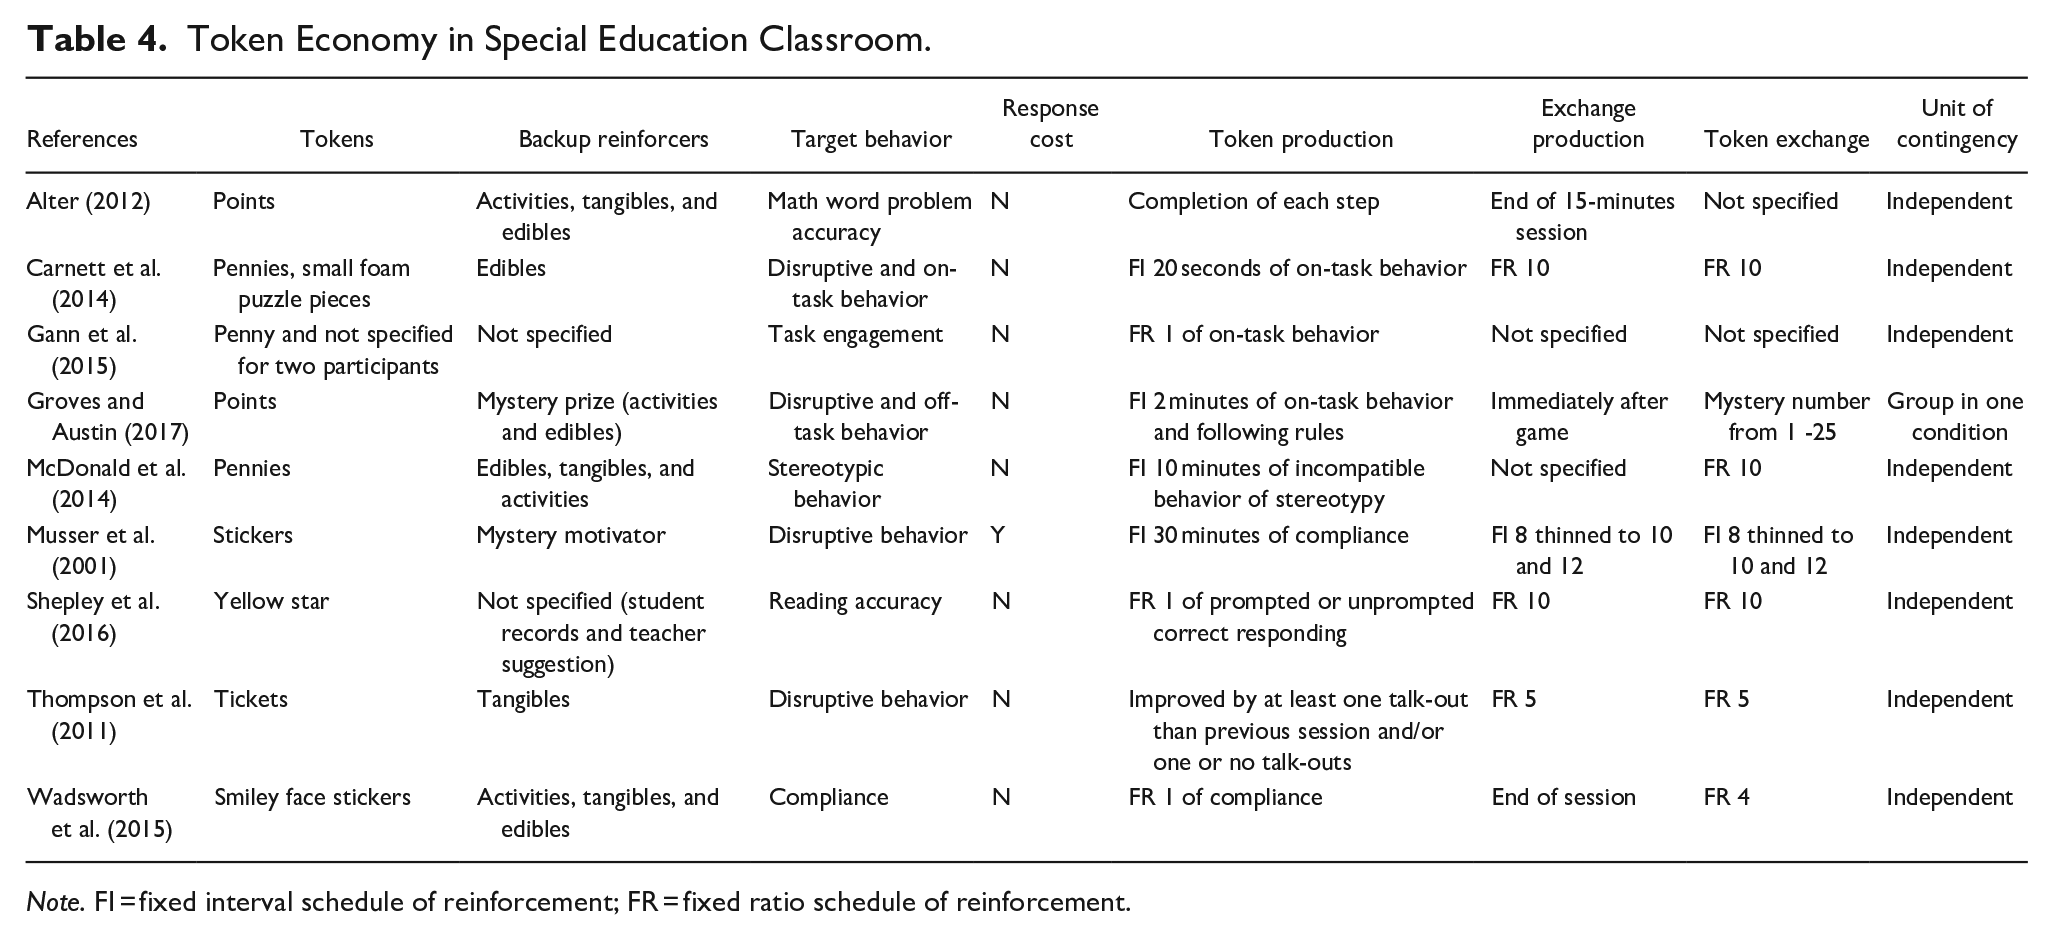
Note. FI = fixed interval schedule of reinforcement; FR = fixed ratio schedule of reinforcement.
For the token production rate, most studies targeted instances of correct target behavior or engaging in the appropriate behavior for an entire interval which ranged from 20 seconds to 30 minutes. Most commonly employed rate was one accurate target response for one token (N = 4; 44%). The exchange production rate showed that students mostly traded-in when they met a pre-determined number of tokens (N = 4; 44%) or at the end of a session, day, or week (N = 3; 33%). Two studies (22%) did not specify the exchange production rate (Gann et al., 2015; McDonald et al., 2014). The token exchange rate was most commonly reported in the number tokens (N = 6; 67%). The number of tokens ranged from 1 to 25. One study did not specify the token exchange rate (Gann et al., 2015). One out of nine studies (11%) implemented a group contingency to provide access to a backup reinforcer (Groves & Austin, 2017).
Question (2): Are Token Economy Systems Effective in Each Classroom Type?
Figure 2 displays the effect sizes and confidence intervals of each study in the order listed in Tables 3 and 4 with an average effect size for general and special education classroom type. On average, token economy systems had large effect sizes for both classroom types, indicating that token economy interventions were highly effective in decreasing inappropriate (e.g., disruptive behavior) and increasing appropriate (e.g., task engagement) behavior across general education and special education classrooms. Token economy studies conducted in special education classrooms demonstrated a slightly larger average effect size (M = 0.87) compared to general education classrooms (M = 0.83). Although the average effect size was larger in special education classrooms, average IRD effect sizes in both settings were large.
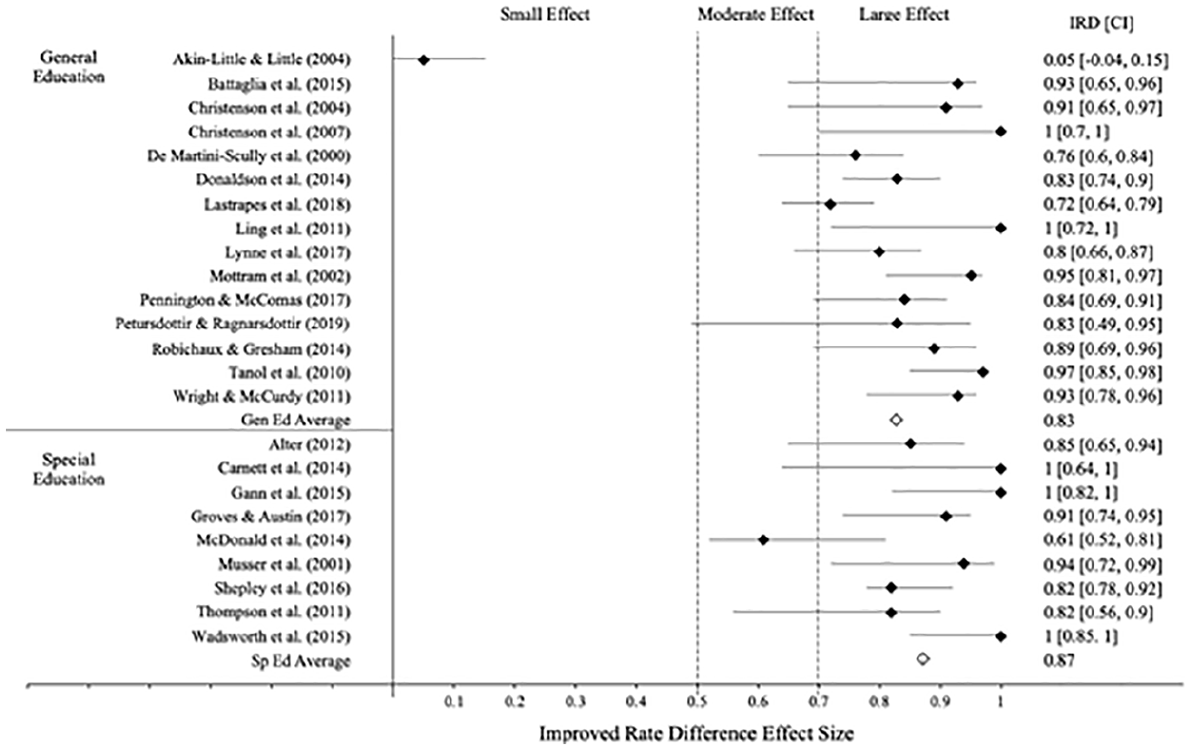
Effect size using improvement rate difference.
Additionally, studies conducted in general education classrooms had a slightly higher proportion of large effect size (93%; 14 out of 15 studies) compared to those in special education classrooms (89%; 8 out of 9 studies). The average effect size of general education classrooms may be lower due to one study that showed small effect size (Akin-Little & Little, 2004). This study examined the overjustification effect and researchers selected students who already demonstrated high levels of rule following, which in turn resulted in a greater degree of overlap between the baseline and treatment phases. Excluding this one study, all the studies conducted in general education classrooms showed large effect sizes. For studies conducted in special education classrooms, one study (11%) showed a moderate effect size.
Discussion
This systematic review and meta-analysis included 24 token economy studies and reported the token economy components across general and special education classrooms ranging from kindergarten to fifth grade along with the effect sizes of each study. Results of the review confirm that different token economy components are used for different classroom types, and that token economy yields large effect sizes in classroom settings, regardless of type of classroom. Given that token economy interventions are highly effective in changing behavior, the differences in token economy components point to optimal arrangements for the respective classroom type and point to areas for future research.
Summary of Findings
General and special education classrooms used similar type of tokens and backup reinforcers. Points, small marks, or small items were most commonly used, and the tokens were small, portable, and easily accessible in a classroom setting possibly for broader use across different target behaviors and settings. Edibles and small tangibles were most used as backup reinforcers. In a general education classroom, mystery rewards/motivators were second-most used while activities were more often used in a special education classroom. In a special education classroom, more concrete reinforcers such as edibles, tangibles, and activities were used, highlighting that students in special education classrooms may prefer more salient items or activities. The backup reinforcers used in general education classrooms were more communal while they were more individualized based on a student’s preference in special education classrooms.
Both classroom types mostly implemented a token economy system to address classroom behavior and academically related behaviors (e.g., following classroom rules, socially appropriate behavior, disruptive behavior, and on- and off-task behavior) rather than academic responding. The two studies that targeted academic skills such as reading (Alter, 2012; Shepley et al., 2016) were all conducted in special education classrooms and yielded large effect sizes (0.85 and 0.82, respectively).
Most token economies focused on positive reinforcement operations. Response cost (negative punishment operation) was more often used in a general education classroom compared to a special education classroom; however, across all classroom types, response cost was not often used as part of the independent variable. Interestingly, the two studies demonstrating moderate or small effect sizes (Akin-Little & Little, 2004; McDonald et al., 2014) did not use response cost, suggesting that token economies may be more effective when used in conjunction with response cost. The comparison would be stronger with a component analysis of token earn systems with and without response cost.
Regarding the token production rate, the studies in general education classrooms mostly measured instances of disruptive behavior while the studies in special education classrooms mostly measured instances of correct target behavior. Further, the required time of engagement in appropriate behavior for each interval was longer in general education classrooms (range, 30 seconds–50 minutes) than in special education classrooms (range, 20 seconds–30 minutes). However, studies did not specify how the researchers determined the rate.
Across both classroom types, a fixed time (FT) exchange production rate was most commonly used, which was set at the end of the day or after a session. Special education classrooms, however, often used a fixed rate (FR) exchange production rate where a pre-determined number of tokens was implemented. This may indicate that teachers in special education classrooms use a more concrete concept of number rather than the abstract concept of time to help students understand when they will be trading in. Regardless, in line with prior research, students in both classroom types preferred accumulated reinforcement (Frank-Crawford et al., 2019; Ward-Horner et al., 2017), or larger reinforcers delivered at a later time. Overall, the time it took to obtain the backup reinforcer was greater in general education classrooms, which is not surprising if we assume greater self-control among general education populations. Future research should directly compare the effects FT and FR exchange production rate to determine which schedule is more effective in increasing or decreasing responses and yield greater maintenance of the behavior change.
Regarding token exchange rate, the number of tokens required was most commonly used across all settings. However, in general education classrooms, the second-most used token exchange rate incorporated positive punishment procedure. The system allowed the students to trade in if they earned a number of tokens below the criteria and the students were given a token when they displayed undesirable behavior. Notably, social competition was also often employed to change the students’ behavior as the students needed to win their peers or teachers to gain access to reinforcers. The findings also showed that group contingencies were more often used in general education classrooms compared to special education classrooms. Only one study conducted in special education classrooms incorporated a group contingency (Groves & Austin, 2017). A recent meta-analysis showed that group contingencies were used in similar proportions across general and special education classrooms with large effect sizes (Little et al., 2015). The finding highlighted that group contingencies were in fact widely used across classroom types; however, group contingencies were less used in special education classrooms when used with token economies. There needs further research on the effects of a group contingency embedded in a token economy system in special education classrooms.
Implication for Future Practice
The findings suggested directions for future practice of token economies in each classroom type. Across both classroom types, many studies did not specify how they decided on a certain type of token or backup reinforcer. Formal preference assessments were not often reported and interventionists should strongly consider adding this element when implementing a token economy. Preference assessments allow better replicability and validity of the reinforcer selection (Piazza et al., 1996). Further, the findings showed that the majority of studies did not fade the time to access to tokens and/or backup reinforcers or response requirement over the course of the experiment. One study (Petursdottir & Ragnarsdottir, 2019) systematically faded the time it took to earn a token and number of tokens required to receive a backup reinforcer. The study showed large effect size, highlighting that fading would not negatively affect the effectiveness of a token economy. Thus, classrooms should develop token economy systems that systematically fade the time it takes to earn tokens and backup reinforcers to promote generalization and self-control. Past studies showed that systematically increasing the duration to access reinforcers can also promote self-control (Dixon & Falcomata, 2004; Fisher et al., 2000).
In general education classrooms, token economies were narrowly applied to behavior management. However, the two studies that utilized token economies to teach academic skills in special education classrooms showed large effect sizes, and thus, educators of general education classrooms should be encouraged to implement token economies for academic responding. Also, studies that used group contingencies were highly effective in general education classrooms, highlighting that educators could explore different types or variations of group contingencies or peer-yoked contingencies to make the token economy system more effective. Similarly, studies that employed response cost had large effect sizes. This means that educators can incorporate response cost into token economy practices without limiting the effectiveness.
Mystery rewards/reinforcers were used less often in special education classrooms as compared to general education classrooms. However, the studies using mystery rewards/reinforcers in special education classrooms (Groves & Austin, 2017; Musser et al., 2001) had large effect sizes similar to the ones in general education classrooms (Mottram et al., 2002; Robichaux & Gresham, 2014). The finding indicated that special education classrooms may benefit from using mystery rewards/reinforcers and should consider employing mystery rewards/reinforcers more frequently. The finding also suggested that more naturalistic and social reinforcers should be employed in special education classrooms, assuming that those stimuli function to reinforce behavior. This is important because the behavior would come under the control of the natural contingencies and thus facilitate maintenance of the behavior. Similarly, studies using social competition in general education had large effect sizes, and thus educators in special education classrooms should explore the use of social competition in token economies. Further, special education classrooms should be encouraged to incorporate group contingencies and response costs for token economies. The study with moderate effect size (McDonald et al., 2014) did not use response cost and the unit of contingency was independent. Hence, group contingencies and response cost may enhance the effectiveness of token economies in special education classrooms.
Implication for Future Research
The review suggests possible directions for future research. First, more studies should investigate the effects of token economies on academic instruction in general education classrooms. The two studies that utilized token economies to teach academic skills yielded large effect sizes, warranting the future use of token economies across various academic skills. Additional studies investigating the effects of token economy on academic responding would inform educators on how to use token economies when teaching academic skills and thus, broaden the scope of application for token economy systems in educational settings.
Second, there needs to be more research on how different types of behavior should produce tokens. This would require navigating the maximum response requirements students would be willing to engage without diminishing the perceived value of the reinforcer. Perhaps, making a decision tree to navigate the optimal token production rate depending on the response type or, in large, to arrange the token economy components should be encouraged. Additionally, as mentioned above, studies should develop token economy systems that systematically fade the time it takes to earn tokens and backup reinforcers to promote self-control. Further, a parametric analysis that compares different length of time it takes to obtain the backup reinforcer would provide more insight into an optimal exchange production rate.
Third, in extension to the point raised above, future research could develop a decision tree to determine optimal arrangements of token economy components based on settings and populations. A decision tree would function as a grid for educators and clinicians and allow a consistent method of token economy implementation, which would in turn encourage a consistent way of reporting token economies.
Fourth, researchers should study the effectiveness of token economies with mystery motivator/reinforcer and social competition in special education classrooms given that studies utilizing mystery motivator/reinforcer and social competition showed large effect sizes. Studies on mystery motivator/reinforcer and social competition in special education classrooms would help educators and clinicians effectively alter reinforcers and stimuli and discover novel ways to arrange token economy systems such as incorporating group and peer-yoked contingencies.
Fifth, a component analysis that compares token economies with and without response cost should be encouraged to further determine the effectiveness of response cost in token economies. To do this, researchers should vary the contingencies of the component analysis (e.g., reward and response cost) based on past research since studies showed that response cost affects different populations differently. For example, past studies showed that response cost improved math skills for students with Attention Deficit Hyperactivity Disorder (ADHD) compared to reward (Carlson et al., 2000).
Sixth, formal preference assessments to identify token types and backup reinforcers should be encouraged in token economy studies. This way, researchers can systematically replicate the procedures and increase validity in the use of the reinforcers.
Lastly, we encourage researchers to conduct more high-quality studies investigating the use of token economies in educational settings. Things to consider include but not limited to having sufficient IOA for each condition, having more than three data points in each phase, and demonstrating an intervention effect across at least three points in time. A large number of studies excluded when the WWC standards were applied inform researchers that future studies should better adhere to the minimal standards to ensure high-quality single-case research in applied settings.
Despite strong empirical support for token economies, many of the studies described the token economy components vaguely described or did not specify them, which is consistent with the findings by Ivy et al. (2017). The problem arises in both research and practice. In research, the problem would be especially evident in systematic replications as pointed by Ivy et al. (2017). Systematic replications involve repeating the experiment with variations of the intervention variables (Sidman, 1960). To determine the effectiveness of individual intervention variables, systematic replications rely on sufficient descriptions of intervention components. Insufficient description of all components may make future systematic replications difficult. In practice, without a clear operational description of the essential components of token economies, the procedure may not be accurately implemented, affecting the effectiveness of the intervention. For best practice and replication of studies, universalizing the terms and how the procedure is written should be encouraged (Gutierrez et al., 2020).
Limitations
The review is not without limitations. First, identifying and categorizing the token economy components (i.e., token production rate, exchange production rate, and token exchange rate) were difficult due to the variability in how studies reported these components. This points to the importance of creating a general guideline on how token economy studies should report the procedure. Also, identifying components of a token economy system is a subjective process and thus two reviewers may disagree whether a component was present or absent. To address this limitation, the researchers developed an operational definition for each component (Table 1).
Second, general education includes inclusive settings where students with special needs are part of the class with typically developing students (Szumski et al., 2017). While it continues to be an ambiguous term (Szumski et al., 2017), inclusive education has become more widely used and recommended since recent federal mandates holding the schools accountable for student achievement including students with disabilities (No Child Left Behind (NCLB), 2002) and special education law requiring students with disabilities to have access to general education curriculum (Individuals With Disabilities Education Act, 2004). This means that the general education classroom studies identified in the current review may include inclusive settings, which could potentially affect the effectiveness of token economies. Future studies should determine whether token economies conducted in inclusive settings differ from noninclusive general education classrooms to better inform educators on token economy use in these types of classrooms.
Conclusion
The purpose of this meta-analysis was to determine the effectiveness of token economy systems and which token economy component variations make the system most effective across general and special education classrooms across grade-levels from kindergarten to fifth grade. The results showed that token economies yield large effect sizes in general and special education classroom types with slightly larger average effect size in special education classrooms compared to general education classrooms. The results also demonstrated that there are variations in the token economy components depending on the classroom type, which shed light on the optimal use of token economies in each respective classroom. The findings suggest directions for future directions such as studies that directly compare component variations and consistent way of reporting the critical components for future replication and application. Identification of key components of token economy systems in different classroom settings may serve as the first step in developing an optimal token economy system across many settings and populations.
Supplemental Material
sj-docx-1-bmo-10.1177_01454455211058077 – Supplemental material for Systematic Review and Meta-Analysis of Token Economy Practices in K-5 Educational Settings, 2000 to 2019
Supplemental material, sj-docx-1-bmo-10.1177_01454455211058077 for Systematic Review and Meta-Analysis of Token Economy Practices in K-5 Educational Settings, 2000 to 2019 by Ji Young Kim, Daniel M. Fienup, Alice E. Oh and Ye Wang in Behavior Modification
Footnotes
Author Note
This paper is dedicated to the memory of Dr. Ye (Angel) Wang, who inspired students and colleagues alike.
Declaration of Conflicting Interests
The author(s) declared no potential conflicts of interest with respect to the research, authorship, and/or publication of this article.
Funding
The author(s) received no financial support for the research, authorship, and/or publication of this article.
Supplemental Material
Supplemental material for this article is available online.
Notes
Author Biographies
References
Supplementary Material
Please find the following supplemental material available below.
For Open Access articles published under a Creative Commons License, all supplemental material carries the same license as the article it is associated with.
For non-Open Access articles published, all supplemental material carries a non-exclusive license, and permission requests for re-use of supplemental material or any part of supplemental material shall be sent directly to the copyright owner as specified in the copyright notice associated with the article.