
Abstract
Introduction:
Reading Adventure Time!, formerly known as the pilot version of the iBraille Challenge Mobile App, is an educational technology tool integrating digital literacy to support braille reading and writing instruction for students in 1st–12th grades. Designed to operate on an Apple iPad with a refreshable braille display, Reading Adventure Time! uses gaming strategies to motivate students to improve literacy skills such as fluency, comprehension, writing dictation, and proofreading.
Methods:
The application (app) was developed under a Stepping Up Technology grant (H327S120007), which was disseminated to more than 50 teachers and students. Teachers and caregivers completed a Likert-type scale of technology skills as a pre- and postmeasure. Students’ reading speed, comprehension, and miscues were measured by the app.
Results:
Over 50 participants who used the app showed gains in reading and technology skills.
Discussion:
Students’ reading speeds, as measured by the app, mirror the reading speeds found in prior research (e.g., the ABC Braille Study). The impact on technology skills for teachers, caregivers, and students was much greater than anticipated.
Implications for practitioners:
The study provides evidence supporting Reading Adventure Time! as a supplemental intervention that addresses several reading skills and may be used in conjunction with a total, balanced literacy program.
Academic success is an important factor that leads to postsecondary education, employment, and independent living for all students. Students with visual impairments (i.e., those who are blind or have low vision) often use braille and specialized technology accommodations to access the general curriculum (Ferrell et al., 2014). Braille is acknowledged as an effective literacy tool (Musgrove & Yudin, 2013). However, research indicates some young children who read braille struggle, and they often perform in the bottom 25% in certain reading skills (Wall Emerson et al., 2009).
Technology supports access to information. Therefore, in addition to foundational reading skills, students who are visually impaired need exceptional technology skills, since proficient technology skills are imperative for academic (Babu & Singh, 2013; Read, 2012) and vocational success (Kelly, 2011). However, several barriers limit technology proficiency in individuals who are visually impaired. First, mainstream technology devices typically have a visual interface; thus, they cannot be accessed by students with visual impairments without screen readers or refreshable braille displays (Hong, 2012). Students using nonvisual interfaces must learn multiple steps to navigate the visual environment and use digital productivity tools (Read, 2012). Direct instruction and ample practice are necessary to facilitate students’ ability to navigate a digital world primarily designed for visual access. Also, teachers report a need for additional training in assistive technology to feel confident in being able to provide adequate instruction (Ajuwon et al., 2016).
An intervention that promotes both braille reading achievement and technology skills would support digital literacy for students with visual impairments. The braille mobile application (app) project began as a direct response to support this need. Development of the app was funded by the U.S. Office of Special Education, Stepping Up Technology grant (H327S120007). The 5-year project had the following goals: (a) develop an educational app that could be used as a supplemental braille reading tool; (b) provide equipment and training to teachers, caregivers, and students; (c) implement the technology and app in schools and at home; and (d) evaluate user experiences and skills.
Development of the app
Phase 1 of the project focused on the development of a technology-based intervention to improve students’ braille literacy skills. The blueprints of the project included platforms for reading and writing with assessments and activities. Development of the reading platform took place in Year 1, followed by a pilot test in Year 3, and development of the writing platform took place in Year 2, followed by a pilot test in Year 4. Data reflected in this article show results of Year 1 (development) and Year 3 (pilot testing) of the reading platform.
The reading portion of the app included an overall pre- and posttest (the placement test), eight progress-monitoring assessments, and three activities. The assessments measured reading speed, accuracy, and comprehension. Overall development (Phase 1) included an iterative process: develop, test, gather user feedback, refine, and retest, until user satisfaction level reached 80% of four quality indicators including ease of use, accessibility, overall quality, and relevance to improve literacy skills. Four school sites and five teachers of students with visual impairments participated in the development process. Teachers worked in a variety of settings (itinerant (n = 1), resource rooms (n = 2), and specialized schools for blind students (n = 2). In addition, one teacher had low vision, and one teacher who was blind read braille. At the end of Year 1, users each rated the app 5 out of 5 points on all four quality indicators.
Phase 2 involved large-scale pilot testing of the reading portion of the app, which took place in Year 3 of the project. The pilot test included professional development for teachers and a 16-week intervention. The following results are from the reading pilot study.
Method
A mixed-methods research design was used to investigate experiences with the app, teachers’ perceptions of technology skills, students’ achievements in reading, and caregivers’ technology skills. Guiding research questions were as follows: What effect did using the app have on teachers’ technology skills? With what level of fidelity was the app used? How appropriate was the app for the target audience? What effect did using the app have on students’ skills? What effect did using the app have on caregivers’ skills?
Recruitment and participants
Recruitment information was sent to professional electronic discussion groups and networks. Snowball sampling took place as professionals then disseminated information to regional discussion groups. All teachers were required to be certified teachers of students with visual impairments with skills in reading and writing in braille. Teachers were required to have a student on their caseload who read braille no more than two grade levels below their chronological age. Teachers were allowed to select the braille code with which the students were most familiar, English Braille, American Edition (EBAE) or Unified English Braille (UEB), and teachers were asked to maintain use of that code throughout the 16-week intervention. This study was approved by the Institutional Review Board at California State University, Los Angeles.
Procedures
This study had multiple phases and procedural steps. First, teachers rated their own skills on using a refreshable braille display with an iPad. Then, they completed a 3-hr training session on use of the app. They also received periodic professional development, including on-demand technical support and weekly, voluntary, hour-long webinars. Once trained, the teachers completed a reading placement test with their student or students. Upon completion of a placement test, the app provided a recommended reading level for each student. Teachers selected either the app-recommended level or overrode the recommendation and chose a level they felt was more appropriate. During the study, teachers and students worked together using the app twice a week for a minimum of 40 minutes per session for 16 weeks, an amount of time consistent with previous research (McCarthy et al., 2016). Every 2 weeks, teachers completed a progress-monitoring probe. During the 6th and 8th weeks of the intervention, teachers completed fidelity checklists. Finally, parents of the students who had been using the app were given the opportunity to participate in an 8-week summer intervention during which researchers trained them how to use the technology so they could work with their child twice a week for 40 minutes per session.
Data collection and analysis
For all tests described in this section, the alpha level was set at .05.
Demographic data
Demographic information was collected from participating teachers and students (e.g., age, grade, English learner status, visual prognosis, and presence of additional disabilities). Information was also gathered related to the instruction of students: school setting (e.g., urban, suburban, or rural), service delivery model, the amount of time spent in general education settings, preferred reading media or medium, primary and secondary literacy curriculum, and hours per week spent in literacy instruction by the general education teacher or the teacher of students with visual impairments. Descriptive statistics were run on all variables related to teacher and student demographics as well as all performance data.
Teachers’ self-rating of technology skills
Teachers were asked to rate their own technology skills using a Likert-type scale. Questions included items regarding general familiarity with and skills in using technology; skills in using VoiceOver, the screen reader that is built into Apple products, and skills in using a refreshable braille display paired with an iPad. Means and standard deviations were calculated on each of the five measures on the Self-Perception Rating Scale. An independent t-test was run comparing the preintervention rating and postintervention ratings (n = 14). Anecdotal comments also were collected and examined.
Procedural fidelity
Components of procedural fidelity were built into the app. For example, teachers were required to complete a technology training checklist that verified a minimum level of skill using VoiceOver and braille display. If teachers indicated they did not know how to do something on the list, then they were required to watch a researcher-developed video tutorial on the skill. Also, activities and passages were unveiled only after completing a specific sequence of steps. Teachers were asked to complete a procedural checklist with items regarding methods for administering the app and reviewing the scores with the students, which were discussed during training. Data from the procedural fidelity checklist showed teachers reached above 90% fidelity. Finally, procedural fidelity was analyzed regarding time spent using the app as an instructional tool. Descriptive statistics were run to determine the total amount of time participants spent using the app and how much time each student spent being assessed by the app and in each individual activity. Correlations were run to determine whether there were demographic characteristics of participants that had mutual or reciprocal relationships to the amount of time spent using the app, and also whether students who used the app more or participated in certain activities in the app more were likely to experience greater increases in comprehension and reading speed.
Placement test predictions
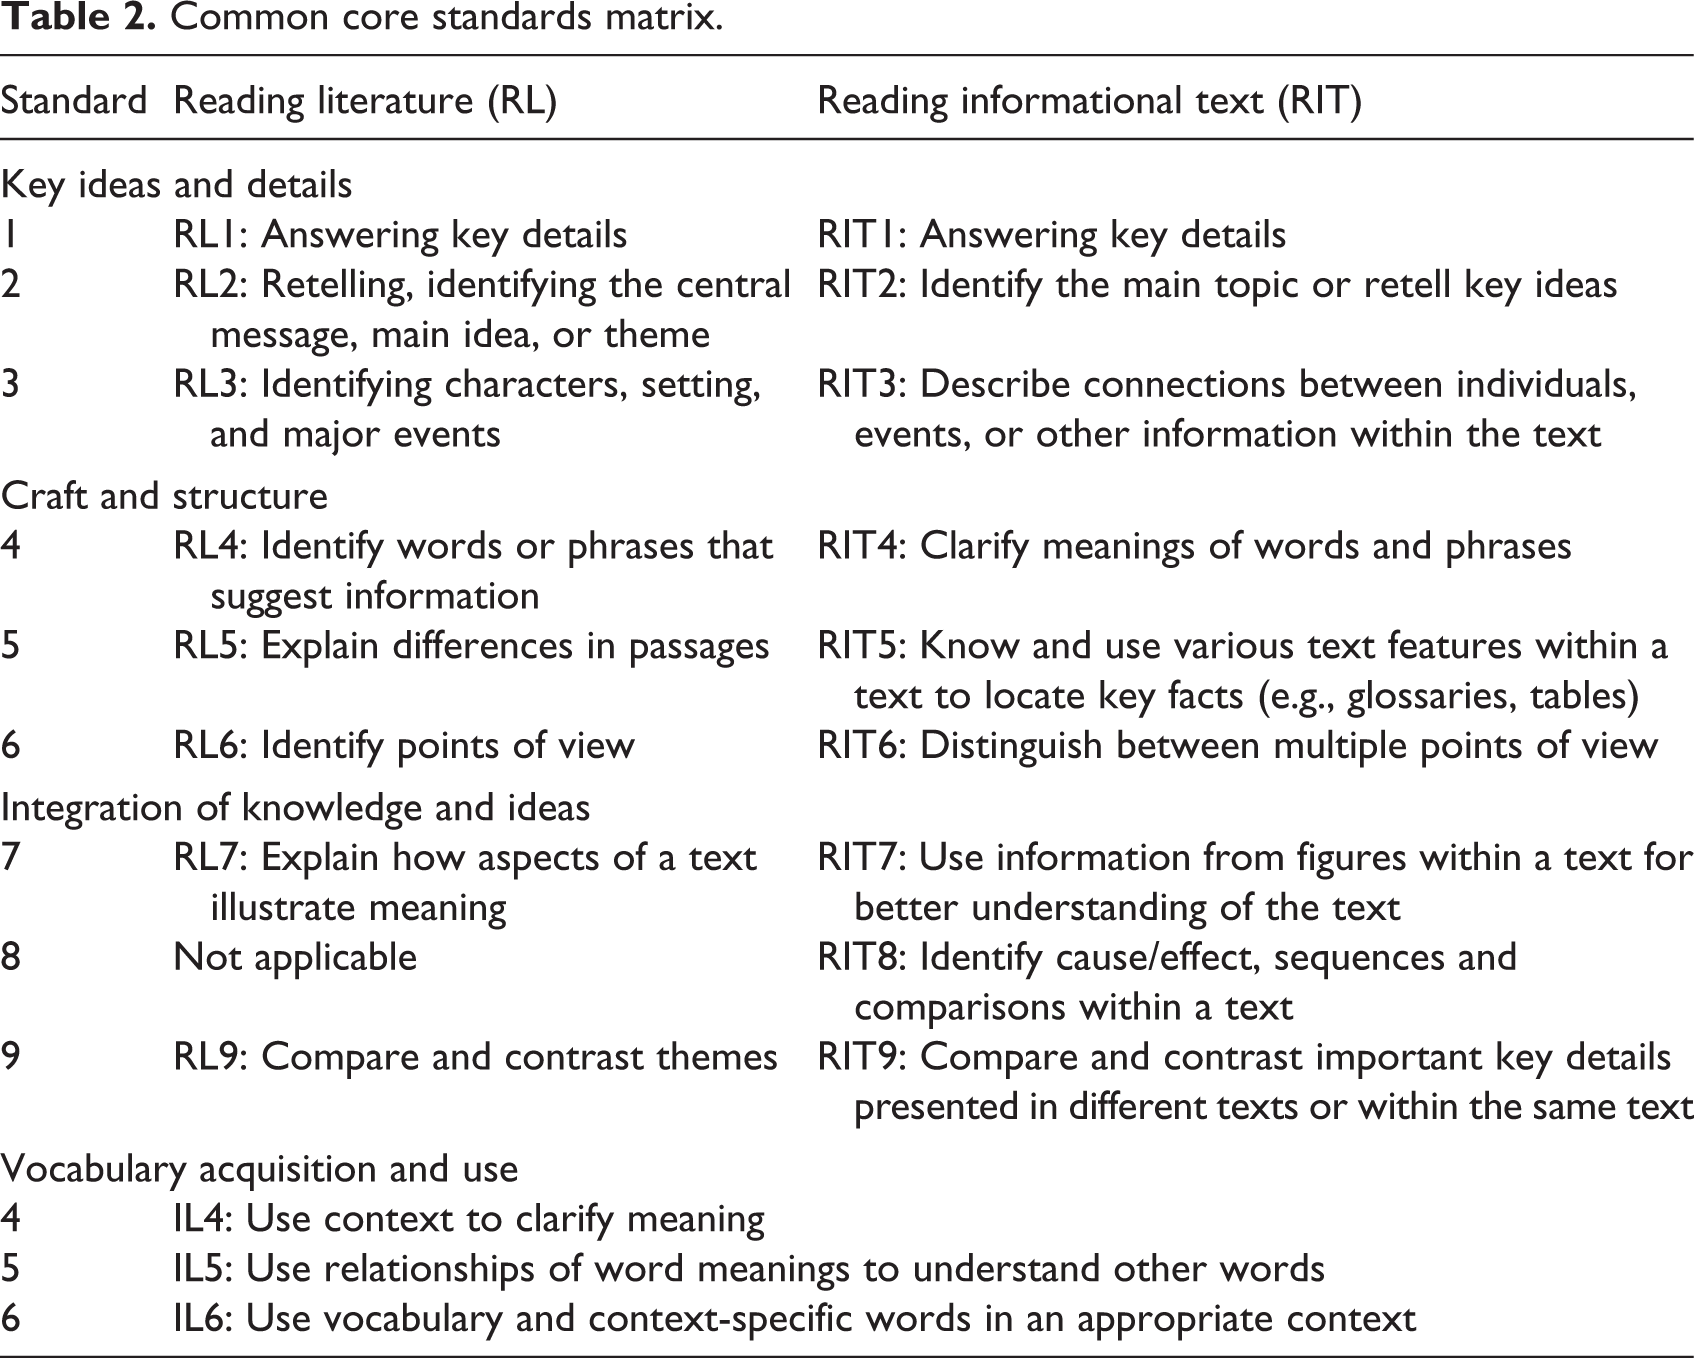
To identify reading level, students took a placement test, which consisted of two passages for each level within an age-group (see Table 1). The first passage was a narrative or fictional text, and the second passage was an expository or nonfictional text. Each passage measured five common core standards within the domains of key ideas and details and craft and structure (see Table 2) using multiple-choice comprehension questions. Students read aloud, and their oral reading was recorded and timed through the app. Using the audio recording of the student’s voice, the teacher was able to listen to the audio playback and code reading errors or miscues. Eleven types of errors were coded (see Table 3). Correlations were run to determine the percentage of time the app-suggested placement aligned with teachers’ perceptions of the proper placement. Additionally, a reliability analysis of the assessment questions was run using a point biserial correlation with Cronbach’s alpha.
Definitions of Braille Challenge classification and reading levels.
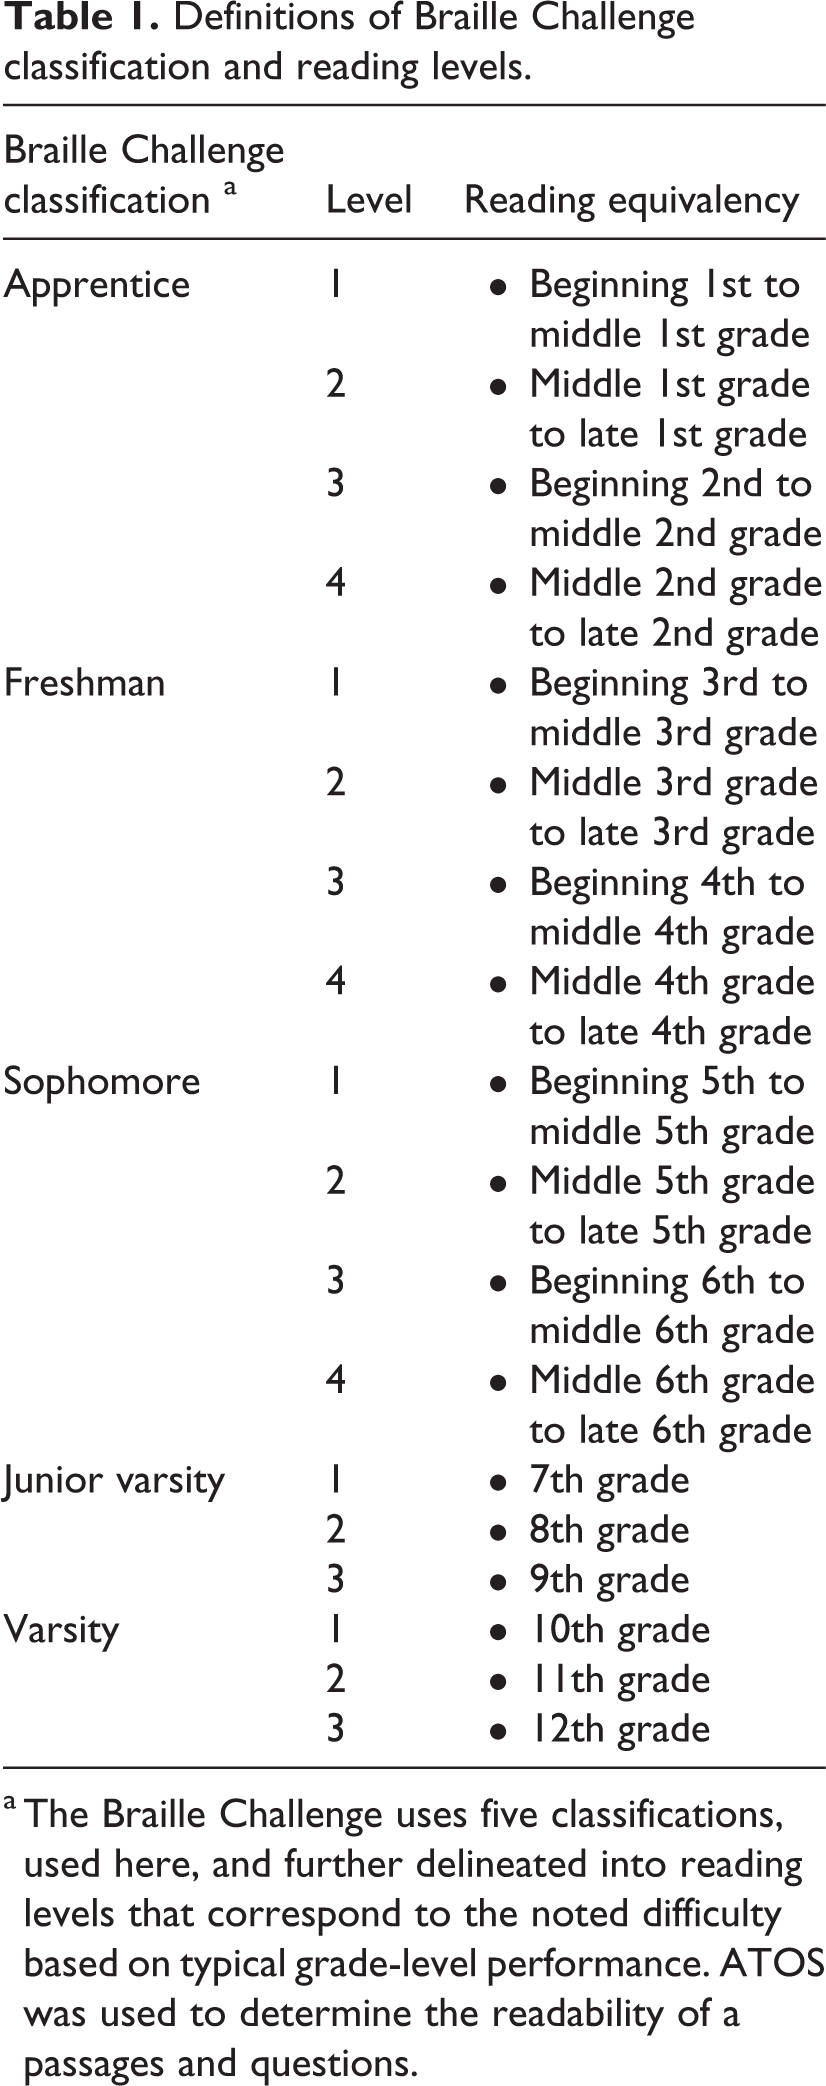
a The Braille Challenge uses five classifications, used here, and further delineated into reading levels that correspond to the noted difficulty based on typical grade-level performance. ATOS was used to determine the readability of a passages and questions.
Common core standards matrix.
Miscue definitions and examples.
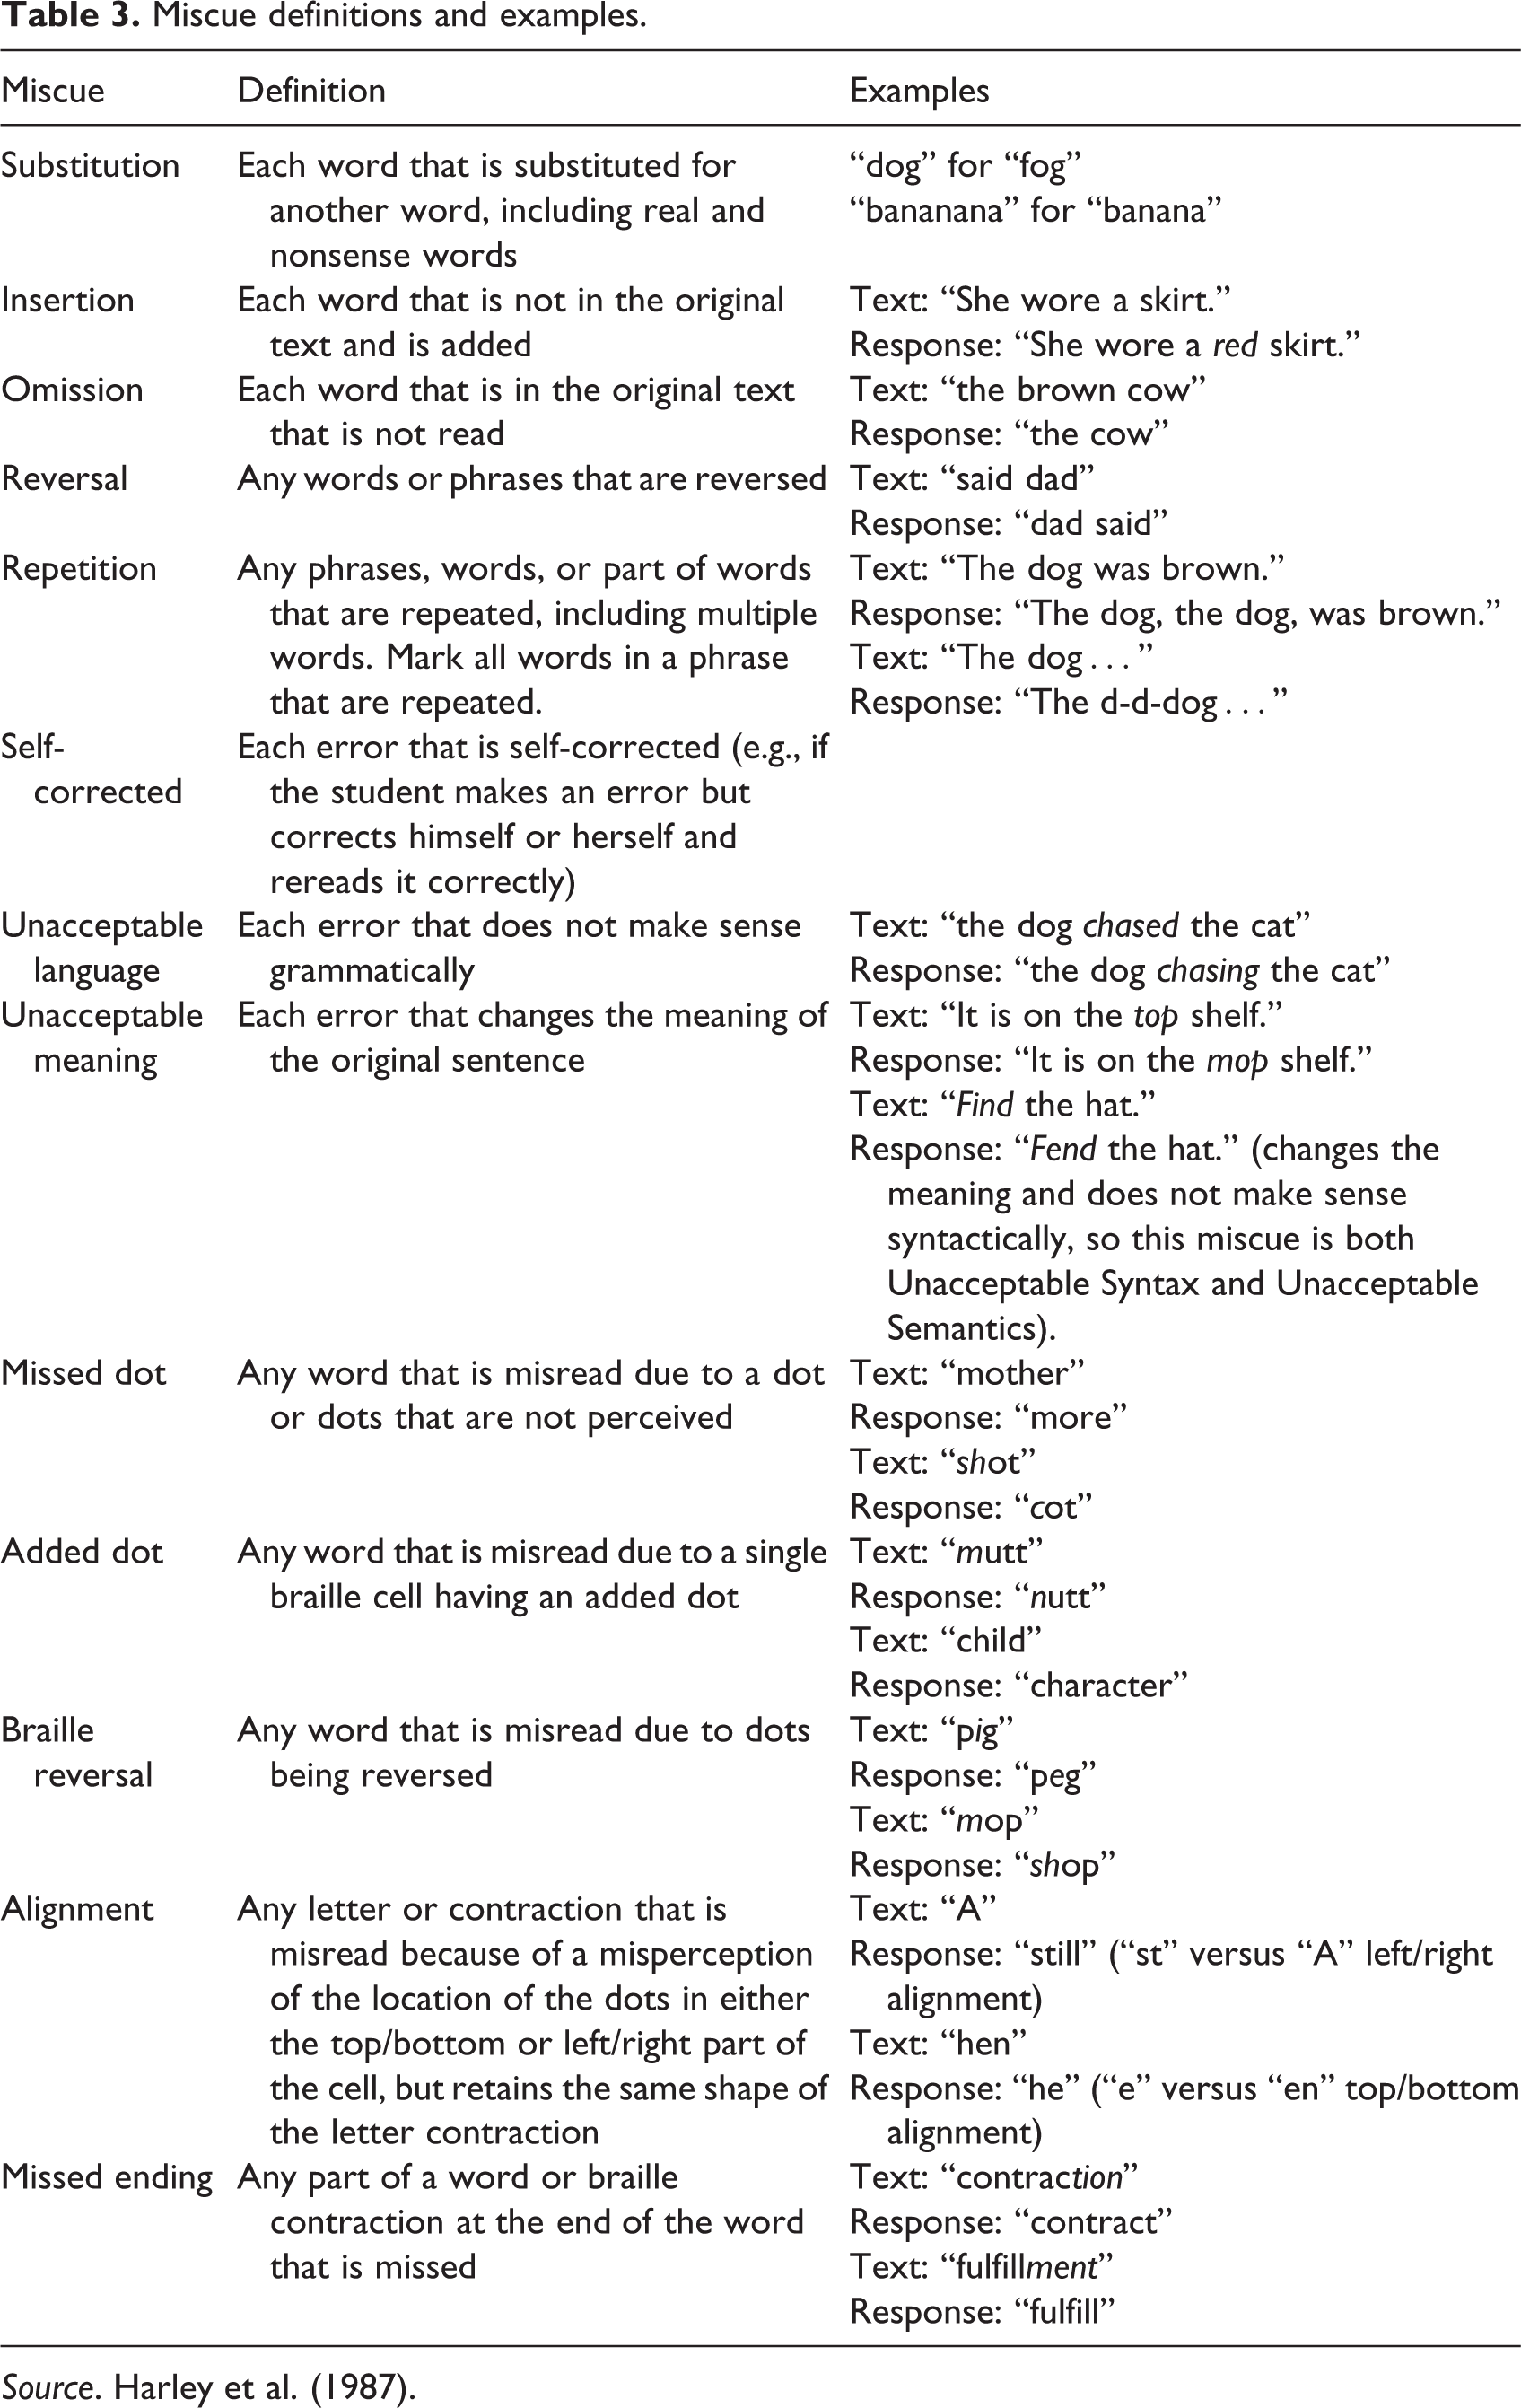
Source. Harley et al. (1987).
Students’ skills
Once errors were analyzed by the teacher, a results page was automatically generated in the app that included the following measures: (a) speed (in words per minute and correct words per minute), (b) accuracy (in the percentage of correctly read words), (c) reading comprehension (quantity and percentage of correctly answered questions and the correct or incorrect response related to each common core standard). Students were given eight progress-monitoring tests over the course of 16 weeks. These included four passages per test and measured 20 common core standard skills seen in Table 2. A fifth passage in each set was used to measure reading speed and accuracy; the procedures mirrored the test administration of the placement test. Descriptive statistics were run on the placement test as well as each progress-monitoring check. A t-test was used to assess whether there was a statistically significant difference between performance on the first and last narrative passage as well as the first and last expository passage. Correlations, a multiple regression, and growth modeling within hierarchical linear modeling were used to determine whether there were variables that were tied to more or less robust improvements in student skills throughout the 16-week intervention.
Caregivers’ technology skills
After students had used the app for 16 weeks, caregivers were invited to participate in an 8-week summer intervention. Caregivers were given a checklist of technology skills and were asked to rate their skills. After 8 weeks of using the app, they were asked to rerate their skills. Prior to beginning to use the technology at home, caregivers were given a checklist of 17 skills needed to operate the VoiceOver on the iPad with a refreshable braille display. Skills were categorized into three categories: (a) general iPad skills (8), (b) iPad settings and VoiceOver skills (10), and (c) braille display skills (6). Mean scores for the preintervention and postintervention were calculated in each category, along with the mean difference in scores.
Results
Demographic data
Teacher demographics
Fifty-nine teachers responded to the initial recruitment to participate in the study; 47 teachers were trained to use the app. Thirteen teachers who were trained dropped out prior to initiating the study. Ten teachers partially participated and 24 teachers fully completed the 16 week intervention. A variety of reasons accounted for the attrition of teacher participants, including students moving out of their local education agency (LEA), caseloads being reassigned, other individualized education program priorities taking precedence, and medical issues that prohibited participation. Teacher participants included representation in 20 different states, 22 different LEAs, and 1 home-schooled student. After the reading pilot (Phase 2), teachers who agreed to participate in the writing pilot test were given a follow-up survey, which asked them to rerate their skills. Fourteen of the 16 teachers who participated in both the reading and writing pilot studies responded to the technology skills survey. Demographics for teachers show a range of experience and background knowledge. Table 4 shows the general range of experience and background knowledge of the overall group of teachers in comparison to the 14 teachers who participated in the pilot reading and writing tests.
Demographics of the teachers.
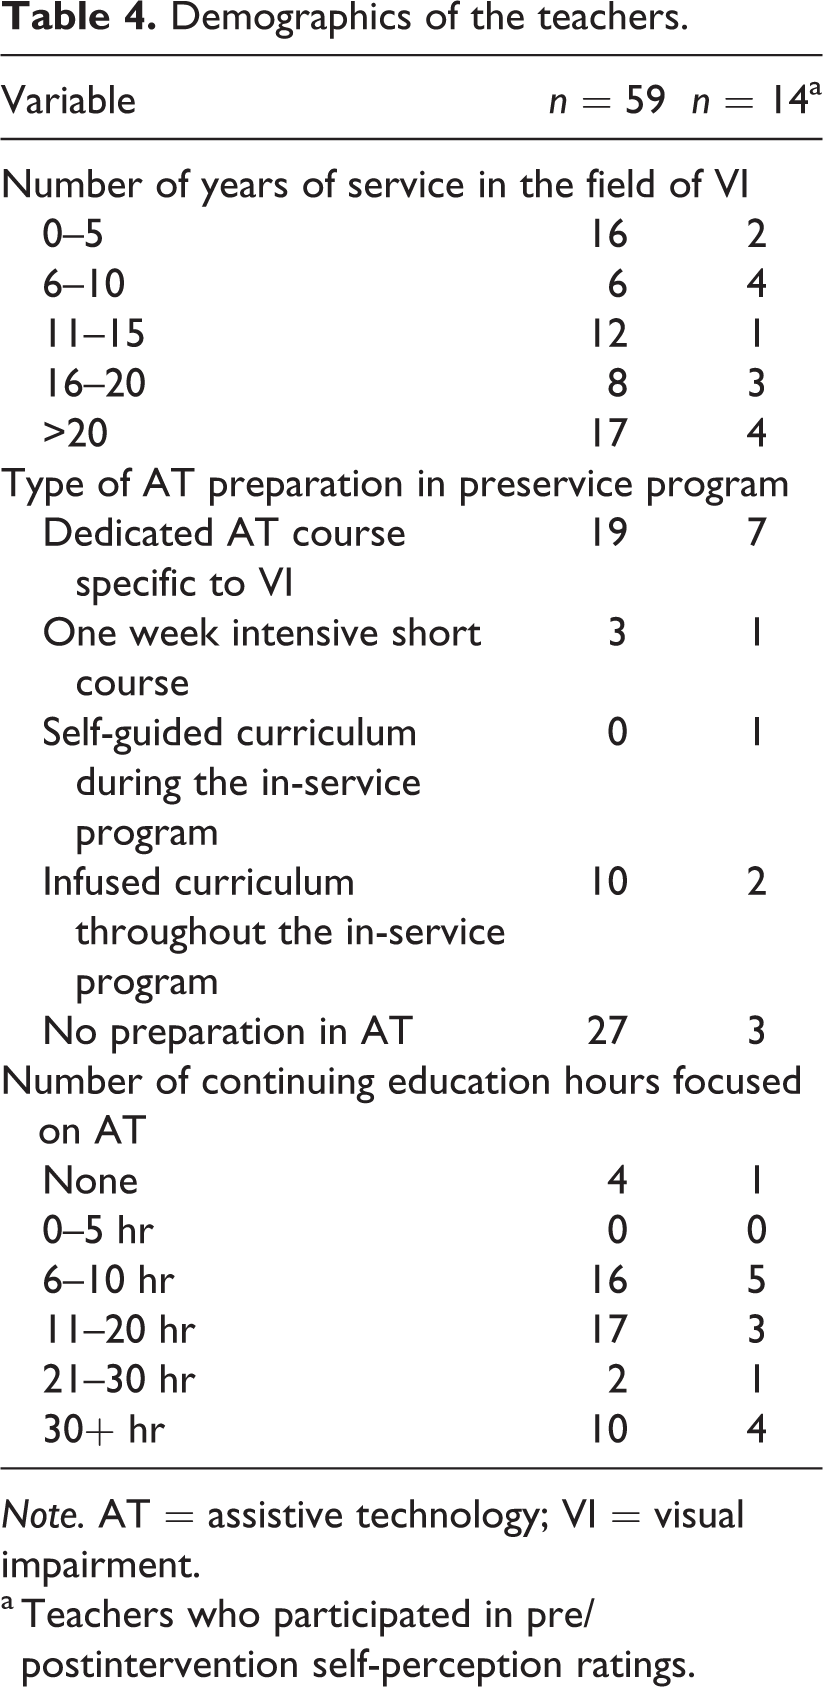
Note. AT = assistive technology; VI = visual impairment.
a Teachers who participated in pre/postintervention self-perception ratings.
Student participants
A total of 59 students participated in this study, 52 of whom completed the study. Seven participants withdrew from the study after completing the training. Student participants were 1st through 12th graders who read braille and ranged from 7.9 years of age to 18.0 years of age. Nine (17.3%) participating students identified as English language learners, while the remaining 43 (82.7%) students did not. Fourteen (26.9%) students had disabilities in addition to a visual impairment; 39 (73.1%) students did not. Since this study began after UEB was officially adopted but before full implementation, students could choose UEB or EBAE. Forty-five (86.5%) students participated using UEB; 7 (13.5%) participated using EBAE. One (1.9%) student began the study using EBAE and switched to UEB before completing the study. Thirty-four (65.4%) students participating in this study received the services of an itinerant teacher of students with visual impairments, 1 (1.9%) student received services in a resource room specifically for visually impaired students, 1 (1.9%) student attended a special day class, and 16 (30.8%) attended a specialized school for blind students.
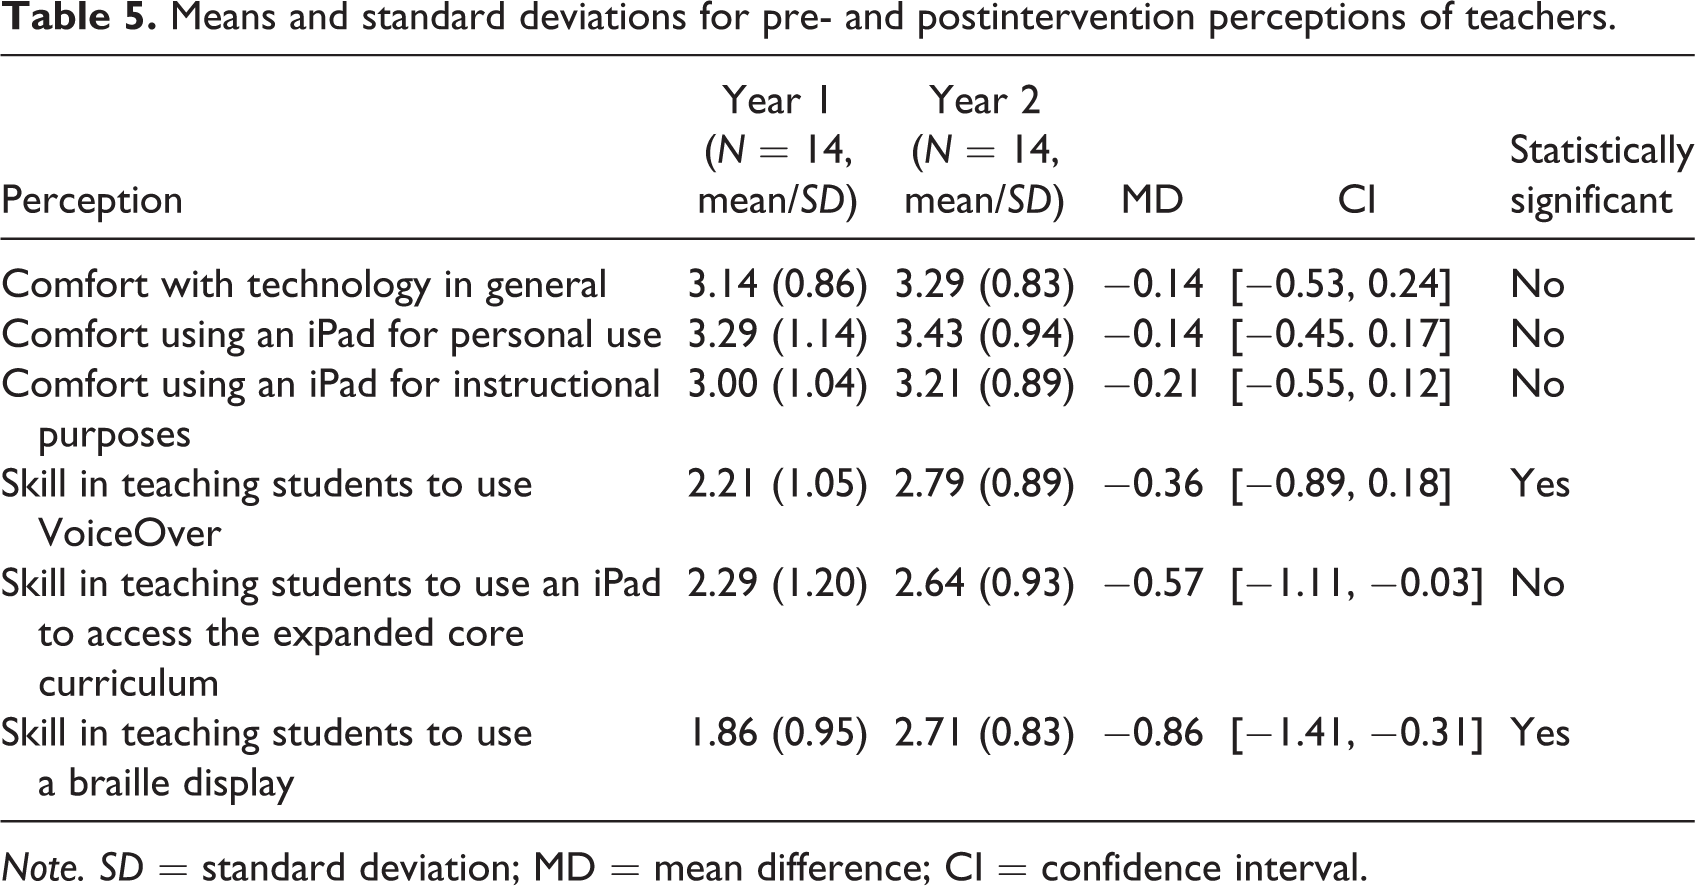
Teachers’ self-rating of technology skills
Using a self-perception rating at the beginning of the study and 1 year later, teachers were asked five questions pertaining to their comfort level with technology and their skills (see Table 5). Data revealed teachers were generally comfortable and confident in their skill level in teaching general iPad skills; scores indicated a high level of skill and comfort, with scores generally ranging between 3 and 4 on a 4-point rating scale. However, the essential skills to teach students who use braille as their primary medium are VoiceOver and braille display technology, both of which teachers felt less skilled at teaching, with scores generally ranging between 1 and 3.
Means and standard deviations for pre- and postintervention perceptions of teachers.
Note. SD = standard deviation; MD = mean difference; CI = confidence interval.
Data showed there was a statistically significant difference between preintervention and postintervention on two teacher measures: teaching VoiceOver to students, T(14) = 2.2804, p = .04, 95% CI [−1.11, −0.03], and teaching students to use a braille display, T(14), p = .0049, 95% CI [−1.41, −.031].
Time spent using the app
As part of procedural fidelity, two measures were in place. First, teachers had to report 90% procedural fidelity, based on a checklist, to continue using the app. If less than 90% was achieved, they were prompted to review the procedures. Second, time spent using the app was measured. On average, during the 8-week intervention period, student participants spent 340.04 minutes (range 14.48–1,015.98 minutes) taking assessments and completing activities in the app. The average amount of time student participants spent engaged in completing assessments was 314.10 minutes (range 11.12–1,015.98 minutes). The average amount of time student participants spent engaged in learning activities within the app was 25.95 minutes (range 0.00–173.03 minutes).
Certain demographic characteristics of participants were correlated with increased time spent using the app as measured by Pearson, two-tailed correlations. There was a negative correlation between the participants’ placement age and the total time spent using the app (−.271, p = .05), indicating that participants with lower placement levels were more likely to use the app than participants placed in an upper level. There was a statistically significant positive correlation for the total amount of time spent using the app and the amount of time participants spent in the general education setting (.32, p = .02), students who were at a Title 1 school (.29, p = .02), and participants who were proficient in English (.41, p = .04).
Two demographic variables were statistically significantly correlated with the amount of time spent completing assessments within the app. There was a statistically significant negative correlation between the amount of time participants spent taking the placement assessments and participants who were dual print and braille readers (−.299, p = .03). Meanwhile, there was a statistically significant positive correlation between the amount of time participants spent taking challenge assessments and the primary reading medium of the participants (2.76, p = .03). Although the bulk of all participants’ time was spent completing assessment activities, demographic characteristics of participants were correlated with participants engaging in learning activities within the app.
Placement test recommendations
Placement test data
The first task the students completed after being introduced to the app was to take a placement test to guide the level of activities in which the students should participate. Using the Braille Challenge classifications for student age, students were categorized into five categories: apprentice, freshman, sophomore, junior varsity, and varsity (see Table 1).
By grade in school, 7 students (13.2%) were classified as apprentice, 19 students (35.8%) were classified as freshmen, 12 students (23.1%) were classified as sophomores, 11 students (20.8%) were classified as junior varsity, and 3 students (5.7%) were classified as varsity by grade in school. A different category was recommended for some students on the basis of the placement test, and some teachers chose to override the recommendation made by the app. Nonetheless, all classifications, whether on the basis of grade in school, performance on the placement test, or placement by the teacher’s override, were found to be highly statistically significant when using a Pearson, two-tailed correlation (see Table 6).
Placement correlations.
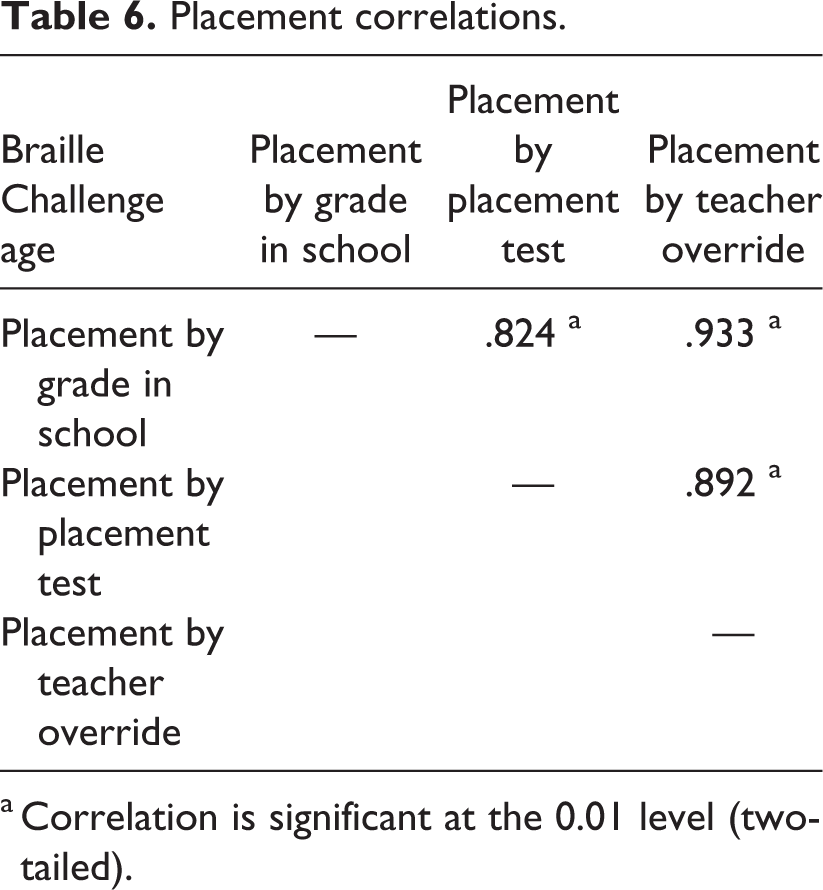
a Correlation is significant at the 0.01 level (two-tailed).
Students’ skills
Aggregate student performance data
After completing the placement test, students participated in eight sets of reading assessments. Each set contained five passages for which the students answered comprehension questions. The passages and comprehension questions progressively increased in difficulty as the students moved from Set 1 to Set 8.
There was no statistically significant increase in speed during the 16-week intervention, but generally speaking, the average reading speeds of students did show a slight increase from Week 1 to Week 16 despite the increasing difficulty of passages (see Table 7). Similarly, there was a slight decrease in the number of miscues, an average of 9.4 miscues in Set 1 and an average of 6.7 miscues in Set 8. Student participants also showed a slight improvement in the average number of questions answered correctly for expository text, an average of 4.0 questions answered correctly in Set 1 and an average of 4.3 questions answered correctly in Set 8. The average number of questions answered correctly for literary text was 4.0 in Set 1, as well as in Set 8.
Average words per minute.
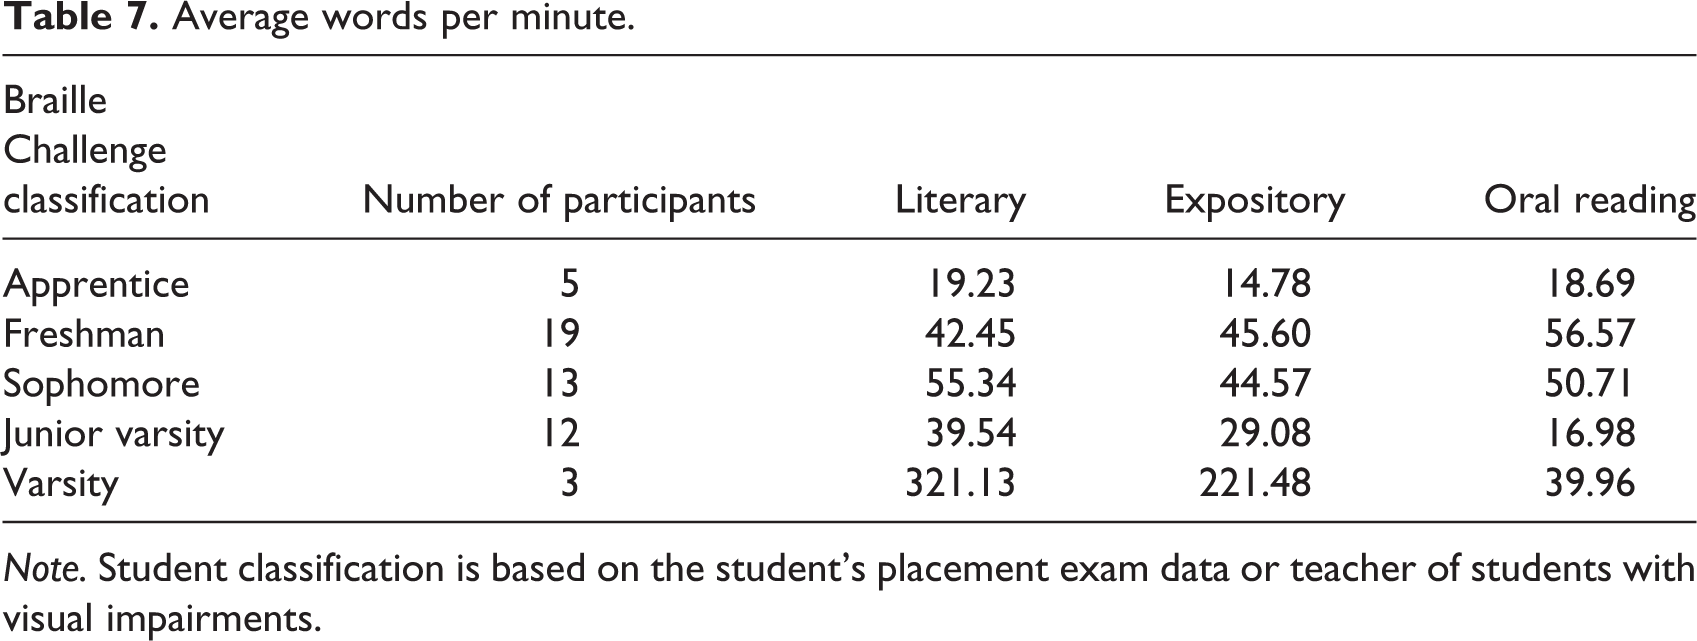
Note. Student classification is based on the student’s placement exam data or teacher of students with visual impairments.
Caregivers’ technology skills
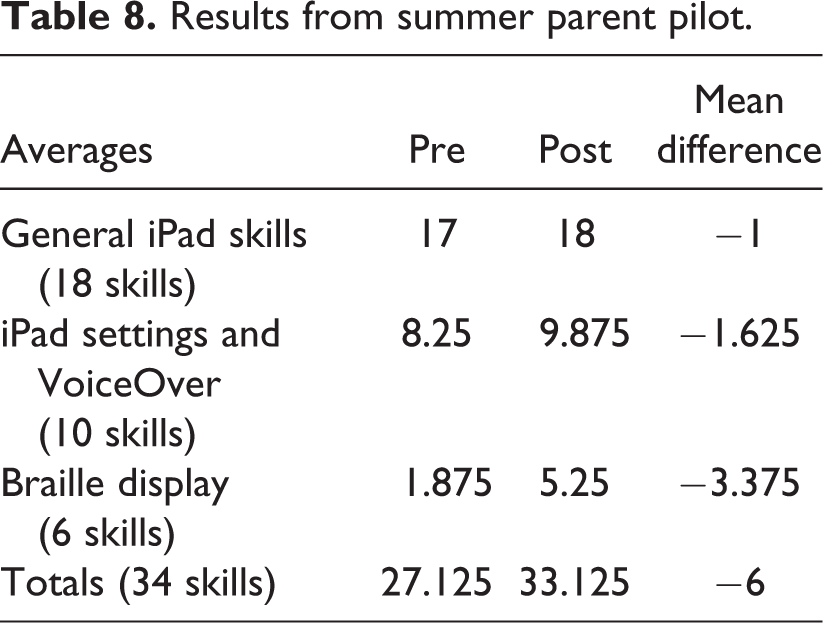
Eight student-caregiver dyads completed an 8-week summer pilot program. Caregivers were asked to rate their technology skills at the start and end of the 8-week program. Results showed caregivers had strong general iPad skills, but were less skilled at using VoiceOver, controlling the settings, and using a braille display. At the end of the 8-week intervention, caregivers showed growth in their overall skills (see Table 8).
Results from summer parent pilot.
Discussion
This article highlights the effect of a braille mobile app implementation project on teachers, students, and caregivers and the efficacy of using the braille mobile app. Notable are the gains achieved by teachers who used the technology. However, generally speaking, teachers who participated in the study had a great commitment to professional growth, as noted by the number of hours dedicated toward learning to use technology.
With regard to the amount of time spent using the app, two important correlations should be mentioned. First, the correlation between teacher-recommended and app-recommended reading level may be seen as an indicator of effective content validity, meaning the placement test that is meant to determine the appropriate grade level of materials is in sync with the teachers’ perceptions of the corresponding grade level, thus indicating that the grade level of the content is what teachers expect the grade level of materials to be. The second notable correlation is that time spent in general education was positively correlated to time spent using the app. This finding may indicate that teachers of students with visual impairments may be using the app as a tool to supplement and enhance the current reading program of students who spend a significant amount of time in general education.
In regard to students’ performance in reading speed, accuracy, and comprehension, results support past research indicating overall slow reading rates. It should be noted that overall reading comprehension scores are not significantly low, despite slow reading rates. Students are able to gather meaning with good comprehension. The number of minutes dedicated to the assessments within the app, in contrast to the number of minutes spent in the activities, in combination with the slow reading rates, calls into question how time is spent in general. If students are reading with slow reading rates and spending a significant amount of time completing assessments, is there an adequate amount of time available to provide instruction? In this particular study, students were asked to complete one assessment every 2 weeks. However, the time spent in the assessment portion of the app indicates students were spending the majority of their time taking the assessment and, therefore, they could not participate in the activities.
The app included content for reading levels 1st–12th grade. Data indicated a negative correlation between age and number of minutes using the app, showing that during this project younger students were more likely to use the app than older students. There are several possible explanations for this finding. First, teachers and younger students may have been able to participate in the study, but students in older grades could not because of time and schedule constraints. Second, students who were reading at elementary grade levels may have needed more skill-based remediation than students with more fully developed literacy skills. Third, the authors interpret the data to imply the content in the app may have been more engaging for younger students or students reading at lower grade levels.
Limitations
As with any research, there are limitations to this study. Although procedural fidelity was built into the structure of the app and implementation fidelity was measured with a checklist, results indicate time spent on intervention was less than expected, and is reflected in completion rates. Regarding the amount of time spent using the app, this measure was calculated by counting the number of seconds the app was open on a screen with passages and questions. The measurement may be an overestimate of the amount of time spent reading and answering questions (e.g., if a child took a break or the teacher provided instruction while the screen was open). Conversely, the time does not reflect the entirety of instructional time because the measure does not include time spent with the app before or after reading passages and answering questions. Teachers may have spent time providing instruction prior to using the app (e.g., technology or vocabulary), or they may have given students performance-based feedback after completing the assessments, which is not included in the calculations. That said, the amount of time reported in the results only reflects time spent on a passage or question screen within the app and is an underestimate of the actual time spent during instruction. An additional limitation is the lack of information regarding students’ technology skills. In retrospect, authors would plan to collect pre- and posttest intervention measures of students’ technology skills. Without these data, the impact of the program on students’ technology skills or use of technology is not measurable. Third, researchers did not gather a full set of data in regard to teachers’ skills, which would provide additional important information on teachers’ growth in skills over time.
Footnotes
Declaration of conflicting interests
The author(s) declared no potential conflicts of interest with respect to the research, authorship, and/or publication of this article.
Funding
The author(s) received no financial support for the research, authorship, and/or publication of this article.