
Abstract
Keywords
Participation and achievement in high school mathematics classes can propel students toward pursuits in the fields of science, technology, engineering, and mathematics (STEM) or limit students’ access to STEM majors and STEM-related employment (Buckley, 2010). Students who take advanced math classes in high school generally score higher on math achievement tests and college admissions tests (Brown et al., 2018). They are also more likely to attend and complete college, choose STEM majors, complete STEM degrees, and pursue STEM careers (Byun et al., 2015; Fletcher & Tyson, 2017; Green & Sanderson, 2018; Jia, 2019; Ogut & Circi, 2023; Redmond-Sanogo et al., 2016). However, the benefits of completing advanced math classes in high school are not limited to students with STEM aspirations. Indeed, high school math classes provide opportunities for students to learn quantitative reasoning skills that adults need to make informed decisions as citizens and consumers (Buckley, 2010). Students also develop logic and problem-solving skills in high school math classes that employers value within and outside of traditional STEM fields (Rose & Betts, 2004; Torpey, 2012). Furthermore, there is a positive association between successful completion of advanced math classes in high school and long-term earning power (Beede et al., 2011; Melguizo & Wolniak, 2012; Olitsky, 2014; Rose & Betts, 2004).
Which math classes a high school student takes, in what grade, and in which order can vary greatly, since students are not required to take math classes in a particular order, some U.S. states require three high school math classes for graduation, while other states require four, and not every school offers every option (Education Strategy Group et al., 2022; Han et al., 2023). At the same time, it is increasingly likely for U.S. students to take a for-college-credit math class (e.g., advanced placement [AP] or dual enrollment) while in high school (National Center for Education Statistics [NCES], 2019).
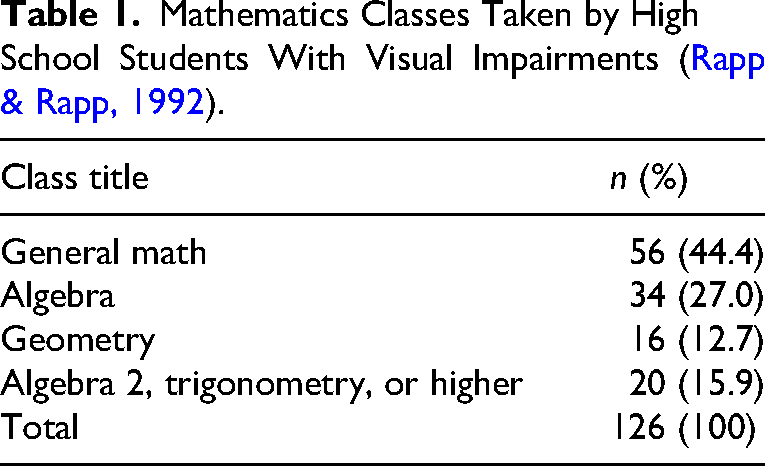
Participation and achievement in high school math classes among students with visual impairments is difficult, if not impossible, to determine using data reported by states, since many states only provide aggregated data for students with disabilities. Rapp and Rapp (1992) estimated participation rates in high school math classes among students with visual impairments using data collected from 72 teachers of students with visual impairments in New England (a geographical term referring to the northeastern United States) who supported high school students during the 1988–1989 academic year. See Table 1 for counts of students enrolled in general education math courses. Inferences from Rapp and Rapp's study (1992) are limited by the age of the study, the narrow geographical diversity, and the fact that the survey instrument used did not connect students’ grade level to the math classes in which they were enrolled, yet their study is frequently cited in research (Bouck et al., 2013; Herzberg & McBride, 2023; Kelly, 2009; McBride & Diamond, 2020; Rosenblum et al., 2019).
Mathematics Classes Taken by High School Students With Visual Impairments (Rapp & Rapp, 1992).
Students with visual impairments taking high school math classes are often supported by itinerant teachers of students with visual impairments who provide direct instruction in compensatory skills needed to access math content (Pogrund et al., 2019; Spungin et al., 2017). In addition, teachers of students with visual impairments routinely coordinate with math teachers, paraeducators, and transcribers to ensure their students have accessible materials, tools, and technology necessary for math learning (Herzberg & McBride, 2023; Spungin et al., 2017). The level of support provided to a student by a teacher of students with visual impairments varies depending on the severity of the student's visual impairment, the student's proficiency in math, the student's need for concrete materials to acquire new math skills, and the preparedness of the general education math teacher for including the student in the math classroom (Herzberg & McBride, 2023; Spungin et al., 2017). Itinerant teachers of students with visual impairments are typically not responsible for teaching math content. However, the line between supporting a student's math learning and teaching math content may not always be clear (Rosenblum et al., 2018). Some teachers of students with visual impairments spend several hours each week providing instruction or tutoring in math, which can pose a problem, since not every teacher of students with visual impairments is, or should be expected to be, an expert in math content and pedagogy (Suvak, 2004; Wolffe et al., 2002).
General education math teachers are responsible for providing direct instruction in math content. However, not every math teacher has the appropriate level of training or experience in teaching students with visual impairments. To successfully include students with visual impairments in classroom instruction and learning activities, math teachers may need to modify their behaviors. Math teachers can adjust their instructional delivery method by supplementing gesticulations with verbal information; using explicit language, especially when verbalizing equations; providing slides and lecture notes to students in advance; and clearly articulating information that is presented visually (Isaacson et al., 2011; Stone et al., 2019; Whitburn, 2014). Math teachers should provide teachers of students with visual impairments the instructional materials that need to be adapted into accessible formats with sufficient lead time. However, research has shown that some math teachers do not plan their lessons far enough in advance for teachers of students with visual impairments or other school personnel (e.g., braillists or paraeducators) to produce or procure materials in accessible formats (Correa-Torres & Howell, 2004; Herzberg & McBride, 2023, 2024; Rapp & Rapp, 1992; Rosenblum & Amato, 2004; Whitburn, 2014).
The purpose of the study presented here was to explore the experiences of itinerant teachers of students with visual impairments in supporting the math learning of high school students on their caseloads.
The following research questions guided this study:
Which general education math classes were high school students with visual impairments enrolled in? What supports did teachers of students with visual impairments and paraeducators provide to students with visual impairments enrolled in math classes? What helped high school students with visual impairments be successful in their general education math classes? What barriers or challenges did high school students with visual impairments encounter that inhibited their full participation in their general education math class or classes?
Method
Instrument
A survey was constructed using the online survey tool Qualtrics. In the first section, respondents were asked to give consent and provide demographic information. In the second section, respondents were asked to answer questions about whether they or a paraeducator attended math classes with their high school students or assisted them in completing math assignments. For the remainder of this article, the term “students” is used to refer to high school students who are blind or have low vision who are taking an academic-level math class (e.g., algebra, geometry, trigonometry) and receiving direct or consultative services from one of the respondents. In the third section of the survey, respondents answered three questions about individual students. The questions were:
What was the student's primary literacy media (audio, braille, dual media, or large print) used in math classes? What was the student's grade level? Which math class or classes did the student take during the 2022–2023 school year?
In the last section of the survey, participants answered two open-ended questions about factors that facilitated or impeded student learning in math classes.
Recruitment
This study was approved by the Institutional Review Boards of Georgia State University and University of South Carolina Upstate. There were two criteria for participation: (a) serving as an itinerant teacher of students with visual impairments in the United States or its territories in fall 2022 and (b) having at least one high school student on their caseload who was taking a general education math class. The survey was advertised in social media posts through, for example, the Teacher of the Visually Impaired Facebook group, X (formerly known as Twitter), emails sent directly to colleagues, and through messages broadcast via electronic discussion groups and mailing lists (e.g., Project INSPIRE, AER-Net). Individuals were encouraged to forward the advertisement describing the survey, which included a link to the survey, to colleagues. The survey was open from September 2022 through January 2023. Participation was voluntary, and respondents received no monetary compensation for their participation.
Data Analysis
The quantitative and categorical data were analyzed in Microsoft Excel spreadsheet software to determine counts and percentages. Ten respondents selected “other” when asked to identify their student's math class. In each of these cases, the researchers used the open-text responses and the STEM course categorization scheme provided in Appendix A of Brown et al. (2018). For example, three “integrated math 3” classes were categorized as “algebra 2.” Twelve respondents made multiple selections for the math classes a student was taking. The researchers could not determine whether the student was taking more than one math class or if the respondent was selecting all the content covered in a single math class, so the highest level math class indicated by the respondent was used.
For comparisons to the population of all U.S. students, the authors referred to Brown et al. (2018) who analyzed transcript data from the High School Longitudinal Study of 2009 (HSLS:2009). HSLS:2009 provides the most current data for a cohort of U.S. high school students from Grades 9 through 12, and it is widely available for analysis (Brown et al., 2018). The NCES conducted a retrospective study based on the high school transcripts of 2019 high school graduates, but those data are currently only available with special permission from NCES, and very few findings from these data have been published to date.
The authors employed inductive analysis (Patton, 2002) to analyze the qualitative data. Inductive analysis entails exploring the data to discover patterns and themes (Patton, 2002). Initially, the first and third authors worked independently to identify emergent themes and to categorize responses according to those themes. The two authors then met to discuss their coding, came to agreement on a working list of themes, and categorized responses accordingly. According to Patton (2002), Once patterns, themes, and/or categories have been established through inductive analysis, the final, confirmatory stage of the qualitative analysis may be deductive in testing and affirming the authenticity and appropriateness of the inductive content analysis, including carefully examining deviate cases or data that don’t fit the categories developed. (p. 454)
In the confirmatory stage, all three authors read through the responses together to finalize themes, create subthemes, and categorize responses.
Results
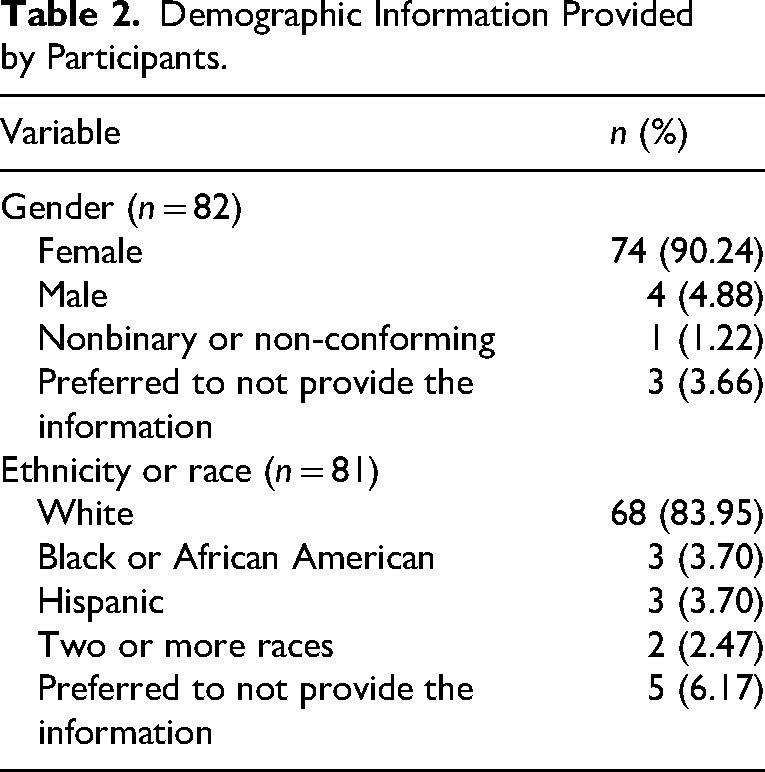
Of the 115 teachers of students with visual impairments who started the survey and gave consent, 83 provided demographic data about themselves and information about at least one high school student. See Table 2 for information about the gender and race or ethnicity of participants. Seventy-five respondents provided the number of years of experience they had as a teacher of students with visual impairments. The median number of years was 10, with a range from less than 1 year to 30 or more years. Forty-nine respondents held at least one additional certification, including orientation and mobility (n = 10), elementary or middle school education (n = 9), and secondary math (n = 2). The respondents were geographically diverse, representing 32 U.S. states, the District of Columbia, Puerto Rico, and the U.S. Virgin Islands. The states with the highest number of respondents were Texas (n = 13), New York (n = 9), Oregon (n = 6), and Washington (n = 6).
Types of Math Classes
Respondents collectively served 180 high school students who were taking at least one general education math class. Thirty-seven (20.6%) respondents reported they served one student, 22 (12.2%) served two students, 11 (6.1%) served three students, five (2.8%) served four students, five (2.8%) served five students, and three (1.7%) served six or more students. Seventy-six (91.6%) respondents answered questions about all high school students on their caseload who were taking at least one general education math class, while seven (8.4%) respondents answered questions about at least one, but not all their high school students who were taking a general education math class. Cumulatively, respondents provided information for 159 students taking a general education math class. See Table 3 for information about students’ grade levels, primary learning media for math, and the math classes they were taking.
Demographic Information Provided by Participants.
Grade Level, Mathematics Class, and Primary Media for Students.
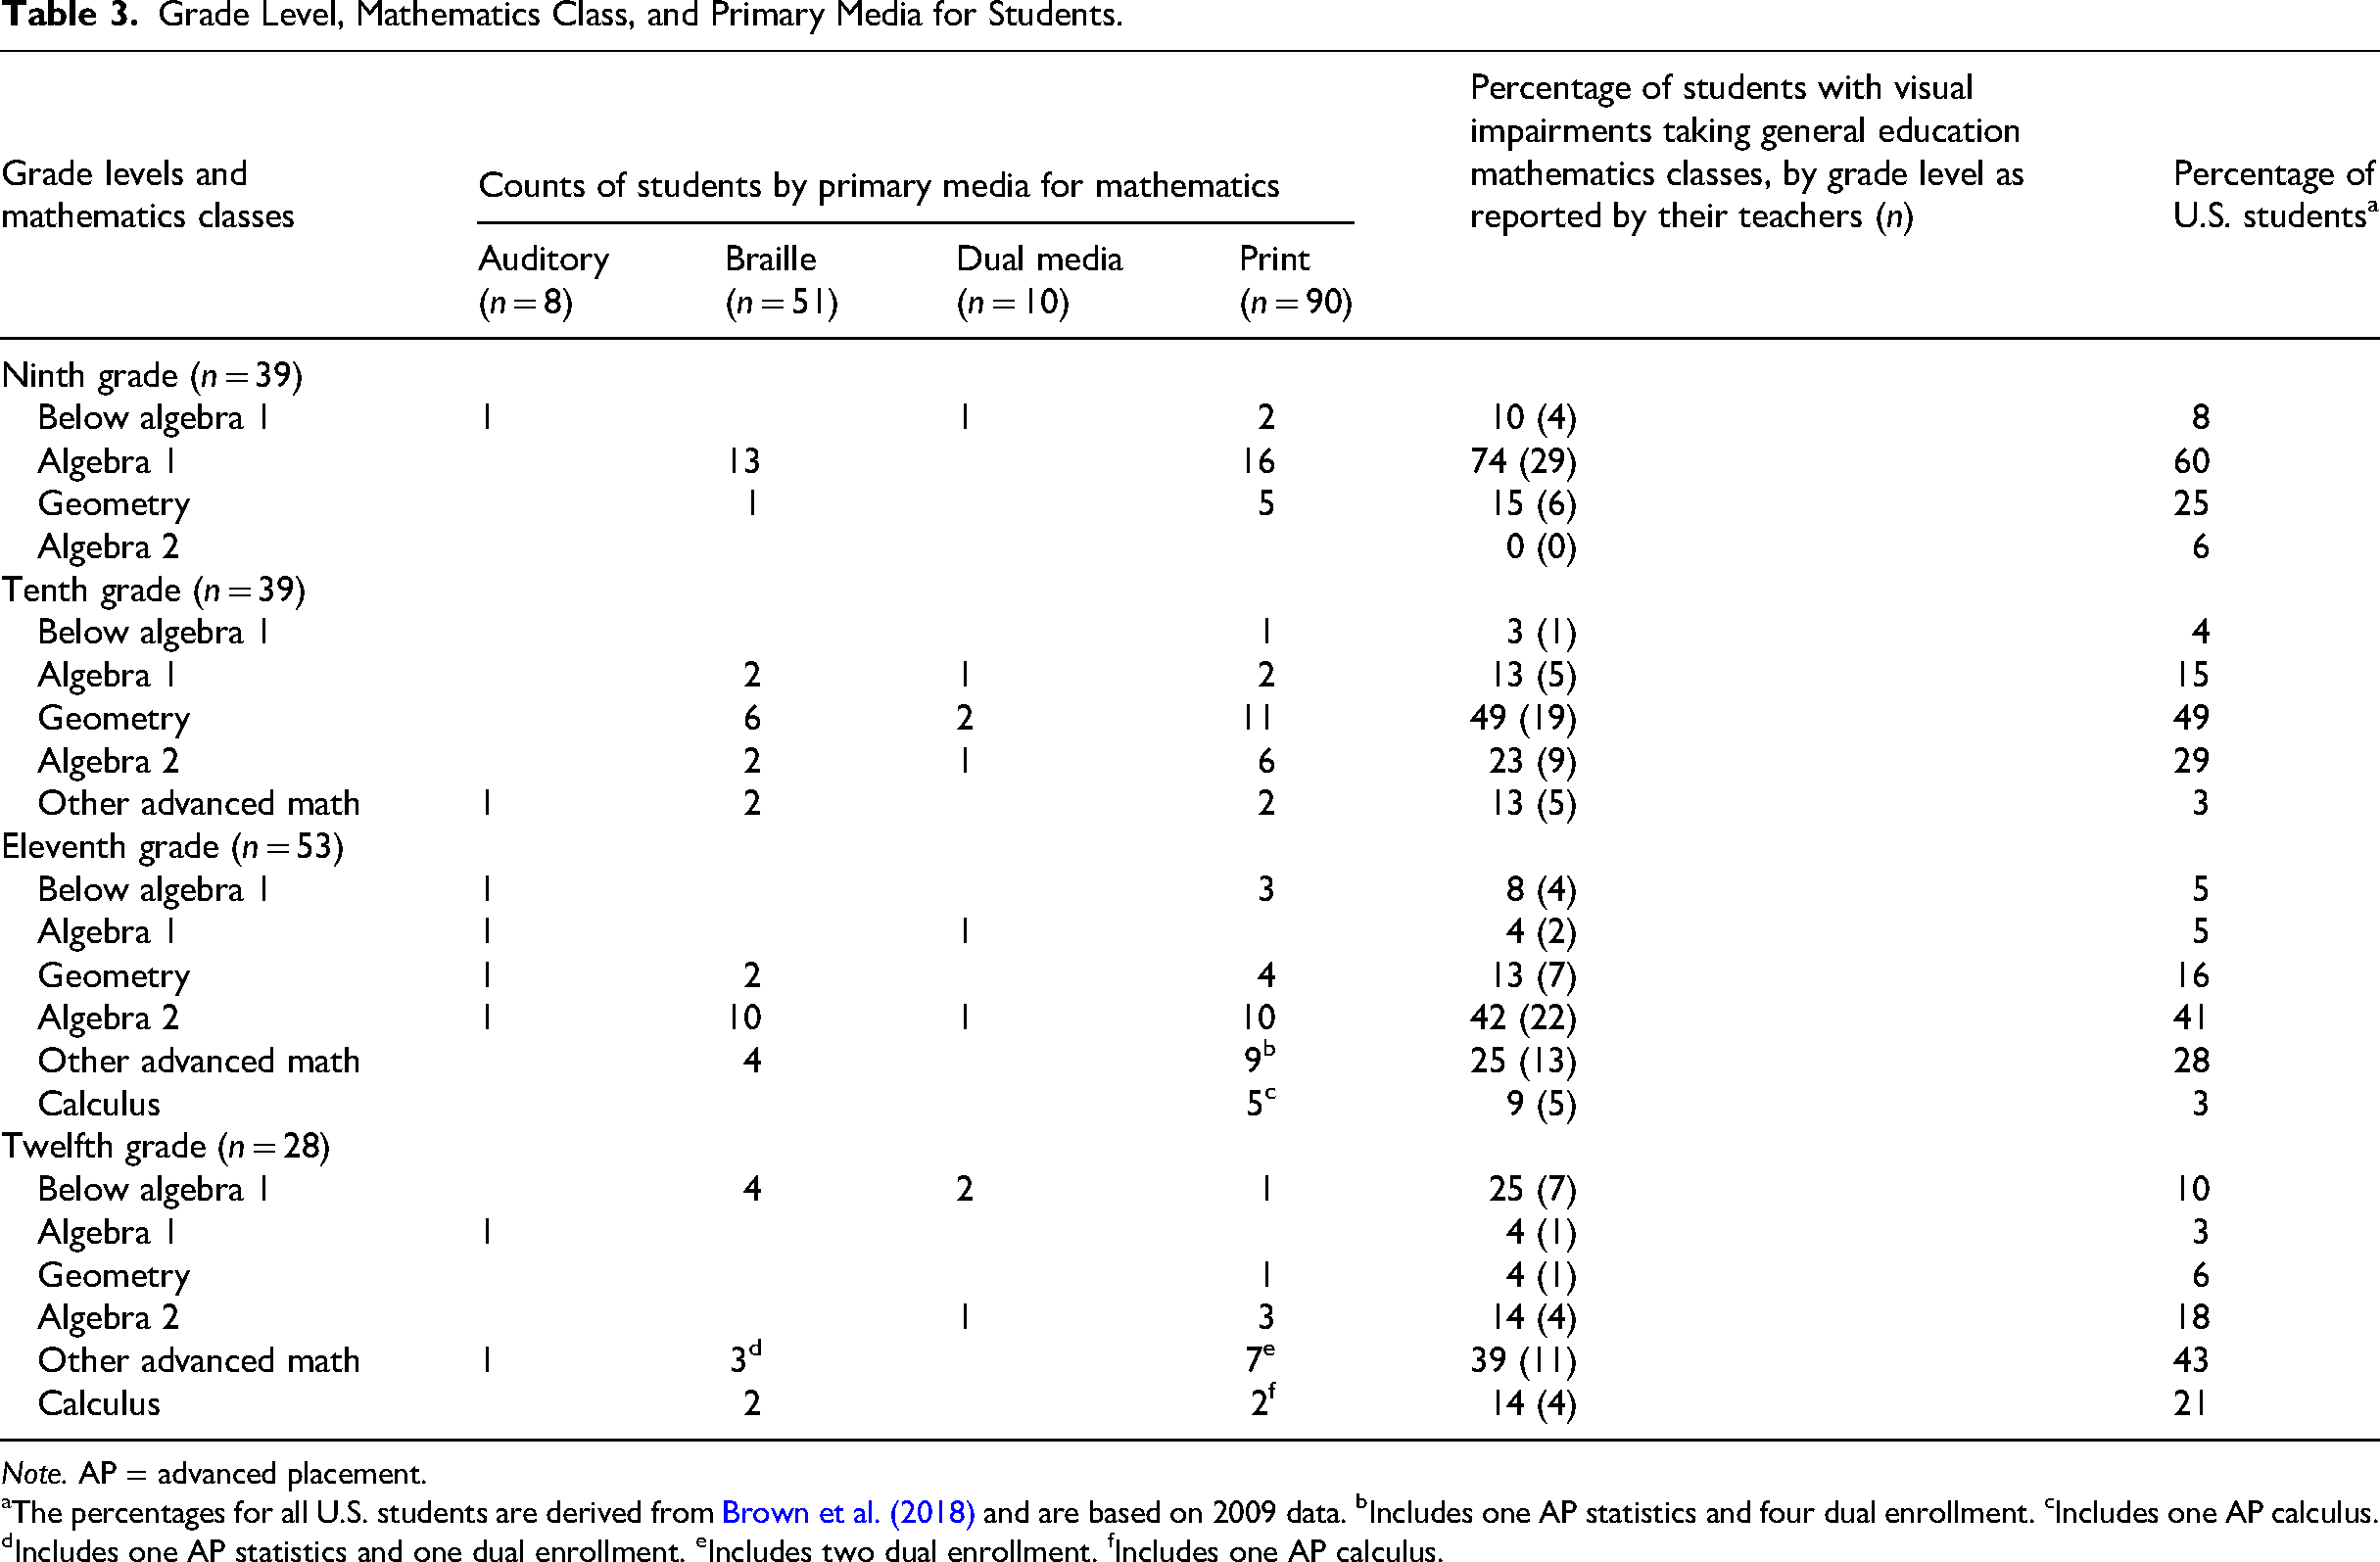
Note. AP = advanced placement.
The percentages for all U.S. students are derived from Brown et al. (2018) and are based on 2009 data. bIncludes one AP statistics and four dual enrollment. cIncludes one AP calculus. dIncludes one AP statistics and one dual enrollment. eIncludes two dual enrollment. fIncludes one AP calculus.
Roles
Respondents were asked if they or a paraeducator regularly attended math class with a student or assisted the student with math assignments. One third of respondents (n = 28; 33.7%) reported that they regularly attended math classes with at least one student, and one half (n = 43; 51.8%) of respondents regularly assisted at least one of their students in completing math assignments. Just under half (n = 39; 47.0%) indicated that a paraeducator regularly attended math classes with at least one of their students, and 33 (39.8%) shared that a paraeducator regularly assisted at least one of their students with math assignments.
Respondents were asked how many hours per week they spent tutoring their students in math content. Of the 73 respondents who answered the question, 37 (50.7%) reported that they did not tutor their students in math. Fourteen (19.2%) respondents reported they spent less than 1 hr per week tutoring their students, seven (9.6%) spent 1 hr per week, six (8.2%) spent 2 hr per week, and nine (12.3%) spent 3 or 4 hr per week.
Factors That Helped or Posed Challenges to Students’ Math Learning
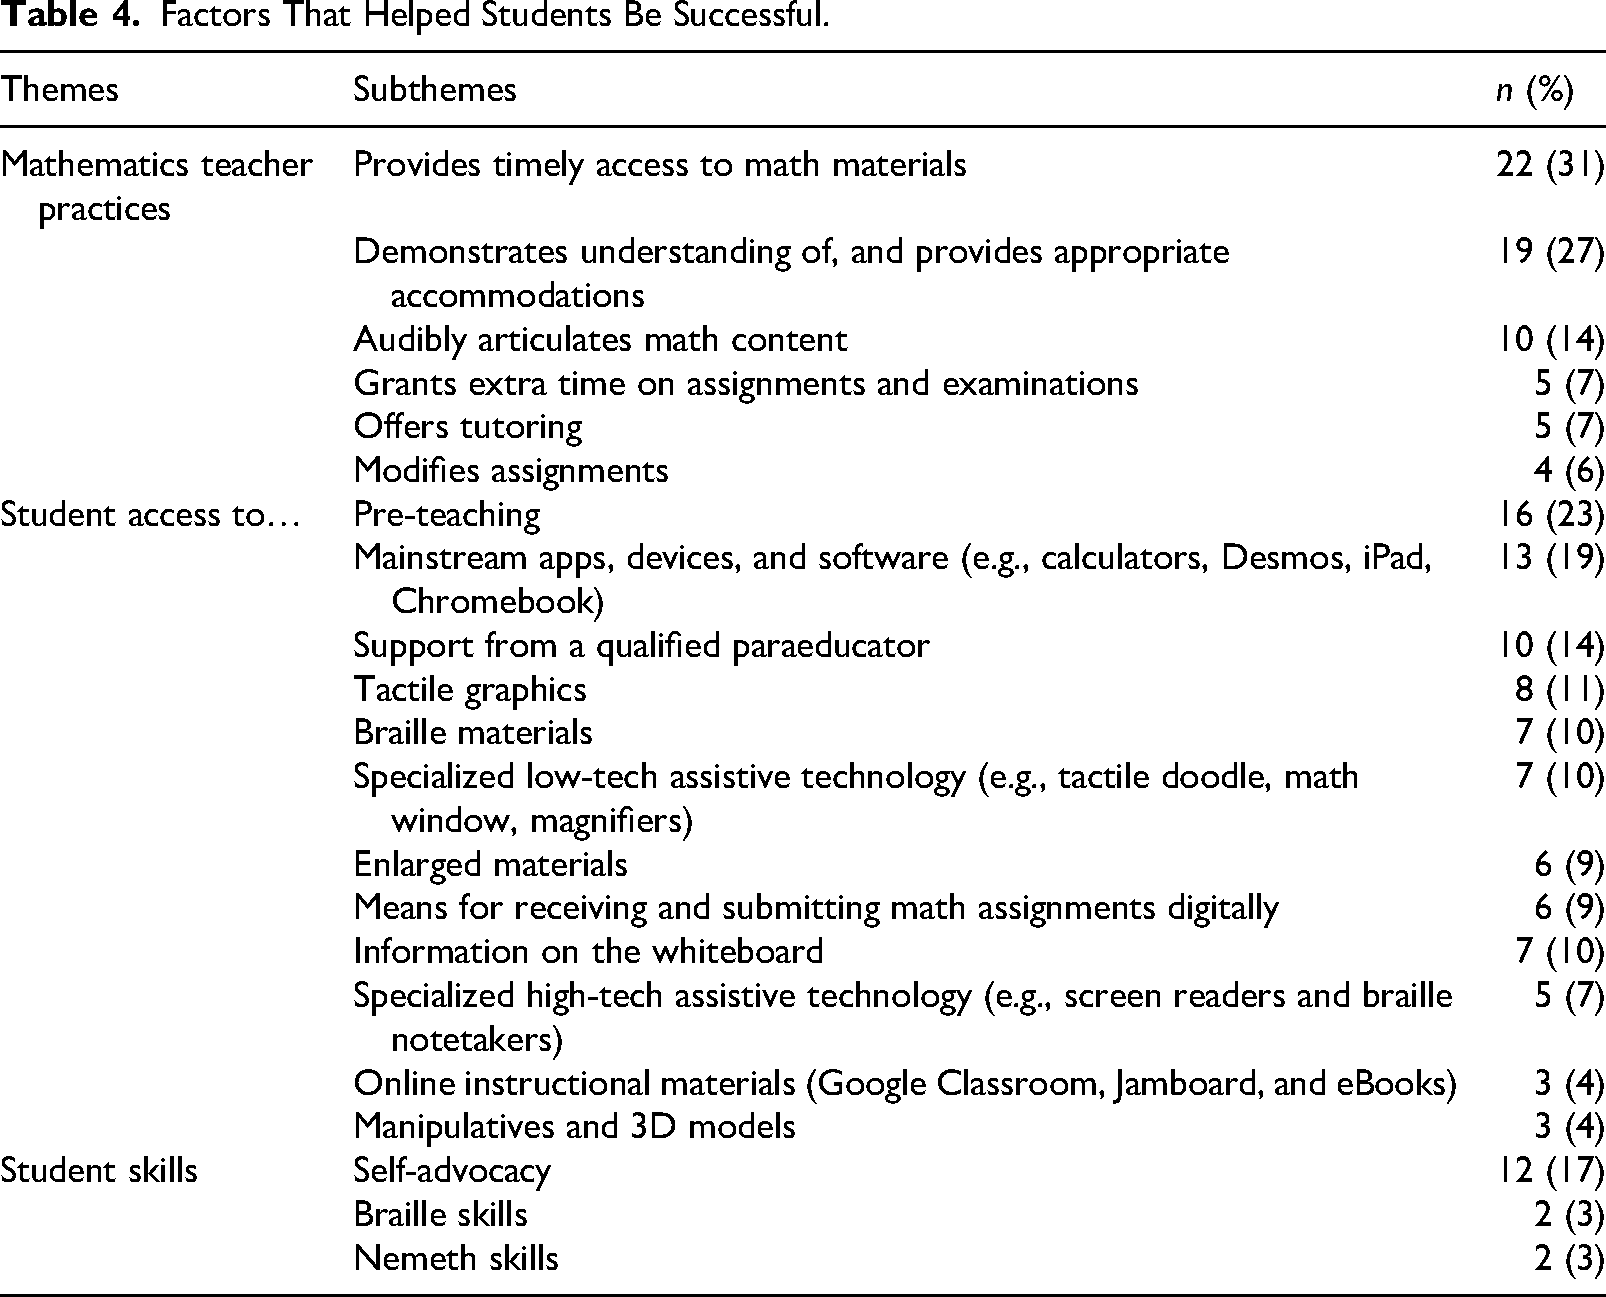
Participants were asked two open-ended questions: one about factors that helped their students be successful, and another about factors that challenged their students’ full participation in math classes. Three themes emerged in the data: (1) student access, (2) math teacher practices, and (3) students’ knowledge and skills. See Table 4 for factors that helped students and Table 5 for factors that posed challenges.
Factors That Helped Students Be Successful.
Factors That Posed Challenges to Full Participation.
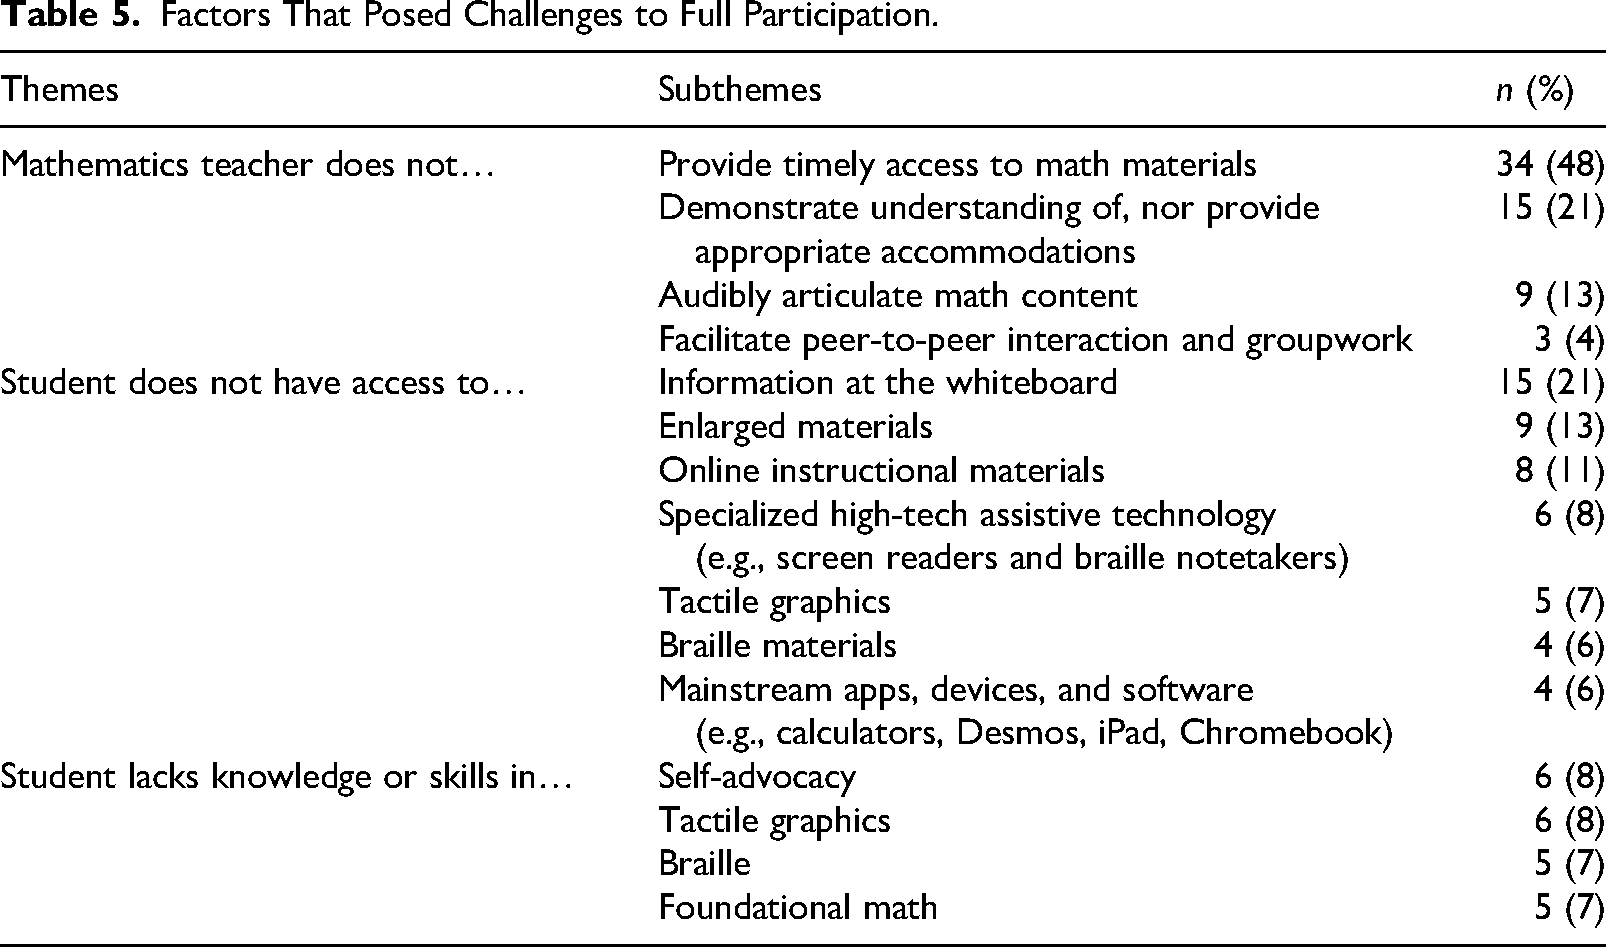
Many factors that helped students be successful were alternately framed as a challenge. For example, the most mentioned factor that helped students’ learning was a math teacher who provided materials to a teacher of students with visual impairments in a timely manner, while math teachers who did not provide materials in a timely manner was the most mentioned challenge (Table 5).
Factors That Helped Students
The respondents reported that having timely, accessible instructional materials and applications or apps allowed students to actively participate in their math classes alongside their peers. One respondent who provided support to two students in algebra 2 reported, “It helps to have general education math teachers that plan ahead so that materials can be made accessible [to students] before class starts.” Another respondent who was supporting a student in algebra 1 and a student taking an advanced math class shared: Teacher pre-planning is essential—at least a week in advance for class materials/assignments/projects! Having access to curricular materials with sufficient lead time allows me to quickly scan over the materials that will be used in class, pinpoint the new Nemeth symbols and/or spatial concepts that will need to be introduced prior to classroom instruction during 1:1 vision sessions, and gives me time to consult with the general education teacher about alternate ways to complete visual tasks (such as sketching graphs, participating in group activities, etc.).
According to respondents, math teachers can promote math learning for students with visual impairments by coordinating with teachers of students with visual impairments to provide accommodations, actively including students with visual impairments in classroom instruction, engaging with students outside of the classroom, and verbally explaining math content. A respondent who was supporting a junior in a trigonometry-precalculus class replied, When something will be presented to the class in a visual format video or slides with images, the gen ed teacher asks the student to come to the classroom after school the day before so they can preview the material, enlarged on a Smart Board, with verbal descriptions and a chance to ask questions related to what is shown in the image that cannot be accessed.
Similarly, a respondent who was supporting a senior taking applied math commented, “He had a math teacher his sophomore year who treated him like one of her students and spent time with him outside of class re-teaching concepts he did not understand.”
Sixteen respondents reported that pre-teaching helped their students be prepared for instruction in their math class. Regarding a freshman in algebra 1, a respondent stated, “I think previewing assignments with my student really helps. It de-mystifies [sic] the content so when she goes into the lesson with her general ed teacher, she has a pretty good idea of what is going on. She agrees!” Another respondent who was supporting a junior in algebra 1 noted, “Pre-teaching Nemeth symbols needed for class assignments is helpful, and pre-teaching any tactiles (graphs, x/y grid) is helpful!” Moreover, 10 respondents indicated that support from knowledgeable paraeducators was valuable. For example, a respondent reported their students benefitted from “a para[educator] who is skilled at math and able to create tactile representations on-the-fly.”
Students’ ability to advocate for themselves and problem-solve positively affected their math learning. In illustration, one respondent who was supporting a junior taking trigonometry shared, “The student advocates well for himself, asking the teacher or a peer to read to him what is being presented on the board if the material wasn't given ahead of time to be transcribed into braille.” Another respondent shared strategies that one of their students used in an algebraic reasoning class: My student has low vision and utilizes his magnifier and [smart]phone camera to access his worksheets. Documents are frequently emailed to him so he can enlarge the materials on the screen as needed. He also uses a monocular to access the board or uses his phone to take a screenshot of the board so he can review it at his desk.
Factors That Posed Challenges for Students
The respondents identified the challenges that their students experienced in math classes. When students did not have accessible instructional materials or were unable to access information presented on the whiteboard, their math learning was negatively affected. One participant who was supporting a senior in calculus commented, “Materials are not available in braille, and I spent approximately 15 hours a week creating worksheets and tactile graphics. Often the teacher does not give the materials far enough in advance.” In addition, the quick pacing of math classes was a challenge for some students. A participant who was supporting a sophomore taking trigonometry shared, “The amount of graphs that are required is a lot and [the] student feels that sometimes she cannot keep up with the pace of her sighted peers.”
Several respondents indicated that math teachers sometimes struggled to understand the effect of a visual impairment on math learning. When math teachers did not take responsibility for fully including students with visual impairments or did not provide sufficient accommodations, those students were not able to fully participate in their classes. One respondent who was supporting a senior taking algebra 1 commented: His math teachers have not “owned” him as one of their students. If he doesn't understand something, they leave it up to the para[educator] or me to explain or teach it to him. He is not given additional help from the math teacher like sighted students are.
A respondent who was supporting two students stated, “[The math] teacher not explaining well or skipping steps auditorily so that reteaching or reviewing becomes necessary for [the student's] complete understanding.” Regarding the barriers experienced by a freshman algebra 1 student and a junior trigonometry student, a respondent stated, “If the teacher conceptualizes math as a ‘visual’ subject and is unable or unwilling to collaborate with me to make inaccessible content accessible; and if the teacher has pity/low expectations for the blind student.” One respondent who was supporting a sophomore taking geometry and a junior taking algebra 2 said, “[Math] teachers not modifying slides or worksheets to accommodate visual impairments, despite the fact they have been given the list of accommodations.”
Discussion
The general education math courses being taken by the high school students with visual impairments who were being served by the respondents to the present study were similar to the types of math classes being taken by all U.S. students, based on data from HSLS:2009 (Brown et al., 2018). For Grades 9 through 11, the most common math class being taken by the students with visual impairments whose academic pursuits are described in this study was also the most common class being taken by all U.S. students at the same grade level: algebra 1 for freshman, geometry for sophomores, and algebra 2 for juniors. In addition, more than one third of juniors and more than one half of seniors in this study were enrolled in advanced math courses such as statistics, trigonometry, and calculus, including 11 students who were taking a math class for college credit. See Figure 1 for the distribution of math classes at each grade level for the students with visual impairments in this study and all U.S. students.
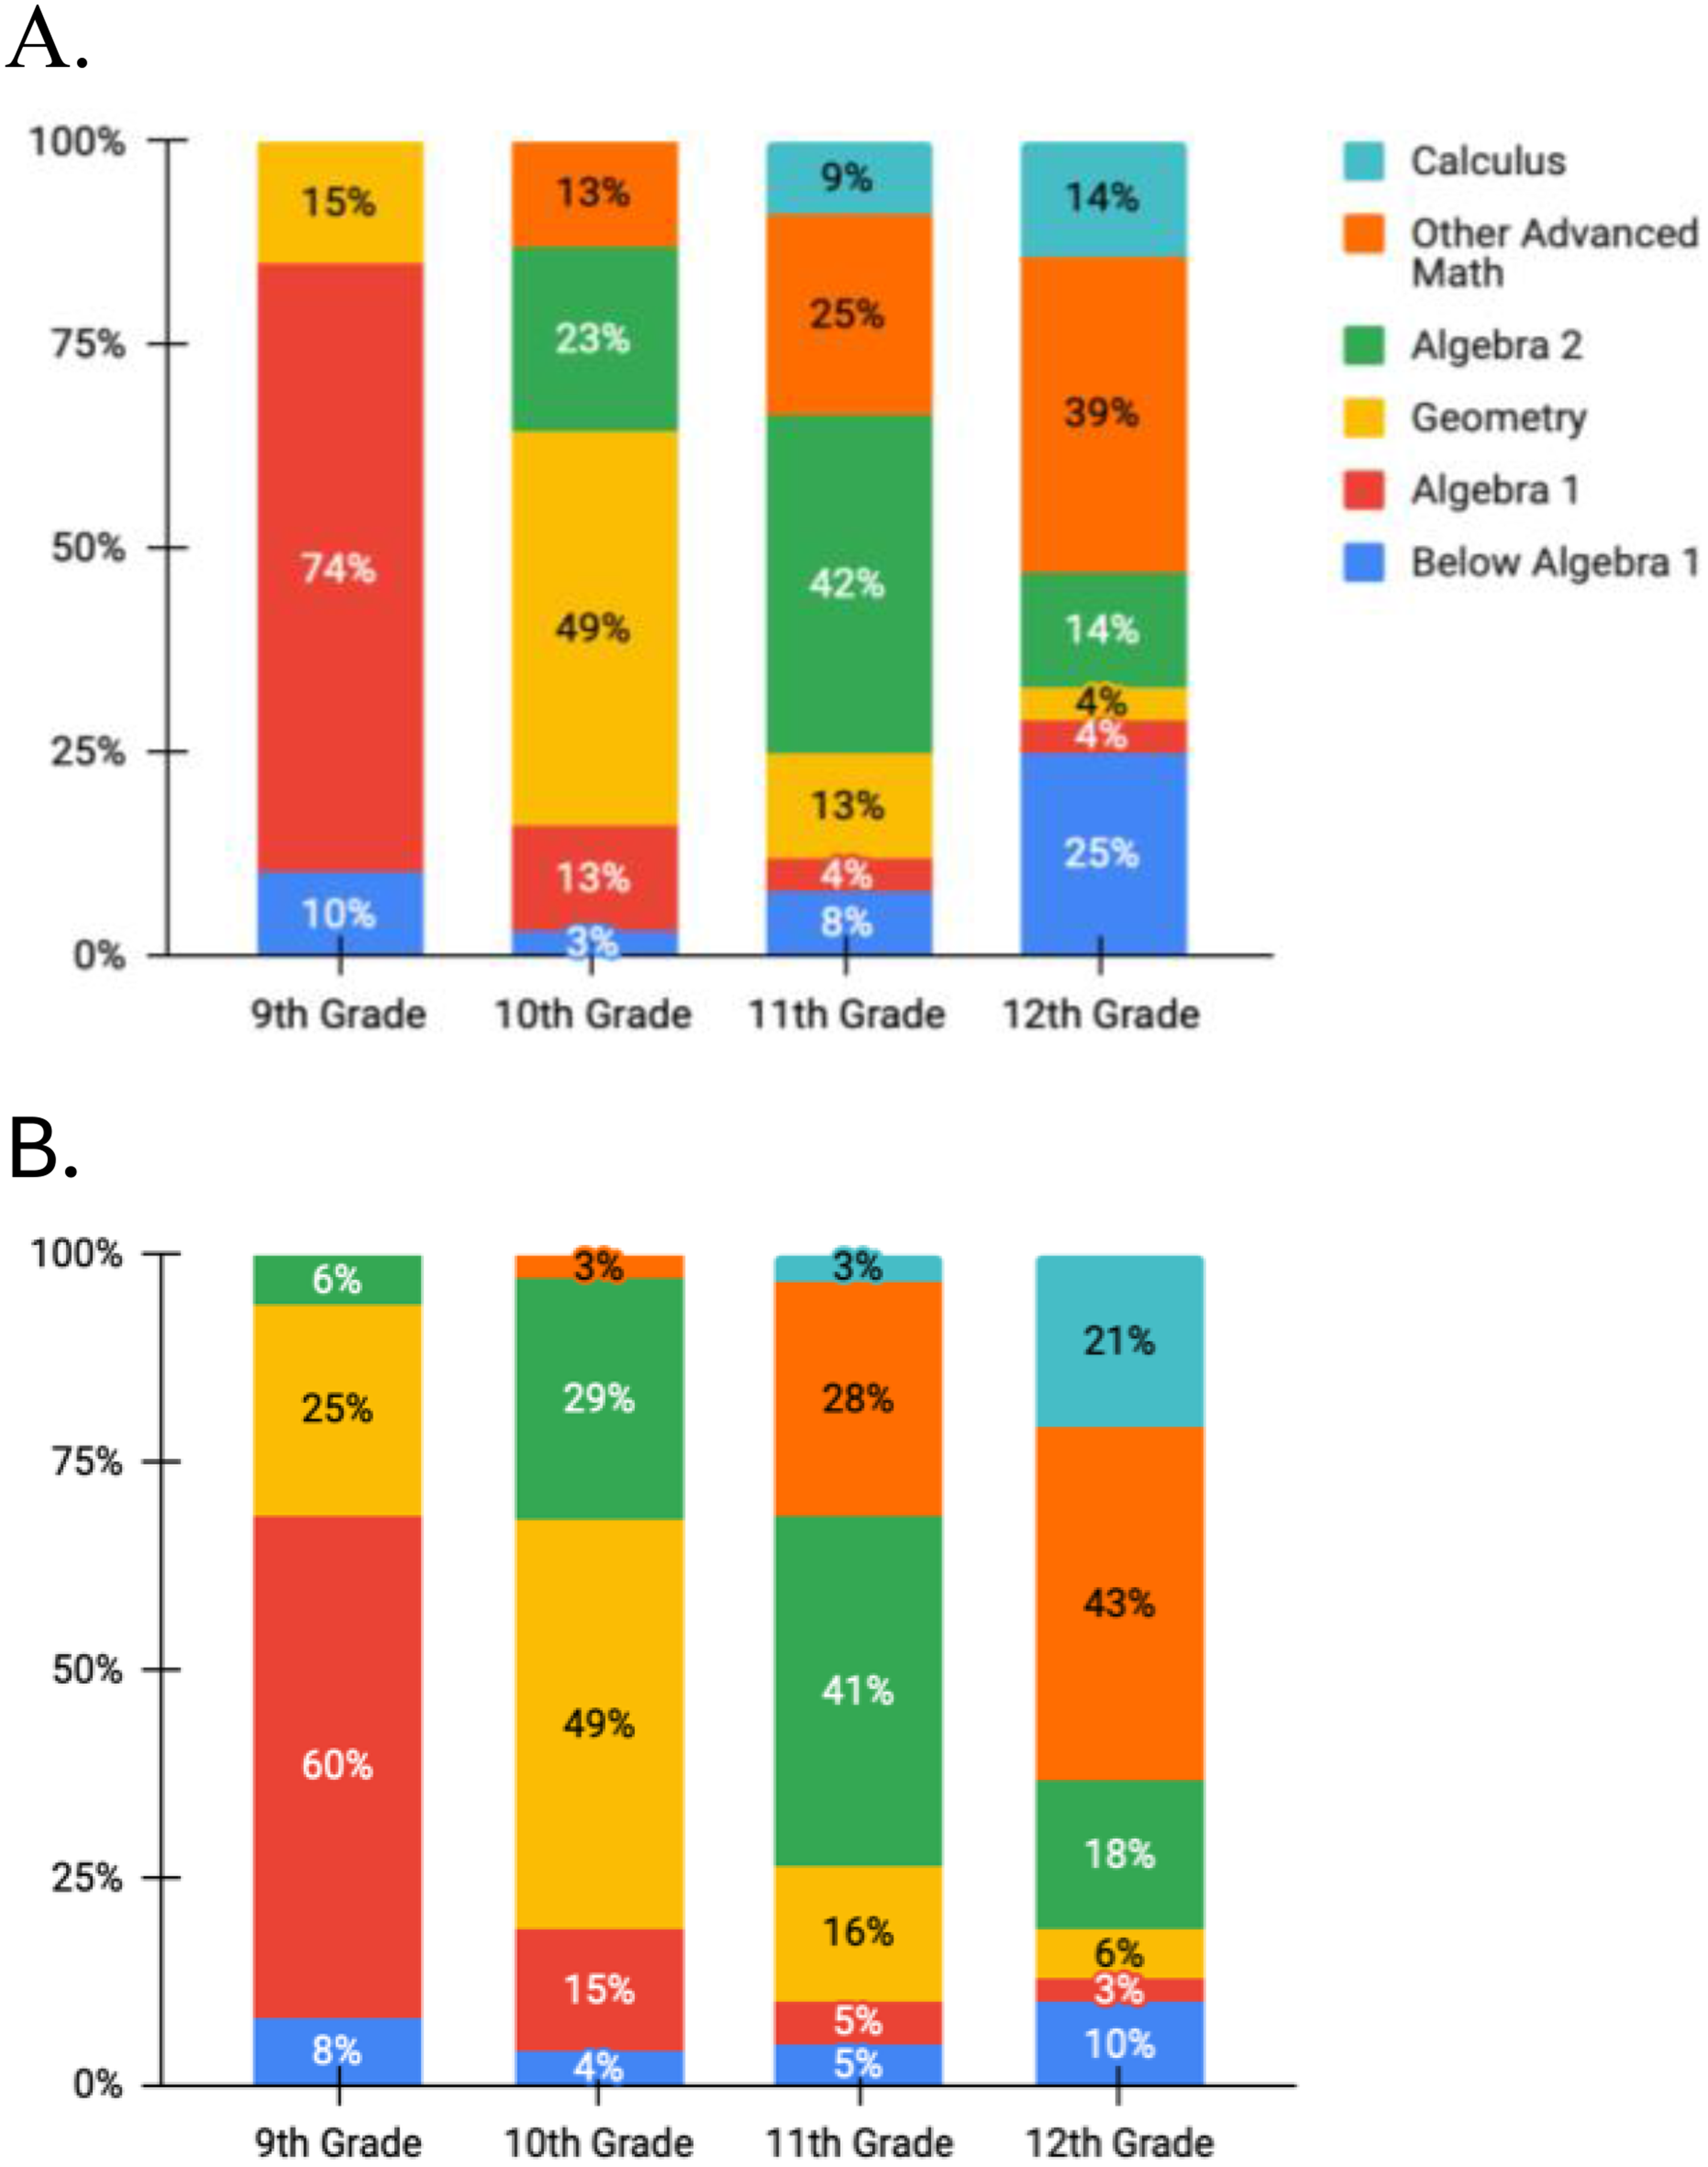
Students With Visual Impairments in This Sample (A) Versus All U.S. Students (B).
High school students with visual impairments who were taking general education math classes may be participating in the decades-long trend in the United States of students taking more advanced math classes (Kena et al., 2016). As previously mentioned, Rapp and Rapp (1992) reported that 56 (44.4%) of the 160 high school students in their sample were taking general math, and only 20 (15.9%) were taking algebra 2 or higher. In this study, with a similar sample size and inclusion criteria, 16 (10.1%) were taking math below algebra 1, while 63 (45.9%) were taking algebra 2 or higher. It should be noted that 11 of the students in the current study were taking a for-college-credit math class, which is increasingly common for U.S. students (NCES, 2019). We are encouraged that more students, including those who read braille, were participating in advanced math classes. In order to enroll in advanced math classes (algebra 2 or higher), students must first successfully complete lower level math classes. This logic, combined with comments from participants about their students, indicates that, despite challenges, some, if not many, of their students with visual impairments were succeeding in their math classes.
Similar to the findings of Wolffe et al. (2002), some teachers of students with visual impairments were responsible for tutoring or assisting their students in completing math assignments or both. It appeared that some teachers of students with visual impairments in this study were prepared and comfortable in these roles. However, when teachers of students with visual impairments lack knowledge of math content or pedagogy, yet are responsible for tutoring, their students may be disadvantaged. In illustration, one respondent, who was supporting a senior in algebra 1, explained, “We are not math teachers and half of the time don't even understand the concept ourselves. We often end up confusing him even further.”
A longitudinal study with a cohort of high school students with visual impairments is needed to learn about math course-taking patterns, highest levels of math successfully completed, and post-secondary pursuits. Researchers could analyze academic transcripts and periodically conduct surveys, interviews, or focus groups to learn about the factors that impacted students’ achievement in math classes and course-taking decisions. Other studies might focus on the accessibility of digital math materials, course software, and apps.
Limitations
The participants of this study were self-selected; they, in turn, chose the high school students about whom they provided information. The teachers who participated in this study, therefore, may not be representative of the population. It is possible that they were more interested than other teachers of students with visual impairments in assisting students in high school math. It is also possible that the students who were represented in the responses of participants were stronger in math content than other students with visual impairments.
Participants were asked to provide information about the students on their caseload who were taking at least one general education high school math class, so students with additional disabilities were not explicitly excluded. It is not possible to know, however, the extent to which these students were included. Generalization of study findings to all students with visual impairments is not possible, given the small number of students at each grade level in this study. Also, the math classes listed in the multi-select question did not include all possible high school math classes, and the researchers had to classify some math classes using their best judgment. Furthermore, this study was a snapshot from the fall of 2022, so it is not possible to know all the math classes that students would take throughout their high school education. Additionally, the researchers did not collect data about students’ grades in their math classes.
The course-taking information for all U.S. students is based on data from 2009 (Brown et al., 2018). Although these data are the most current information in this area that is publicly available, it is 15 years old and may not reflect current course-taking patterns of U.S. high school students. When updated U.S. student data become available, these study data should be revisited.
Implications for Practitioners
Teachers of students with visual impairments have many roles and responsibilities, especially when supporting high school students in their math learning. An essential role of teachers of students with visual impairments is to teach the Expanded Core Curriculum, which includes compensatory skills, access to technology, and self-determination (Pogrund et al., 2019; Spungin et al., 2017). In the context of high school math classes, knowledge of the tools and technologies used in math classrooms is necessary. We encourage teachers of students with visual impairments who support students in high school math classes to stay abreast of mainstream and specialized technologies used in such classrooms. Teachers of students with visual impairments should also teach students problem-solving skills so that they can participate in resolving the challenges they experience in the classroom.
Teachers of students with visual impairments should support math teachers, many of whom do not have any training or experience in teaching math to students with visual impairments. Teachers of students with visual impairments should explain the accommodations identified in their students’ Individualized Education Programs and why implementing them is important to the success of the students. Also, it is crucial that teachers of students with visual impairments and math teachers develop a workflow for delivering accessible math materials to students in a timely manner. We encourage teachers of students with visual impairments to observe students in their math classroom to determine if additional supports are needed. Our findings indicate that teachers of students with visual impairments may need to strategize with the math teacher to develop inclusive practices specific to the student's needs.
Some teachers of students with visual impairments tutor their students in math and assist their students in completing their math assignments. If a teacher of students with visual impairments is not confident in their foundational knowledge in math content and pedagogy, they should advocate that their students receive tutoring and assistance from math education experts.
Footnotes
Authors’ Note
The authors thank the teachers who participated in this study, Susan Osterhaus for reviewing the survey, and Dr. L. Penny Rosenblum for help in editing this manuscript.
We have no known conflicts of interest to disclose.
Declaration of Conflicting Interests
The authors declared no potential conflicts of interest with respect to the research, authorship, and/or publication of this article.
Funding
The authors received no financial support for the research, authorship, and/or publication of this article.