
Abstract
Post-school employment outcomes are critical indicators of how well education systems prepare students for adulthood and have substantial implications at the individual and societal levels. Unemployment can have lasting effects, including detrimental impacts on individuals’ health and financial security, plus broader social and economic consequences (Belfield et al., 2012). Conversely, employment provides financial support and independence (Hagler et al., 2016; Saunders & Nedelec, 2014) and has mental health benefits, such as decreased anxiety and depression symptoms (Modini et al., 2016), and reduced risk of depression (van der Noordt et al., 2014). Employment improves well-being through autonomy, satisfaction, empowerment, and personal development (Hagler et al., 2016), and it facilitates social integration and identity development (Cohen-Scali et al., 2022; Saunders & Nedelec, 2014). Accordingly, preparing all students for the workforce is a fundamental goal of the U.S. education system, as supported by federal laws focusing on college and career readiness and the provision of specialized services to improve outcomes for students with disabilities (Cushing et al., 2019).
People with disabilities often face attitudinal, systemic, and environmental barriers to employment, including negative employer attitudes (Burke et al., 2013; Crudden & McBroom, 1999; McDonnall & Antonelli, 2018), concerns about losing disability benefits (Lipscomb et al., 2017; O’Day et al., 2016; Silverman et al., 2019), and transportation issues (Crudden & McBroom, 1999; O’Day et al., 2016; Silverman et al., 2019). The specific barriers encountered by people with disabilities can differ by factors like age, health, and disability type (Fyffe et al., 2022). For example, low motivation, poor social skills, and lack of employment skills are prominent barriers for youths with disabilities (Carter et al., 2021). The combined effects of multiple disabilities or health conditions can also create employment barriers (Crudden et al., 2024; Fyffe et al., 2022), and negative self-perceptions regarding health conditions, disabilities, and functional limitations further impact some people (Fyffe et al., 2022). People with visual impairments (i.e., those who are blind or have low vision) frequently encounter unique employment barriers, including accessibility issues (Crudden & McBroom, 1999; Silverman et al., 2019) and employers’ lack of knowledge about visual impairment-specific workplace accommodations (McDonnall et al., 2014; McDonnall & Crudden, 2018).
Despite recent improvements in employment rates for people with disabilities, labor force statistics reveal persistent disparities between people with and without disabilities (U.S. Bureau of Labor Statistics, 2024). People with disabilities, including visual impairments, have lower labor force participation and employment rates, higher unemployment rates, and lower earnings than the general population (Erickson et al., 2024; McDonnall et al., 2022b; McDonnall & McKnight, 2021; McDonnall & Sui, 2019; Sherrod et al., 2014; Thomas et al., 2024; U.S. Bureau of Labor Statistics, 2024). Similar disparities have been documented among young adults, with some inconsistent findings across studies. For instance, Mann and Wittenburg (2015) found that young adults with disabilities had lower employment rates than their peers without disabilities; however, Newman et al. (2011) found no significant differences in current employment between these two groups overall but noted substantial variation by disability category. Both studies indicated that young adults with disabilities had lower earnings than young adults without disabilities (Mann & Wittenburg, 2015; Newman et al., 2011), although Newman et al. identified differences in earnings by disability category. These findings underscore the importance of investigating employment outcomes for young adults within specific disability categories.
Most research on employment outcomes of young adults with visual impairments has focused on employment status at one time point or over a limited time frame, such as within 8 years of leaving high school (Lund & Cmar, 2020). National Longitudinal Transition Study–2 data indicated that young adults with visual impairments were less likely to be employed than their sighted peers (Newman et al., 2011). Additionally, 78.0% of young adults with visual impairments worked since high school, but only 43.8% were working at the time of the interview. This study also documented that employed young adults with visual impairments worked an average of 31.3 hr per week, and they tended to earn less than young adults in the general population but earned more than young adults in several other disability categories.
Only two studies focused on longitudinal employment outcomes of young adults with visual impairments (Connors et al., 2014; McDonnall, 2010). Connors et al. (2014) examined whether young adults were working or attending college within 8 years of leaving high school; given the study's broad focus, however, we cannot draw conclusions specific to employment. McDonnall (2010) investigated the annual number of hours worked over a time period of 6 years (from ages 18–23 years to 22–27 years) and found that young adults with visual impairments worked fewer hours than their sighted peers, although the gap in work hours decreased over time. Additional research on adults’ employment patterns revealed that, compared to people without visual impairments, people with visual impairments were less likely to maintain continuous employment for 1 year (Kirchner & Peterson, 1980; McDonnall et al., 2022a) and were more likely to not work at all over the 4-year study period (Cmar & McDonnall, 2024). Since the adults in these studies likely experienced vision loss at various life stages, the findings may not adequately reflect the long-term employment experiences of people with earlier onset of visual impairment.
Several studies have explored relationships between disability-related factors and post-school employment outcomes. A systematic review of employment for transition-age youths with visual impairments revealed mixed findings regarding the severity of their visual impairments (Lund & Cmar, 2020), with some studies finding that more severe visual impairments were associated with adverse outcomes (Cimera et al., 2015; Giesen & Cavenaugh, 2012) and others finding no such association (Cmar, 2015; DeLaGarza & Erin, 1993; Zhou et al., 2013). Findings from analyses of National Longitudinal Survey of Youth 1997 (NLSY97) data focusing on the broader population of youths with disabilities highlight the importance of considering the functional implications of disability when studying post-school outcomes. Compared to youths with non-limiting disabilities (i.e., youths who “ever had a disability or chronic condition but not currently limited by it”), youths with disabilities and functional limitations (i.e., “currently limited a little or a lot”) were less likely to obtain stable post-school employment, and youths with seriously-limiting disabilities (i.e., “currently limited a lot”) had lower earnings (Shandra & Hogan, 2008). By age 24 years, young adults with disabilities and functional limitations had poorer employment outcomes than their peers without disabilities, but young adults with non-limiting disabilities and young adults without disabilities had similar outcomes (Mann & Honeycutt, 2014). Despite its broad nature, the definition of functional limitations used in these and other NLSY97 studies (Mann & Honeycutt, 2016; Mann & Wittenburg, 2015) coincides with the activity and participation limitation categories in the International Classification of Functioning, Disability and Health (Mann & Honeycutt, 2016). Further research is needed to understand the impact of functional limitations from visual impairment on long-term employment outcomes.
Longitudinal employment research focusing on young adults with visual impairments is scarce. Gaps in this body of literature include the limited employment measures and lack of information about long-term outcomes beyond 8 years after high school (Connors et al., 2014) or ages 22 to 27 years (McDonnall, 2010), including comparisons with the general population. As youths with visual impairments move into and through various phases of adulthood, their employment barriers, experiences, and patterns may change, highlighting the need for a longitudinal perspective spanning multiple life stages. The purpose of this study is to examine the long-term employment outcomes of young adults with visual impairments and compare their outcomes with those of the general population. This study extends the literature by using 16 years of longitudinal data to investigate multiple employment outcomes from ages 21 to 36 years and accounting for functional limitations. Furthermore, comparing outcomes with the general population provides a comprehensive long-term account of employment outcomes and disparities beyond traditional cross-sectional and short-term measures.
Our research question was: How do long-term post-school employment outcomes for young adults with visual impairments (with and without functional limitations) compare to outcomes for young adults without visual impairments?
Method
Data Source
Data were obtained from the NLSY97, a nationally representative sample of 8,984 individuals born between 1980 and 1984. The NLSY97, conducted by the Bureau of Labor Statistics, is a prospective longitudinal study of young Americans as they transition from adolescence into adulthood, covering topics such as education, labor market behavior, family formation, health, and other significant life events (e.g., home ownership, voting, and arrests).
Data collection began in 1997 when participants were ages 12 to 18 years, continued annually until 2011, and then switched to a biennial schedule. The most recent data, Round 20 (2021–2022), captures participants’ experiences at ages 36 to 42 years.
The NLSY97 consists of a cross-sectional sample and an oversample of Black and Hispanic individuals, using a stratified multistage sampling design (Moore et al., 2000), which allows for generalizability to the U.S. population. Data were primarily collected through in-person interviews in the early rounds, with telephone interviews becoming the primary mode by Round 18. Interviews, conducted in English or Spanish, typically lasted around 1 hr. Additional data were obtained from parent interviews in Round 1.
Over the course of the study, response rates declined from 93.3% in Round 2 to 74.7% in Round 20. Despite this decline, NLSY97 remains a robust dataset for examining longitudinal patterns in employment among young adults in the United States.
Sample
The NLSY97 included questions about various disabilities and health conditions in Rounds 1, 6, 11 to 13, and 16. Our analytic sample was restricted to participants who responded to the disability or health condition questions in any round, resulting in the removal of 85 cases whose disability status could not be determined. The final unweighted sample size was 8,899 (weighted N = 19,194,851).
Variables
The primary independent variable in this study was visual impairment status, consisting of three categories: visual impairment with functional limitations (VIFL), visual impairment with no functional limitations (VINFL), and no visual impairment (NVI). Visual impairment was determined based on participants’ responses to vision-related questions in Round 1 (parent response) or Round 6 (youth response). Participants were identified as having a visual impairment if they answered “yes” to the question, “Have you ever had trouble seeing, hearing, or speaking?” and then selected blindness in one eye, blindness in both eyes, or other vision difficulty. Follow-up questions asked about the age of onset and whether the condition currently limited activities (a little, a lot, or not limited). Those who later reported never having the condition (Rounds 11 through 13 or 16) were reclassified as not visually impaired. Participants whose impairment began before age 19 years and who reported activity limitations were categorized as VIFL (n = 283), while those with a vision condition before age 19 years but no limitations were categorized as VINFL (n = 940). If there was a discrepancy in activity limitations between Round 1 and 6, the Round 6 report was used. All other participants were categorized as NVI (n = 7,676).
The dependent variables include several employment outcomes, measured annually from age 21 years (i.e., the year of the participant's 21st birthday) to age 36 years (i.e., the year of their 36th birthday), resulting in 16 waves of data. For participants born in 1980, data span from 2001 to 2016, while the data cover 2005 to 2020 for those born in 1984.
Three employment measures were derived from weekly employment status variables and calculated annually: the percentage of weeks employed, unemployed, and not in the labor force. Participants were categorized as employed for weeks in which they held a job with an employer, were self-employed, or were in active military service. They were categorized as unemployed during weeks when they were without a job but seeking work. Weeks were categorized as not in the labor force when participants were coded as either out of the labor force or not working and not actively searching for a job. Each measure was calculated as the total weeks in a given category divided by the total weeks in the year, resulting in values ranging from 0 to 100.
The average number of weekly hours worked per year was calculated by averaging the total number of hours worked per week, capped at 65 hr per week to eliminate extreme outliers. Average annual earnings were calculated using survey responses about earnings from employer-based jobs and self-employment at each survey round. Participants were asked, “During [year], how much income did you receive from wages, salary, commissions, or tips from all jobs, before deductions for taxes or for anything else?” and “During [year], how much income did you receive from your own farm, business, partnership or professional practice after expenses?” The reported earnings from both sources were summed for each year and adjusted to 2000 dollars using the Consumer Price Index from the Bureau of Labor Statistics (U.S. Bureau of Labor Statistics, n.d.). Due to biennial data collection starting in 2011, earnings data were missing for certain years, varying by birth year. For example, participants born in 1980 had missing data at ages 31, 33, and 35 years, while those born in 1981 had missing data at ages 30, 32, 34, and 36 years. To address these gaps, linear interpolation was used to estimate earnings based on the surrounding observed data points for the missing years. As a result, average annual earnings were calculated using both observed and interpolated data.
In addition to the annual measures, cumulative variables were created for each employment outcome to calculate average outcomes over the entire period from age 21 to 36 years. For the percentage of weeks employed, unemployed, and out of the labor force, cumulative variables were calculated by summing the total number of weeks in each category and dividing by the total number of weeks in the period. The cumulative average hours worked per week was calculated by averaging weekly hours worked across the entire period. Cumulative average annual earnings were calculated as the mean of reported earnings for the years in which data were available.
Data Analysis
Analyses were conducted using SAS 9.4 statistical software. A custom weight program provided by NLSY97 was used to create weights that account for the complex survey design and multiple waves of data (U.S. Bureau of Labor Statistics, n.d.). Design variables were included in all analyses to generate standard errors that account for NLSY97's complex sampling design. Descriptive statistics were generated using the SAS SURVEYFREQ procedure, and weighted means were calculated using the SAS SURVEYMEANS procedure for the outcome variables, both overall and by visual impairment status. These means for the annual outcome variables were then used to create line graphs to visualize trends over time. A one-way analysis of variance (ANOVA) was conducted using the SAS SURVEYREG procedure to assess the association between visual impairment status and the cumulative outcome variables. Pairwise comparisons between the visual impairment status groups were performed using the SAS ESTIMATE statement, allowing for a detailed examination of group differences. (Note: For more information on the various SAS procedures, see SAS Institute, 2023).
Results
Sample Characteristics
Descriptive statistics (weighted) for the total sample and by visual impairment status are presented in Table 1. Most participants had no visual impairment (85.6%, weighted n = 16,436,488), while 11.3% were categorized as VINFL (weighted n = 2,169,595), and 3.1% as VIFL (weighted n = 588,768). A greater share of women were in the visual impairment groups. The VIFL group had a higher proportion of individuals with a nonvisual disability and who identified as Black/mixed race or Hispanic. This group also had fewer people with bachelor's or graduate degrees.
Descriptive Statistics, Overall and by Visual Impairment Status
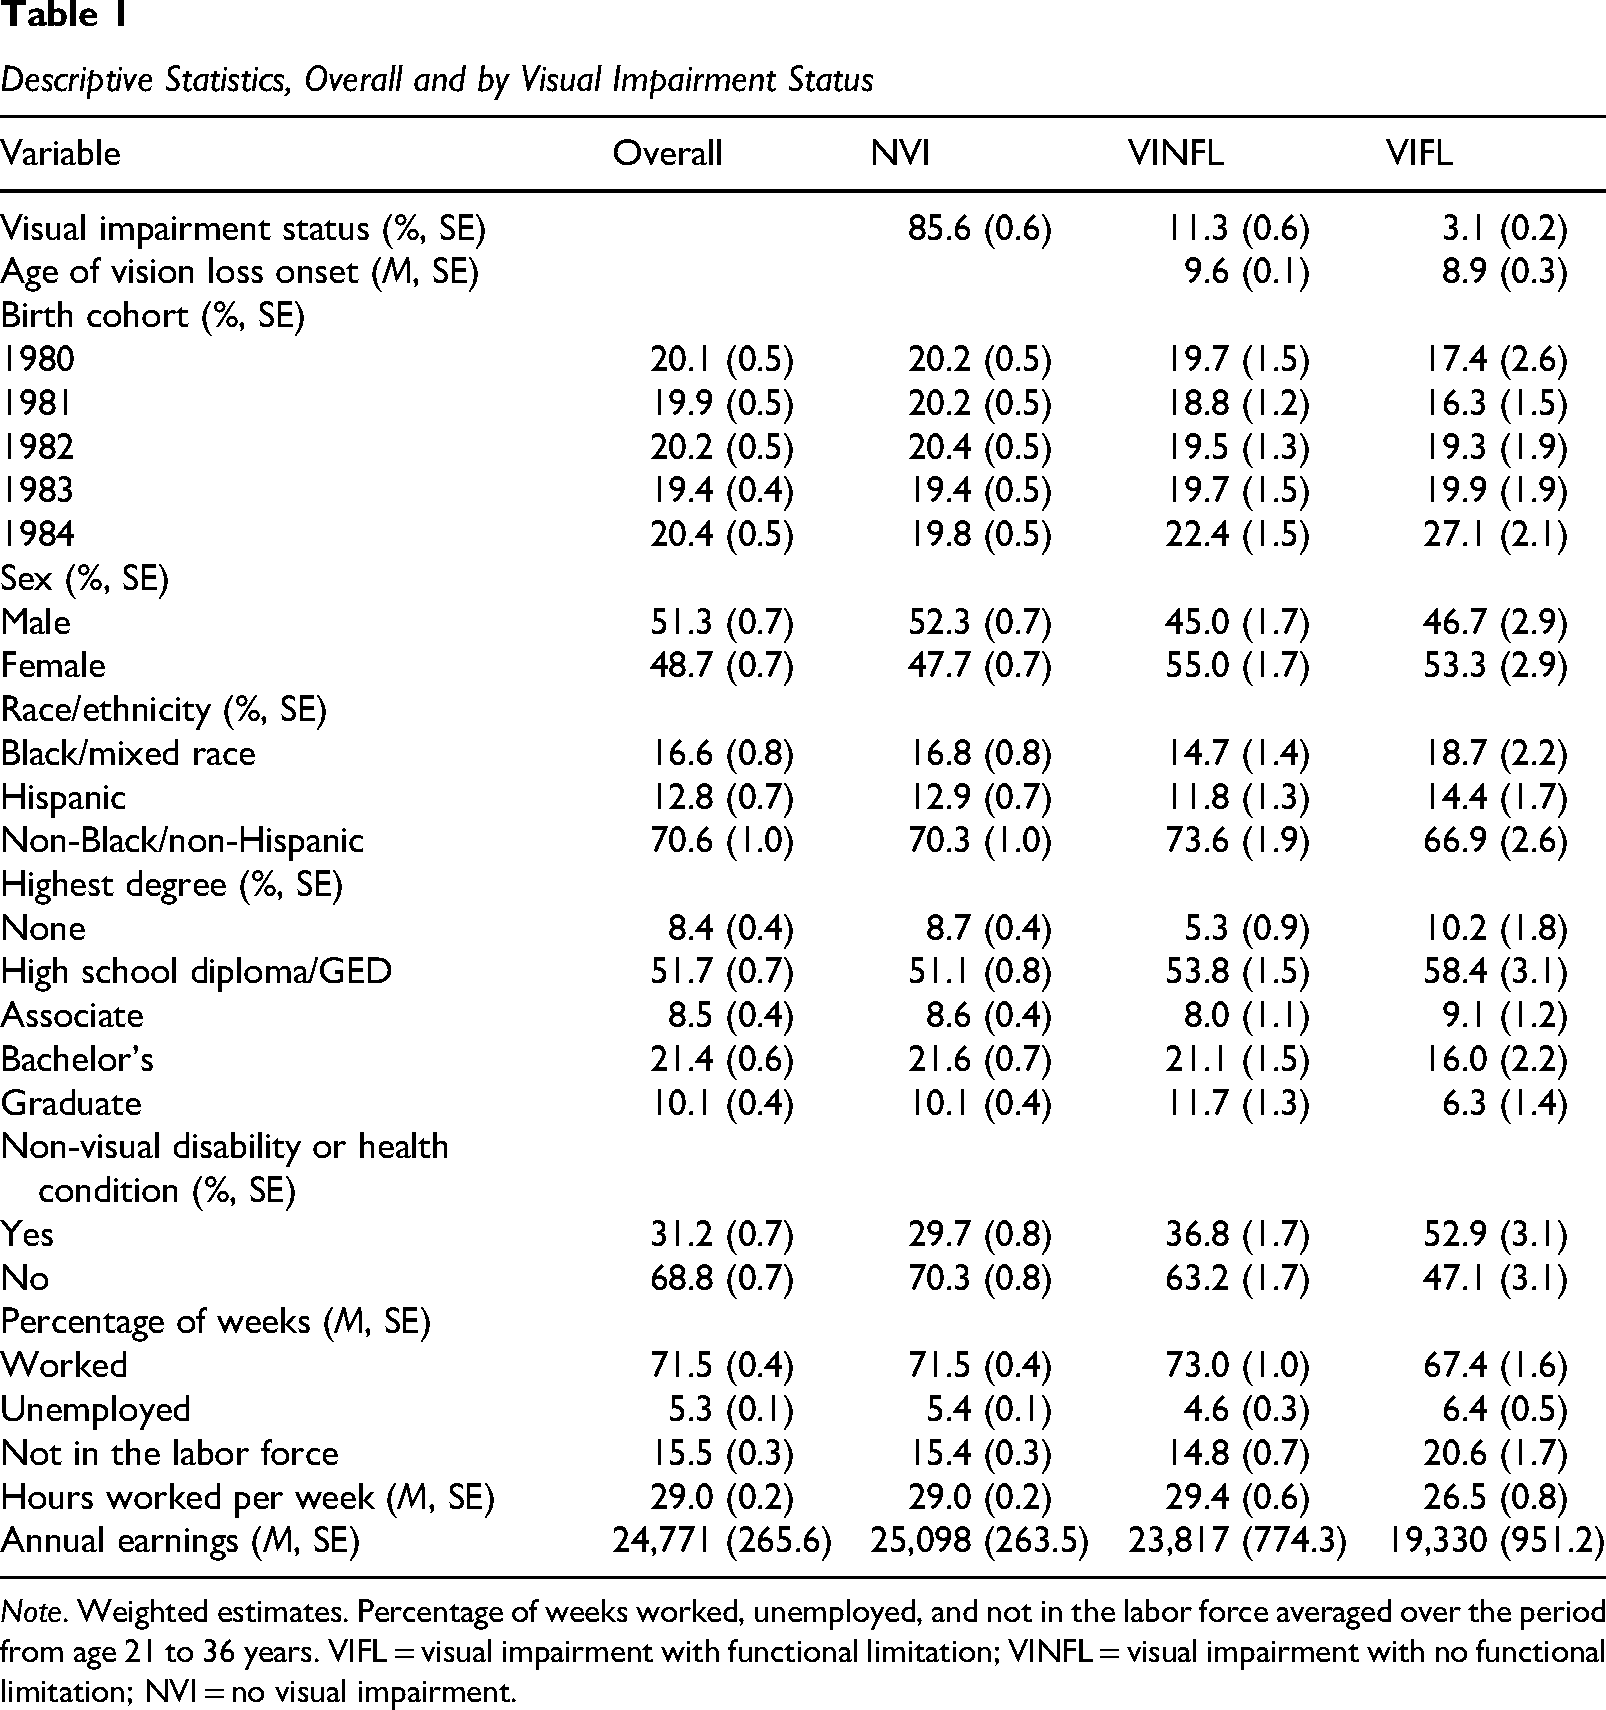
Note. Weighted estimates. Percentage of weeks worked, unemployed, and not in the labor force averaged over the period from age 21 to 36 years. VIFL = visual impairment with functional limitation; VINFL = visual impairment with no functional limitation; NVI = no visual impairment.
Percentage of Weeks Worked
Figure 1 shows the percentage of weeks worked per year from age 21 to 36 years by visual impairment status. The VIFL group consistently had the lowest mean percentage of weeks worked across all years compared to the VINFL and NVI groups. ANOVA results revealed a significant association between visual impairment status and the cumulative percentage of weeks worked, F(2, 8,684) = 4.13, p = .0161. Pairwise comparisons indicated a significant difference in the mean percentage of weeks worked between the VIFL group and both the VINFL group (p = .0017) and NVI group (p = .0094). However, the difference between the NVI and VINFL groups was not significant (p = .1391).
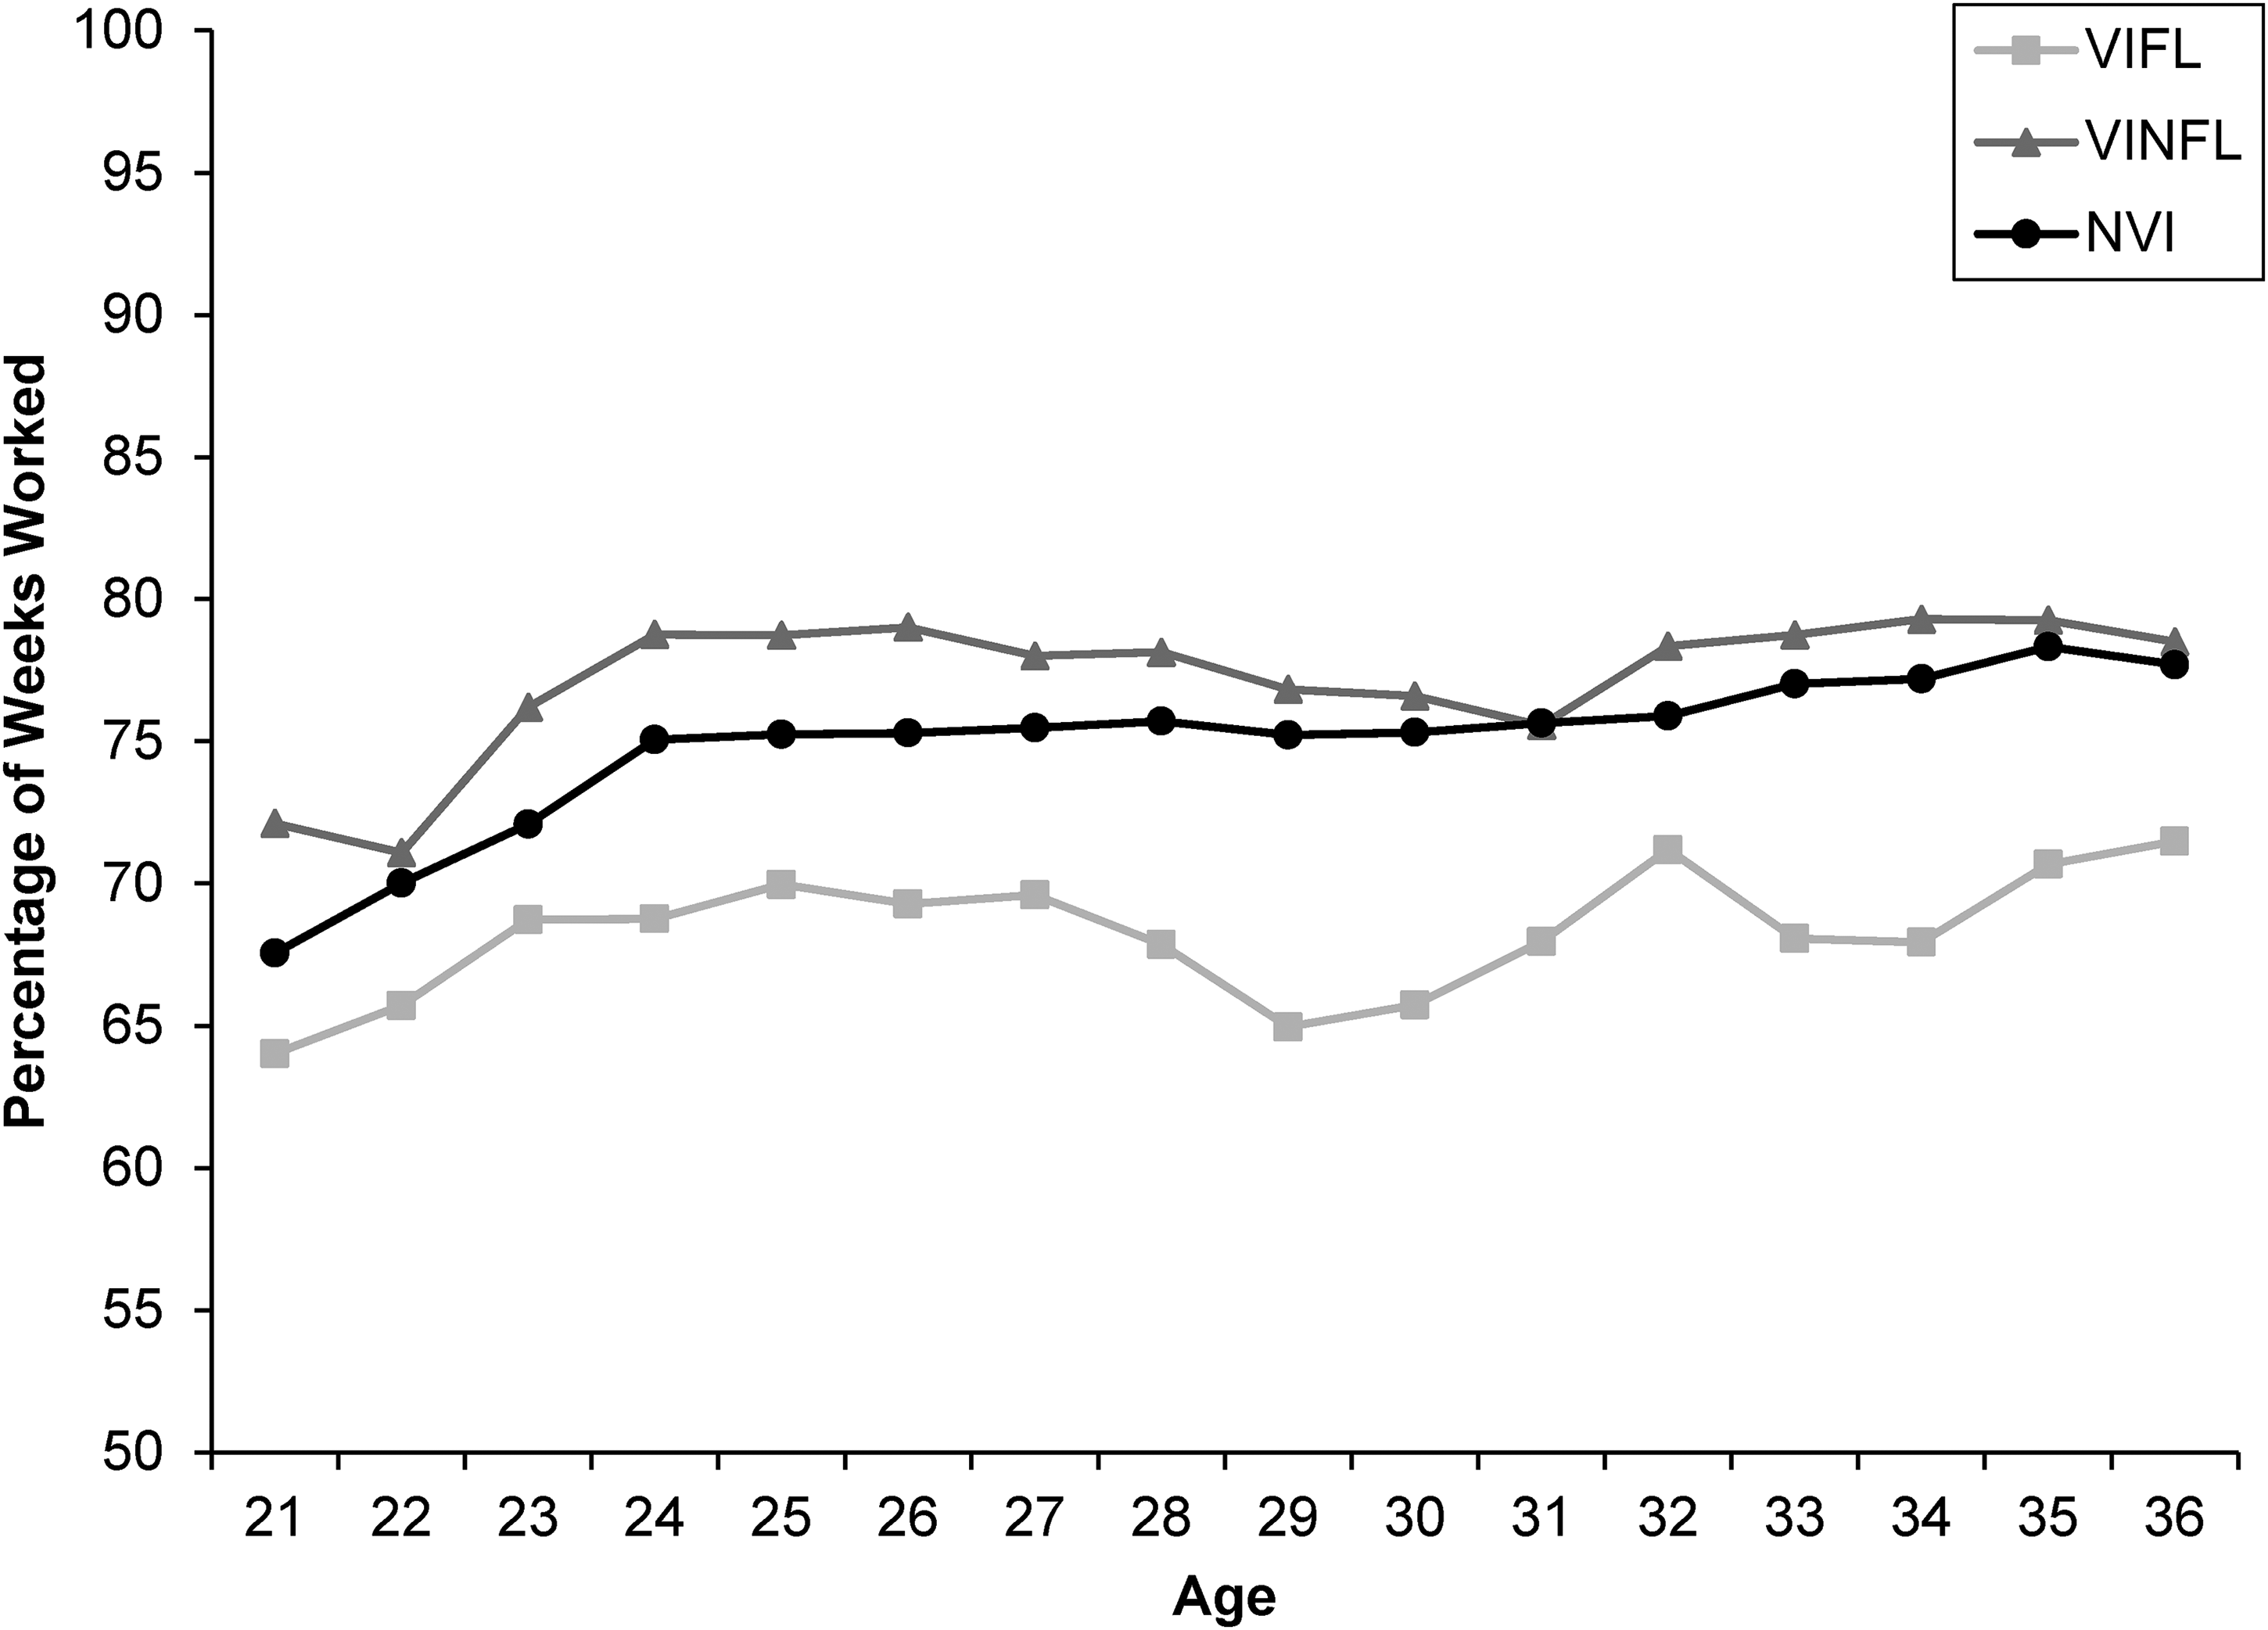
Percentage of Weeks Worked from Ages 21 to 36 Years by Visual Impairment Status
Percentage of Weeks Unemployed
Figure 2 displays the percentage of weeks unemployed by year by visual impairment status. The VIFL group had a much higher mean rate of unemployment at age 21 compared to other groups; however, the gap narrowed over time, with sporadic fluctuations observed throughout the age range. ANOVA results indicated a significant association between visual impairment status and the cumulative percentage of weeks unemployed, F(2, 8,682) = 5.52, p = .0040. There was a significant difference in the mean percentage of weeks unemployed between the VIFL group and both the VINFL group (p = .0012) and the NVI group (p = .0478). Additionally, a significant difference was observed between the VINFL group and the NVI group (p = .0096), with a lower percentage of the VINFL group being unemployed.
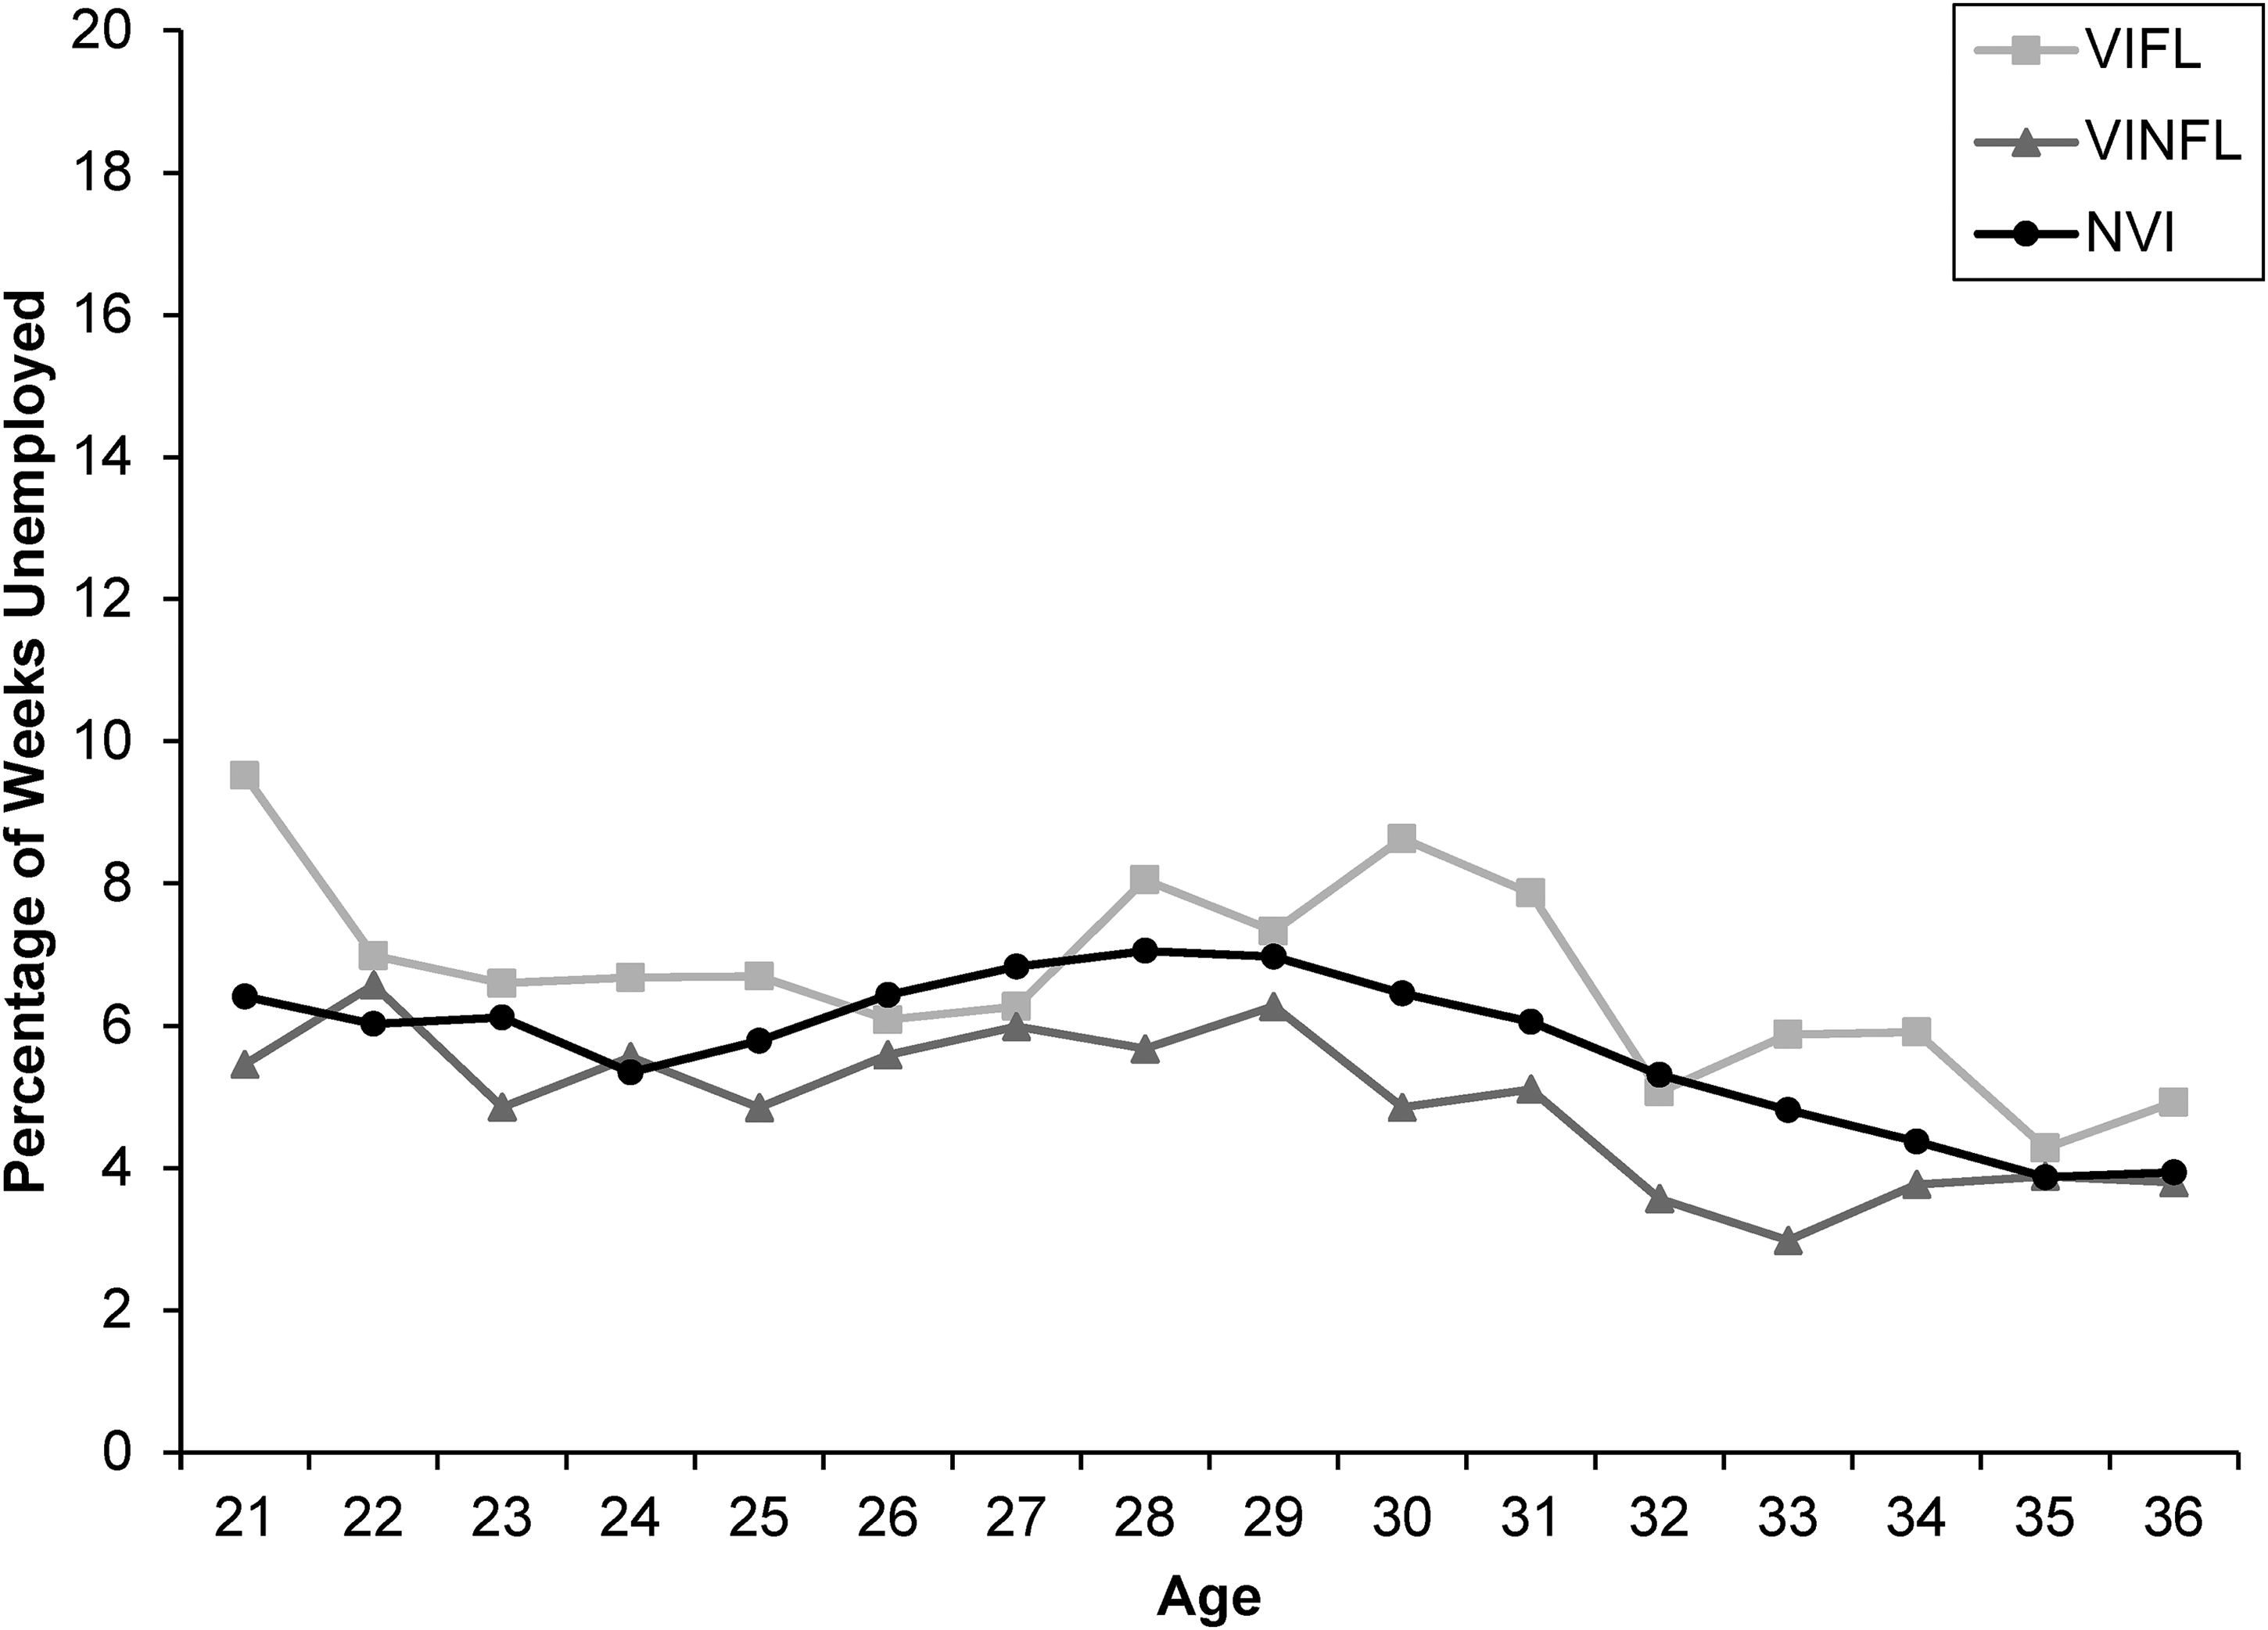
Percentage of Weeks Unemployed from Ages 21 to 36 Years by Visual Impairment Status
Percentage of Weeks Out of the Labor Force
The percentage of weeks not in the labor force per year by visual impairment status is presented in Figure 3. The VIFL group consistently had a higher mean rate of weeks out of the labor force compared to the other groups at every age. The ANOVA results confirm a significant association between visual impairment status and the cumulative percentage of weeks not in the labor force, F(2, 8,683) = 8.90, p = .0001. Pairwise comparisons revealed significant differences between the VIFL group and both the VINFL group (p = .0011) and the NVI group (p = .0021). There was no significant difference between the NVI and VINFL groups (p = .4404).
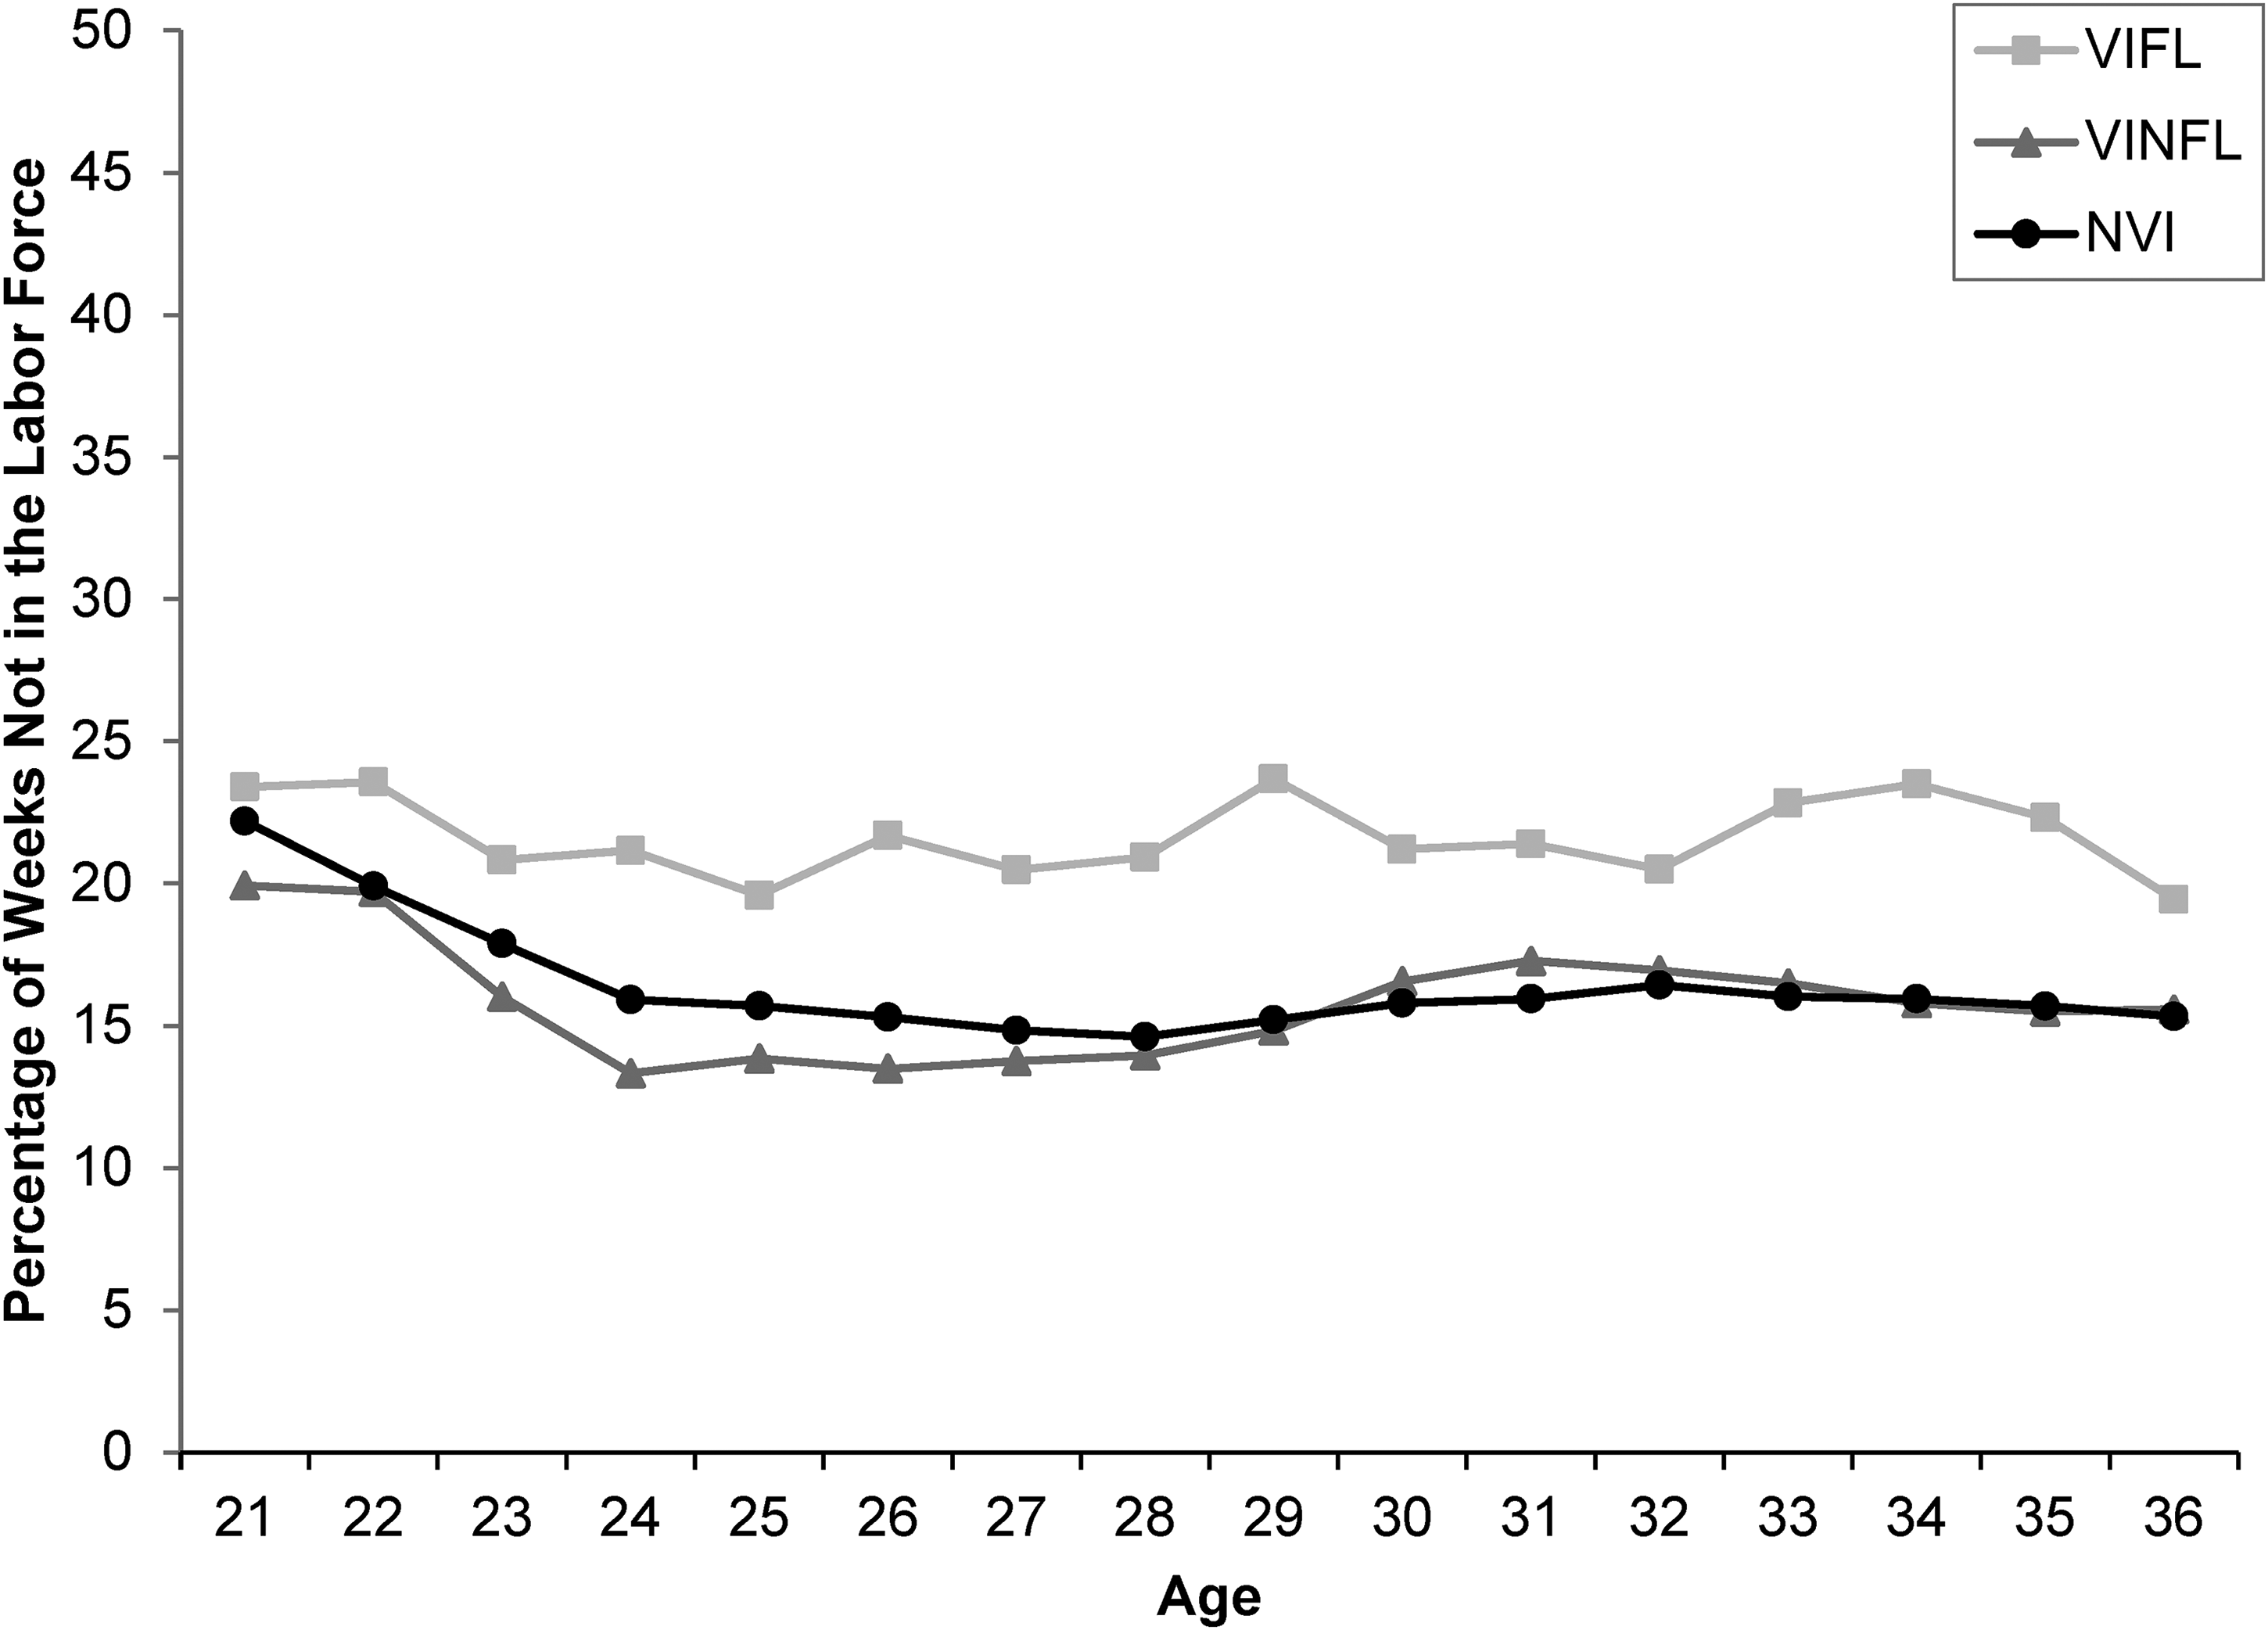
Percentage of Weeks Not in the Labor Force from Ages 21 to 36 Years by Visual Impairment Status
Average Hours Worked Per Week
Figure 4 shows the average hours worked per week per year by visual impairment status. The trend illustrates that the NVI group and the VINFL group worked an average of about 35 h per week by age 24 years. In contrast, the VIFL group did not reach a similar level of hours worked until around ages 29 to 31 years. By age 34 years, all three groups had similar number of average hours worked per week. ANOVA results indicate a significant association between visual impairment status and cumulative average hours worked per week, F(2, 8,507) = 4.93, p = .0073. There was a significant difference in the mean hours worked per week between the VIFL group and both the VINFL group (p = .0014) and the NVI group (p = .0007). The difference between the NVI and VINFL groups was not significant (p = .5179).
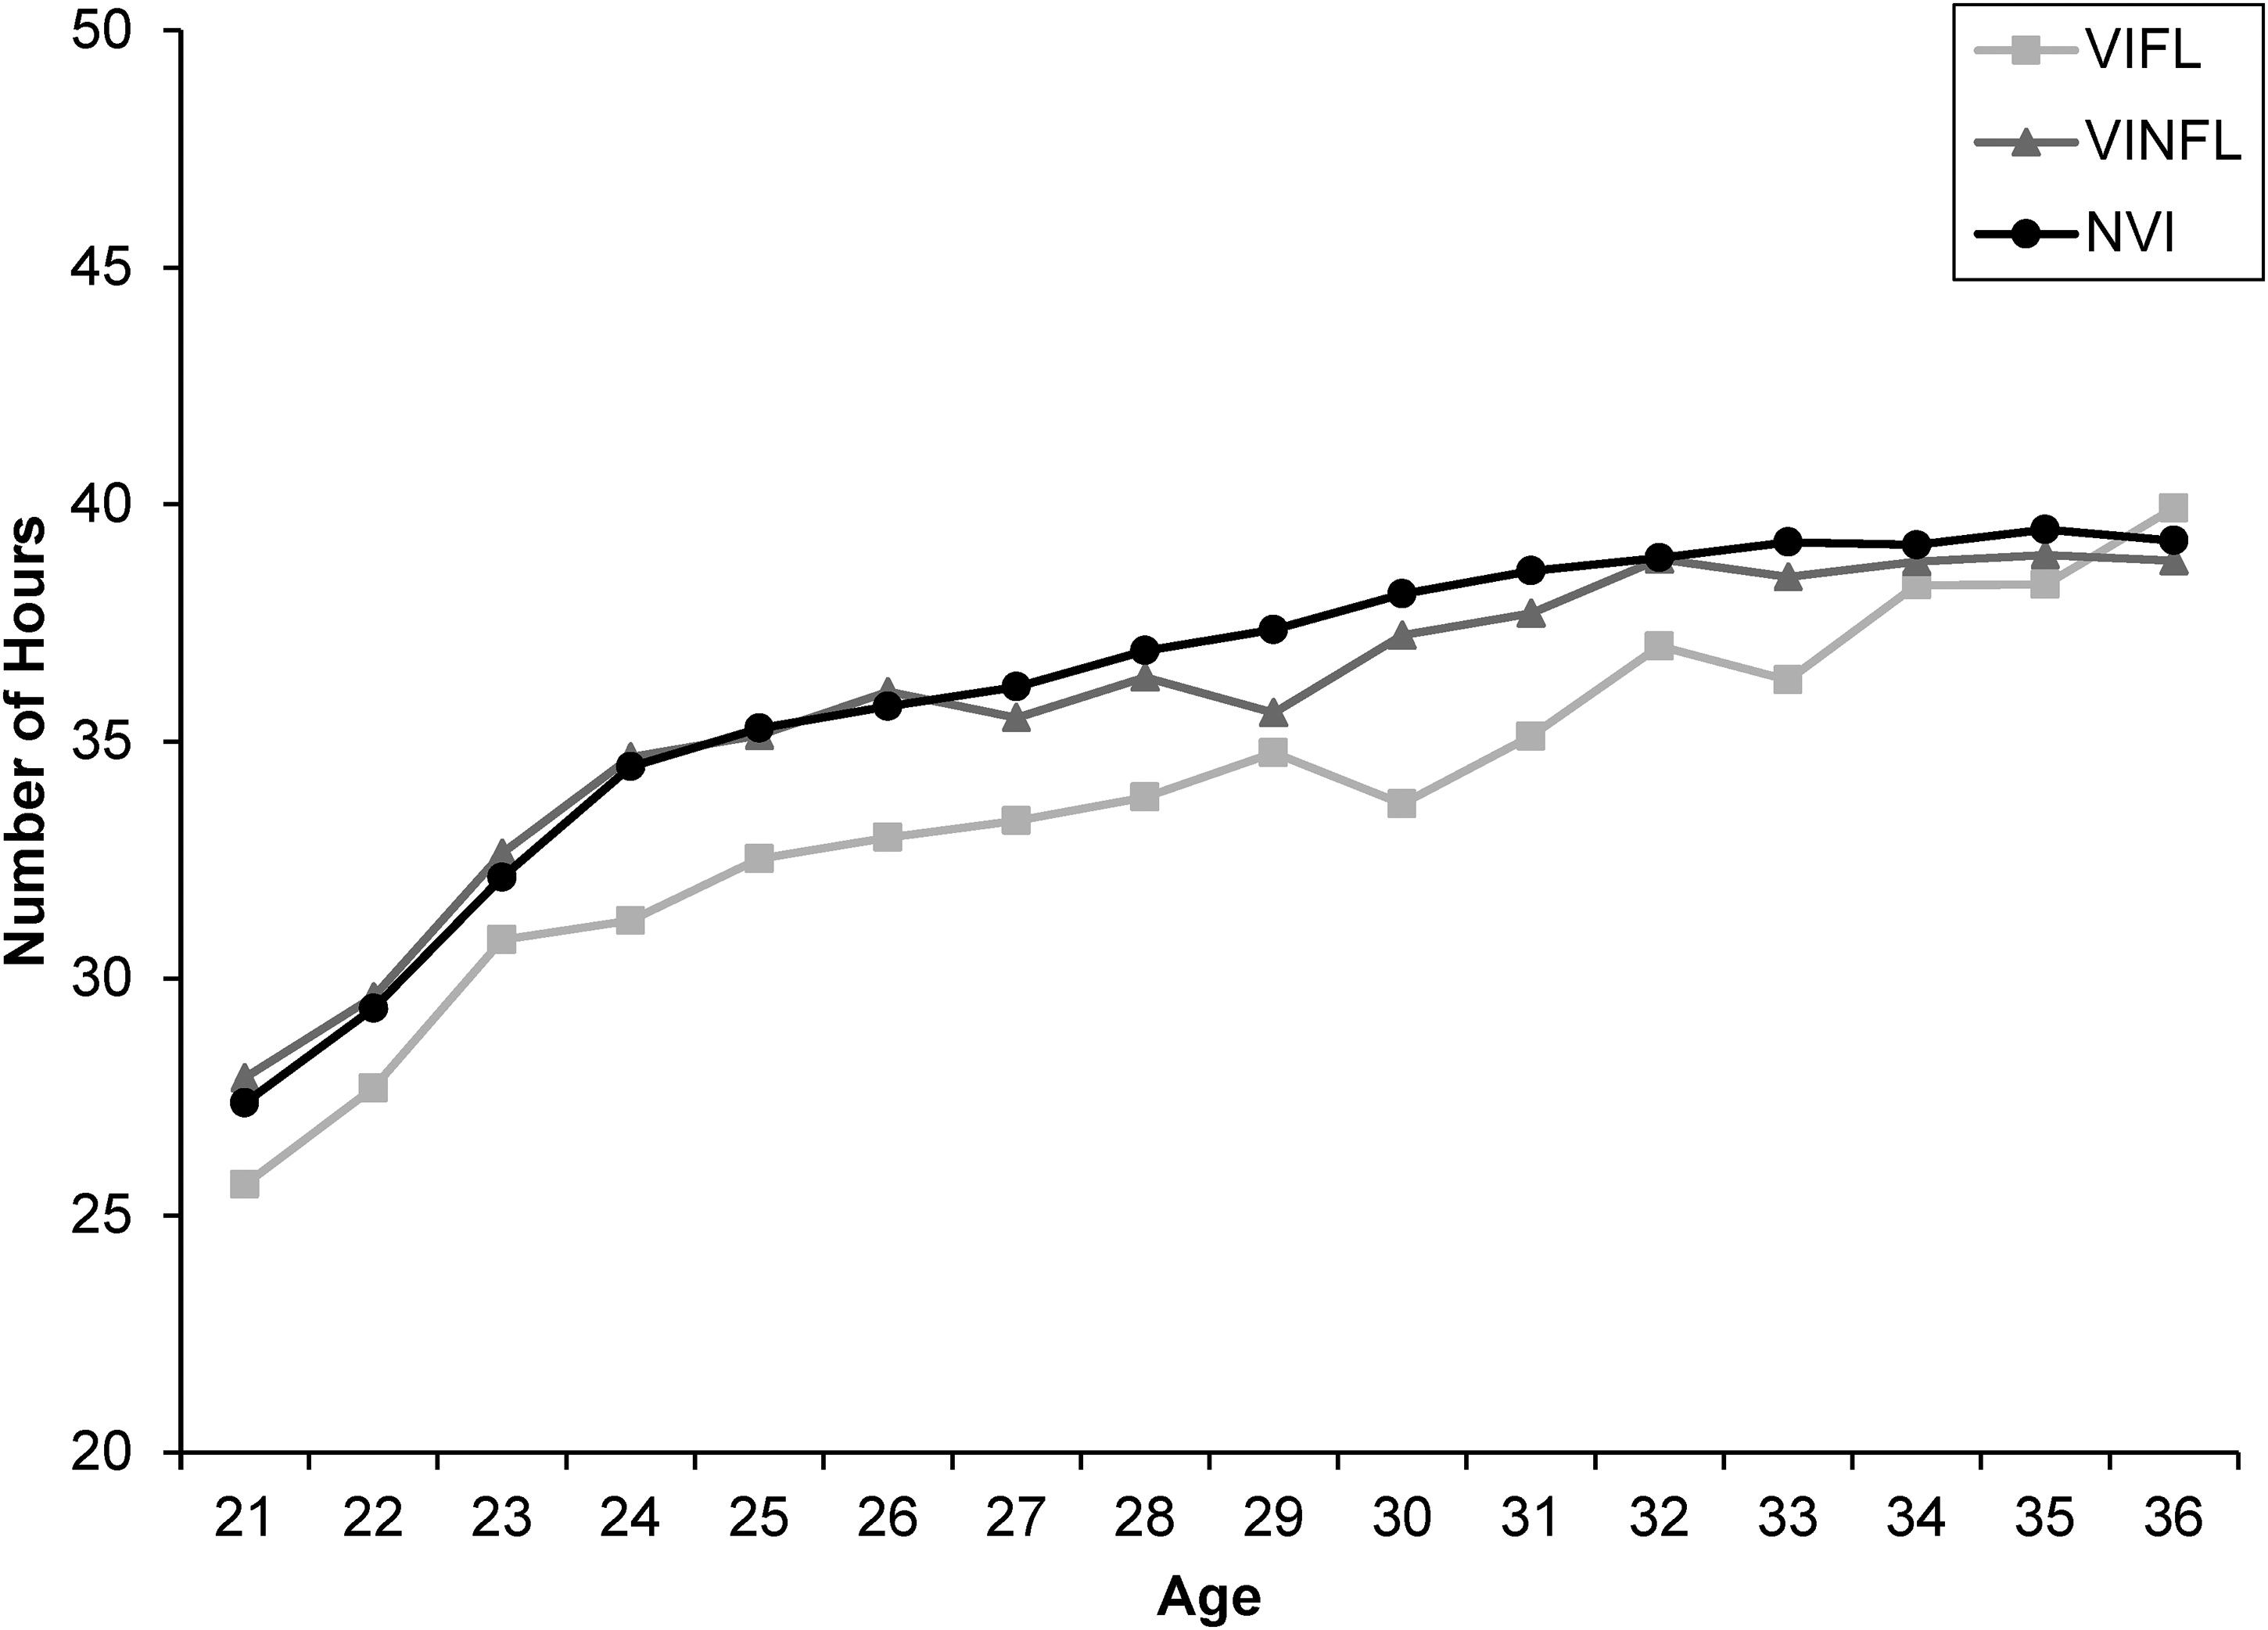
Average Hours Worked per Week from Ages 21 to 36 Years by Visual Impairment Status
Average Annual Earnings
Figure 5 depicts the trend in average annual earnings by visual impairment status. Average annual earnings increased over time for all groups, but the earnings gap between groups widened, particularly for the VIFL group. ANOVA results show a significant association between visual impairment status and cumulative average annual earnings, F(2, 8,219) = 15.59, p < .0001. Pairwise comparisons show significant differences in average annual earnings between the VIFL group and both the VINFL group (p = .0002) and the NVI group (p < .0001). The difference between the NVI and VINFL groups was not significant (p = .0948).
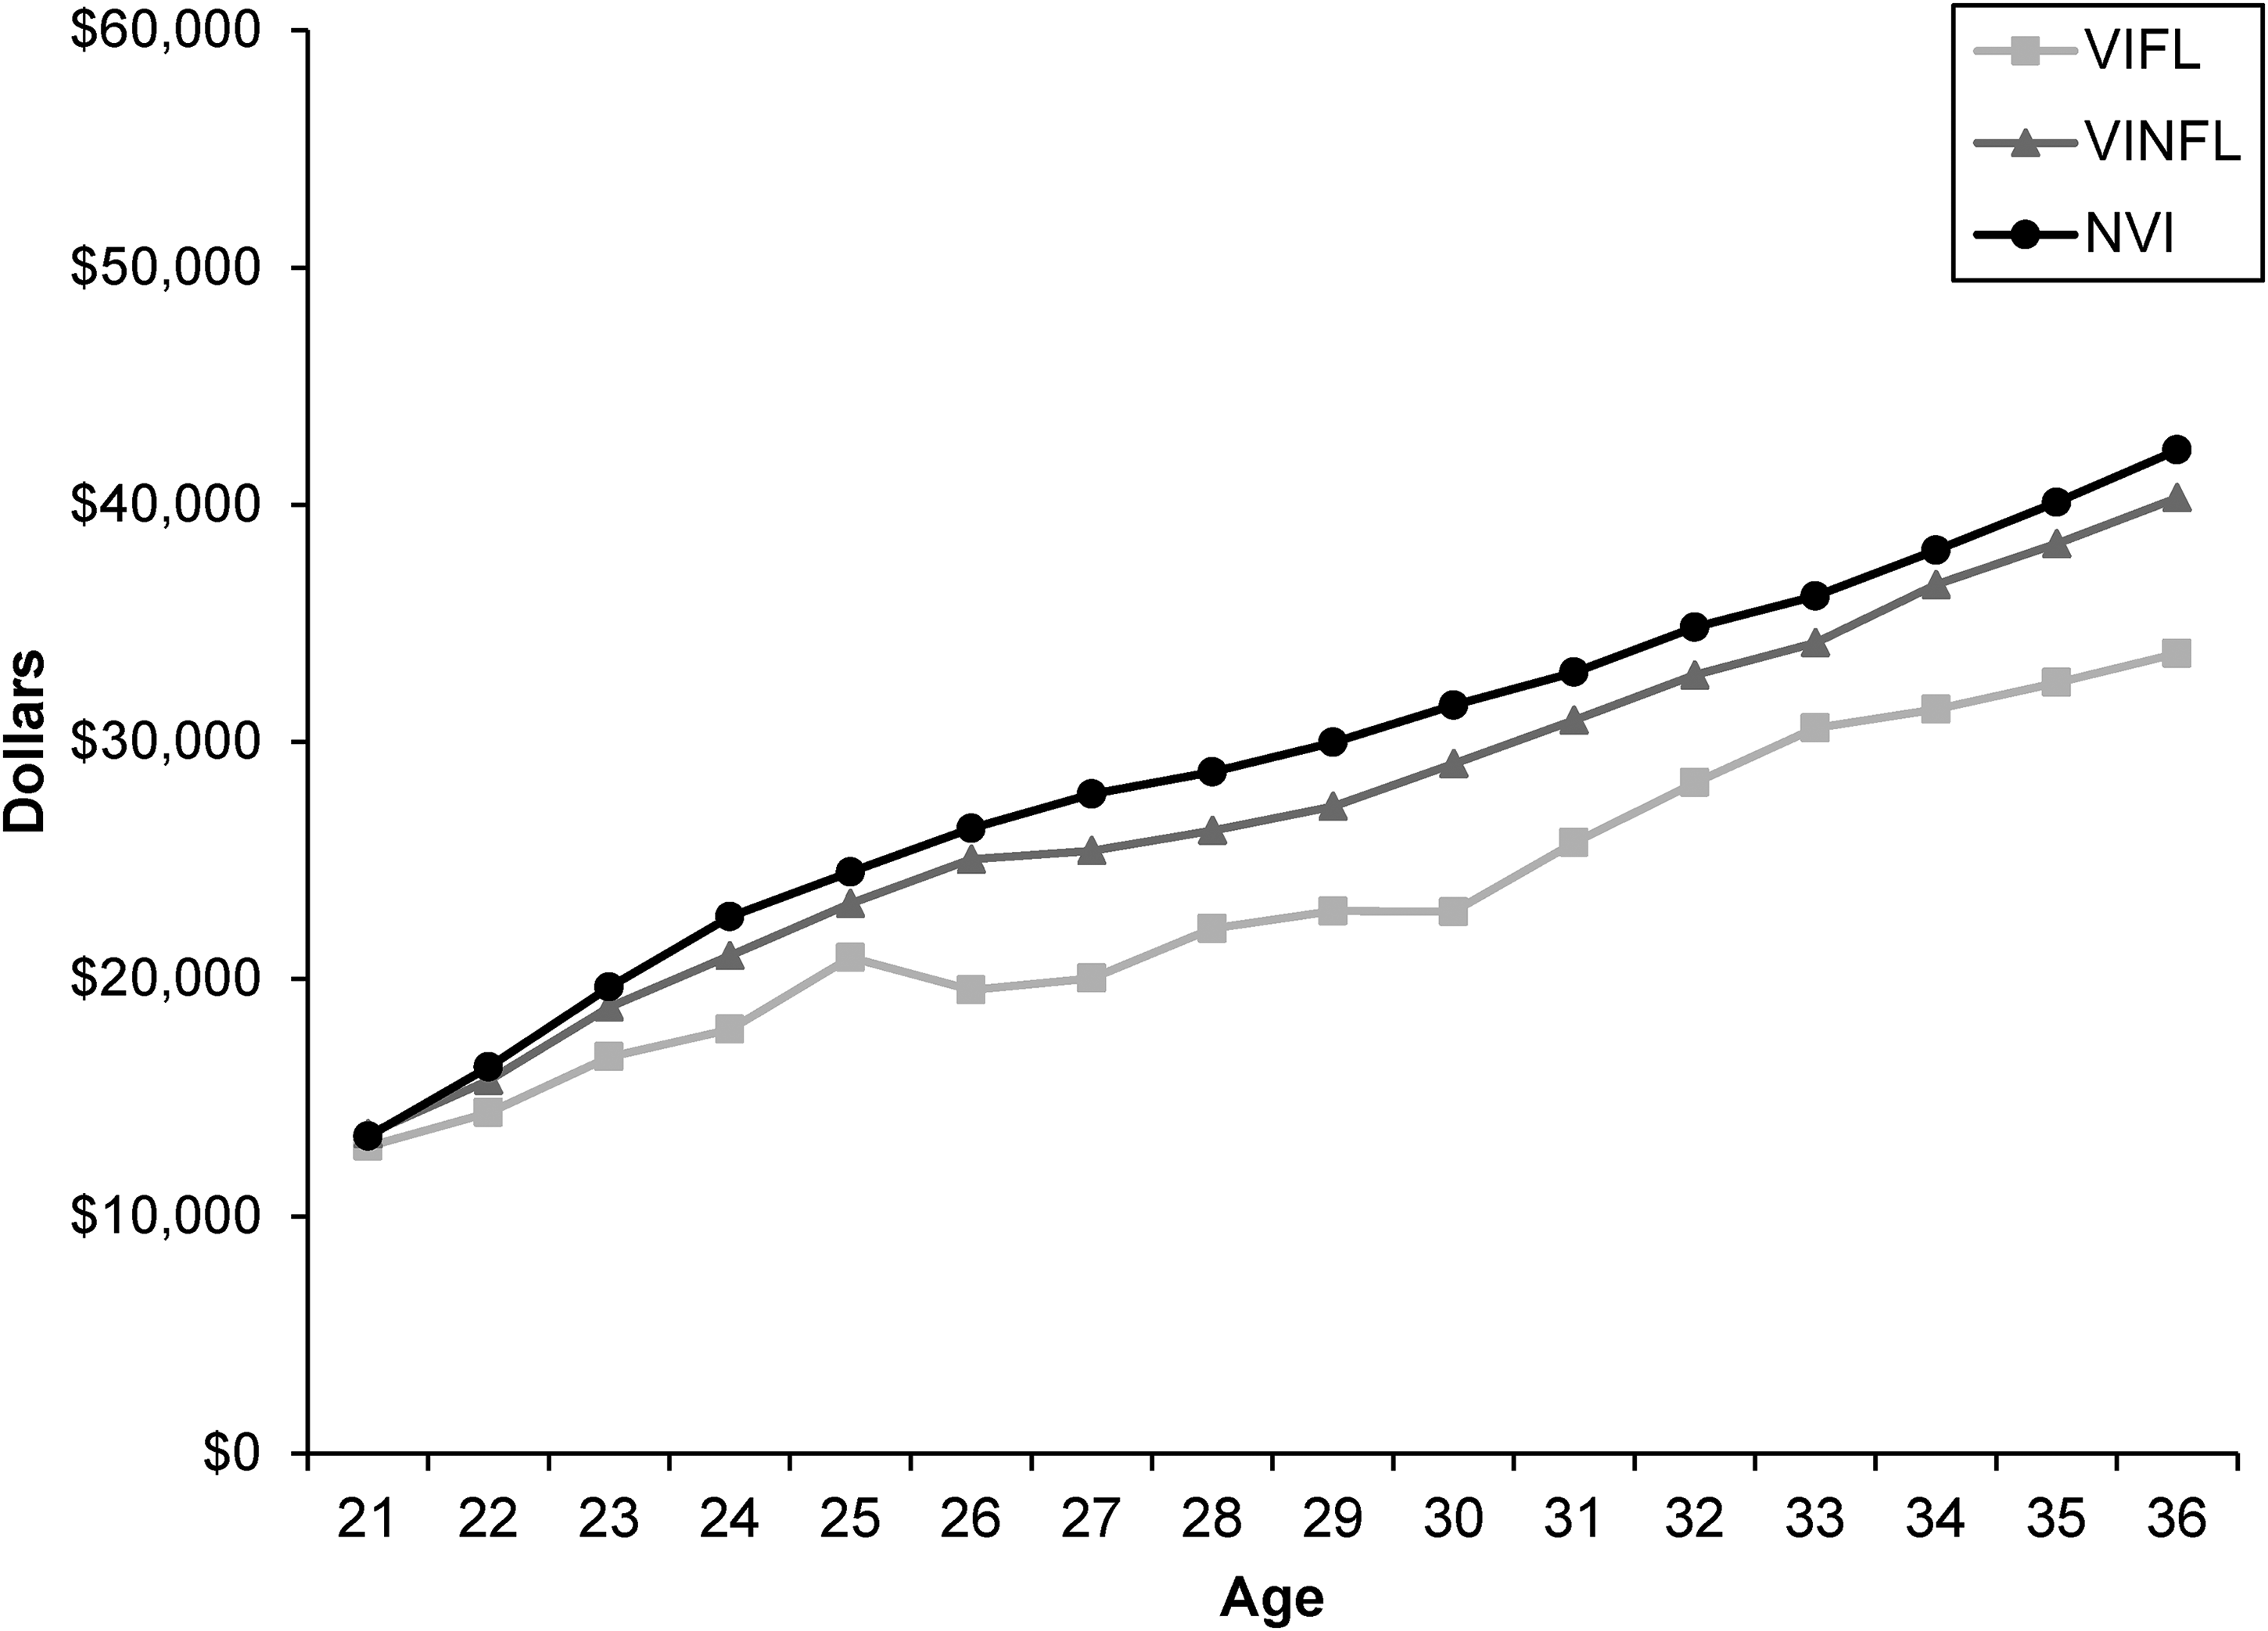
Average Annual Earnings from Ages 21 to 36 Years by Visual Impairment Status
Discussion
The purpose of this study was to compare several employment outcomes for young adults who experienced early onset of visual impairment to young adults without visual impairments. We utilized 16 years of longitudinal data to compare average outcomes for three groups of young adults (VIFL, VINFL, and NVI) and created graphs to visually display outcome patterns across ages for each group. Our study is the first to utilize NLSY97 data to investigate employment outcomes past age 27 years and the first to report multiple longitudinal employment outcomes for young adults with visual impairments. Overall, this study's results suggest disparities in employment outcomes for visually impaired young adults with self-perceived functional limitations but not for those without functional limitations. This supports previous findings of no differences in employment outcomes for youths with non-limiting disabilities and youths without disabilities (Mann & Honeycutt, 2014) and extends that finding to an older age range, specifically for youths with visual impairments.
Young adults who experienced VIFL as youths had significantly poorer average employment outcomes over time on all five outcome measures compared to young adults with VINFL and sighted young adults. The graphs provide a longitudinal picture of the outcome measures across ages 21 to 36 years. In terms of labor force status over time, we see a persistent gap in percentage of weeks worked at all ages for young adults with VIFL compared to both other groups, with young adults with VIFL working fewer weeks per year. This gap ranged from a low of approximately 4 percentage points to a high of 10. Correspondingly, there was also a persistent gap in percentage of weeks not in the labor force (not working or looking for work), with young adults with VIFL being out of the labor force substantially more weeks per year. Although not entirely consistent across ages, the percentage of weeks unemployed decreased for all groups, particularly for young adults with VIFL, and thus the unemployment gap between VIFL young adults and other groups narrowed as they aged.
For employed young adults, hours worked per week converged for all three groups by the mid-30s. The finding of increasing work hours coincides with the only other study that utilized NLSY97 data and hours worked as an outcome for young adults with VIFL (McDonnall, 2010) but extends that finding to older ages to the point of realizing parity with others. Although work hours parity between the groups is a positive finding, it makes the increasing earnings gap for young adults with VIFL an even greater concern. Contrary to other measures, earnings were equivalent for all three groups at age 21 years and increased for all groups over time but increases for young adults with VIFL were smaller. Other studies have documented discrepancies in earnings between people with visual impairments and the general population (Erickson et al., 2020), even when accounting for education level (McDonnall et al., 2022b), but this is the first study to compare longitudinal, age-specific earnings for these groups and find a widening gap over time. Reasons for the widening gap are unclear but could be associated with the types of jobs held or young adults with VIFL being less likely to receive promotions.
Although not a focus of the study, it is interesting to note that the gender difference in the prevalence of visual impairment documented for adults (Courtright & Lewallen, 2009; International Agency for the Prevention of Blindness, 2024) was also present in youths, with both VIFL and VINFL youths more likely to be female than youths without visual impairments. Reasons for women being more likely to experience visual impairment include their longer life expectancy and age-related visual conditions, greater risk for some eye conditions (primarily in low and middle-income countries), and less access to eye health services (Courtright & Lewallen, 2009). Given that the first reason does not apply to youths and the last two reasons are uncommon in the United States, our finding of a greater prevalence of visual impairments in females at a young age may be noteworthy.
Limitations
A limitation of this study is the way visual impairment and functional limitations were measured in the NLSY97 data. The broad question about having “trouble seeing” does not preclude a respondent from indicating difficulty associated with refractive errors, and some people in the VINFL group may have reported vision difficulty that was corrected with eyeglasses or contacts. Similarly, the question about functional limitations is broad and open to interpretation. We grouped our data based on respondent age rather than calendar year to evaluate trends by age, but this approach does not allow tracking the effect of annual U.S. economic conditions, which varied substantially during the study's time frame. Relatedly, inclusion of data from 2020, the first year of the COVID-19 pandemic, for participants born in 1984 could have affected the results for that group. Finally, average income was an annual measure for the first 9 years of the study but then became biennial, resulting in significant missing data at later ages that required linear interpolation.
Implications and Future Research Directions
Although employment outcomes exhibited a slight improvement for young adults with VIFL between the ages of 21 and 36 years, gaps in those outcomes between this group and others remained for most measures. For example, although the percentage of weeks worked increased slightly as young adults with VIFL aged, this measure increased slightly for all young adults over time. Thus, many employment disparities present for youths with VIFL at age 21 years continued as they transitioned to adulthood, although disparities did decrease in weeks unemployed and average hours worked. For practitioners working with youths with visual impairments, the fairly persistent gap in weeks worked suggests the importance of encouragement for working at all ages. A significant amount of research has documented the association between early work experiences and later employment (Lund & Cmar, 2020); thus, youths who work during and after high school may have additional opportunities for employment in their 20s and 30s.
An exception to small, consistent or narrowing gaps was the widening earnings gap. Practitioners should ensure that youths with visual impairments graduate from high school with the skills they need to succeed in college and advance in their careers. Although not in effect when NLSY97 participants were younger, career exploration should now be offered to youths who receive vocational rehabilitation services as part of pre-employment transition services (National Council on Disability, 2017). Careful career exploration and planning may help youths embark on career paths that will lead to increased earnings over time. Investigating factors associated with the earnings gap beyond vision status is an essential avenue for future study. The fact that some outcomes changed over time suggests the need for using long-term, in addition to short-term, outcome data to evaluate the effectiveness of youth and young adult employment programs.
Our study illustrates the importance of considering outcomes of young adults with VIFL compared to their sighted peers. Although gaps existed between young adults with VIFL and the other groups, most gaps were relatively small. This finding coincides with studies of the entire working-age population, in which gaps in part-time versus full-time work and part-year versus year-round work between adults with visual impairments and sighted adults were small (McDonnall et al., 2022c, 2022a). These collective results are a reminder of the importance of putting employment outcomes into the context of outcomes for the general, or sighted, population.
Another key implication of our study is the definition of visual impairment when using NLSY97 data. Differentiating between people who report vision conditions with and without functional limitations and focusing on those who report functional limitations will more closely approximate the population of people with visual impairments. Finally, the group averages presented here do not tell the whole story of employment experiences for young adults with VIFL; more descriptive analyses with the NLSY97 data focusing on this population would be beneficial.
Footnotes
Declaration of Conflicting Interests
The author(s) declared no potential conflicts of interest with respect to the research, authorship, and/or publication of this article.
Funding
The author(s) disclosed receipt of the following financial support for the research, authorship, and/or publication of this article: The contents of this manuscript were developed under a grant from the U.S. Department of Health and Human Services, National Institute on Disability, Independent Living, and Rehabilitation Research (grant number 90RTEM0007). However, these contents do not necessarily represent the policy of the Department of Health and Human Services and should not indicate endorsement by the Federal Government.