
Abstract
Purpose
The purpose of this study is to determine if race disparities in glycemic control differ in young vs older white and African American patients with diabetes.
Methods
Electronic medical record data were gathered from 1431 primary care patients ≥18 years old, diagnosed with type 2 diabetes, who had ≥2 A1C measurements between July 1, 2008, and June 30, 2015. A1C values were used to compute the average monthly glycemic burden (AMGB). AMGB is the average monthly cumulative amount of A1C >7.5. Age-stratified (18-50 vs >50 years old) linear regression models were computed to measure the association between race and AMGB before and after adjusting for covariates.
Results
Younger compared to older patients had significantly greater AMGB. In younger patients, AMGB was not significantly different in African American vs white patients. In older patients, African Americans had significantly greater AMGB compared to whites, and this association remained significant after adjusting for all covariates in a linear regression model.
Conclusions
Results narrow the known race disparity in glycemic control to older African American patients. Substantial AMGB in white and African American younger patients warrants aggressive clinical and public health interventions that could help patients manage their diabetes and reduce their risk for diabetes-related health conditions.
As the obesity epidemic continues, more patients are developing type 2 diabetes at a younger age. 1 Younger adult-onset (ages 21-64) type 2 diabetes is associated with worse diabetes-related distress, more depression symptoms, less exercise, higher exposure to adverse life events, and low diabetes self-efficacy, which all contribute to worse glycemic control.1-4 The association between younger age and worse glycemic control has been demonstrated across many different regions of the world.5-7 For example, among commercially insured patients, 47% of those aged 20 to 64 years failed to maintain an A1C below 7%, while 38% of Medicare patients aged 65 and older did not meet this goal. 7
In addition to age disparities, race has been associated with poor glycemic control and worse type 2 diabetes outcomes.8-11 The majority of evidence indicates African American patients have worse glycemic control 8 and more diabetes-related comorbidities7,12 than non-Hispanic whites. Greater glycemic burden among African Americans may be due to higher age-adjusted prevalence of obesity, more exposure to neighborhood environments that create stress and limit access to healthy food and exercise, lower rates of self-monitoring of blood glucose, and undertreated depression. 13 Depression may decrease motivation to engage in good self-management and contribute to less physical activity, poor diet, and inadequate blood glucose monitoring. 14
The incidence of type 2 diabetes in persons 18 to 39 years of age is greater in African Americans compared to whites. 15 Given African American patients tend to have worse glycemic control, it is possible that some of the differences in glycemic control associated with age are due to the larger number of young African Americans compared to young whites with type 2 diabetes.
It is not known how much of the age difference in glycemic control is attributable to the earlier onset of type 2 diabetes in African Americans or whether all younger patients have worse glycemic control compared to older patients. No existing studies have determined if differences in glycemic control in white and African American patients are similar for younger vs older patients. To determine if poor glycemic control is specific to younger and older African Americans, worse in young African Americans, or worse in both young white and African American patients, medical record data from a large primary care patient data registry were analyzed to determine if racial differences in glycemic burden were different for younger (ie, 18-50) vs older (ie, >50) white and African American patients.
Method
Design
Retrospective cohort design using data from electronic medical records.
Patients
Deidentified medical record data were obtained from the Department of Family and Community Medicine’s Primary Care Patient Data Registry (PCPD). The PCPD contains 33 661 patients who had a clinic visit to any of the 3 academic family medicine locations or any of the 3 general internal medicine locations between July 1, 2008, and June 30, 2015. The primary care clinics are located in urban and suburban St Louis and provide care for a wide range of demographic groups, including wealthy and those living in poverty. The PCPD contains electronic health record data on diagnoses, prescriptions, laboratory results, referrals, social history, vital signs, and demographics. The PCPD has been used in numerous studies, including several reports on diabetes management.16-18 The creation of the PCPD for primary care research was approved by Saint Louis University’s Institutional Review Board.
Eligibility
Patients eligible for the present analysis were 18 years or older (n = 31 569); had nonmissing sociodemographic data (n = 30 627); had a diagnosis of type 2 diabetes (n = 3462); had at least 2 A1C measurements on or after their first type 2 diabetes visit between July 1, 2008, and June 30, 2015 (n = 1464); and were either white or African American, resulting in a final analytic data set of 1431 primary care patients.
Variable Definitions
The outcome variable was average monthly glycemic burden (AMGB).19,20 AMGB was computed by first computing the total glycemic burden and dividing the total glycemic burden by the number of months between the first and last available A1C measure.19,20 Total glycemic burden is the cumulative amount, measured in months, by which A1C exceeded a threshold of 7.5. It is assumed that the change between a pair of measurements represents a linear function such that the resulting total glycemic burden is an estimate of the area under the curve (eg, sum of the differences between measured or interpolated A1C and threshold over all observed months). Each unit of total glycemic burden represents 1 month of an A1C that is 1 percentage point higher than an A1C >7.5.19,20 For example, 10 units of total glycemic burden means a patient could have had 10 months at an A1C of 8.5 or 5 months at an A1C of 9.5.
Because each patient had a different amount of time over which total glycemic burden was calculated, the total glycemic burden was divided by number of months between first and last A1C measurement, yielding AMGB. For example, an AMGB of 2 points per month could represent a patient with 10 units total glycemic burden over 5 months or 20 units total glycemic burden over 10 months.
Predictor variables
Age groups were dichotomized into younger (18-50 years) and older (>50 years) patients. Self-identified race, recorded in the medical record, was white or African American.
Covariates
Covariates were selected based on association with age, race, and A1C control. Models adjusted for self-reported current smoking vs never/past smoker, obesity (measured by International Classification of Diseases, Ninth Revision [ICD-9] diagnosis or body mass index [BMI] ≥30 kg/m2), and ICD-9 diagnoses for depression, vascular disease, hypertension, and hyperlipidemia. Models adjusted for the use of any antidiabetic medications, indicated by a prescription order for metformin, other antidiabetic medications (eg, acarbose, alogliptin, canagliflozin, exenatide, glimepiride, glipizide, glyburide, linagliptin, liraglutide, nateglinide, pioglitazone, repaglinide, rosiglitazone, saxagliptin, sitagliptin, tolazamide, tolbutamide), and insulin. Referral to dietary education for patients with diabetes was included as a covariate.
Health care utilization was adjusted to control for detection bias. Health care utilization was computed from the distribution of the average number of clinic visits per month and quartiled. The top 25th percentile (high health care utilization) vs the bottom 75th percent of average clinic visits per month was the binary indicator of high health services utilization.
Demographics included sex, marital status (married vs other), and neighborhood socioeconomic status (nSES). The nSES variable was computed by linking patient ZIP code to US census information. 21 ZIP code–level information on (1) percentage of households with income below the poverty level, (2) percentage of households receiving public assistance, (3) percentage of households with an annual income below $35,000, (4) percentage of adult men aged 20 to 64 years not in the labor force, (5) percentage of adults 25 years and older with less than high school education, (6) log of median household income, and (7) log of median value of single-family homes was summarized into a single score, with a higher score indicating lower nSES. 21 The score was dichotomized into high vs low nSES based on a median split.
Analytic approach
The observation period was treated as a cross-sectional analysis of AMGB for each patient from 2008 to 2015. All analysis was conducted using SAS v9.4 (SAS Institute, Cary, North Carolina). Chi-square and independent samples t tests were computed to measure the bivariate associations of race and age group with categorical and continuous variables, respectively. Bivariate analyses by race were then stratified, a priori, by age (18-50 vs >50 years). Separate linear regression models assessing the relationship of race and AMGB were computed before and after adjusting for covariates for the overall sample. Age-stratified (18-50 vs >50 years) linear regression models were then computed before and after adjusting for covariates.
Results
As shown in Table 1, the sample was predominately >50 years of age (84.8%), and most patients were African American (61.4%). The mean (SD) AMGB was 0.78 (1.24) in the total sample. The AMGB was significantly larger among younger compared to older patients (mean [SD] = 1.36 [1.47] vs 0.68 [1.17], P < .0001). The prevalence of obesity, metformin and insulin prescription, and referral to dietary education were all significantly higher among younger vs older patients (P < .0001). Conversely, vascular disease, hypertension, and hyperlipidemia were all significantly more prevalent among older patients (P < .0001).
Average Monthly Glycemic Burden and Covariate Distribution Overall and by Age Group Among Adult White and African American Primary Care Patients With Type 2 Diabetes, July 1, 2008, to June 30, 2015 (n = 1431) a
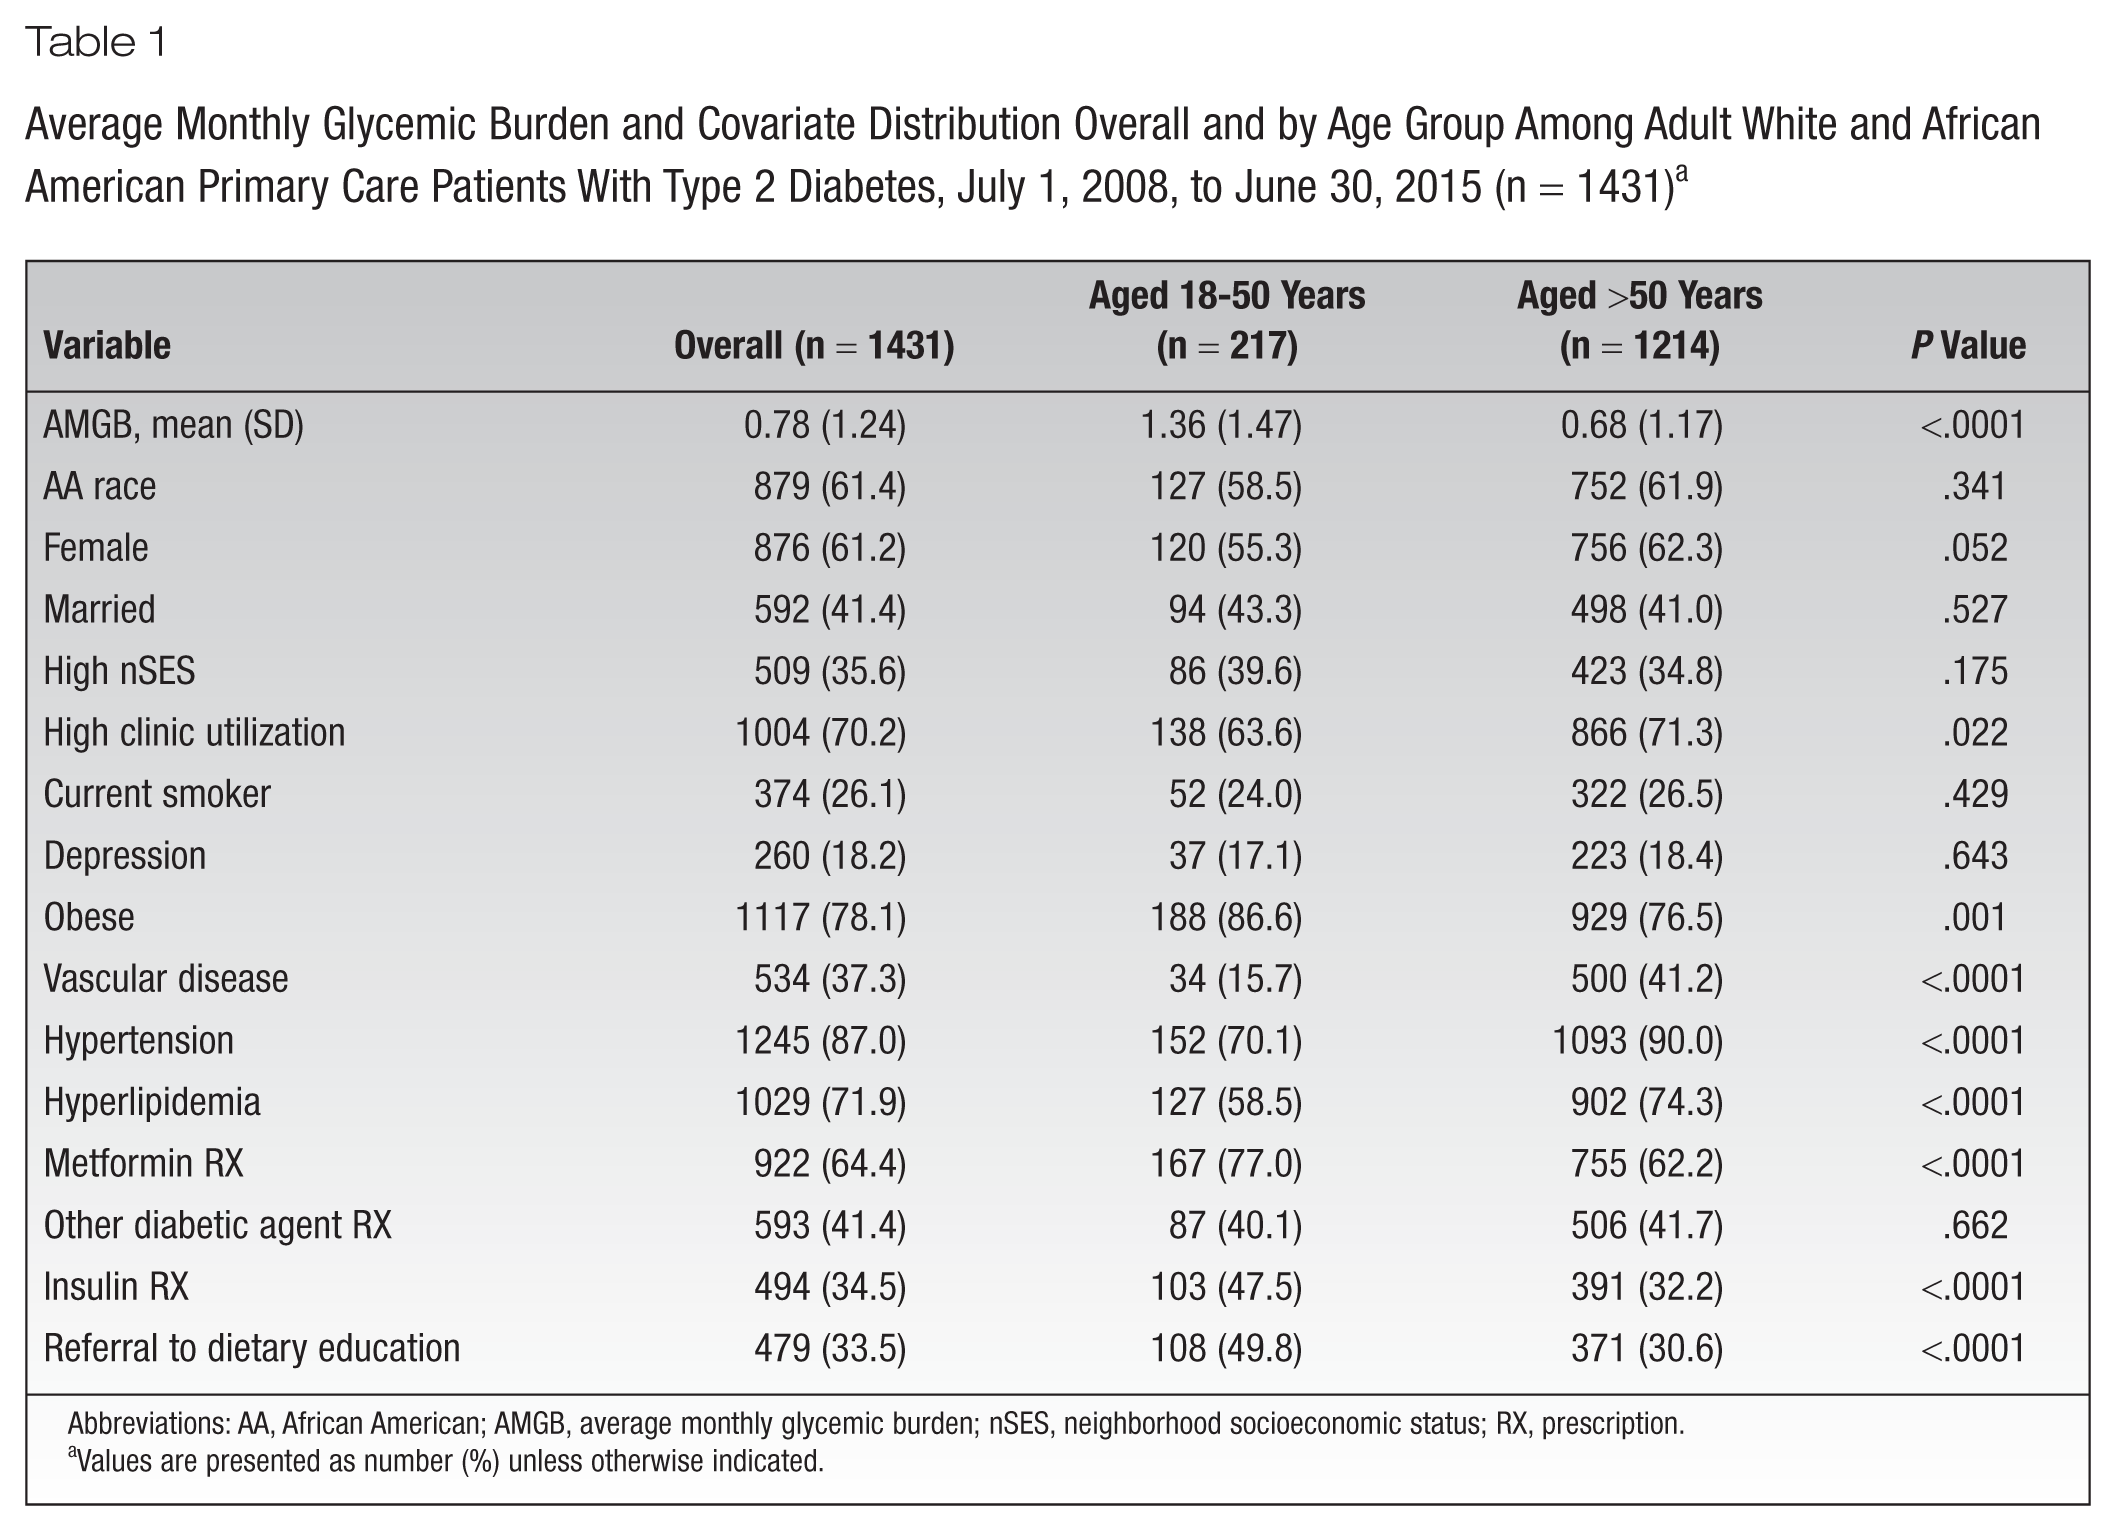
Abbreviations: AA, African American; AMGB, average monthly glycemic burden; nSES, neighborhood socioeconomic status; RX, prescription.
Values are presented as number (%) unless otherwise indicated.
As shown in Table 2, AMGB was significantly greater among African American compared to white patients (mean = 0.89 vs 0.61, P < .0001). Compared to African American patients, white patients were more likely male, were married, and had a higher nSES. Depression was almost twice as prevalent among white patients compared to African American patients (P < .0001). Hypertension was significantly more prevalent among African American patients (P < .0001) while hyperlipidemia was significantly more prevalent among white patients (P = .0003). Receiving a prescription for metformin and for any other diabetic agent was significantly more common among white patients (P = .016 and P = .001, respectively) while insulin prescription was more prevalent among African American patients (P = .034).
Average Monthly Glycemic Burden and Distribution of Covariates by Race Among Adult Primary Care Patients With Type 2 Diabetes, July 1, 2008, to June 30, 2015 (n = 1431) a
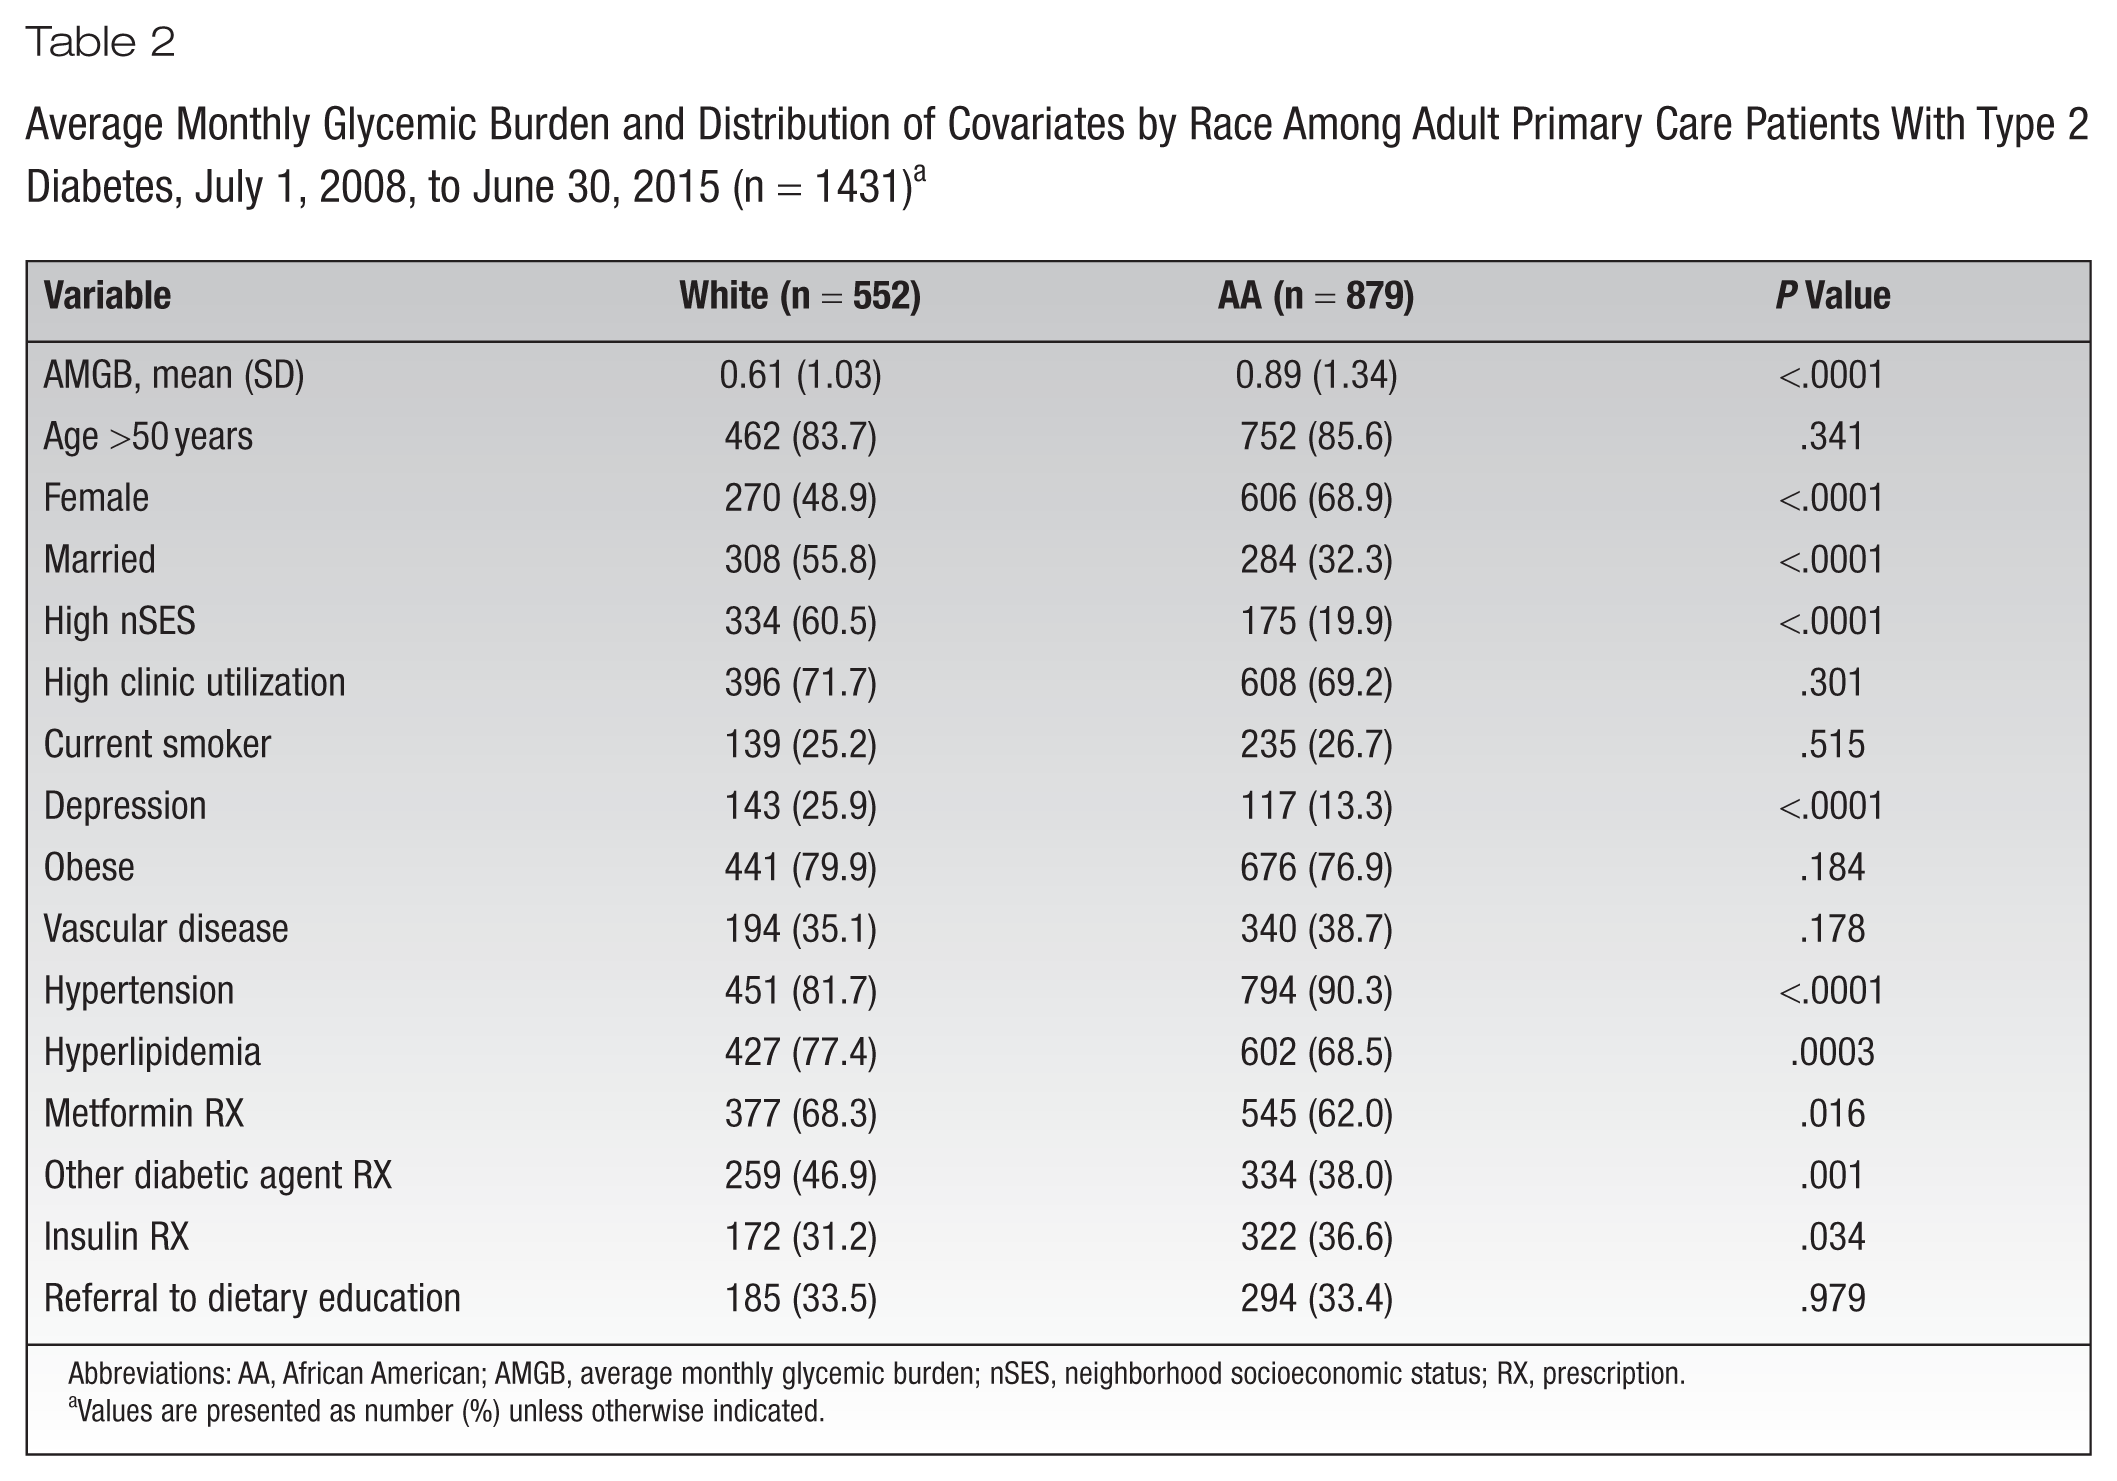
Abbreviations: AA, African American; AMGB, average monthly glycemic burden; nSES, neighborhood socioeconomic status; RX, prescription.
Values are presented as number (%) unless otherwise indicated.
Bivariate associations between AMGB, covariates, and race, stratified by age group, are shown in Table 3. Among older but not younger patients, average AMGB was significantly greater in African American vs white patients (P < .0001). Female sex and high nSES were significantly more common among African American patients in both age groups (P value range, .015 to <.0001). In older but not younger patients, the prevalence of married/partnered patients was significantly greater in whites compared to African Americans (P < .0001). Depression and hyperlipidemia were significantly more prevalent among white patients in both younger and older patient groups. Among older but not younger patients, hypertension (P < .0001) and insulin prescription (P = .034) were significantly more common among African Americans (P < .0001), while having a metformin (P < .016) and other antidiabetic medication (P = .005) prescription was significantly more common among white patients.
Average Monthly Glycemic Burden and Covariate Distribution by Race, Within Age Group, July 1, 2008, to June 30, 2015 (n = 1431) a
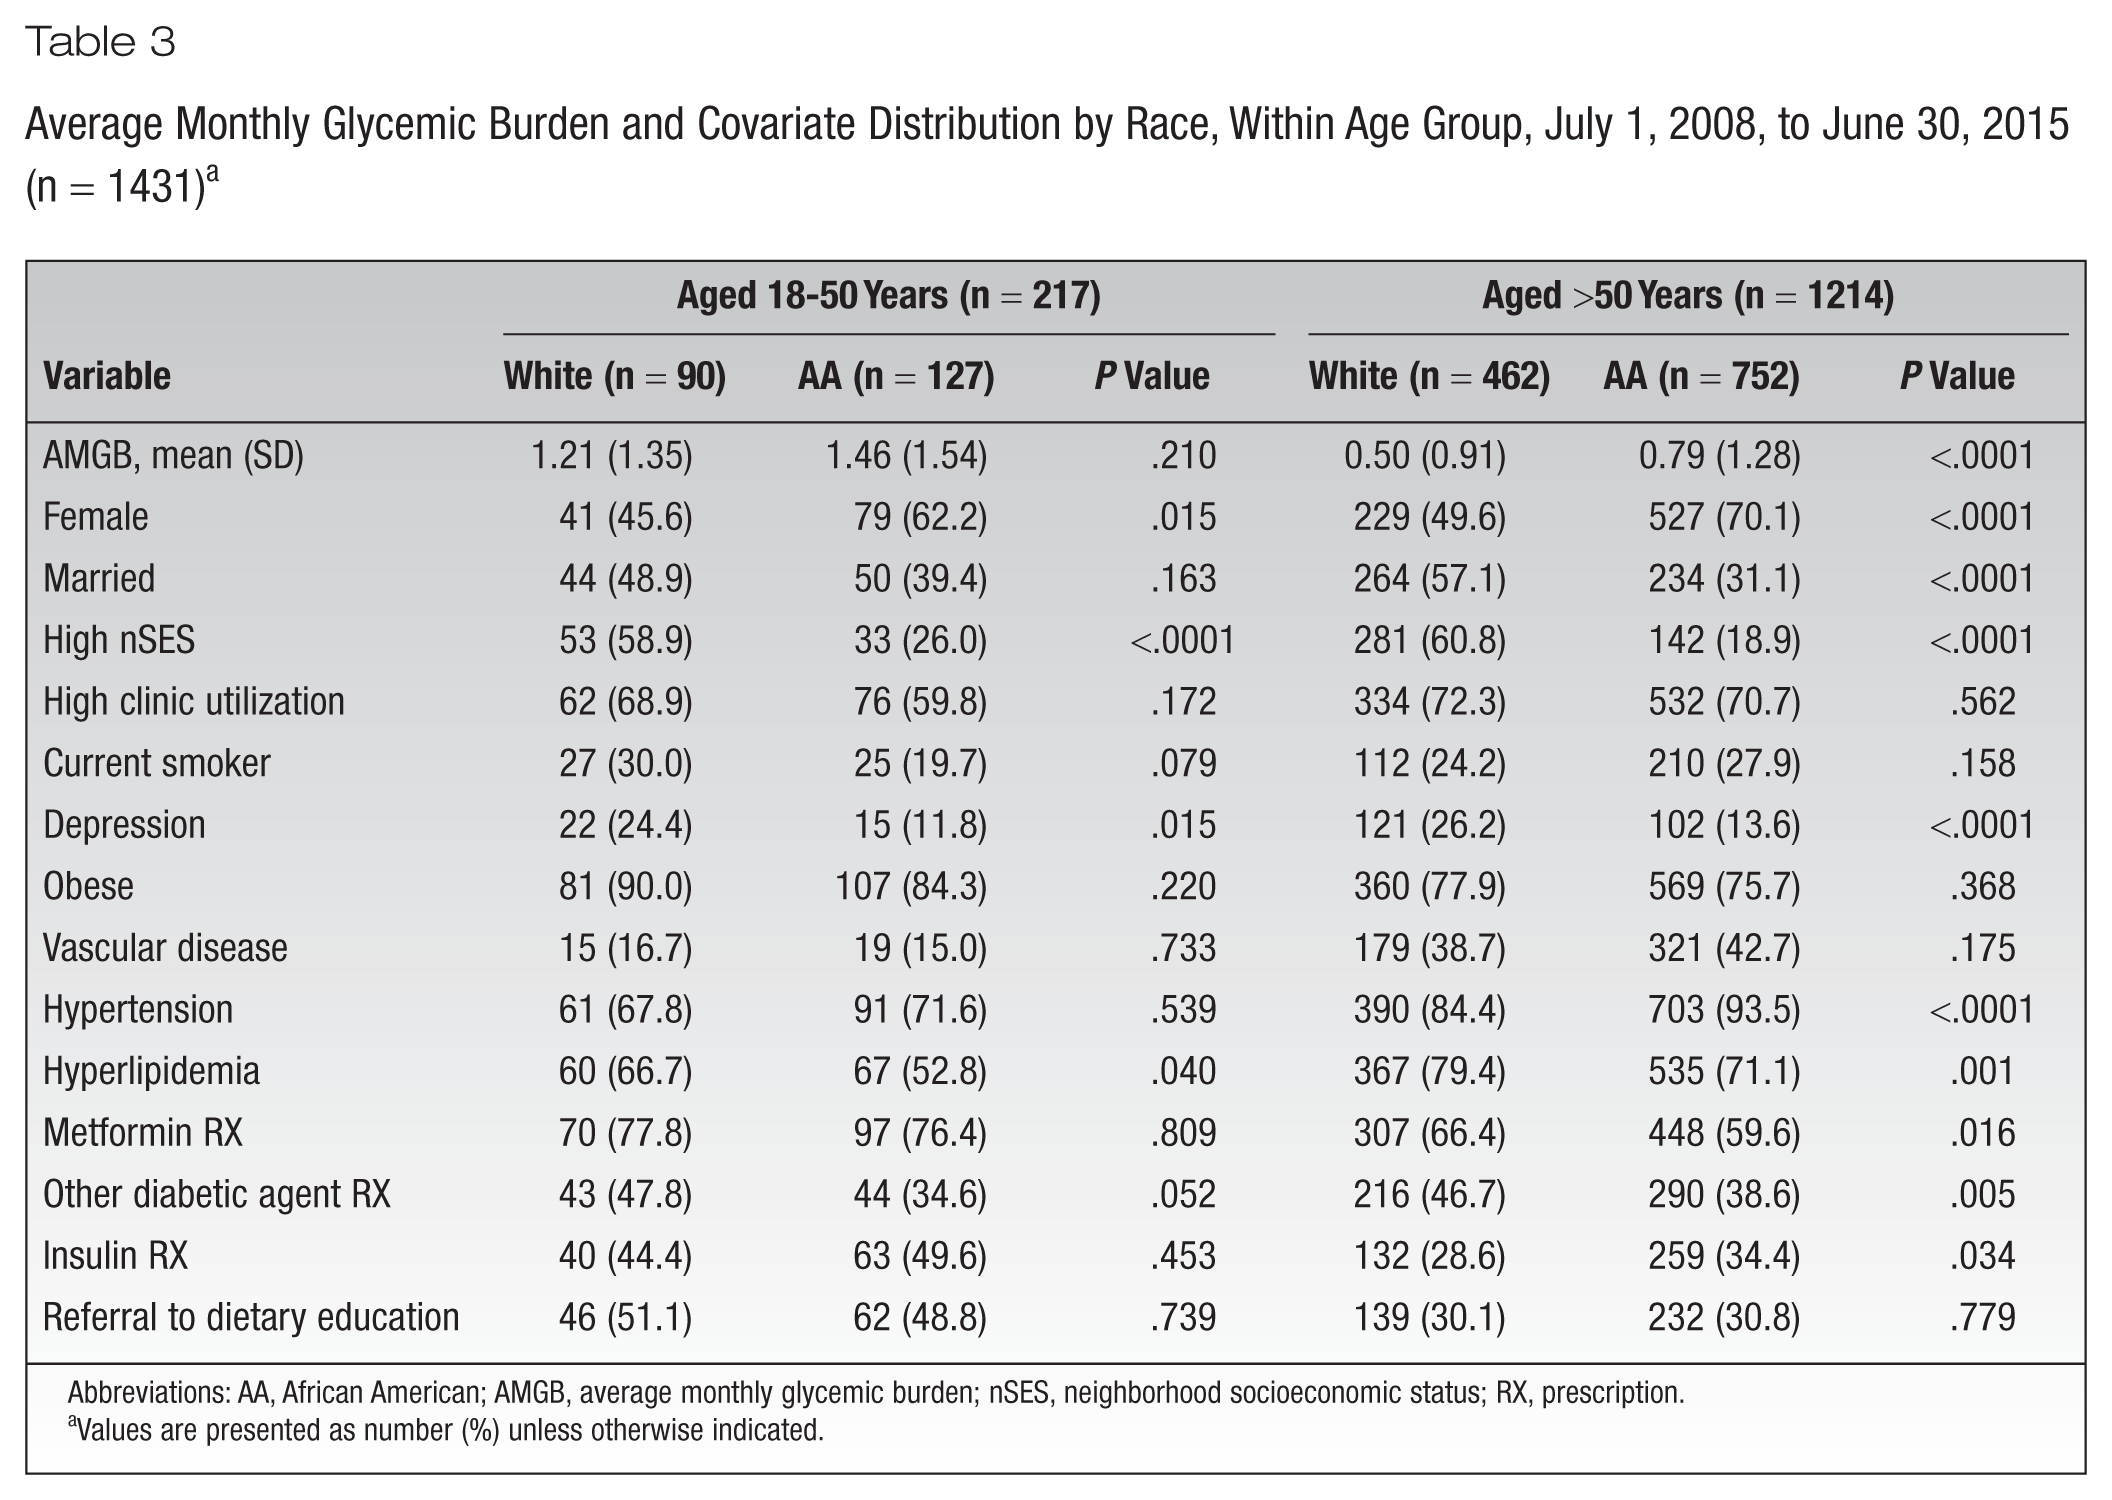
Abbreviations: AA, African American; AMGB, average monthly glycemic burden; nSES, neighborhood socioeconomic status; RX, prescription.
Values are presented as number (%) unless otherwise indicated.
The results of unadjusted and adjusted linear regression models measuring the association between race and mean AMGB are shown in Table 4. Prior to adjusting for age group, African American race was significantly associated with higher mean AMGB (β = 0.27; 95% confidence interval [CI], 0.14-0.40). After adjusting for age (model 2), the association between race and higher mean AMGB remained largely unchanged (β = 0.28; 95% CI, 0.16-0.41). In this model, older age was associated with lower mean AMGB (β = −0.69; 95% CI, −0.86 to −0.51). In the full model 3, after adjusting for all covariates, the positive association between African American race and higher mean AMGB remained significant (β = 0.18; 95% CI, 0.05-0.31), and the association between older age and lower mean AMGB remained significant (β = −0.36; 95% CI, −0.53 to −0.19). In the full model, higher vs lower nSES, high clinic utilization, and hypertension were all significantly associated with lower mean AMGB. Receipt of a prescription for metformin, other antidiabetic medication, and insulin and referral to dietary education were significantly associated with higher mean AMGB.
Crude and Adjusted Linear Regression Models Estimating the Association Between Race and Average Monthly Glycemic Burden Among Adult White and African American Primary Care Patients With Type 2 Diabetes, July 1, 2008, to June 30, 2015 (n = 1431) a
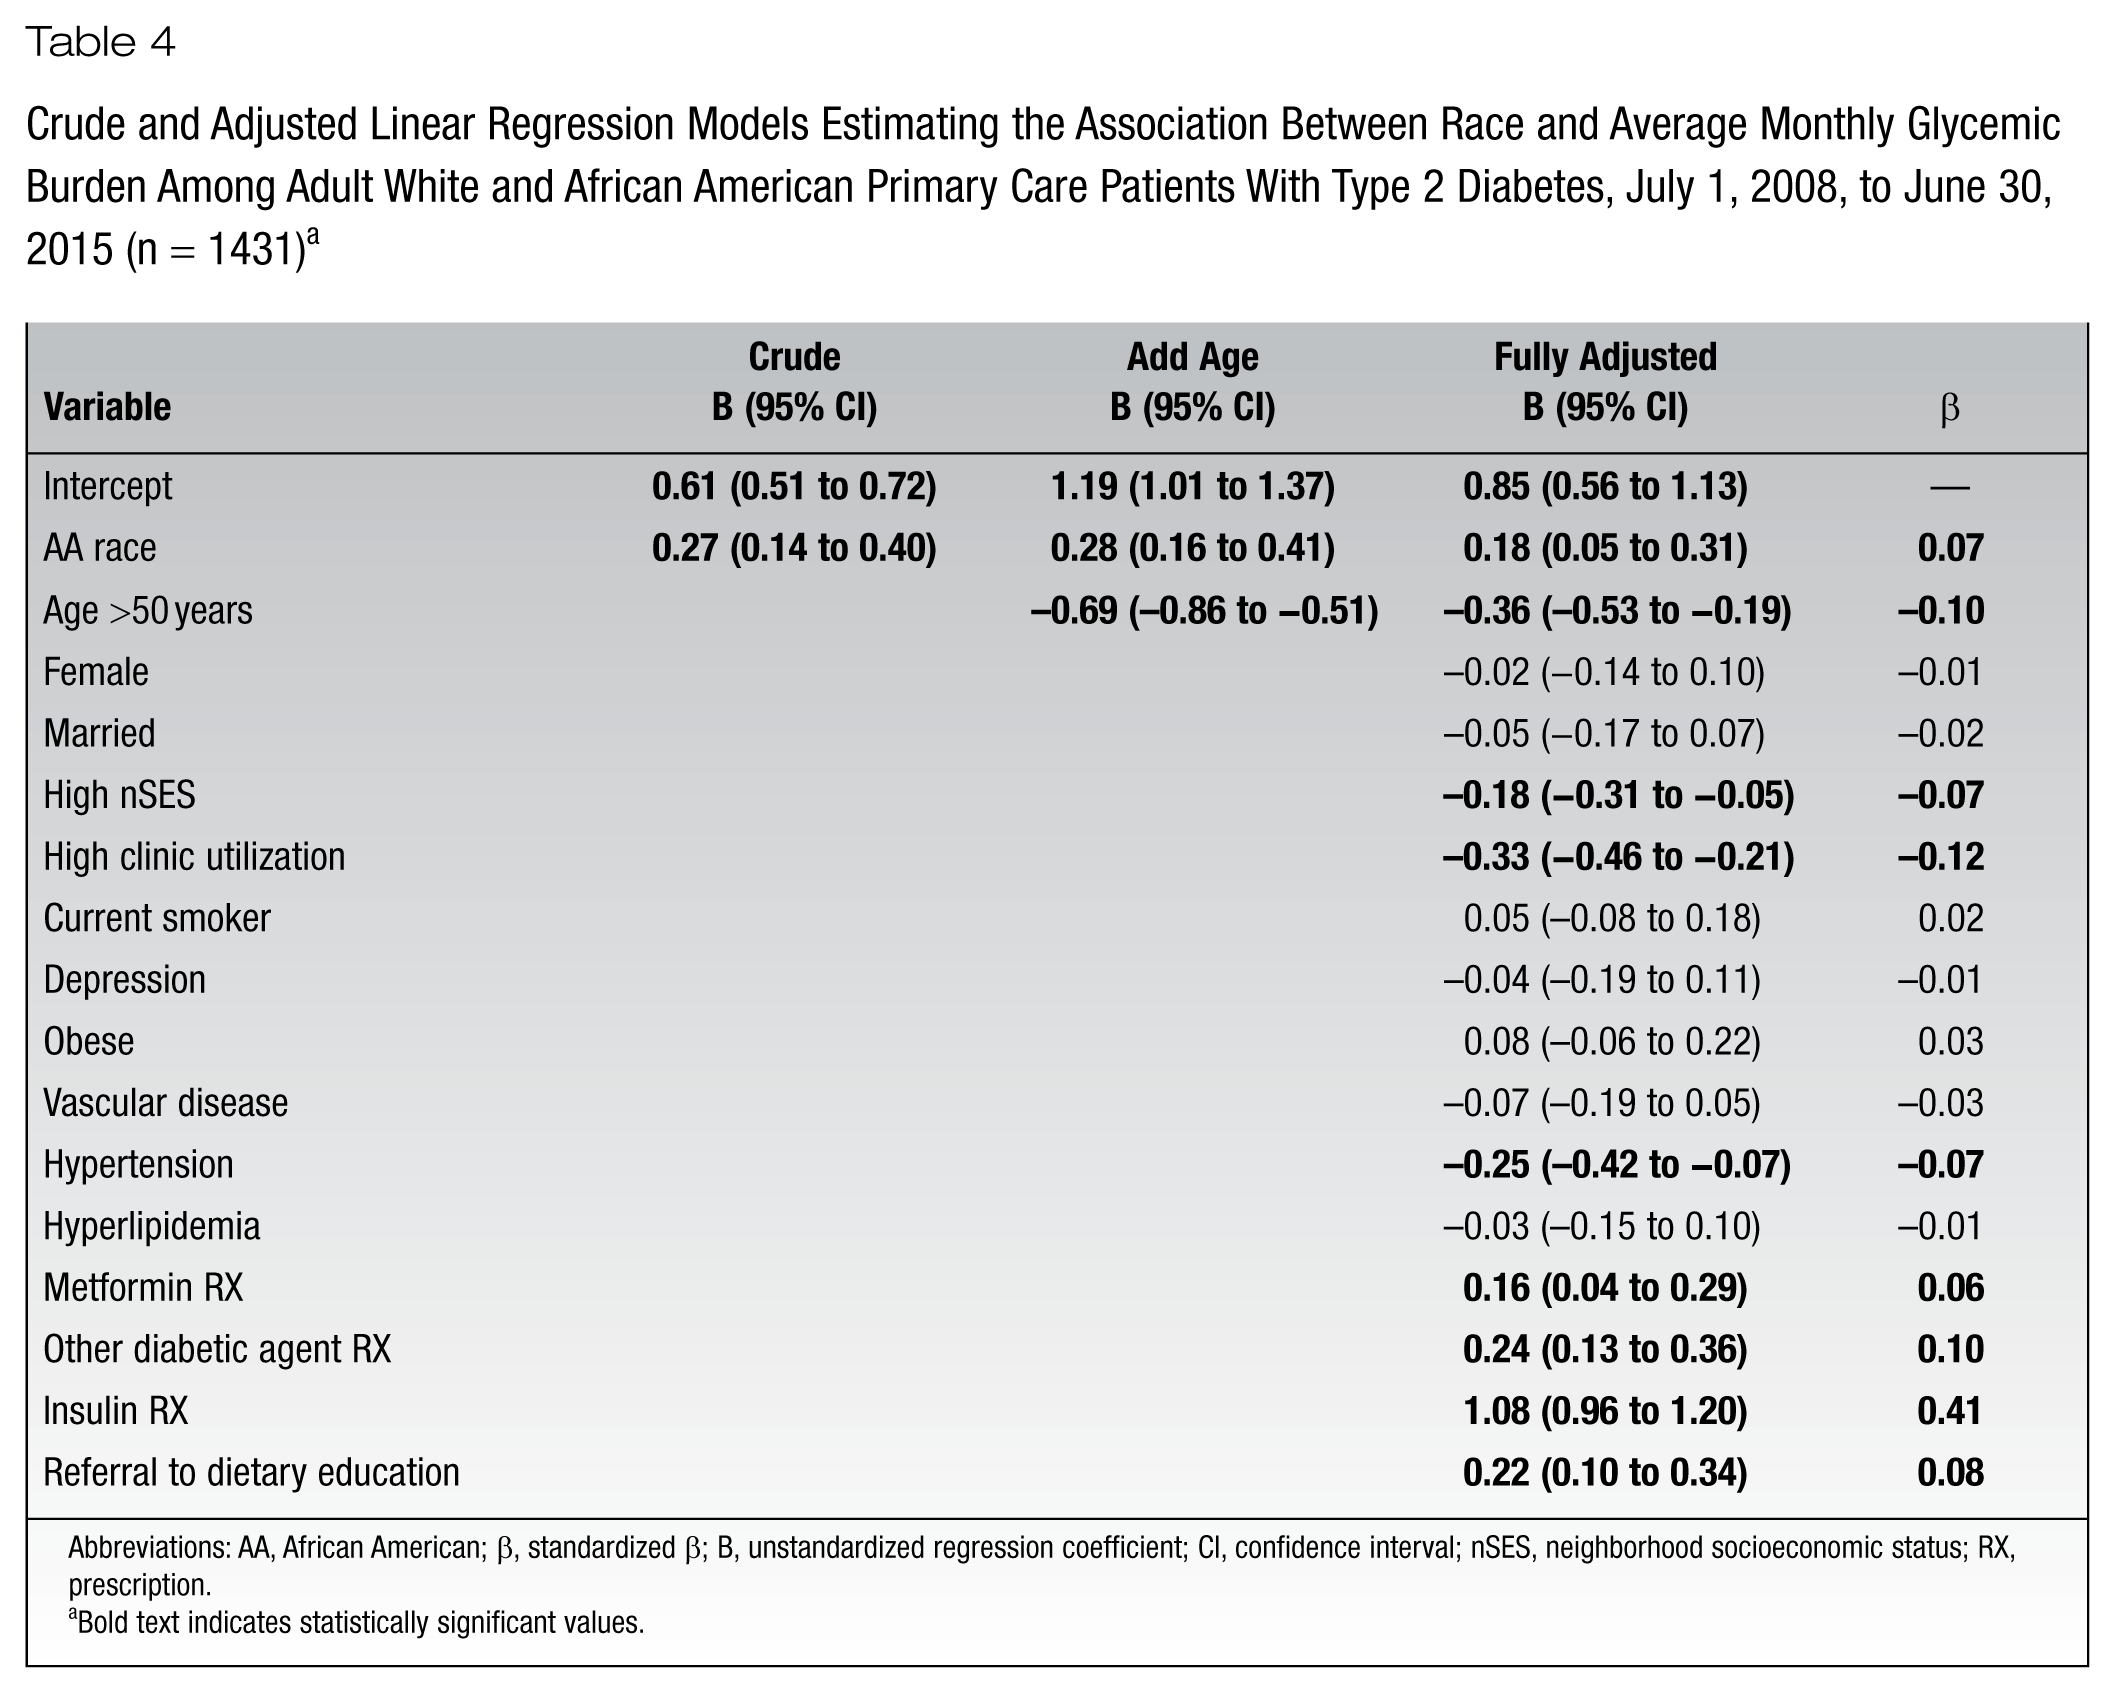
Abbreviations: AA, African American; β, standardized β; B, unstandardized regression coefficient; CI, confidence interval; nSES, neighborhood socioeconomic status; RX, prescription.
Bold text indicates statistically significant values.
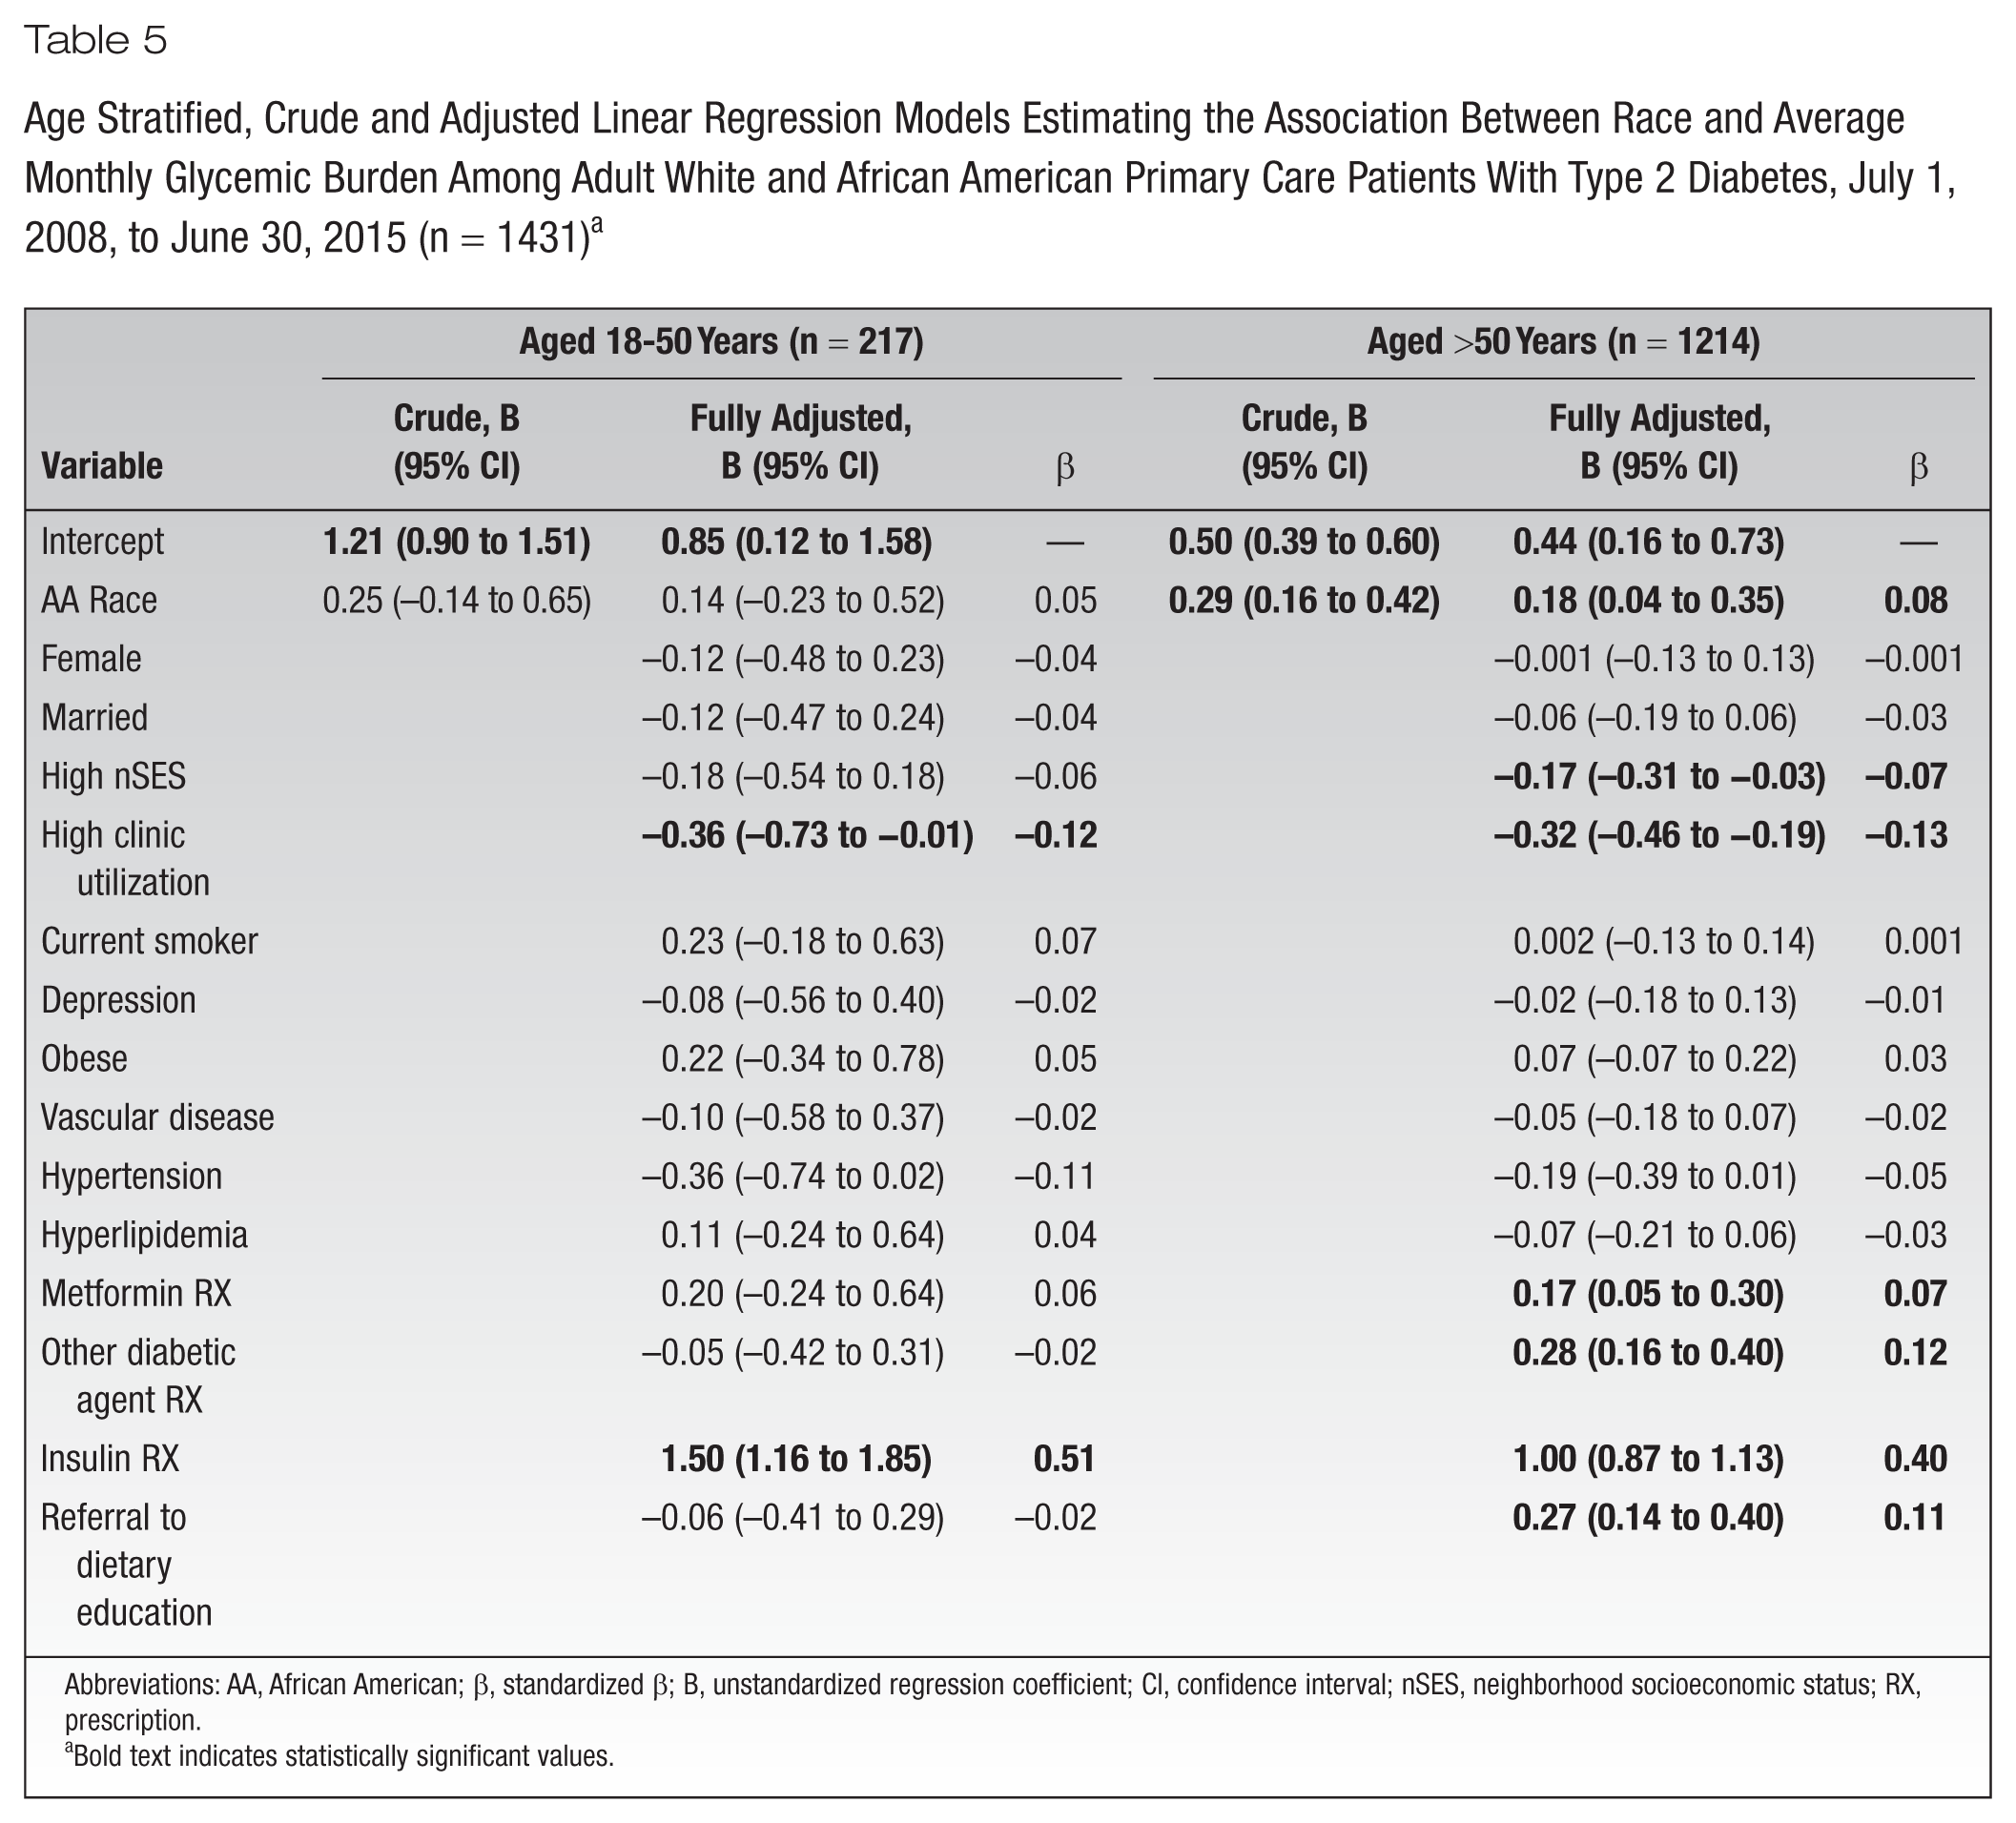
Results of unadjusted and adjusted linear regression models estimating the association between race and AMGB, stratified on younger and older patient groups, are shown in Table 5. In younger patients, race was not significantly associated with mean AMGB. Among older patients, African American race was significantly associated with higher mean AMGB (adjusted β = 0.18; 95% CI, 0.04-0.35).
Age Stratified, Crude and Adjusted Linear Regression Models Estimating the Association Between Race and Average Monthly Glycemic Burden Among Adult White and African American Primary Care Patients With Type 2 Diabetes, July 1, 2008, to June 30, 2015 (n = 1431) a
Abbreviations: AA, African American; β, standardized β; B, unstandardized regression coefficient; CI, confidence interval; nSES, neighborhood socioeconomic status; RX, prescription.
Bold text indicates statistically significant values.
Among younger patients in fully adjusted models, high clinic utilization was significantly associated with lower mean AMGB, and insulin prescription was associated with significantly higher mean AMGB. Among older patients in fully adjusted models, higher nSES and high clinic utilization were significantly associated with lower mean AMGB while metformin prescription, other antidiabetic prescription, insulin prescription, and referral to dietary education were each significantly associated with higher AMGB.
Conclusions
In a cohort of 1431 primary care patients with type 2 diabetes, African Americans vs whites and younger (18-50 years) vs older (>50 years) patients had worse glycemic control. However, after stratifying on race, disparities in glycemic control were present only in older patients. The lack of an association between race and AMGB in younger patients was due to similarly high AMGB in whites and African Americans. The AMGB was approximately twice as high in younger patients, regardless of race. These results do not support the concept that the earlier onset of diabetes in African Americans 15 could partly explain existing evidence for worse glycemic control among younger patients.4-6
This raises many questions about the etiology of early onset type 2 diabetes, as well as its detection and treatment. Because younger patients had a higher prevalence of prescriptions for metformin and insulin and a greater prevalence of referrals to dietary education, the AMGB in younger patients may be due to lower adherence to self-care and antidiabetic medications in both white and African American patients. Genetic predisposition may play a role in early presentation with high AMGB, while lifestyle issues may be predominant in driving poor glycemic control in older patients. Younger patients are not screened as aggressively as older patients and therefore present at a more advanced stage of disease. Less screening is not unique to younger patients with diabetes but appears to be true for other chronic conditions in young patients. For example, the odds of monitoring A1C, low-density lipoprotein, and creatinine were lower for young adults with diabetes (16- to 44-year-olds),22,23 and most quality indicators for managing congestive heart failure and coronary artery disease were less likely in 16- to 44-year-olds compared to middle-aged patients. 23 Interventions to improve diabetes management in young patients will likely need to target change in both patient and provider behavior.
Although AMGB is the cumulative amount by which A1C exceeded a threshold of 7.5, results are consistent with several studies of age and A1C control measured as a binary cross-sectional value. A cross-sectional study using electronic health record data in Spain found persons younger than 65 vs those 65 and older are significantly less likely to have A1C values ≤7.5. 5 Age- and sex-adjusted analysis of participants in the Health, Aging and Body Composition Study revealed African Americans had significantly worse glycemic control. 12
The existing body of work on the association between race, age, and glycemic burden has provided evidence for independent but not joint effects of age and race on glycemic control. Within a mostly (>90%) African American patient cohort, patients’ baseline A1C decreased across each age group: 9.9% in those <30 years, 9.5% in 30- to 49-year-olds, 9.2% in 50- to 69-year-olds, and 8.8% in those >69 years, 6 which is consistent with the observation of lower AMGB in older patients.
Limitations
The present study used data from an academic primary care practice located in the St Louis, Missouri, metropolitan area; therefore, results may not generalize to private practice settings and other geographic regions. Misclassification is always a limitation of retrospective studies using medical record data. It is possible that AMGB was misclassified to the degree that patients obtained care outside the university medical system. However, misclassification should be random and not systematically associated with age group or race and thus less likely to severely bias results. Last, there were not enough patients with a sufficient number of A1C values to track AMGB on a more granular level (eg, every 3 months or yearly) for the entire observation period. Additional research is warranted to determine how long younger patients remain in poor glycemic control and to identify factors that may contribute to an AMGB decrease. Due to sample size needs, younger age included patients up to age 50, which limits the specificity of the conclusions regarding age and glycemic burden. Further research is needed to evaluate age and race differences in glycemic control in young (approximately 18-40 years), middle age (approximately 40-65 years), and older patients (>65 years).
Implications/Relevance for Diabetes Educators
Results inform diabetes education by generating new knowledge that demonstrates that established race disparities in glycemic control between African American and white patients may be limited to older patients (eg, >50 years). Results suggest a need for aggressive interventions, including patient education, to improve young adult glycemic control regardless of race. As the incidence of early onset type 2 diabetes increases, the prevalence of poor glycemic control and comorbidities should rise. Thus, diabetes educators should characterize the qualities of this group as much as possible to facilitate the implementation and planning of prevention and treatment.
Footnotes
Funding:
An educational grant from the Mindlin Foundation supported Drs. Tucker and Scherrer’s contribution to this paper.
Dr. Scherrer is compensated for his role as Editor in Chief of Family Practice. The other authors declare that there is no conflict of interest.