
Abstract
Purpose
The purpose of this study was to determine the prevalence and associated risk factors of diabetes in the African immigrant population in Sacramento County, California.
Methods
A cross-sectional study was conducted in Sacramento County, California, from June to August 2018. The convenience sample included 126 African immigrants aged 21 years and older. Sociodemographic and clinical characteristics were collected. Hemoglobin A1C (A1C) level, blood pressure, height, and weight were measured per standard methods. Data were analyzed using descriptive statistics and χ2 test at value of P < .05.
Results
Of 126 adult individuals included in this study, 32 (25.4%) had diabetes, of whom 25 (19.8%) were previously diagnosed and 7 (5.6%) represented new cases of diabetes. Also, 36 (28.6%) had prediabetes, of whom 24 (19.1%) had previously been told they had prediabetes and 12 (9.5%) represented new cases of prediabetes. Diabetes and prediabetes were significantly higher among participants in the age group of 36 to 60 years, married, employed full-time, and those with hypertension, high blood cholesterol, and participating in 0 to 2 days per week of moderate physical activities. Only one-fifth of all participants with previously known diabetes or previously on treatment had a good glycemic control status.
Conclusions
The present study found a high prevalence of prediabetes, diabetes, and multiple risk factors of diabetes in the African immigrant population, as well as a poor glycemic control among those with diabetes, calling for urgent attention. Strategies aimed to improving a healthy lifestyle in the African immigrant population are necessary to reduce the burden of diabetes.
Diabetes is a chronic metabolic disease that emerged as a leading global health problem affecting approximately 422 million adults worldwide and is characterized by high levels of glucose in the blood. 1 Type 2 diabetes contributes up to 90% of all cases of diabetes. Because of their increasing risk of developing diabetes, the American Diabetes Association (ADA) recommends testing for diabetes and prediabetes among all individuals age 45 years and older. Similarly, testing is recommended among adults with a body mass index (BMI) ≥25 kg/m2 who have additional risk factors, including physical inactivity, a first-degree relative with diabetes, being a member of a high-risk ethnic population, and having a history of gestational diabetes, polycystic ovary syndrome, or one of several clinical risk factors such as hypertension, high-density lipoprotein cholesterol (HDL-C) <35 mg/dL, triglycerides >250 mg/dL, hemoglobin A1C (A1C) ≥5.7%, impaired glucose tolerance (IGT), impaired fasting glucose (IFG), or cardiovascular disease. 2
California has the greatest number of people in the United States who are newly diagnosed with diabetes. 3 In 2010, about 11.4 million (41%) adults in California had prediabetes, a condition that often precedes type 2 diabetes.4,5 Ethnic minority populations in California have the highest risk and prevalence of diabetes. 3 African immigrants in particular are a rapidly growing subgroup with cultural behaviors and lifestyle characteristics that can increase the likelihood of developing diabetes. Findings from a previous study conducted by Kindarara et al 6 with 10 African immigrant adults with type 2 diabetes in the Sacramento area, California, revealed barriers to diabetes self-management to be the following: being unaware of the disease, being unfamiliar with how to prevent the disease, and believing that it is only necessary to seek health care when ill. There are an estimated 1.6 million African immigrants in the United States. 7 However, their diabetes data are typically conflated with those of other members of the black or African American population, with whom they share similar genetic characteristics such as skin color,8,9 although the diabetes-related problems faced by immigrants are unique. Findings from the International Medicine Clinic at Seattle’s Harborview Medical Center estimated that 60% of African immigrant patients have diabetes. 10 In addition, in Minneapolis and St Paul, Minnesota, Liberian and Kenyan immigrants are even more likely to be diabetic than Somalis. 11 A consultant in the Mayo Clinic’s Division of Endocrinology stated that a growing number of Somali immigrants are developing type 2 diabetes as quickly as 6 months after their arrival in the United States, 12 and this phenomenon is attributed to a lack of exercise and a dramatic increase in fat and calorie consumption. 13 There are increasing multipronged efforts toward preventing and controlling diabetes among ethnic minority populations in California and the United States in general, yet diabetes risks and prevalence among the 158 953 African immigrants living in California 7 remain unknown. Such knowledge is critical to the development and effective targeting of diabetes prevention and treatment efforts in the African immigrant population. Therefore, the present study aimed to assess the prevalence and associated risk factors of diabetes in the African immigrant population in Sacramento County, California.
Socioecological Perspective of Prediabetes and Diabetes
Prevention requires understanding the factors that influence 14 diabetes. While much investigation on prediabetes and diabetes risk factors has focused on the individual-level factors such as socioeconomic status (SES) and cultural and psychosocial factors, 15 a socioecological perspective recognizes the influence of social and environmental factors that increase the vulnerability of the African immigrant population to diabetes.
Because the interest of this study is to understand the risk factors that influence diabetes and intervene in diabetes prevention and treatment, the current study adopted the socioecological perspective to expand the narrow focus on individual-level factors to include a broader consideration of the multiple contexts or organizational levels 15 within which African immigrants are embedded. The prevalence of prediabetes and diabetes among immigrant populations is a complex issue, with significant multiple levels of influences from the integration of individual-level factors and multilevel factors such as family and social networks, health care settings and practices, the physical and social environment, and local, state, and national policies. 15 For example, dietary behaviors such as processed and red meat consumption may be affected by an individual’s physiological response to that diet but also by family attitudes and beliefs or the community’s culture and public policies that affect the price of food. Expanding recognition beyond individual-level risk factors is crucial to not only understand the social epidemiology of diabetes but also act across multiple levels of the socioecological approach at the same time, which is more likely to sustain prevention and treatment efforts over time.
Methods
Study Design and Sample Size
This study was based on a cross-sectional design, which allowed for the collection of data from June to August 2018 to determine the prevalence of diabetes and its major risk factors among African immigrants. The number of eligible African immigrants who were approached was 150. Out of these, 126 (response rate of 84.0%) agreed to participate in this study. The convenience sample included participants aged 21 years and older who were residents of Sacramento County, California. The age range was based on the mean age of participants in a previous study conducted by the author (D.M.K.) with African immigrant adults with type 2 diabetes in the Sacramento area 6 and reflects the ages (18 and older) with the highest prevalence of diabetes among ethnic minority populations in the United States (American Indians and Alaska natives at 15.1%, non-Hispanic blacks at 12.7%, Hispanics at 12.1%, non-Hispanic whites at 7.4%, and Asians at 8%). 16
Study Area
There are an estimated 8257 African immigrants in Sacramento County. 17 According to the Community Health Status 2014 Report, diabetes prevalence has been increasing in California residents, especially in the Greater Sacramento region. 18 In 2011, the prevalence of diabetes in Sacramento County was 9.2% compared to the remainder of California (8.4%). 18 In Sacramento County in 2011, African Americans, which includes African immigrants, had a higher diabetes prevalence (13.2%) than Asian/Pacific Islanders (12.9%), non-Hispanic whites (9.4%), and Hispanics (4.7%). 18 Thus, this area was appropriate for this study to gain a greater understanding of the scope of the diabetes problem of the African immigrant population.
Data Collection
The California State University, Sacramento (CSUS) Institutional Review Board approved the study. Data were collected by the author (D.M.K.) in Sacramento County, California. After signing an informed consent, a questionnaire was given to each participant to collect sociodemographic and clinical data that included age, sex, country of birth, age at immigration to the United States, length of stay in the United States, level of education, marital status, employment status, and health insurance status. Information was also obtained on history of prediabetes and diabetes (whether a health care provider had told them they had prediabetes or diabetes); if diabetic, duration of diabetes; and if on medication, type of medication. In addition, information was collected on history of hypertension, heart disease, high blood cholesterol (whether a health care provider had told them they had any of the previous), gestational diabetes (for female participants only), whether they had a family history of diabetes (how many family members), and when they had their last regular medical checkup. Information was also collected on whether they engaged in moderate physical activity—activity that may make a person breathe slightly harder than when he or she is sitting, like fast walking, gardening, or mowing with a push mower—or vigorous physical activity that causes sweating and hard breathing, like running or biking fast or uphill. Information on smoking status and healthy eating habits was also collected.
Anthropometric Measurements
Upon completion of the questionnaire, anthropometric measurements were performed, including height and weight using standardized methods and calibrated instruments. Body weight (to the nearest 0.1 lb/0.05 kg) was measured using a calibrated health-o-meter digital scale (Boca Raton, FL) while the participant was barefoot and wearing light clothing. Standing height was measured using a tape measure to the nearest 0.25 of an inch with the participant standing barefoot on a flat floor with no carpeting next to a wall and eyes looking straight ahead. BMI was calculated as weight in kilograms divided by the square of height in meters. 19 Two blood pressure measurements were taken at least 5 minutes apart from each participant after several minutes in a seated position with a digital blood pressure monitor. The average of the 2 readings was used for analysis. Then, peripheral blood sample by finger puncture (fingerstick) was collected from each participant to estimate the A1C value using the A1C Now+ meter (Indianapolis, IN) for diabetes care. Quality control testing was performed with each new shipment of the A1C Now+ meter to ensure that storage conditions had not affected the product. A1C, an indicator of 3-month glycemic control, was used to test blood glucose concentration to identify individuals at high risk of developing diabetes or diagnose the disease. 20 The ADA recommends A1C as part of the prediabetes and diabetes diagnostic criteria. 16 A1C is a simple, minimally invasive measure that will not require the participants to be in a fasted state. 21
Definition of Terms
Overweight was defined as a BMI of 25.0 to 29.9 kg/m2, and obesity was defined as a BMI of ≥30 kg/m2. A participant was considered hypertensive if his or her current systolic blood pressure (SBP) was ≥140 mm Hg and/or diastolic blood pressure (DBP) was ≥90 mm Hg (Joint National Committee 8 [JNC8] criteria). 22 Prediabetes was considered in participants with a previous diagnosis by a physician or other health professional or if participants had A1C levels between 5.7% and 6.4% at the time of data collection. 16 Diabetes was considered in participants with a previous diagnosis by a physician or other health professional and/or had been taking antihyperglycemic medication or participants had A1C levels of 6.5% or greater 16 at the time of data collection. Diabetes was considered controlled (good control of diabetes) if a participant with a previous diagnosis of diabetes by a physician or other health professional stated he or she was receiving treatment with antihyperglycemic medication and had an A1C <7% at the time of data collection.
Data Analysis
Statistical analysis was performed using the Statistical Package for Social Sciences (SPSS, Inc, an IBM Company, Chicago, Illinois) version 24.0. Categorical variables were expressed as percentages. Means and standard deviations were calculated for continuous variables, and the means were compared using the independent samples t test. Pearson χ2 or Fisher exact was used to determine the relationship between sociodemographic and clinical factors and diabetes. Values of P < .05 were considered statistically significant.
Results
Sociodemographic and Clinical Characteristics
Table 1 summarizes sociodemographic and clinical characteristics of study participants. Out of 126 participants aged between 22 and 90 years (mean age, 46.8 years), there were 50 (39.7%) men and 76 (60.3%) women. Participants had lived in the United States between 6 months and 53 years (mean [SD], 13.6 [9.6]), mean (SD) age at immigration to the United States was 33.2 (15.6) years, and they were native to 12 African countries: Democratic Republic of Congo (n = 5), Eritrea (n = 5), Ethiopia (n = 16), Gambia (n = 1), Ghana (n = 12), Kenya (n = 23), Liberia (n = 13), Nigeria (n = 11), Sierra Leone (n = 17), South Africa (n = 4), Uganda (n = 14), and Zimbabwe (n = 5).
Sociodemographic and Clinical Characteristics of Study Participants (n = 126) a
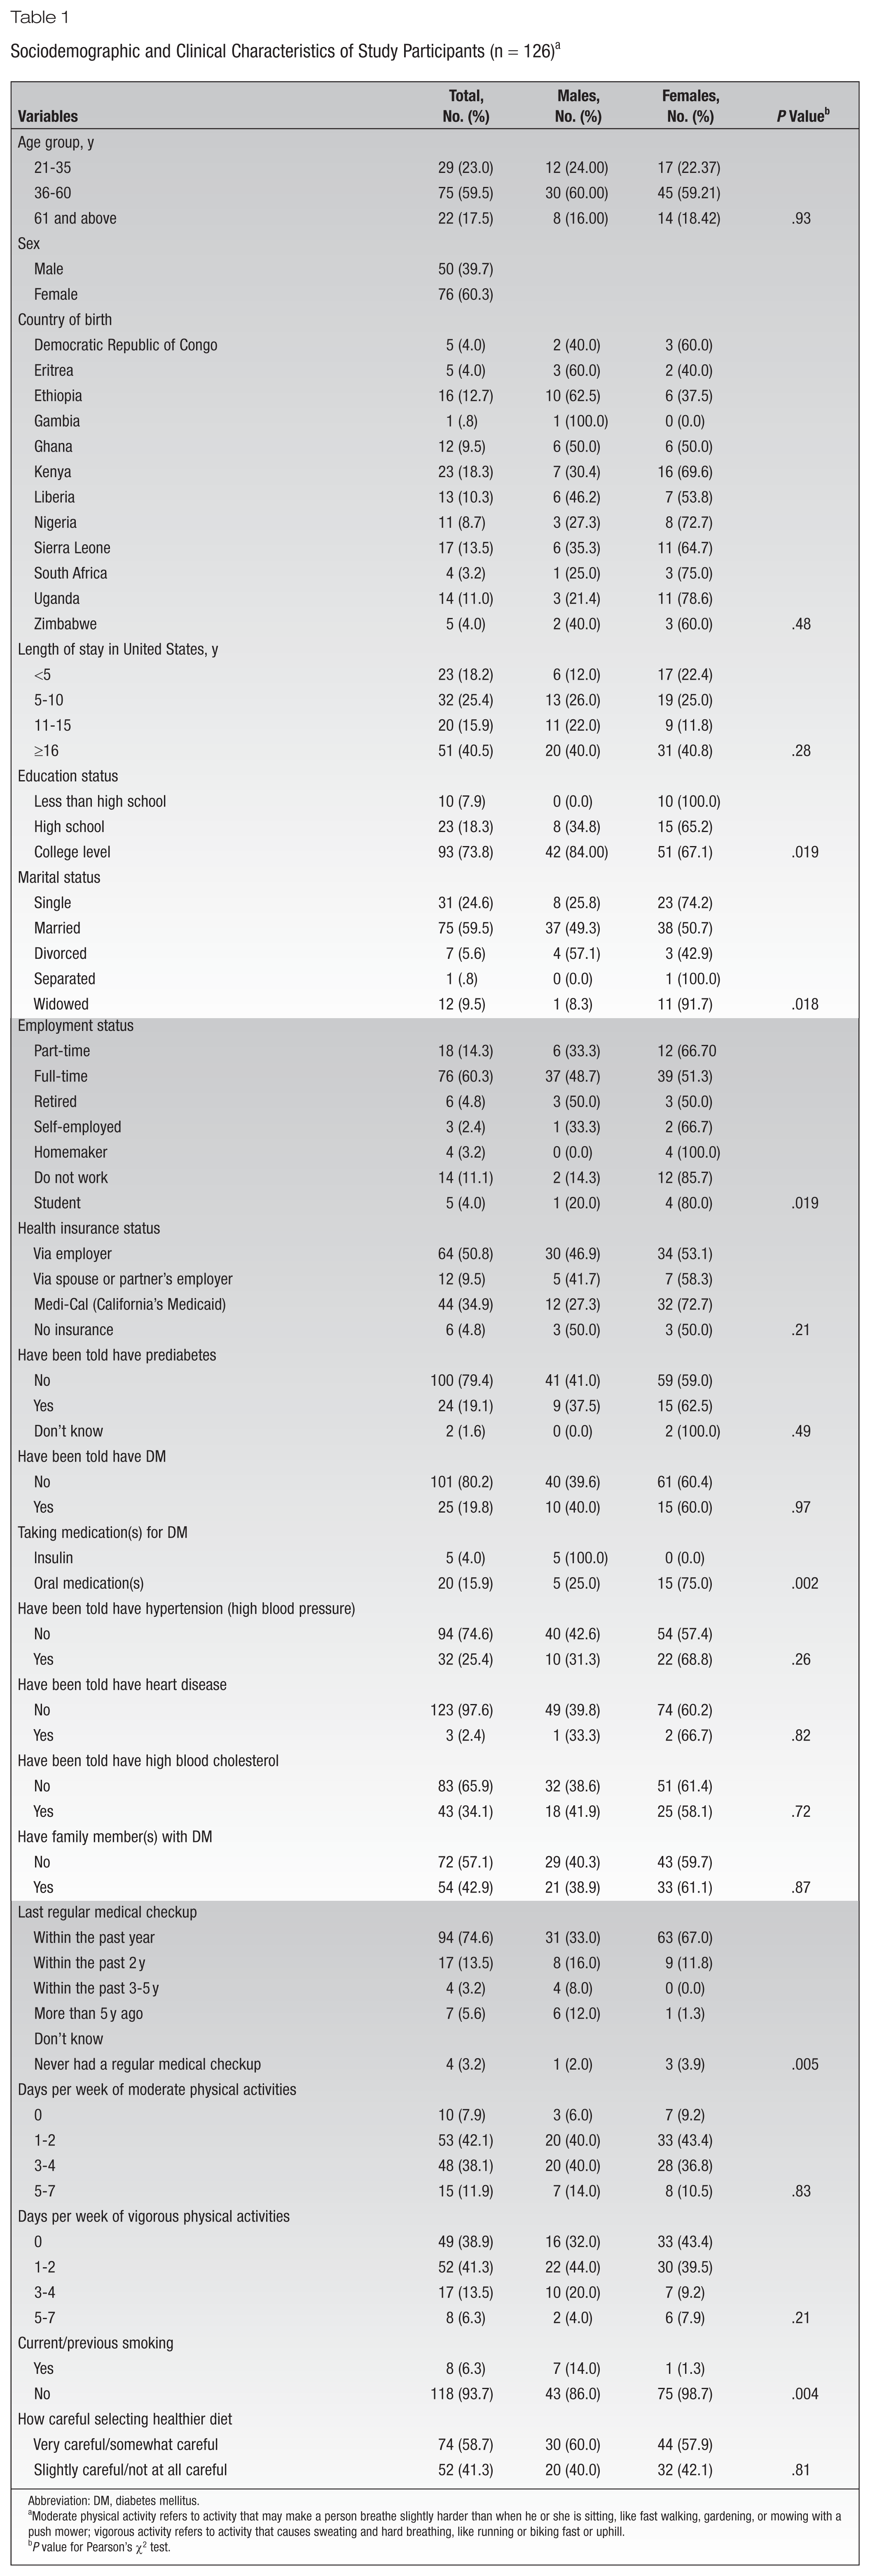
Abbreviation: DM, diabetes mellitus.
Moderate physical activity refers to activity that may make a person breathe slightly harder than when he or she is sitting, like fast walking, gardening, or mowing with a push mower; vigorous activity refers to activity that causes sweating and hard breathing, like running or biking fast or uphill.
P value for Pearson’s χ2 test.
Of the total number of participants, 75 (59.5%) were married, 93 (73.9%) had some college (associate’s degree, bachelor’s degree, or master’s degree), 76 (60.3%) reported full-time employment, and 76 (60.3%) had health insurance via employer or spouse/partner’s employer. Twenty-four (19.1%) had been told that they had prediabetes, 25 (19.8%) had been diagnosed with diabetes, and 32 (25.4%) had been diagnosed with hypertension. A total of 43 (34.1%) had been told they had high blood cholesterol, 54 (42.9%) had a family history of diabetes, and 94 (74.6%) had the last regular medical checkup in the past year. Similarly, 53 (42.1%) had only 1 to 2 days per week of moderate physical activities, 52 (41.3%) had only 1 to 2 days per week of vigorous physical activities, 8 (6.3%) had a history of smoking, and 74 (58.7%) were very careful or somewhat careful in selecting healthier diet. Distribution of sociodemographic and clinical characteristics of the study participants is presented in Table 1.
Table 2 shows significant differences between males and females for age (mean [SD] 45.2 [47.9] for males and 47.9 [15.2] for females, P = .31), weight (mean [SD] 81.4 [17.6] for males and 77.2 [16.5] for females, P = <.0001), BMI (mean [SD] 27.5 [5.5] for males and 29.7 [5.8] for females, P = .041), and A1C (mean [SD] 6.1 [1.2] for males and 5.8 [.84] for females, P = .21).
Sociodemographic and Clinical Characteristics of Study Participants (n = 126)
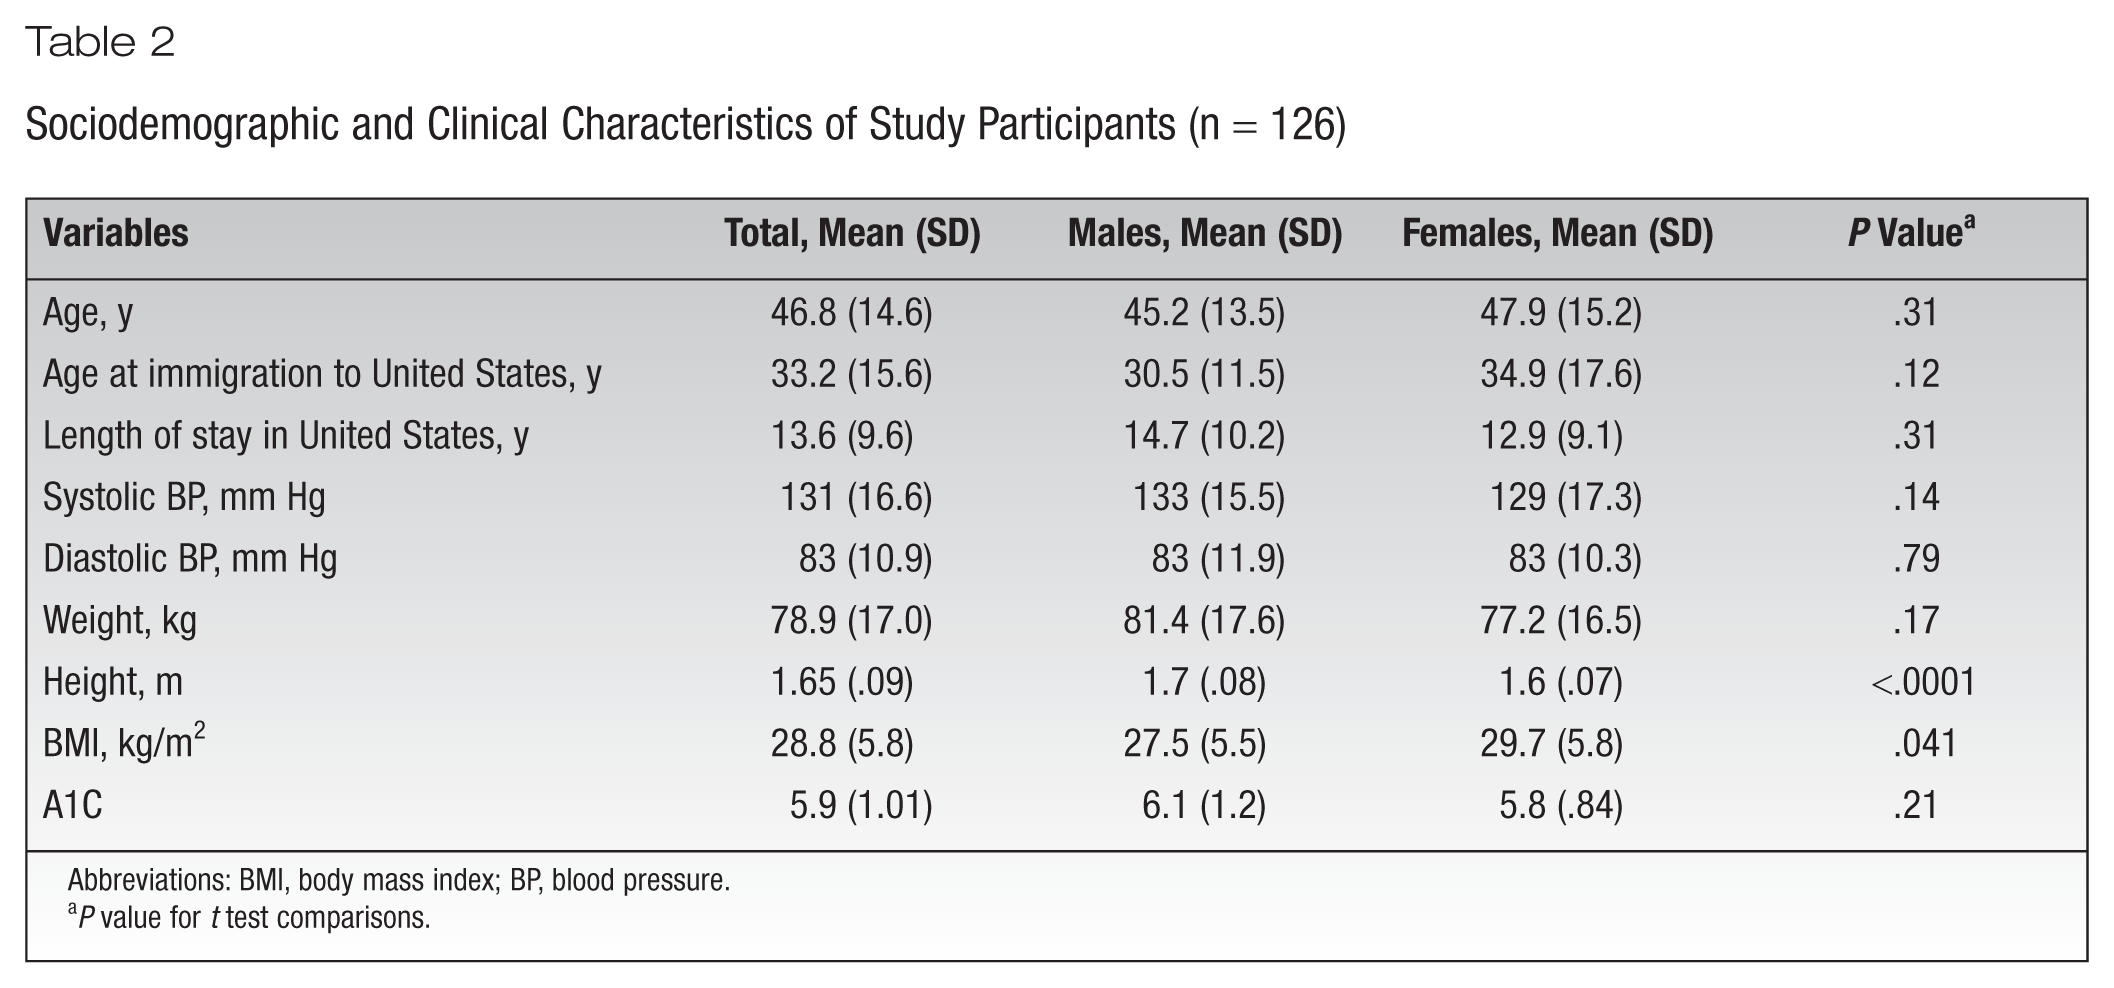
Abbreviations: BMI, body mass index; BP, blood pressure.
P value for t test comparisons.
The BMI was used as an objective measure of whether participants were normal weight, overweight, or obese. The mean BMI of the study sample was 28.8 kg/m2 (considered overweight), with 73.8% of the sample classified as overweight or obese and 68.0% of male participants and 77.6% of female participants falling under this classification. Only 26.2% of the sample was classified to be at a healthy BMI (<25 kg/m2). There were differences in BMI category for males and females (P = .02) and category of A1C (P = .62) (Table 3).
Distribution of Blood Pressure, BMI, and A1C by Sex a
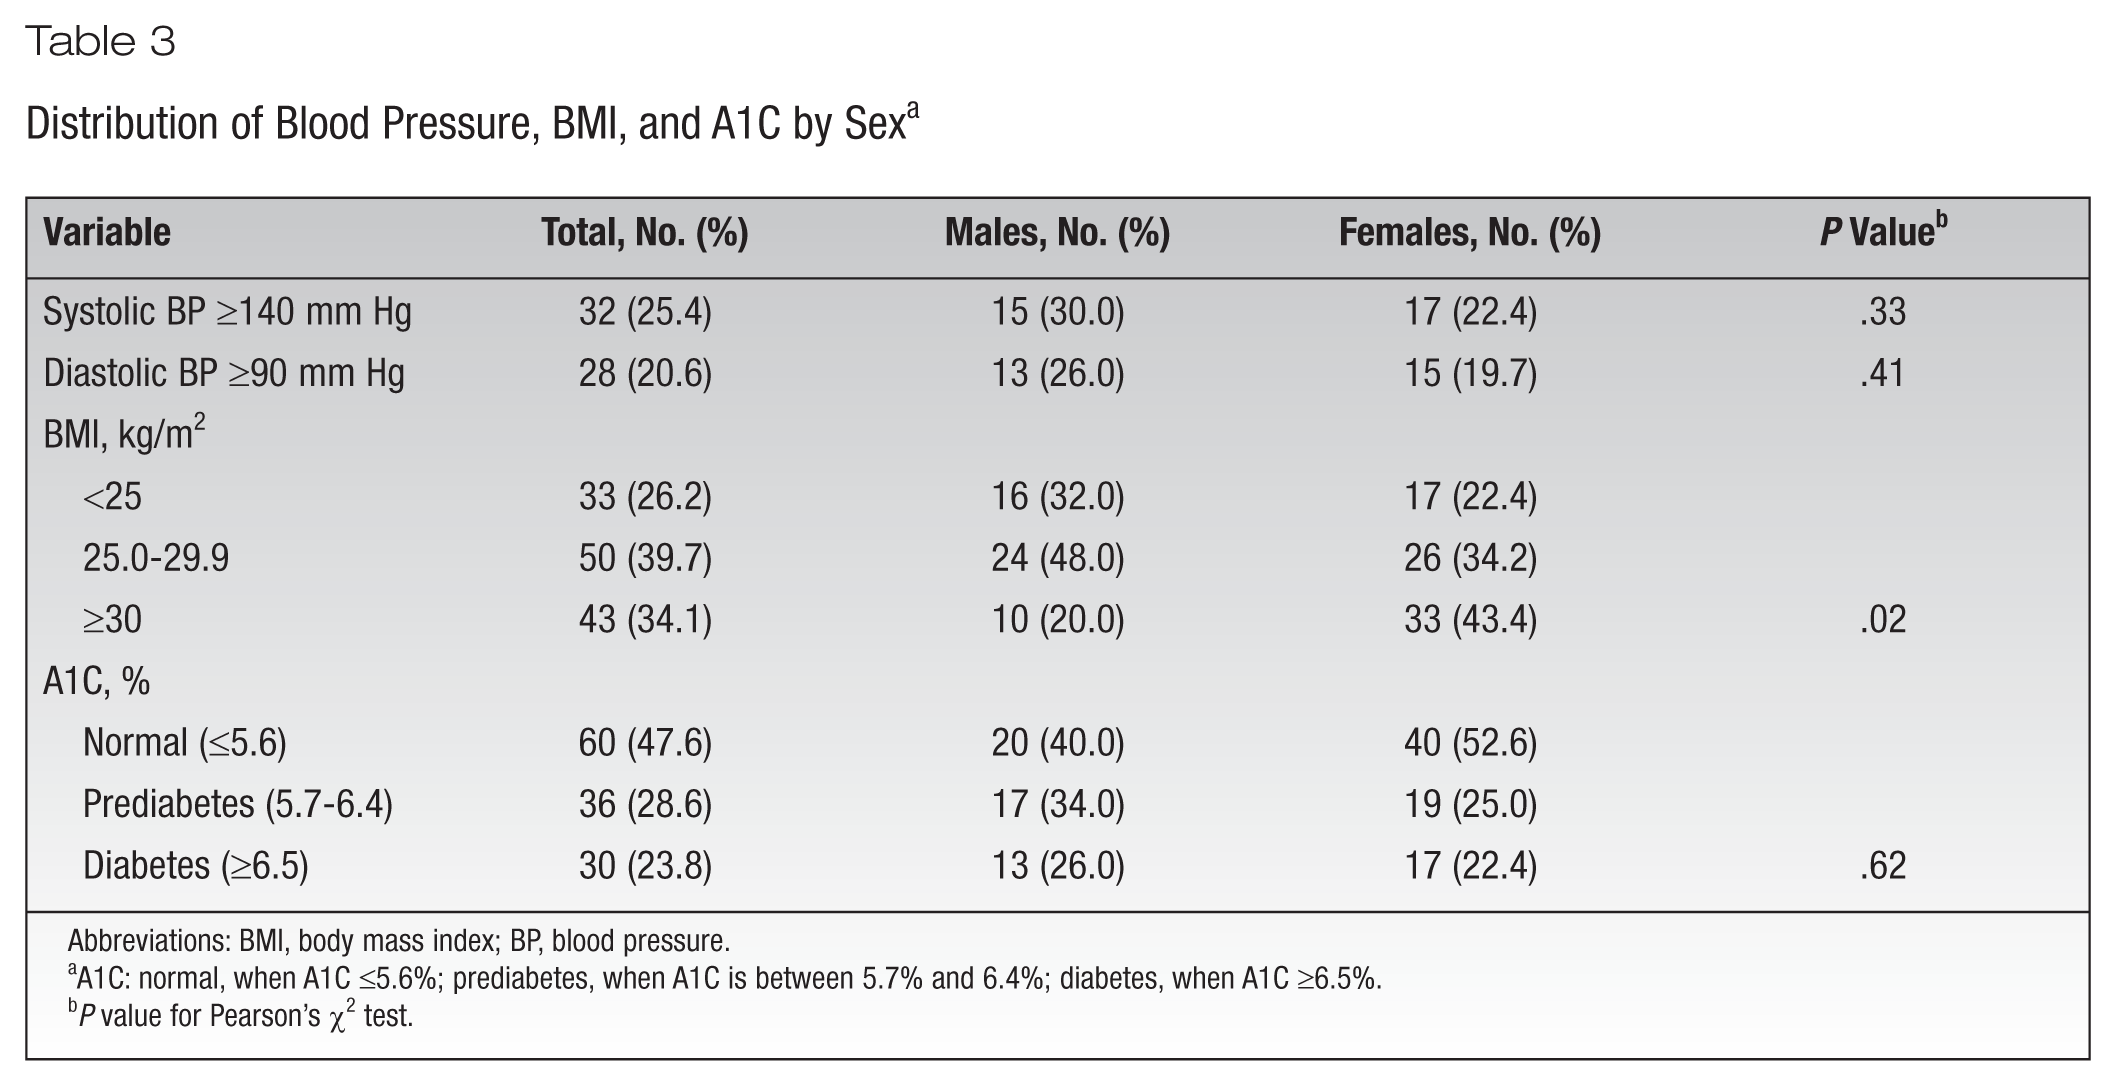
Abbreviations: BMI, body mass index; BP, blood pressure.
A1C: normal, when A1C ≤5.6%; prediabetes, when A1C is between 5.7% and 6.4%; diabetes, when A1C ≥6.5%.
P value for Pearson’s χ2 test.
Prevalence of Diagnosed and Undiagnosed Prediabetes and Diabetes
Table 4 summarizes the prevalence of diagnosed and undiagnosed prediabetes and diabetes. A total of 36 (28.6%) participants had prediabetes (A1C of 5.7%-6.4%), of whom 12 (9.5%) were new (unaware) cases and 24 (19.1%) were previously diagnosed (aware) cases of prediabetes. A total of 32 (25.4%) participants were found to have diabetes as defined by A1C. Thus, the prevalence of diabetes in the whole sample was 25.4%, comprising 5.6% new (unaware) cases and 19.8% previously diagnosed (aware) cases of diabetes.
Prevalence of Diagnosed and Undiagnosed Prediabetes and Diabetes a
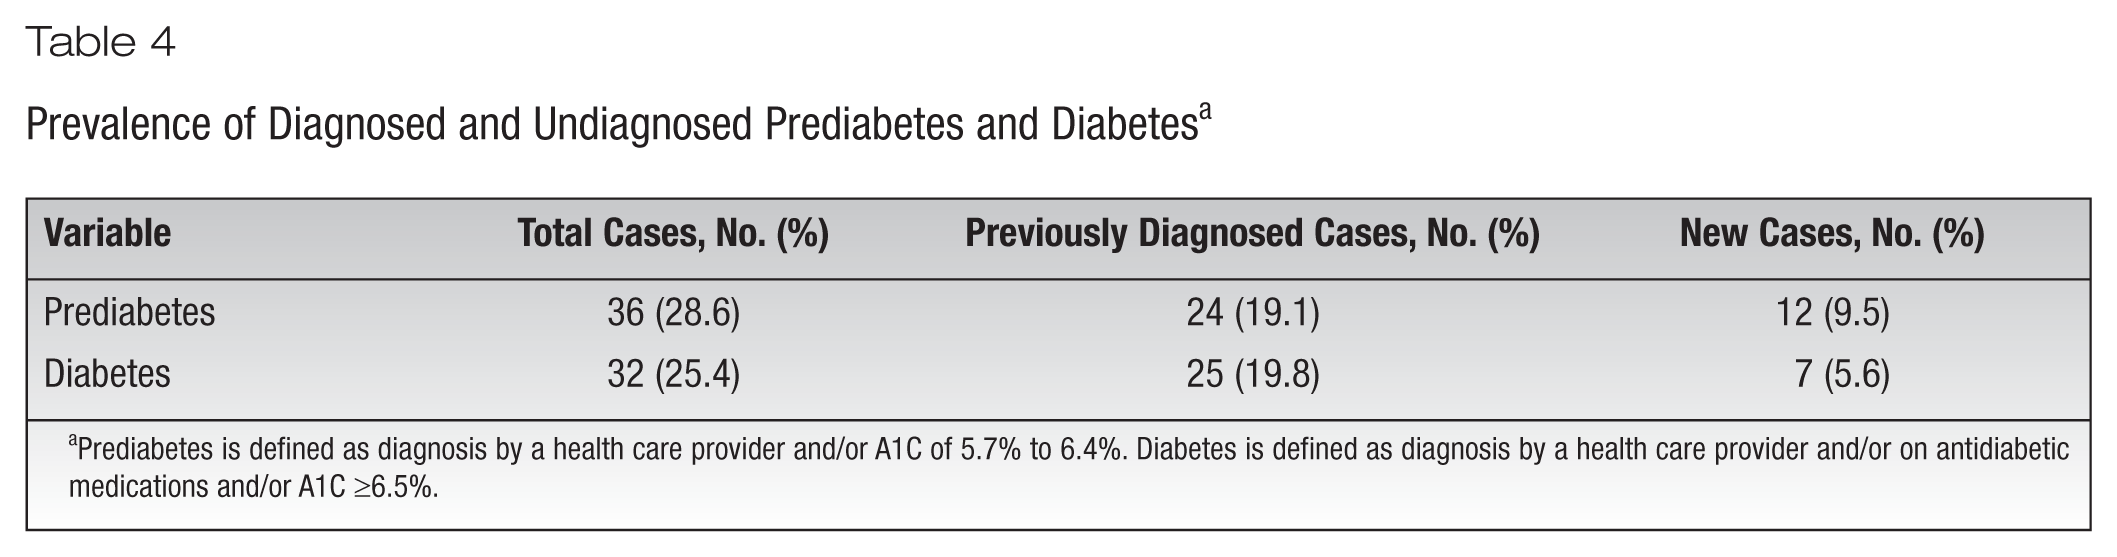
Prediabetes is defined as diagnosis by a health care provider and/or A1C of 5.7% to 6.4%. Diabetes is defined as diagnosis by a health care provider and/or on antidiabetic medications and/or A1C ≥6.5%.
Risk Factors for Diabetes
The association between sociodemographic and clinical characteristics of study participants and glycemic level is presented in Table 5. Prediabetes and diabetes were more prevalent among participants between ages 36 and 60 years (n = 23, 63.9% and n = 15, 50.0%, respectively, P = .08) and those who were married (n = 28, 77.8% and n = 13, 43.3% respectively, P = .001). Similarly, significant associations were found with prediabetes and diabetes among those with previously diagnosed hypertension (n = 8, 22.2% and n = 14, 46.7% respectively, P = .008), those with previously diagnosed high blood cholesterol (n = 8, 22.2% and n = 24, 80.0%, P < .0001), and those who had ≤2 days per week of moderate physical activities (P = .02).
Association Between Sociodemographic and Clinical Characteristics of Study Participants and Glycemic Level
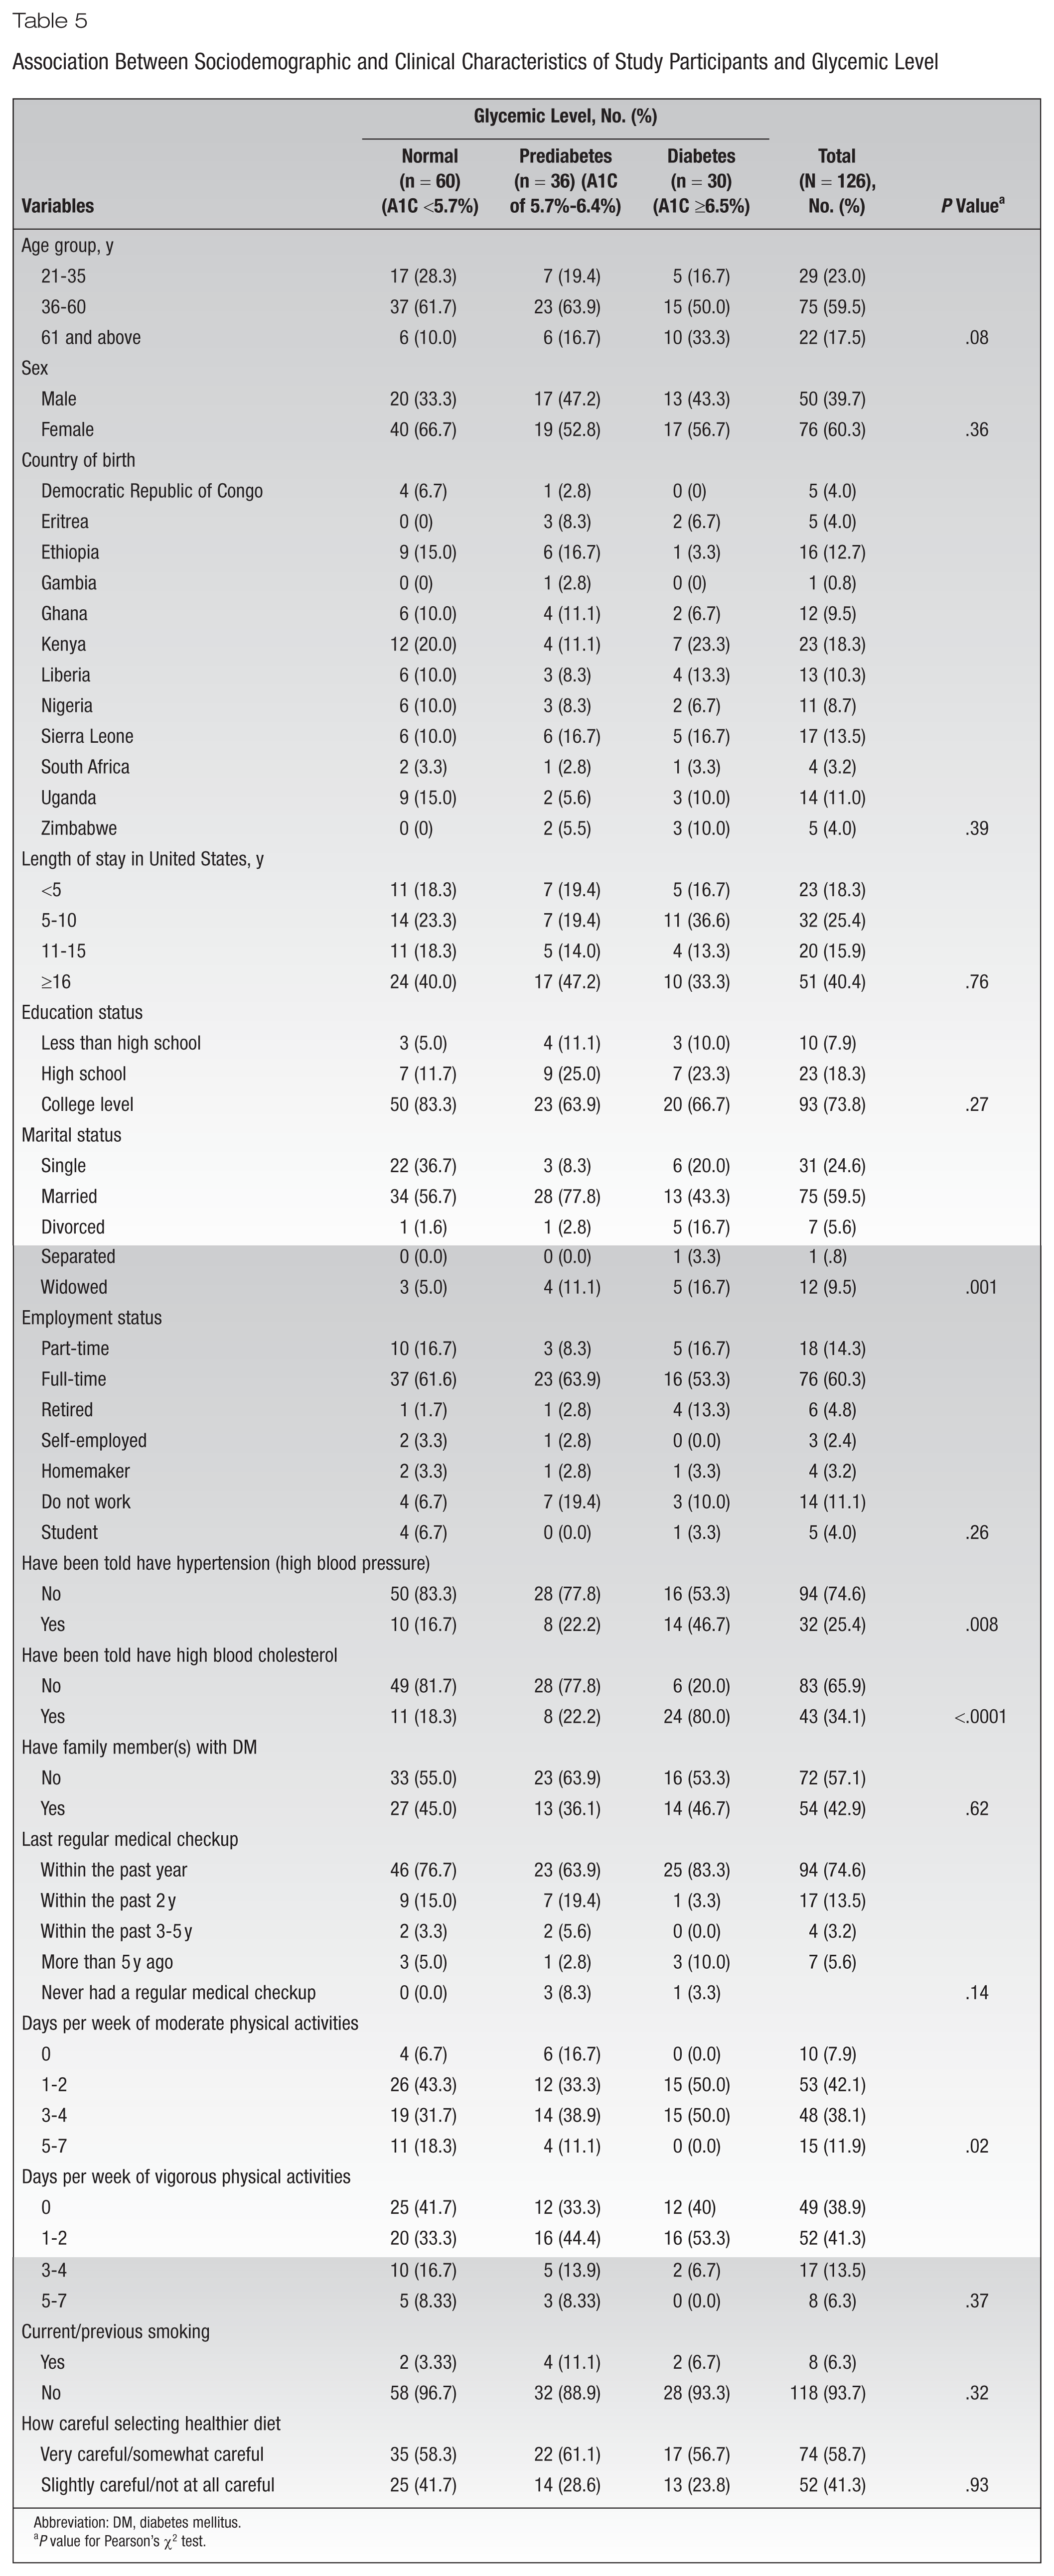
Abbreviation: DM, diabetes mellitus.
P value for Pearson’s χ2 test.
Treatment and Control Status of Diabetes
All 25 participants with previously diagnosed diabetes reported being on treatment (oral antihyperglycemic medications or insulin). Among all 25 participants who had been told they had diabetes or were already on treatment, only 5 (20.0%) had a good glycemic control status, whereas the rest (80.0%) had a poor glycemic control signifying A1C above 7% (Table 6).
Treatment and Control Status Among Participants With Diabetes a
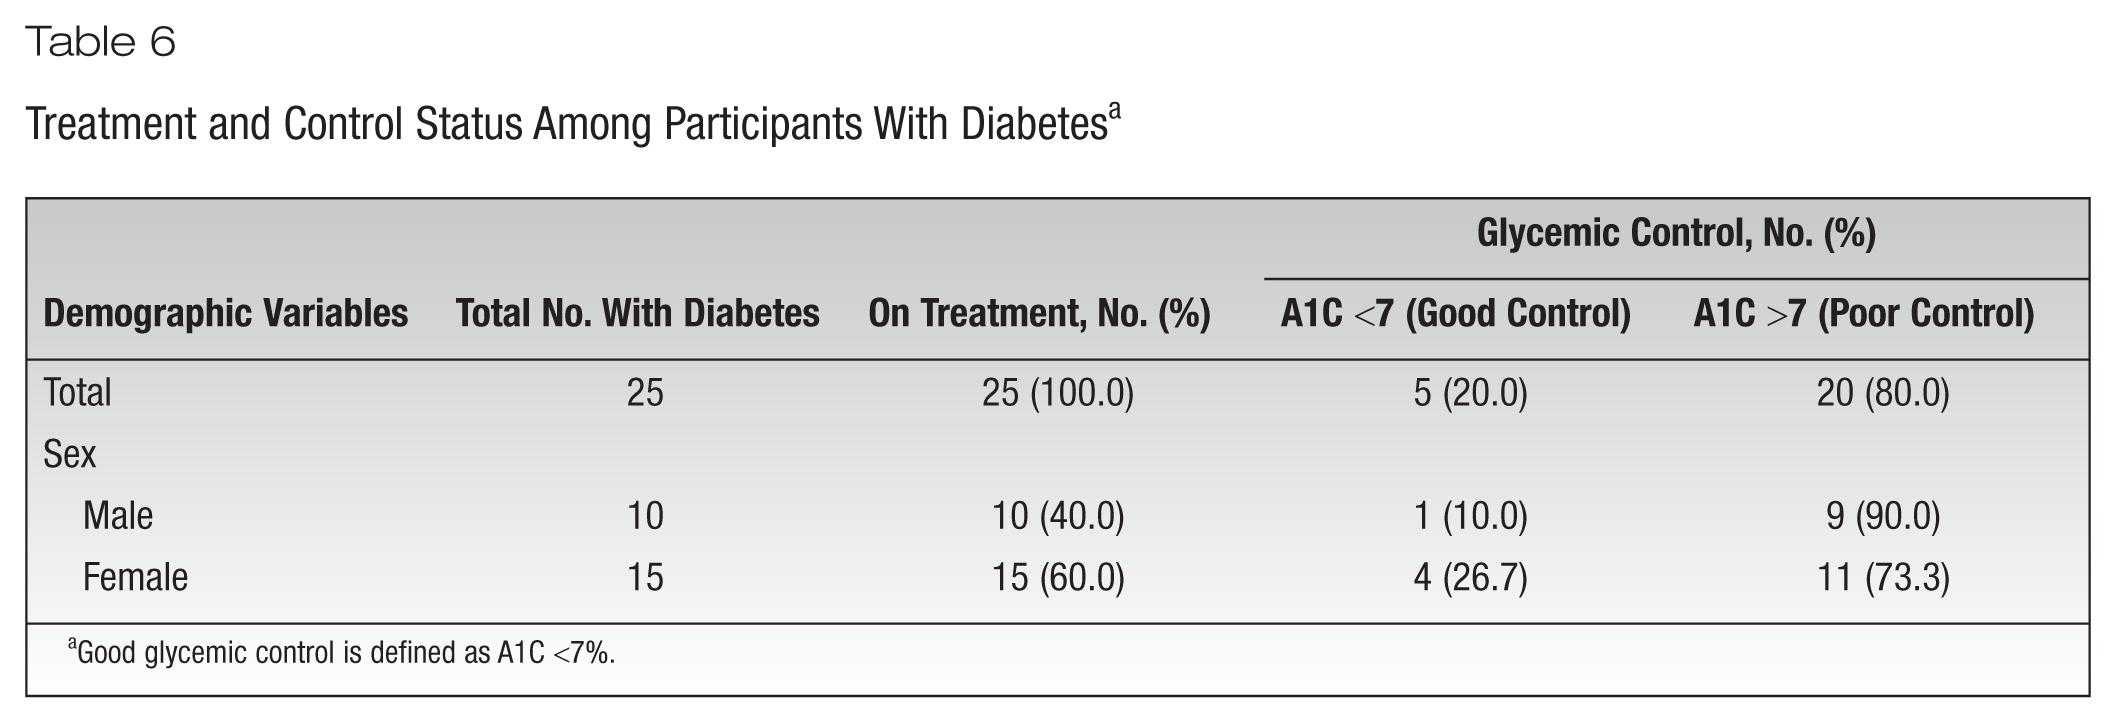
Good glycemic control is defined as A1C <7%.
Discussion
This study aimed to assess the prevalence of diabetes and associated risk factors in the African immigrant population in Sacramento County, California. Overall prevalence of prediabetes and diabetes among the study participants was 28.6% and 25.4%, respectively. The results of the current study support findings of a high prevalence of prediabetes and diabetes among African immigrant populations in Sacramento County, highlighting the critical need for both early detection of the disease and prevention measures.23,24 Indeed, while almost 1 in 5 participants in the study had prevalent diabetes, 21.9% of those with the disease were discovered only during the time of data collection. These findings are consistent with some prior studies showing that African immigrants had a higher prevalence of diabetes (prevalence ratio [PR], 1.41; 95% confidence interval [CI], 1.01-1.96]), 25 and African immigrant patients had a high prevalence of prediabetes and diabetes compared to US-born patients. 26 In Minnesota, Njeru et al 26 found that the prevalence of diabetes was significantly higher among Somali vs non-Somali patients (12.1 vs 5.3%; P = .0001), as was prediabetes (21.3 vs 17.2%; P < .02). Ukegbu et al 27 found a similar metabolic risk and metabolic syndrome prevalence in Africans and African Americans (10% vs 13%, P = .74) but a higher prevalence of hypertension, glycemia (fasting and 2-hour glucose), and visceral adipose tissue in African immigrants. The Minnesota Department of Human Services also found that 29% of Somali immigrant elders and 18.3% of Oromo (an ethnic group inhabiting Ethiopia, Kenya, and Somalia) immigrant elders had diabetes. 28 This observation may be explained by the accelerated changes in dietary and lifestyle patterns (especially physical inactivity) contributing to the increased prevalence of not only diabetes but also obesity, hypertension, and hypercholesterolemia in African immigrant populations.
In the current study, 73.8% of the participants were overweight or obese (mean BMI, 28.8 kg/m2), with female compared to male participants being more overweight or obese (77.6% vs 68.0%). This is consistent with a study in Minnesota that found the prevalence of obesity to be significantly higher among Somali vs non-Somali patients (34.6% vs 32.1%, P = .047). 26 This is also consistent with some studies that have shown that about 35% of adults older than 18 years were obese in the United States, with the highest prevalence identified in the non-Hispanic black population (48%), followed closely by the Hispanic population (43%), non-Hispanic white population (33%), and non-Hispanic Asian population (11%). 29 Another study has shown that female immigrants to the United States had a 10% increased likelihood of being obese at the point of migration than native-born counterparts. 30 This is also in line with prior studies; 1 study with a sample of 208 Somali immigrants in Oslo, Norway, found that 104 (50%) participants were either overweight (35%) or obese (15%), with approximately 64% of overweight participants being women, 31 and another study in New Zealand found that 71% of Somali women had a BMI ≥25 kg/m2. 32 As such, these findings are not unexpected due to evidence showing that immigrants from low- or medium-income countries to high-income countries have increased susceptibility to obesity compared to their counterparts in their native countries. 33 The highest prevalence of overweight and obesity in African immigrant females could be related to cultural values, as African populations prefer larger body size women as a sign of fertility, healthiness, or happiness.34-36
Only 19.8% of all cases of diabetes were previously known cases or on treatment, among whom only about one-fifth had controlled blood glucose status (A1C below 7%). The findings of the current study are consistent with those of a previous study in the Primary Care Internal Medicine and Family Medicine clinics at Mayo Clinic Rochester, Minnesota, from April 1, 2008, to June 30, 2008, that found Somali patients with diabetes were less likely to meet the criteria for optimal glycemic control (A1C <7%) than non-Somali patients. 37 Another study conducted among hospitalized patients with diabetes in France found that African immigrant patients had higher rates of A1C and less self-reported adherence compared with other patients. 38 These studies suggest that glycemic control is poorer in African immigrants than in their non-African counterparts in the United States and France.
About 21.4% of participants with prediabetes and 5.6% of participants with diabetes were previously undiagnosed. This is consistent with a cross-sectional study accessing baseline data from 2856 adults aged 18 years and older recruited to the Cameron County Hispanic Cohort (CCHC) in Brownsville, Texas, between 2004 and 2014, that found that 40% of those with diabetes (345 participants) were previously undiagnosed. 39 Another study in the state of Punjab, India, has shown that among all persons with diabetes, only 37 (18%) were known cases of diabetes or on treatment, whereas the rest were previously undiagnosed. 40 These results suggest early identification and therapy of individuals with undiagnosed cases of diabetes and ensuring regular follow-up to avoid microvascular as well as macrovascular complications. 40
The current study found a higher prevalence of prediabetes and diabetes among individuals in the age group of 36 to 60 years, those who were married, those who had hypertension, those who had been told they had high blood cholesterol, and those who had 0 to 2 days per week of moderate physical activities. These findings support those of the Health Survey for England (HSE), 41 in which the prevalence rates of type 2 diabetes were 16.2% and 6% in African immigrant men and women aged ≥35 years compared with 5.1% and 2.4% in English general population men and women, respectively. These findings also support prior findings that the risk for type 2 diabetes among Somali immigrant women increases with increased age, with a mean age of 35.7 years among those with a low risk of diabetes, a mean age of 37 years among those with a moderate risk of diabetes, and a mean age of 38.3 years among those at high risk for diabetes. 42 In addition, Gele et al 42 found that the likelihood of getting type 2 diabetes among Somali immigrant women was significantly associated with having hypertension (odds ratio [OR], 7.32; 95% CI, 1.95-27.5), and the group with no rigorous physical activity was 2 times as likely as their counterparts practicing physical activity up to 5 hours a week to be at risk for type 2 diabetes (OR, 2.34; 95% CI, 1.00-5.50), an association that turned out to be significant after it was adjusted for age.
Results of this study support the conclusion by DesMeules et al 43 that there is an increased risk for developing type 2 diabetes and associated complications after African immigrants have lived in the United States for 3 years or more and the conclusion from the Mayo Clinic that African immigrants are more likely to develop diabetes compared to US-born citizens and have higher chances of experiencing complications of diabetes such as heart or kidney disease and stroke. 44
Strengths and Limitations
The distinctive strengths of the current study are the data collection by the author (D.M.K.) and diagnosis of diabetes was based on measurement of A1C, which is the prediabetes and diabetes diagnostic criterion recommended by the ADA 22 and the gold-standard marker to assess the control of diabetes. Measurements of weight and height to calculate the BMI, blood pressure, and A1C in this study not only constitute a reliable source of information but also increase the trustworthiness of collected information. Also, the current study included participants older than 65 years, a proportion of individuals whose diabetes prevalence is likely to be particularly high.45,46 The important limitations of the current study are its cross-sectional design, hence making it difficult to draw causal inferences, and its small sample size, which may not be representative.
Implications for Practice and Research
The current study provided the first and reliable epidemiological data regarding the high burden of diabetes among African immigrants in Sacramento County. African immigrants are found to have a high prevalence of prediabetes, diabetes, and multiple risk factors of diabetes, as well as poor glycemic control among those with diabetes, calling for immediate attention. This study also highlights a significant burden of undiagnosed cases of prediabetes and diabetes in the African immigrant population, which will not only generate increased diabetes care costs within the next decade but also reduce the quality and duration of life in this population. There is a need to identify the large pool of undiagnosed cases of prediabetes and diabetes and provide early opportunity to make important lifestyle changes and treatment to not only prevent or delay the progression toward type 2 diabetes but also avoid its associated complications. Thus, the initiation of culturally sensitive lifestyle interventions that include change in diet, exercise, and education may have a substantial ameliorating impact on prevention of risk factors associated with type 2 diabetes and its complications.
Footnotes
Acknowledgements
The authors did not receive any grant for this study. The authors thank the CSUS School of Nursing for financial support to purchase 85% of the study supplies and would also like to extend their appreciations to African immigrants in the Sacramento area who participated in this study.
Competing interests:
The authors declare that they have no competing interests.
Authors’ Contributions
Dr Kindarara conceived and designed the study, collected the data, produced interpretations of findings, and drafted the manuscript. Dr Silva performed data analysis, contributed to the design of analysis and interpretation, and revised the manuscript for quality, consistency, and accuracy. Both authors reviewed and approved the final manuscript.