
Abstract
Findings from a meta-analysis on gender differences in self-esteem (Zuckerman et al., 2016) suggest that the relation between the degree to which societal conditions are favorable to women and gender difference in self-esteem might be quadratic; when conditions improve, women’s self-esteem (relative to that of men) trends downward but when conditions continue to improve, women’s self-esteem begins to trend upward. Testing whether these relations generalize to subjective well-being, the present study found a quadratic relation between improving societal conditions and the gender difference in life satisfaction and positive affect (women are lower than men when societal conditions are moderately favorable compared to when they are at their worst and at their best); the relation was linear for negative emotion (women report more negative emotions than men when societal conditions are better). Directions for future research that will address potential explanations for these results are proposed.
Gender differences in subjective well-being (SWB) is a topic of interest in a number of fields, including psychology, sociology, and economics. Psychologists’ interest was motivated primarily by women’s susceptibility to depression (Nolen-Hoeksema, 2001) and, to a lesser degree, by women scoring lower than men on self-esteem measures (Kling, Hyde, Showers, & Buswell, 1999); indeed, it was suggested that these two phenomena might be linked to the same antecedents (Major, Barr, Zubek, & Babey, 1999). Sociologists and economists have also contributed to the literature on this topic, focusing on the relation between the gender difference and current societal and economic conditions.
SWB, that is, quality of life or “happiness” in colloquial terms, is comprised of three components: life satisfaction, positive emotions, and negative emotions (Diener, 2000; Diener, Oishi, & Lucas, 2015; Tay, Kuykendall, & Diener, 2015). Because the components are relatively independent, a gender difference in one component may not generalize to any of the two others. Indeed, there have been attempts (e.g., Fujita, Diener, & Sandvik, 1991) to reconcile women’s tendency to report greater negative affect but equal positive affect compared with men. The gender difference might vary not only by which of its three components is being measured but also by the country in which it is assessed and the time of the assessment. Not surprising perhaps, the literature on gender differences in SWB does not convey a coherent picture.
For example, Graham and Chattopadhyay (2013), using survey data from 2005 to 2011 from 160 countries, Meisenberg and Woodley (2015), using survey data from 1981 to 2008 from 96 countries, and an Organization for Economic Co-Operation and Development (OECD; 2013) report, using data from 2012 from 41 countries, all showed that women reported slightly higher life satisfaction than men. However, the OECD (2013) report also showed that men were higher than women on an affect difference index (positive minus negative affect) and, using survey data from 2002/34 countries, Hori (2010) reported that women actually reported lower life satisfaction than men. Importantly, these results reflect, at best, a reality that might have existed only at specific time period. Tracking survey data in the United States from 1972 to 2006, Stevenson and Wolfers (2009) showed that men’s self-reported happiness changed very little, whereas women’s happiness declined such that women’s advantage relative to men in the 1970s turned to disadvantage in the 2000s.
In terms of the relations between the gender difference and societal conditions, Hori (2010) showed that the gender difference in life satisfaction was not related to gender inequality or to type of political regime Hori, 2008, is now Hori, 2010, which already has a reference. Graham and Chattopadhyay (2013) found that when life satisfaction was measured by Cantril’s (1965) ladder (from worst to best possible life), females’ advantage over males was more true in developed countries—but when life satisfaction was measured by a direct question, females’ advantage was more true in poorer countries. Both Veira-Lima (2011) and Meisenberg and Woodley (2015) found that women’s life satisfaction was higher in countries with greater gender inequality and lower women’s status. Tesch-Römer, Motel-Klingebiel, and Tomasik (2008) found that greater gender equality is related to higher SWB in women relative to men in countries that support equality; the relation is reversed in countries that support inequality. In her review of this literature, Duflo (2012) concluded that advances toward greater gender equality do not directly ensure better outcomes for women because social norms and traditions continue to discriminate against them.
In the current study, we once again examined the relation between societal conditions and the gender difference in SWB; our starting point, however, was different from that of the typical research in this domain. Specifically, we tested predictions that were derived from previous work on the gender differences in self-esteem (Zuckerman, Li, & Hall, 2016).
Zuckerman et al. (2016) conducted a meta-analysis on gender difference in self-esteem for the years 2009 to 2013. They also examined the findings of previous reviews of this topic. Three main findings emerged. First, the review of the previous reviews showed that the gender difference in self-esteem, which generally favors males, did not exist in the United States prior to 1970s, rose steadily afterward, and culminated in 1987 to 1995 (the years covered by the last meta-analysis that was reviewed; Kling et al., 1999). This observation is consistent with the aforementioned report (Stevenson & Wolfers, 2009) that, starting in the 1970s, women’s self-reported happiness began to decline whereas men’s happiness remained steady. It is of interest that in the 1970s, women were expanding their participation in the labor force and the Women’s Liberation Movement had started the fight for gender equality. It appears that women’s well-being, whether measured by self-esteem or happiness, began to erode relative to men precisely when women began to reduce their disparity with men.
The second finding concerned variation among some 30 to 35 countries in the gender difference in self-esteem; Zuckerman et al. (2016) found that women’s disadvantage in SWB was greater in countries with higher quality of life, better government services, higher female participation in the workforce, lower religiosity, and value orientations that promoted equality and personal freedom. These trends, the aforementioned changes in the gender difference in self-esteem in the United States from 1970s to 1990s, and the previously noted finding that women’s life satisfaction is higher in countries with greater gender inequality (Meisenberg and Woodley, 2015; Veira-Lima, 2011), all seem to indicate that conditions conducive to greater gender equality can be associated with women’s lower self-esteem and life satisfaction relative to men.
Finally, Zuckerman et al. (2016) found a smaller gender difference in the United States in 2009 to 2013 than the one found in the Kling et al. (1999) meta-analysis. That is, after a decline in women’s self-esteem relative to men from 1970s to 1990s, the trend reversed itself and the gender difference in self-esteem has become smaller. During the same period of time, women continued to increase their participation in the workforce and their earnings also rose relative to those of men.
How to explain these results? Crocker and Major (1989) proposed that members of stigmatized groups protect their self-esteem by comparing themselves to other members of the group, developing a positive group identity, and endowing characteristics of the group with positive attributes. In part, the model served as an explanation for the findings that African Americans in the United States have higher self-esteem than do Whites (Twenge & Crocker, 2002). Independently, Stevenson and Wolfers (2009) suggested that one possible reason for the decline in women’s happiness after the 1970s was the increase in comparisons that women made with men.
Applying this approach to their findings, Zuckerman et al. (2016) speculated that prior to the 1970s in the United States, and in more traditional countries in the world at present, women were or are able to protect their self-esteem by comparing themselves to other women and by endowing the female gender role (e.g., communal and warm) with positive values. Under these circumstances, women accepted the status quo and were not threatened by men’s elevated status; this allowed women to maintain a level of self-esteem that was comparable with men. After the 1970s in the United Stated and in less traditional countries at present, women were or are able to increase their presence in the workforce and in educational and political institutions; however, the extent of gender inequality has not changed drastically. Under these circumstances, women compare themselves with men, become aware of their inferior condition relative to that of men, and suffer a loss in self-esteem. Finally, the narrowing of the gender difference in self-esteem in the United States might be related to the progress that was made toward greater gender equality, and the more vigorous fight that is being made against the gender discrimination that still exists. In this sequence, then, variations in the gender difference in self-esteem, across cohorts in the United States and across countries in the worlds, might reflect three stages in women’s responses to gender equality—acceptance of the status quo in traditional societies, awareness of gender discrimination in societies that allow women’s entry to previously male dominated institutions, but retain much of gender inequality, and progress toward and hope for greater gender equality. 1
However, this model was a post hoc explanation of gender difference in self-esteem; hence the term speculation that was attached to it. No data were collected on any of the mediating processes (e.g., social comparisons, responses to gender inequality, etc.). Furthermore, the data on gender differences in self-esteem were obtained from nonrepresentative samples (participants in the studies that were reviewed) from only a small number of countries. Clearly, there is a need for additional research. In the present study, we tested whether the sequence of changes in the gender differences in self-esteem (women trending down as societal conditions improve and then trending up relative to men) generalizes to gender differences in SWB.
Our rationale for applying a model of gender differences in self-esteem to gender differences in SWB is twofold. First, although Crocker and Major (1989) aimed to explain why stigmatized groups do not suffer from a loss of self-esteem, they describe protective processes that are relevant to well-being. Second, self-esteem is often used as an index of well-being (Taylor, Lerner, Sherman, Sage, & McDowell, 2003), a practice that was described in an early review of the SWB literature: “ . . . We found that the vast majority of studies measured either self-esteem or SWB, often referring to one construct as a measure of the other” (DeNeve & Cooper, 1998, p. 199). Indeed, studies have reported consistent relations between measures of these two constructs. 2
We thus tested gender differences in SWB as a function of societal conditions. We used almost all the variables used by Zuckerman et al. (2016) as measures of societal conditions, but added gender inequality as it is directly relevant to the issue of how women react to gender discrimination. 3 We also followed analyses of the gender differences with separate analyses for males and females; Zuckerman et al. (2016) could examine only the gender difference. We predicted that the continuum from countries with the worst societal conditions to those with the best conditions would be associated with a quadratic trend in gender differences in SWB (women trending down and then up relative to men). We also thought that this pattern would be true for women alone, that is, better societal conditions associated with an initial decline and then an improvement in SWB. For men, better societal conditions might also lead initially to a slight decline in SWB because, as Zuckerman et al. (2016) suggested, women’s initial gains might threaten men. However, the initial downtrend should be stronger for females than for males. Further along the continuum of societal conditions, both men and women should show an improvement. If women show a steeper improvement, we will get the quadratic pattern of the gender difference in SWB; if females improve but lag in their improvement compared with males, we will get a negative relation between societal conditions and the gender difference in SWB (the better the conditions, the better men do relative to women).
Method
Sample
The SWB data were obtained from the Gallup World Poll that was conducted in 2005 to 2009 and originally sampled 455,104 individuals from 155 countries. The sample Gallup drew from each country was representative of the resident population, 15 years of age or older. In countries with telephone coverage of 80% or more of the population, the sampling was done from phone numbers and the surveys were administered by phone. In countries with less telephone coverage, the sampling was based on geographical area frames and the survey was administered face-to-face. Primary sampling units were stratified by population size or geography. Random route procedures were used to select households. The Kish (1949) grid technique was used to select persons for the interview within each household. Unless the persons selected refused flat-out, three attempts were made to reach them.
Measures
SWB
Life evaluation was measured with Cantril’s (1965) 11-step ladder, ranging from 0 to 10 with higher steps representing better life for the respondent. Participants chose which step best represented their life. Emotions were measured by asking participants whether or not they experienced (an emotion) a lot during the previous day (1 = yes, 2 = no). Ratings were averaged across ratings of the positive emotions (smile/laugh, experience, and enjoyment; α = .62), and across ratings of the negative emotions (worry, sadness, depression, and anger; α = .68).
Life quality
This was a composite, comprised of six variables that were used by Zuckerman et al. (2016). The first variable, education, was itself a composite comprised of three measures obtained separately for males and females from the World Bank (http://data.worldbank.org) for the years 2005 to 2009: persistence to last grade of primary education, progression to secondary school, and literacy rate (all scored as percentage in female or male cohorts). We first averaged the variables across the years for which they were available and, because of skewness, log transformed them. As the averages were highly intercorrelated (rs = .53- .77), they were standardized and combined into separate composites for males and females (α = .88 for both composites). As the two composites were highly correlated (r = .96), they were combined into one educational variable. The remaining five variables in the life quality composite were obtained from The World Fact Book (https://www.cia.gov/library/publications/resources/the-world-factbook/index.html) and included infant mortality (number of deaths/1,000 live births), percentage population in urban areas, life expectancy, number of physicians/1,000 population, and percentage of population below poverty. Infant mortality, life expectancy, and poverty were log transformed due to skewness. All five variables plus education were standardized and combined (infant mortality and poverty were first reverse scored; α of the composite = .87).
Government services
We obtained two indices of government services from The World Fact Book; both indices, health expenditures and educational expenditures, were calculated as percentage of gross domestic product (GDP). They were standardized and combined into a single composite.
Females’ labor participation
Percentage of females past age 15 years who are working was obtained from the World Bank website for each of the years 2005 to 2009 and averaged across the years.
Nonreligiosity
The Gallup World Poll 2005 to 2009 requested respondents to answer yes or no to the question “Is religion an important part of your life?” We obtained the percentage of people who answered yes in each country from Diener, Tay, and Myers (2011, Table 4). Each percentage was subtracted from 100 to obtain a measure of nonreligiosity.
Gender equality
Data on degree of gender equality in the countries surveyed by the Gallup World Poll were obtained from the Global Gender Gap Report that is published on the World Economic Forum’s website (http://reports.weforum.org/global-gender-gap-report-2014/economies/#economy=ISL). For each country, the report provides scores on degree of gender equality in four areas: health, education, economy, and politics. For each of those areas, the score is based on a number of variables (in economy, for example, the score is based on the ratio of female earned income over that of male, ratio of female technical and professional workers over that of males, etc.); these numbers are combined into a single score that ranges from 0 to 1.0, with higher scores indicating greater gender equality. The four scores are combined into an overall score, also ranging from 0 to 1.0, which was used in the present study.
Results
Constructing the Societal Conditions Composite
Are the societal conditions related to one another? Table 1 presents the relevant correlational matrix. Female participation in the workforce (right-hand column in Table 1) seems unrelated to most of the other variables. As could be expected, it is positively related to gender equality (r = .46), but it is not related or negatively related to the other variables (rs ranging from .09 to −.27). However, the remaining four societal conditions were all interrelated with rs ranging from .30 to .74. To examine whether these four variables can be viewed as measures of a single latent variable, we conducted a confirmatory factor analysis with structural equation modeling. We correlated the error variances of quality of life and nonreligiosity, because they are the most highly correlated (r = .74). The four predictors were loaded on one latent factor. The model fit the data well, χ2(1, 127) = .002, p = .963, comparative fit index (CFI) = 1.00, and root mean square error of approximation (RMSEA) = .00. As this result implies that the measures represent a single construct, we standardized and combined the four variables into a societal conditions composite (α = .80). To get high scores on the composite, a society must meet both basic (food, shelter) and more advanced needs (education, work opportunities, and equality) for all its citizens, that is, it must have high life quality, adequate government services, and gender equality; typically, this country is low in religiosity as people turn to religion when their needs are not met (Diener et al., 2011) or when they feel powerless (Kay, Gaucher, McGregor, & Nash, 2010).
Correlations Among Societal Variables.
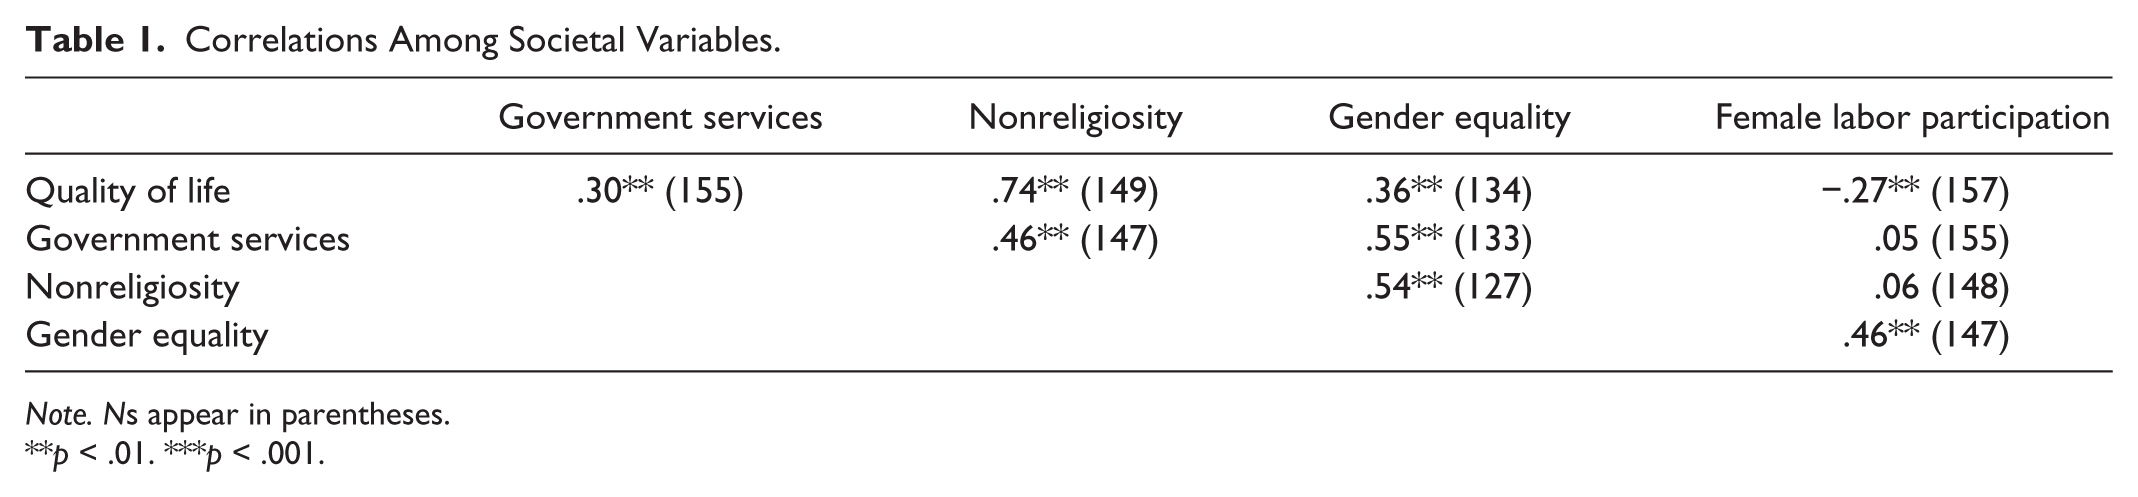
Note. Ns appear in parentheses.
p < .01. ***p < .001.
Relations Between the Composite and Gender Differences in SWB
The analyses that follow were based on a random effects model, which allows broader generalization than the fixed effect model (Lipsey & Wilson, 2001). In this procedure (R. Rosenthal, personal communications, January, 2016; Rosenthal & DiMatteo, 2002), countries serve as the units of analysis and are weighted equally. For each country, we calculated effect sizes (hedges’s g) of the gender difference in life satisfaction, positive affect, and negative affect; higher scores indicate that males scored higher than females on the particular variable. We regressed each of the three effect sizes on the societal conditions composite and on the composite squared (entered simultaneously), thus testing both linear and quadratic relations (see left portion of Table 2 and Figures 1 to 3). The number of countries participating in the regression analyses was 126 for life satisfaction and for positive affect, and 125 for negative affect. For each regression analysis, we present the standardized coefficient, the 95% confidence interval (CI) for the coefficient, and the partial correlation. 4
Linear and Quadratic Relations Between the Societal Conditions Composite and (a) the Gender Difference in Well-Being, (b) Well-Being of Males, and (c) Well-Being of Females.
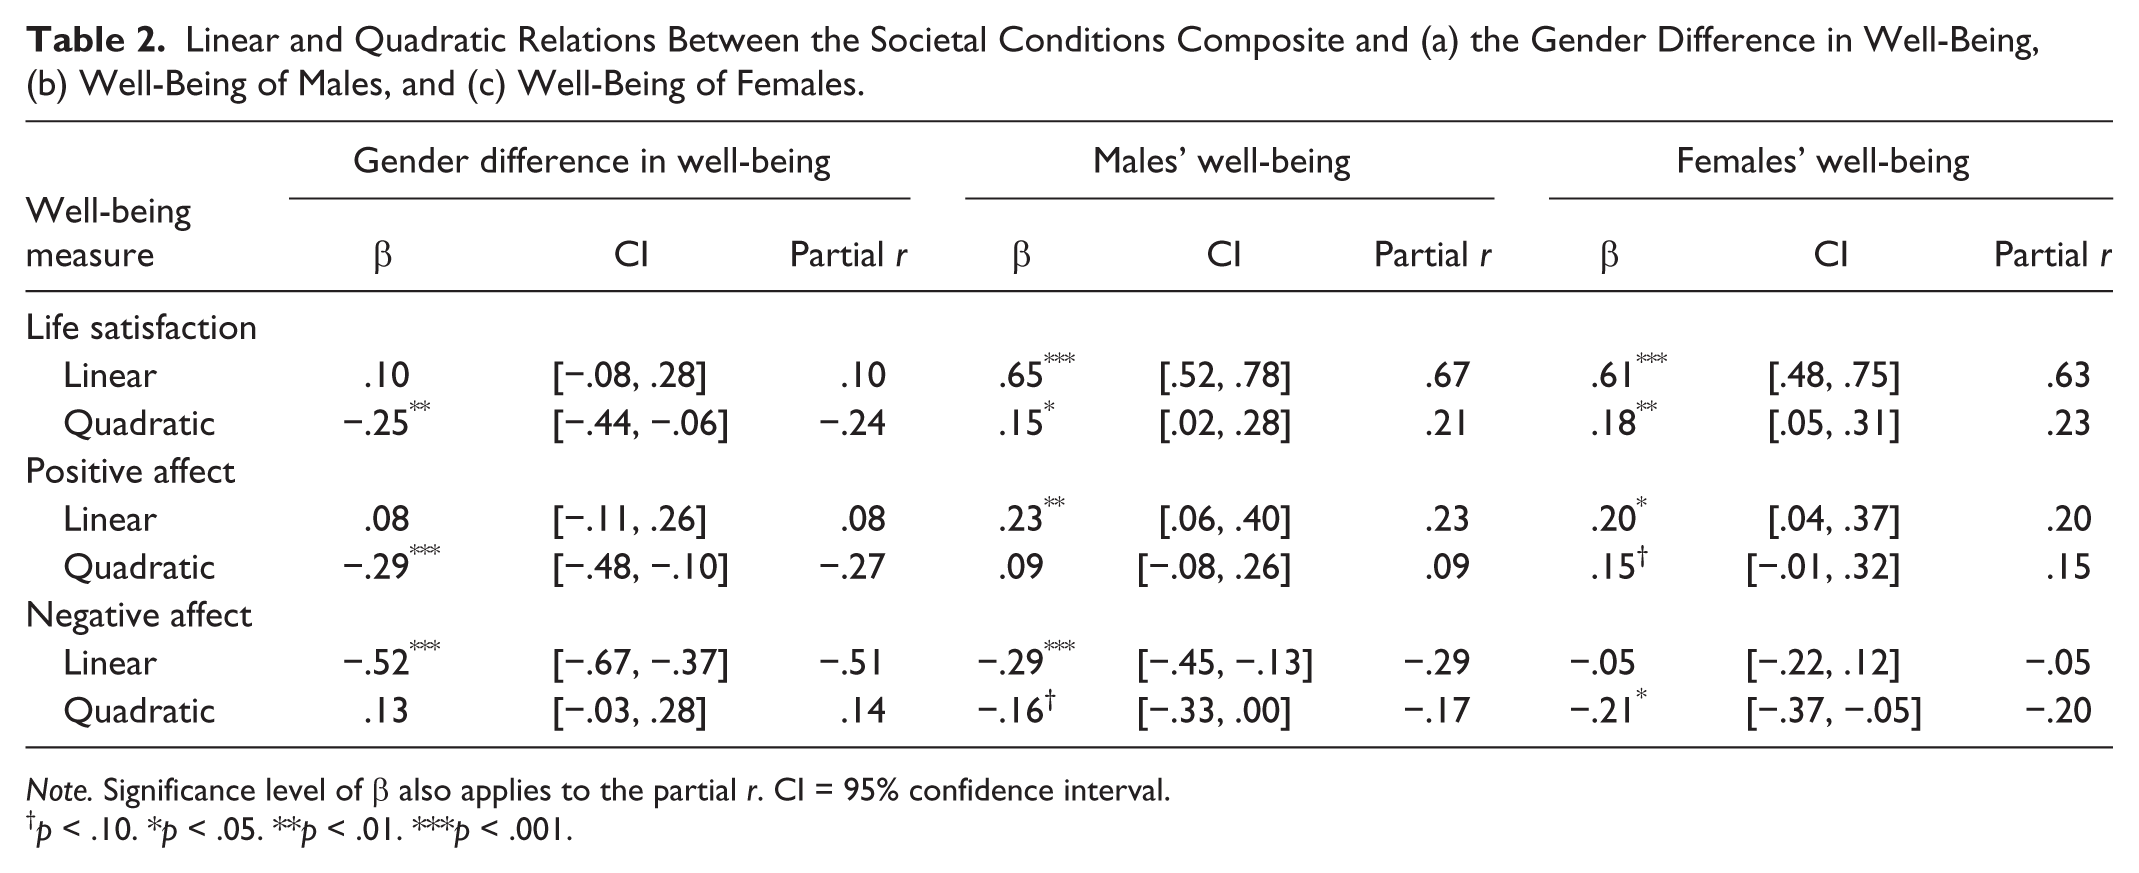
Note. Significance level of β also applies to the partial r. CI = 95% confidence interval.
p < .10. *p < .05. **p < .01. ***p < .001.
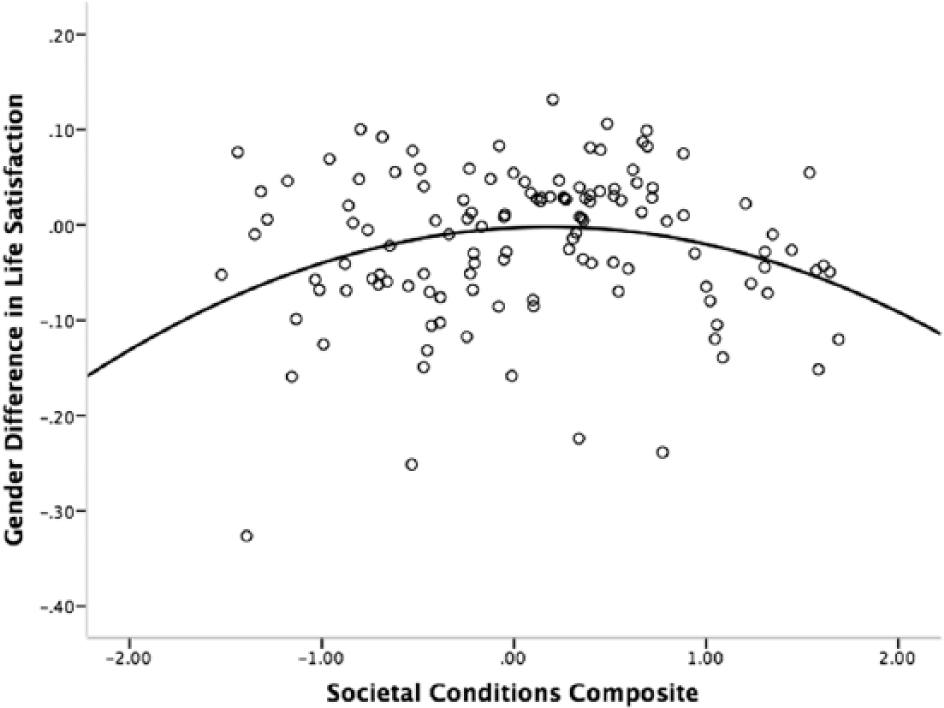
Relation between societal conditions composite and the gender difference in life satisfaction.
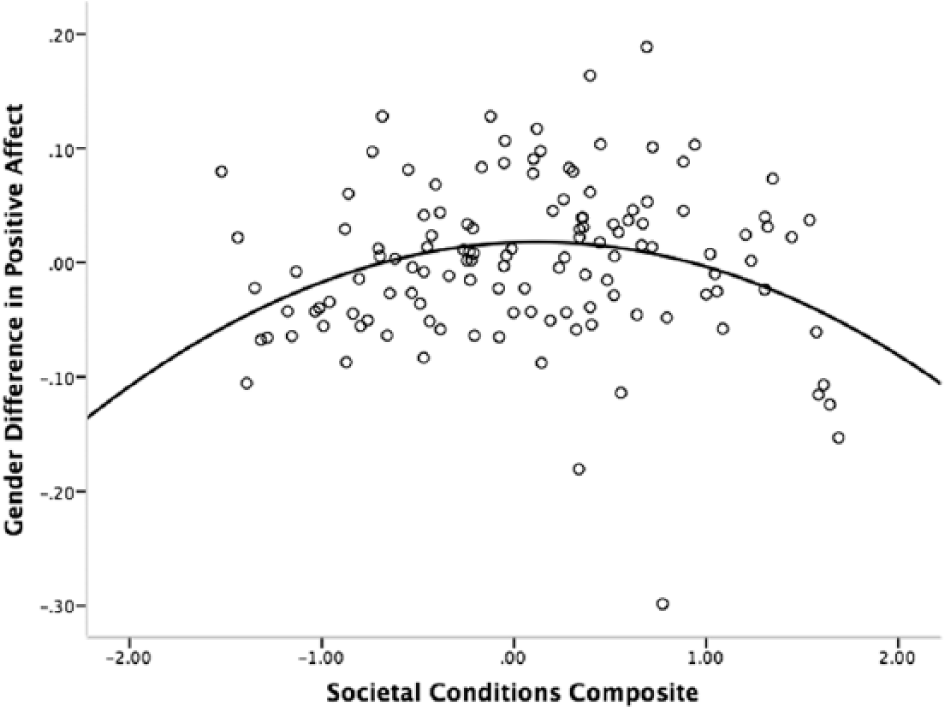
Relation between societal conditions composite and the gender difference in positive affect.
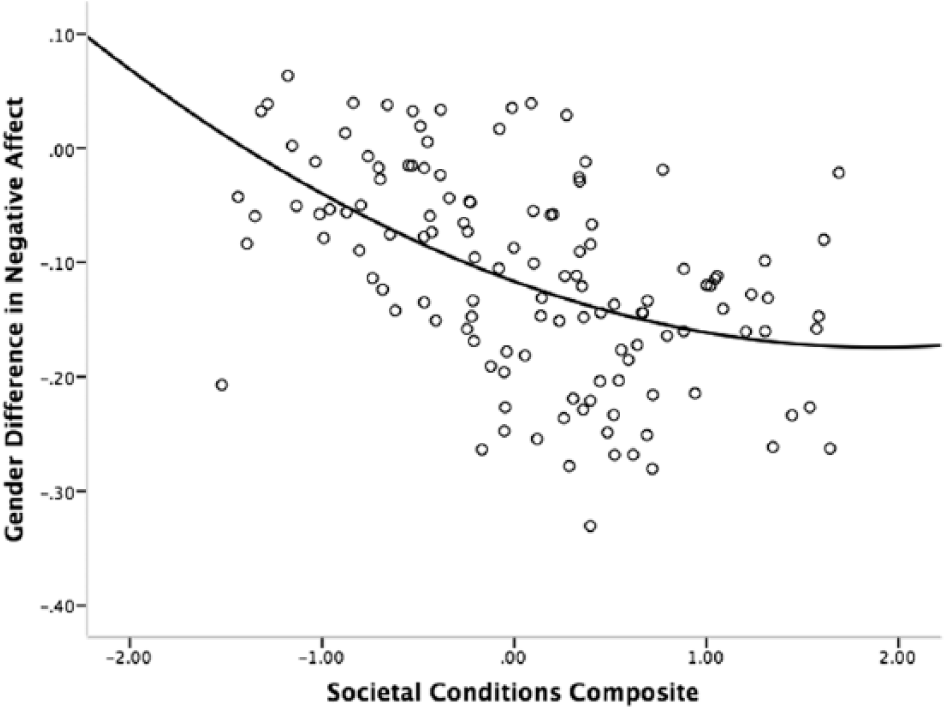
Relation between societal conditions composite and the gender difference in negative affect.
The results showed significant quadratic relations between the societal conditions composite and the gender difference in both life satisfaction and positive affect such that initial improvement in societal conditions was first related to lower well-being of females compared to males, and then to higher well-being of females compared to males. For negative affect, the quadratic relation was not significant (p = .11) but the significant negative linear relation replicates the relations obtained by Zuckerman et al. (2016) between societal conditions and the gender difference in self-esteem; that is, in countries with better societal condition, females report more negative affect (and lower self-esteem, Zuckerman et al., 2016) than do males.
Given these results, it was of interest to test whether the gender difference in self-esteem is correlated more highly with the gender difference in negative affect than with the gender differences in life satisfaction and positive affect. As Zuckerman et al. (2016) found differences among studies conducted with precollege, college, and postcollege respondents, we first calculated the unweighted mean g of the means obtained in each of these age groups (for the precollege studies, we included only studies conducted with respondents 15 years of age or older to make them comparable to the age criterion used in the Gallup poll). This mean g, available for only 24 countries, correlated .22 (p > .25) with the comparable g for life satisfaction, .31 (p = .14) with the g for positive affect, and −.50 (p = .01) with the g for negative affect. Thus, in spite of the small number of countries and the fact that the samples in the Zuckerman et al. (2016) meta-analysis and the present study are not comparable, the correlations are in line with the aforementioned suggestion (Major et al., 1999) that the gender difference in self-esteem and in negative affect (depression) might share the same construct.
We also tested the linear and quadratic relation between each individual societal condition and the gender difference in SWB. The specific results are in Table S1 and Figures S1 through S12 in the supplementary materials; here we present only a summary. The results were weak for life satisfaction. Unexpectedly, better quality of life was significantly related to higher life satisfaction for females than for males; the quadratic relation was nonexistent (β = −.01). For the remaining three societal conditions, quadratic relation with the gender difference in life satisfaction were in the right direction but significant only for gender equality. The results were stronger for positive and negative emotions. In five out of eight regressions (four societal conditions × two emotions), five showed a significant quadratic relation in the predicted direction (males showing higher advantage at moderate level of the societal condition) and five showed a significant linear relation in the predicted direction (males showing a greater advantage at higher levels of the societal condition). There were no significant relations opposite to predictions.
Separate Analyses for Males and Females
Results for the separate regressions for males and females are presented in middle and right portions of Table 2 and Figures 4 to 6. The figures indicate that with better societal conditions, initially, both women and men show a decrease in SWB although women’s decline is somewhat steeper. As societal conditions continue to improve, the results diverge. For life satisfaction and positive affect, women have the advantage in countries with the worst and best societal conditions—this is what produced the quadratic relations between societal conditions and gender difference in these two SWB components. For negative affect, after an initial increase, women’s negative affect declines but the rate of decline is not steep enough to close the gender gap—this is what produced the linear relation between better societal conditions and more negative affect for women relative to men.
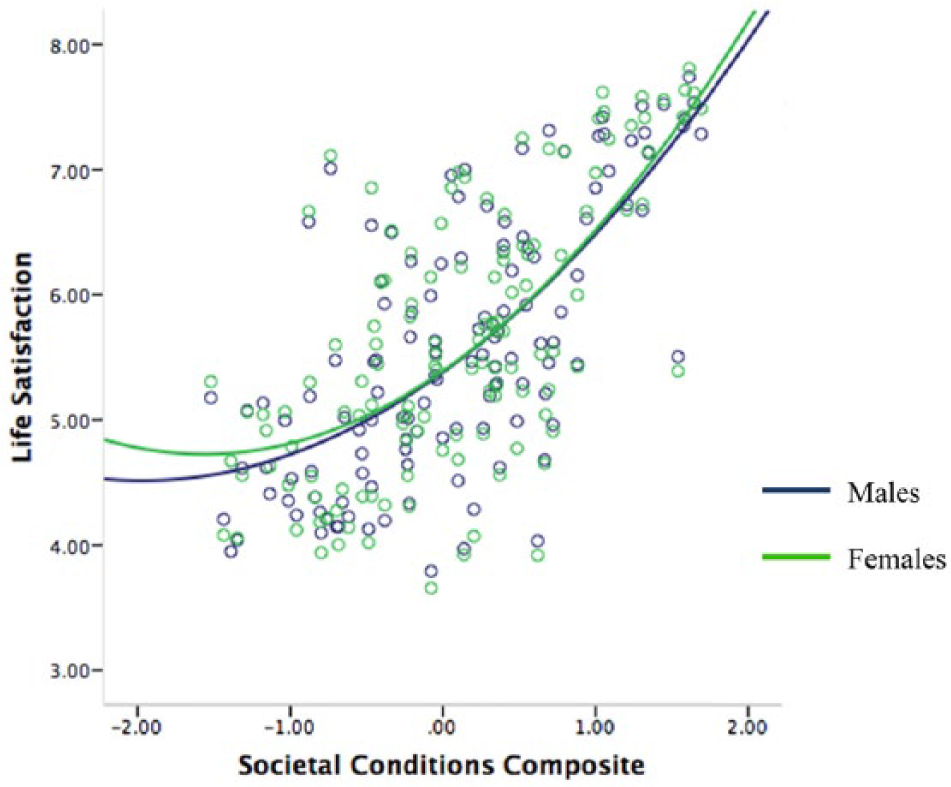
Relations between societal conditions composite and life satisfaction for males and females.
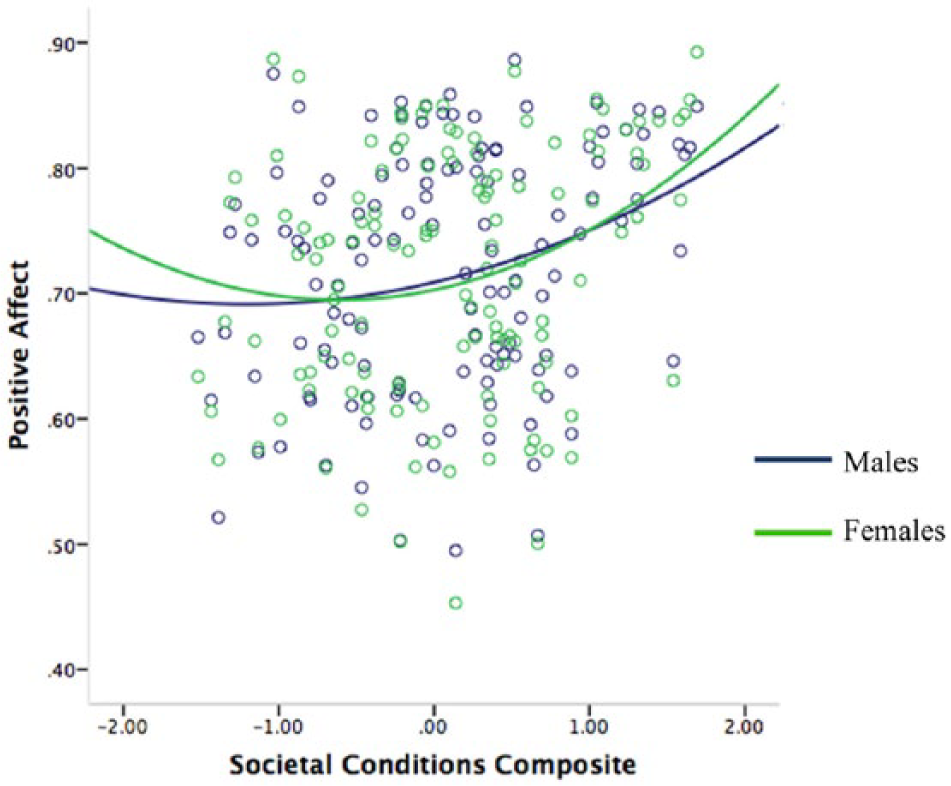
Relations between societal conditions composite and positive affect for males and females.
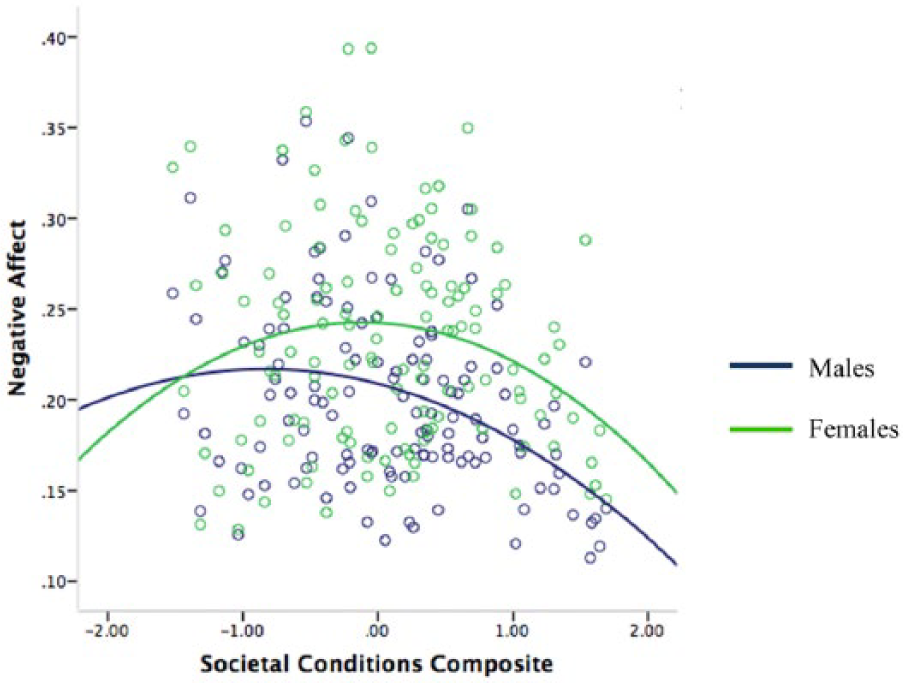
Relations between societal conditions composite and negative affect for males and females.
Comparisons of the coefficients in Table 2 indicate that the linear relations between better societal conditions and better SWB are somewhat stronger for men whereas the curvilinear relations are somewhat stronger for women. To repeat, these differences translate to the relations between societal conditions and the gender difference that are reported in the left hand column of Table 2.
Discussion
We tested whether the quadratic sequence implied by data on gender differences in self-esteem applies also to gender differences in SWB. Both in the United States and in countries around the world, Zuckerman et al. (2016) found that with better societal conditions, women’s self-esteem trends lower relative to that of men. In the United States only (number of studies in other countries was too small to allow confident conclusions), as societal conditions continued to improve, the gender difference became smaller. In the present study, we tested whether we would find similar trends with regard to gender differences in each of the three components of SWB; that is, we addressed two questions: Does women’s SWB trend down relative to that of men as we move from countries with the worst societal conditions to countries with moderate conditions? And, does women’s SWB continue to trend down (or does it trend up) when we move from countries with moderate societal conditions to countries with the best conditions? In short, we tested whether the relation between societal conditions and women’s SWB relative to that of men is quadratic or negative.
We obtained quadratic relations for life satisfaction and positive affect and a negative relation for negative affect. The results for negative affect replicate the results obtained by Zuckerman et al. (2016) for self-esteem and the gender differences for these two variables were strongly correlated. One might attribute the results for negative affect to women’s inherent predisposition to depression. However, it appears that in countries with the worst societal conditions, negative affect among women is equal to negative affect among men (see Figure 6). Given that even in countries with the best societal conditions, some forms of gender inequality still exist, perhaps the question of whether women can achieve parity with men in negative affect is best left to a future in which full gender equality is achieved, at least in some countries.
Overall, the consistency in results obtained by Zuckerman et al. (2016) across times and across countries with regard to gender differences in self-esteem, and those obtained in the present study across a much larger sample of countries with regard to gender differences in SWB indicates that the phenomenon addressed by the two studies is robust. The next question of interest is how to explain the results, and in this respect, the current study falls short. First, we did not have data relevant to the mediating mechanisms (e.g., social comparison, concern about gender inequality, expectations about the future of gender inequality, etc.) that Zuckerman et al. (2016) included in their three-stage model. In addition, our results concern cross-country differences, which make inferences about individuals within countries difficult. Therefore, the challenge for future research is to examine what psychological processes are triggered by changes in gender equality and how such processes are related to self-esteem and SWB. For example, future research might address the following questions: What might initially change in women who enter the workforce or enroll in higher education or become involved in politics? And what might change if they are successful (or not) in these career choices? And how such changes relate to women’s self-esteem and SWB?
Our results appear (to us) somewhat surprising, in that they do not follow what common sense would have predicted. They also give rise to some additional interesting questions that are left to future research.
Footnotes
Acknowledgements
The authors thank the following research assistants for their help in collecting, coding, and checking the data: Aleksander Dombrowski, Sarah D. Kamenecka, Sarah Vogel, and Keer Wu.
Declaration of Conflicting Interests
The author(s) declared no potential conflicts of interest with respect to the research, authorship, and/or publication of this article.
Funding
The author(s) received no financial support for the research, authorship, and/or publication of this article.
Supplemental Material
The supplemental material is available with the online version of the article.
Notes
References
Supplementary Material
Please find the following supplemental material available below.
For Open Access articles published under a Creative Commons License, all supplemental material carries the same license as the article it is associated with.
For non-Open Access articles published, all supplemental material carries a non-exclusive license, and permission requests for re-use of supplemental material or any part of supplemental material shall be sent directly to the copyright owner as specified in the copyright notice associated with the article.