
Abstract
Traditionally, studies of intergroup contact have primarily relied on self-reports, which constitute a valid method for studying intergroup contact, but has limitations, especially if researchers are interested in negative or extended contact. In three studies, we apply social network analyses to generate alternative contact parameters. Studies 1 and 2 examine self-reported and network-based parameters of positive and negative contact using cross-sectional datasets (N = 291, N = 258), indicating that both methods help explain intergroup relations. Study 3 examines positive and negative direct and extended contact using the previously validated network-based contact parameters in a large-scale, international, and longitudinal dataset (N = 12,988), demonstrating that positive and negative direct and extended contact all uniquely predict intergroup relations (i.e., intergroup attitudes and future outgroup contact). Findings highlight the value of social network analysis for examining the full complexity of contact including positive and negative forms of direct and extended contact.
Academics, policy-makers, and practitioners interested in reducing prejudice, segregation, and intergroup conflict traditionally follow the seminal contact hypothesis (Allport, 1954), which postulates that intergroup contact improves intergroup relations. The last six decades have produced compelling evidence that supports this hypothesis across different countries, settings, ingroup–outgroup constellations, research methods, and age groups (Pettigrew & Tropp, 2006), suggesting that intergroup contact is an effective means for successfully improving relations between different or even conflictual groups. Until very recently, however, this line of research tended to overlook the fact that people’s experiences with the outgroup can include instances of both positive and negative intergroup contact. That is, the social reality within the schools, workplaces, neighborhoods, and communities of increasingly diverse societies holds the potential not only for friendships, closeness, or cooperation but also for bullying, hostility, or conflict between members of different groups. This fact is in line with some research suggesting that diversity can—contrary to the contact hypothesis—be associated with a worsening of intergroup relations (van de Meer & Tolsma, 2014). We believe that the joint consideration of positive and negative contact will advance our understanding regarding the psychological processes associated with ethnocultural diversity and, therewith, help improve our explanation of why intergroup relations fluctuate within diverse settings.
Given the understandable research focus on prejudice reduction, contact researchers have sought and gained a detailed understanding of different forms of positive contact, and have relatively recently complemented work on direct, face-to-face contact with the concept of extended contact (Wright, Aron, McLaughlin-Volpe, & Ropp, 1997), which describes the amount of outgroup contact that someone’s ingroup friends have. Extended contact has also been found to improve intergroup relations (Turner, Hewstone, Voci, & Vonofakou, 2008; Vezzali, Hewstone, Capozza, Giovannini, & Wölfer, 2014) and can play an important role as an effective alternative if direct contact opportunities are not available (Dovidio, Eller, & Hewstone, 2011) or as a developmental platform for the formation of direct contact by gradually preparing members of opposing groups for future direct contact with each other (Wölfer et al., under review; Wölfer, Schmid, Hewstone, & van Zalk, 2016). Notwithstanding the research progress, there is sparse evidence concerning the effects of extended negative contact (for an exception, see Mazziotta, Rohmann, Wright, de Tezanos-Pinto, & Lutterbach, 2015). At present, contact researchers know little about the frequency and impact of negative extended contact, its effect on intergroup relations, and its relative strength in comparison to direct negative contact. The present paper aims to contribute to the literature in two ways by (a) moving beyond the traditional focus on positive contact and (b) considering direct as well as extended forms of both positive and negative contact.
The Traditional Methodological Focus in Contact Research
Previous studies primarily relied on self-reports to assess intergroup contact (81% of the studies included in Pettigrew & Tropp’s, 2006, meta-analysis used this approach), which is an established and valid method in social psychology, but only one approach with specific strengths and limitations. While its strengths include cost and ease of data collection, we recognize three main shortcomings of survey data for the study of intergroup contact.
First, self-reports are subjective and unidirectional. This is not necessarily a disadvantage, when researchers are interested in individual behavior. For example, when studying depressive symptoms or loneliness, the subjective perspective is the most important information, because if individuals report being depressed or lonely, it is a matter of concern, independently of whether this represents the objective “reality.” However, the study of inherently dynamic behaviors at both dyadic and group levels, such as intergroup contact and intergroup relations, benefits from more objective and bidirectional information. Second, the wording of questions assessing self-reports of contact emphasizes group membership. Using an item such as, “How much contact do you have with the outgroup?” explicitly highlights the difference between the ingroup and outgroup. As a consequence, it is likely that participants have a tendency to give socially desirable responses and present themselves as more favorable, tolerant, and open-minded by reporting higher levels of positive and lower levels of negative contact toward the outgroup. Third, self-reports make it difficult to study indirect outgroup contact. While indirect forms of intergroup contact, such as extended contact, have been found to improve intergroup relations beyond direct contact (Vezzali et al., 2014), it is challenging for participants to accurately quantify the extent of their ingroup friends’ positive or negative outgroup contact using traditional survey items, especially in childhood and adolescence—a period in which social-cognitive skills are still developing but are, at the same time, particularly relevant for the development of intergroup relations (Wölfer et al., 2016).
Previous work has just started to simultaneously study positive and negative contact, while findings consistently demonstrate that positive contact improves and negative contact worsens intergroup relations (Barlow et al., 2012; Bekhuis, Ruiter, & Coenders, 2013; Graf, Paolini, & Rubin, 2014; Mazziotta et al., 2015; Pettigrew, 2008; Wilder, 1984). This line of research is promising and important but is based exclusively on self-reports, which is problematic due to the limitations outlined above, that restrict the study of intergroup contact, especially of negative and extended contact. Thus, we believe that the field will benefit from additional methods that help overcome some limitations of self-reports, allowing researchers to better study new types of intergroup contact and gain a better understanding of the full complexity of intergroup contact by triangulating different approaches with different strengths and limitations.
Intergroup Contact Within Social Networks
We believe that social network analysis (SNA) represents a theoretical and empirical approach that advances the assessment of positive and negative direct and extended contact. In general, SNA structures relationships between network members and analyzes the extent to which this structure explains something about the network members (Borgatti, Mehra, Brass, & Labianca, 2009). A typical social network study uses a conventional questionnaire that assesses, in addition to other relevant study variables, all participants’ nominations of other network members with regard to the association of interest (e.g., friendship) to elicit a complete social network. If researchers are interested in larger or boundary-free networks, such as a whole community, it is also possible to use a snowball-sampling procedure by asking participants to provide the contact details of their nominated friends, so that researchers can approach participants’ friends to assess their friends as well (e.g., Wölfer et al., 2016; Study 2). However, SNA data of smaller or larger networks can also be assessed with observational studies, interviews, archival data, modern communication media, or any method that allows assessment of some kind of interconnections. Today, SNA has reached a level of conceptual and analytic refinement that makes it a valid tool for social scientists, as it facilitates the study of naturally existing social structures that affect human behavior. Beyond its wide range of uses and its refinement, SNA is of particular value for the field of intergroup contact in that it helps address the main limitations of self-reports (for a general introduction of SNA to contact research, see Wölfer, Faber, & Hewstone, 2015; Wölfer & Hewstone, in press).
First, SNA allows researchers to analyze the reciprocity of friendship relations. Using self-reports, it is easy for participants to claim that they are friends with outgroup members, but only with SNA can researchers cross-check whether the nominated outgroup member reciprocates the received friendship nomination or not. We contend that the possibility to distinguish between unidirectional and reciprocal ties in social networks is of specific value for studying positive relations that tend to be symmetric (i.e., behaving as a friend to someone implies that this person is likely to behave as a friend as well), while negative relations are not necessarily symmetric (i.e., discriminating against someone does not imply being discriminated against by the same person).
Second, SNA puts less emphasis on the group membership of others who are nominated or not and is, therefore, likely to minimize response tendencies. Networks can be structured using positive ties such as friendship patterns as well as negative ties such as patterns of disliking (Huitsing et al., 2012). These network ties are assessed without referring to group memberships or intergroup relations; for example, by using a nomination technique that assesses participants’ “five best friends,” the task instructions do not refer to ethnicity and, thus, reduce the risk of socially desirable responses. After the data collection, a positive or negative network can be elicited including other information about the network members such as their ethnicity (which each respondent provides as separate demographic information), which then enables researchers to determine precisely positive and negative intra- and intergroup relationships.
Third, SNA allows the study of direct and indirect links within the entire social network. This methodological feature helps, in particular, to assess extended contact as participants are likely to have difficulty in accurately reporting the outgroup contact of their ingroup friends. That is, we believe that participants are (at least implicitly) aware of and influenced by their indirect friends, but it is unlikely that they have the ability to accurately recall their specific number of indirect friends when responding to a questionnaire item. Capitalizing on the advantages of SNA, researchers can decompose the measurement of extended contact into two separate analytic steps: (a) the identification of individuals’ reciprocal ingroup friends and (b) the assessment of these friends’ intergroup contact. In smaller positive networks, it is helpful to measure both analytic steps with a combination of network data (step a) and self-reports (step b) in order to reduce the problematic overlap between direct and extended contact that is produced by transitivity (Wölfer et al., 2016). In contrast, literature indicates that negative networks are characterized by a lower density (i.e., number of existing ties divided by the number of theoretical possible ties) and lower clustering tendency (i.e., groups of network members who have a higher than random probability of being connected), which decreases the overlap problem between negative direct and negative extended contact and makes the exclusive use of network data more applicable (Everett & Borgatti, 2014).
To clarify, we do not wish to argue that network measures are better (or worse) than self-reports. In fact, SNA has, as do self-reports and all other methods, its particular limitations, as we acknowledge later in the discussion. Our intention is, rather, to advance both the theoretical and methodological debate regarding different forms of contact measures by including an additional analytic perspective that can enrich the well-established traditional measures in this field.
Research Objectives
The goal of the present paper is to consider a broad perspective on intergroup contact by simultaneously analyzing positive and negative forms of direct and extended contact. To this end, we assess intergroup contact with traditional self-reports as well as innovative social network measures across three studies. In two preparatory studies (Studies 1 and 2), we explore the effects of self-reported and network-based measures of positive and negative direct contact on intergroup attitudes using cross-sectional datasets from Northern Ireland and England, respectively. In the following main study (Study 3), we then examine the effects of self-reported and network-based measures of positive and negative direct and extended contact on intergroup attitudes and future outgroup contact by using a large-scale, international, and longitudinal dataset. In all studies, we tested, across different methodological approaches, whether positive forms of contact positively predict intergroup relations and negative forms of contact negatively predict intergroup relations.
Study 1
Data from Study 1 were collected in Northern Ireland, which endured sectarian conflict between Protestants and Catholics (the so-called “Troubles”) from 1969 to 1998. Today, more than 50% of people living in Northern Ireland know someone who has been injured or killed during this conflict (Turner, Tam, Hewstone, Kenworthy, & Cairns, 2013). The joint consideration and comprehensive analysis of positive and negative contact in such settings is likely to advance our understanding of intergroup conflict and its prevention.
Method
Sample
Participants were part of a study that evaluated a “Shared Education Programme,” which is an ongoing contact intervention, whereby Protestant and Catholic students from separate schools engage in intergroup contact by means of educational activities. All presented data rely on the first wave given that later waves confound developmental and intervention effects. A total of 291 students participated, including 67 Protestants (23%), 145 Catholics (50%), and 79 others (27%), who were nested in four different schools with varying degrees of diversity (i.e., 7%, 50%, 76%, and 98% outgroup proportion for the numerically largest group of Catholics). To analyze intergroup contact, we focused on Protestant and Catholic students (n = 212), and excluded students who provided no or nonclassifiable information about their group membership. Completed data were available from 61% of respondents, who differed marginally from individuals with missing data (n = 83) regarding gender (d = .11), community background (d = .06), age (d = .16), or outgroup attitudes (d = .02), indicating that slightly more male, Protestant, younger, and less tolerant students participated. Thus, attrition can be considered unsystematic. The final analytic sample comprises 129 students (MAGE = 16.83 years, 60% girls) including 67% Catholics.
Measures
Data were collected in the regular school setting in June 2014. Supervised by trained test administrators, participants answered standardized questionnaires that assessed intergroup relations, from which we analyzed the measures described below.
Intergroup attitudes
Participants evaluated the outgroup on the feeling thermometer, which runs from 0 to 100 degrees with “warmer” scores indicating more favorable attitudes. For Protestants, the outgroup represents Catholics, and vice versa.
Intergroup contact
We measured positive and negative direct contact by using self-reports as well as social network data in order to test contact effects across different methods.
Positive direct contact
For the assessment with self-reports, participants reported the frequency of positive contact experiences (“How often are your experiences with OUTGROUP children positive?”; from 1 = never to 5 = very often). 1 For the assessment with social network data, we elicited friendship networks based on a peer nomination procedure that asked each student to nominate up to 10 network members in response to “Who are your best friends?” (see left side of Figure 1). 2 Based on students’ community background, we determined reciprocal outgroup connections between Protestants and Catholics (e.g., between #4 and #7). The sum of reciprocal outgroup friends represents the network-based predictor for positive direct contact.
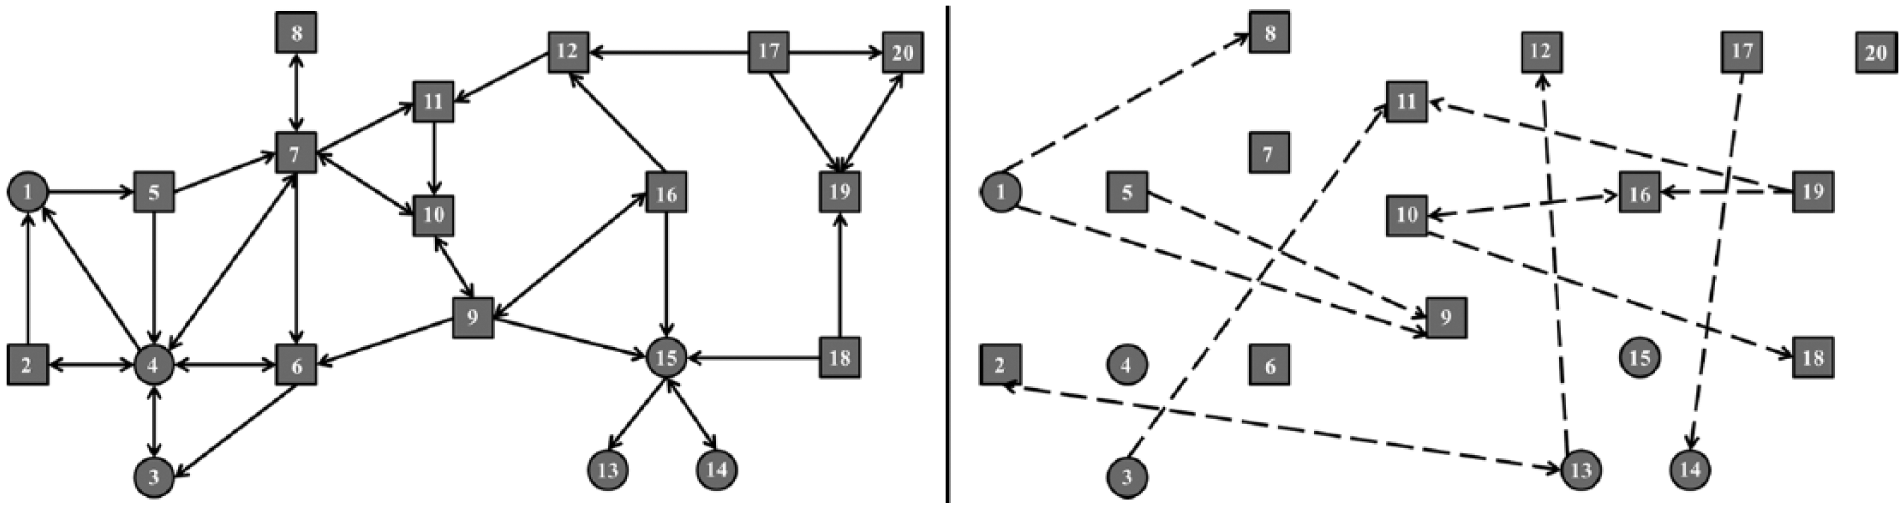
Sample networks of the same setting structured by positive relationships (full lines in the left network) and negative relationships (dashed lines in the right network); squares represent Catholics students and circles represent Protestant students; arrows indicate the nominated friend (left) or aggressor (right).
Negative direct contact
For the assessment with self-reports, participants reported the frequency of negative contact experiences (“How often are your experiences with OUTGROUP children negative?” from 1 = never to 5 = very often). For the assessment with social network data, we elicited negative networks by considering up to 10 peer nominations of each student in response to “Who do you least often spend time with?” (see right side of Figure 1). Based on students’ community background, we subsequently determined the negative direct contact of Catholics toward Protestants (e.g., from #17 to #14) and vice versa (e.g., from #1 to #8). The sum of negative links to outgroup members represents students’ amount of negative direct contact.
Control variables
We analyzed contact effects while controlling for relevant sociodemographics (i.e., sex and age) and the number of ingroup friends, which—due to time and cognitive limits—affects the inversely related opportunity for intergroup contact.
Statistical analyses
Data were analyzed in two steps. First, we examined the frequency of positive and negative contact using self-reported and network-based parameters. Second, we tested the effects of positive and negative contact measures using linear regression models that predicted intergroup attitudes, while controlling for sex, age, and number of ingroup friends.
Results and Discussion
Frequency of positive and negative contact
While friendship networks were based on 1,817 nominations (per student: M = 6.24, SD = 3.11) forming a total of 1,229 reciprocal friendship relationships (per student: M = 4.22, SD = 2.40), negative networks were based on 1,028 nominations (per student: M = 3.53, SD = 3.88), demonstrating that friendship networks were denser than negative networks, t(290) = 2.90, p < .01, d = 0.21.
Table 1 reports the descriptives and intercorrelations of positive and negative direct contact, separately for Protestants and Catholics. Findings reveal that positive contact was more frequent than negative contact when using self-reports—Protestants: t(59) = 6.38, p < .001, d = 1.38; Catholics: t(120) = 14.60, p < .001, d = 1.94—while participants had more negative than positive outgroup connections when using network data—Protestants: t(66) = 3.46, p < .01, d = 0.64; Catholics: t(144) = 2.70, p < .01, d = 0.32. Moreover, intercorrelations between positive and negative self-reported and network-based contact parameters were low to moderately high, indicating that the addition of network data to conventional self-reports of contact added a unique perspective to the study of intergroup contact.
Descriptives of Direct Contact Measures (Study 1).
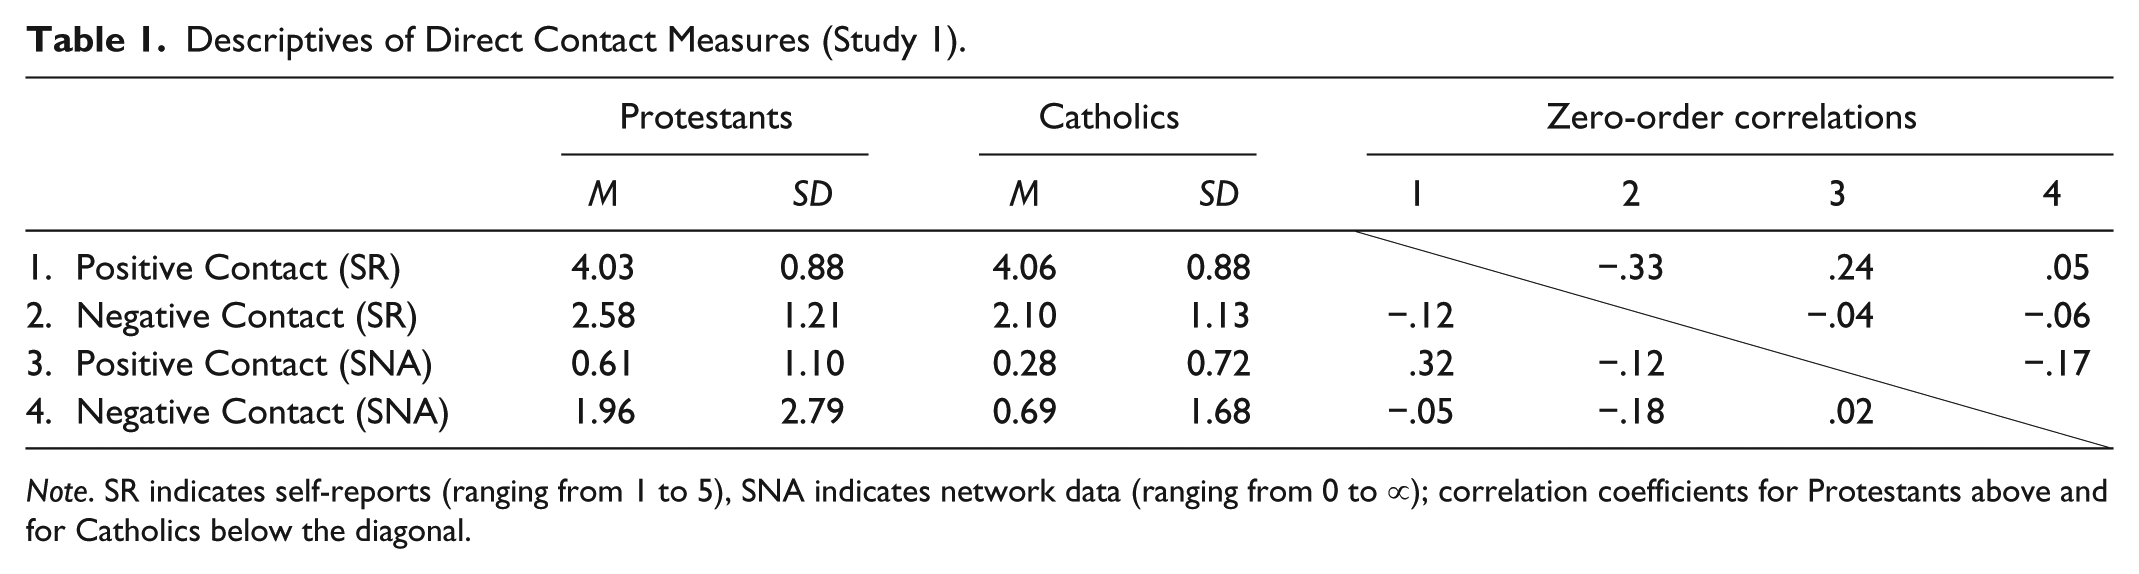
Note. SR indicates self-reports (ranging from 1 to 5), SNA indicates network data (ranging from 0 to ∝); correlation coefficients for Protestants above and for Catholics below the diagonal.
Effects of positive and negative contact
To examine the effects of intergroup contact, we had to focus on Catholics (n = 87) because the small sample size of Protestants (n = 42) did not provide us with the necessary analytic power to model all predictors. Table 2 reports a series of two regression models that predicted students’ intergroup attitudes: Model A shows the effects of self-reported positive and negative contact, while Model B shows the effects of network-based positive and negative contact.
Prediction of Students’ Intergroup Attitudes (Study 1).
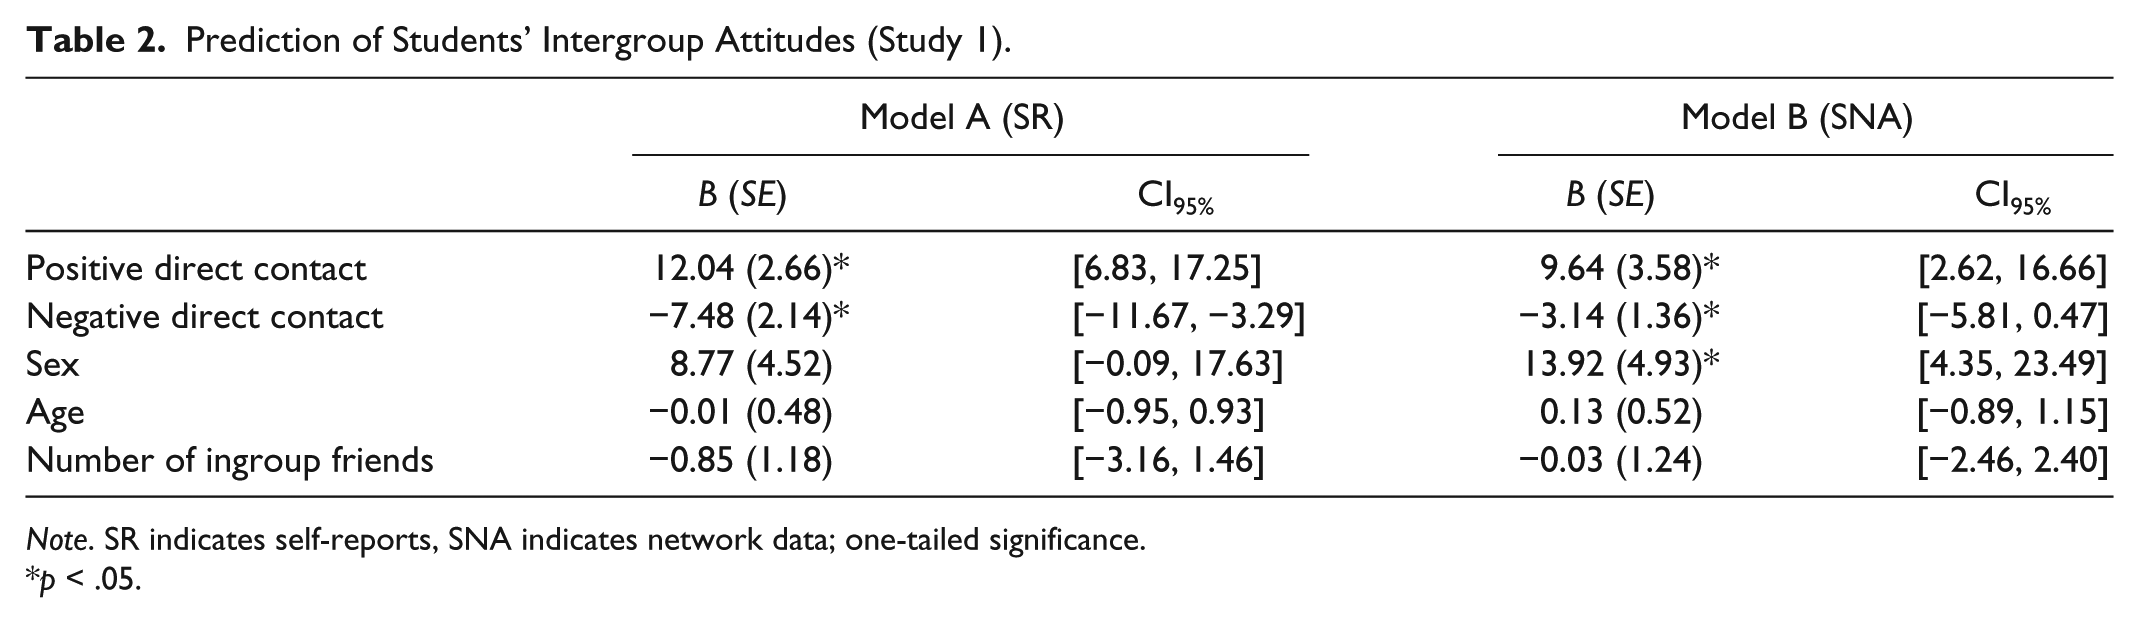
Note. SR indicates self-reports, SNA indicates network data; one-tailed significance.
p < .05.
Models A and B revealed the expected contact effects, with positive contact being positively, and negative contact being negatively, associated with intergroup attitudes. The effect of positive and negative contact was equally strong in Model A, t(170) = 1.34, p > .05, but positive contact was significantly stronger than negative contact in Model B, t(170) = 1.70, p < .05. Moreover, comparing the different contact measures also indicates that the effect of negative contact was weaker when using network data compared with self-reports, t(170) = 1.71, p < .05.
Study 2
Study 1 provided initial support for the hypothesis that self-reports and network data both predict intergroup relations. However, a notable limitation is that the negative network ties measured only a proxy of negative contact when asking participants to list the network members that they “least often spend time with.” Hence, we sought to replicate the revealed findings of Study 1 by using a different negative nomination technique in Study 2.
Data from Study 2 were collected in Oldham, Greater Manchester, a small town located in the North of England with a substantial proportion of Asian, predominantly Muslim, residents (18%, according to the Office for National Statistics, 2011). This high diversity is reflected in the participating school, which was created by an ethnic merger of two ethnically segregated schools (one almost exclusively White British, the other almost exclusively Asian British) to form a new, ethnically mixed school (45% Whites, 48% Asians). The merger took place in 2012, so that the vast majority of participating students would have been in their third year at the school.
Method
Sample
Participants were part of a cross-sectional survey of all Year 10 students (N = 258), from which we excluded 44 participants who did not provide identifying information and 18 participants who were of different nationalities (e.g., Romanian, Portuguese). Of the remaining participants, completed data were available from 80%, while missing data analyses revealed that systematically more female (d = .40) and White (d = .36) students participated. The final analytic sample comprised 156 students, aged between 14 and 15 years, including 52% Asian and 50% female students.
Measures
Data were collected in the regular school setting in January 2016. Supervised by informed teachers, participants answered standardized questionnaires that assessed intergroup relations, from which we analyzed the measures described below.
Intergroup attitudes
As in Study 1, participants evaluated the outgroup on the feeling thermometer (Asian British students and White British students, respectively, were the target groups for White British and Asian British students).
Intergroup contact
As in Study 1, we measured positive and negative direct contact by using self-reports and network data in order to test contact effects across different methods.
Positive direct contact
For the assessment with self-reports, participants reported the frequency of positive contact experiences (“On average, how frequently do you have positive contact with OUTGROUP people?” from 1 = never to 5 = all the time; see Note 1). For the assessment with social network data, we used a peer nomination procedure (up to 10 schoolmates with whom they were “most friendly”) in order to determine each participant’s number of reciprocal outgroup connections.
Negative direct contact
For the assessment with self-reports, participants reported the frequency of negative contact experiences (“On average how frequently do you have negative contact with OUTGROUP people?” from 1 = never to 5 = all the time). For the assessment with social network data, we used a peer nomination procedure (up to 10 schoolmates with whom they were “least friendly”) in order to determine the number of negative links to outgroup members.
Control variables
We analyzed contact effects while controlling for relevant sociodemographics (i.e., sex) and the number of ingroup friends.
Statistical analyses
Data were analyzed in two steps. First, we examined the frequency of positive and negative contact using self-reported and network-based parameters. Second, we tested the effects of positive and negative direct contact measures using linear regression models that predicted intergroup attitudes, while controlling for sex and the number of ingroup friends.
Results and Discussion
Frequency of positive and negative contact
While friendship networks were based on 1,276 nominations (per student: M = 8.12, SD = 2.43) forming a total of 666 reciprocal friendship relationships (per student: M = 4.26, SD = 2.34), negative networks were based on 552 nominations (per student: M = 3.54, SD = 3.36), which replicates Study 1 in that friendship networks were denser than negative networks, t(155) = 2.57, p < .05, d = 0.25.
Table 3 reports the descriptives and intercorrelations of positive and negative direct contact, separately for White British and Asian British students. These descriptives reveal, similar to Study 1, that positive contact tended to be more frequent than negative contact when using self-reports—Whites: t(74) = 1.00, p > .05, d = 0.19; Asians: t(80) = 12.50, p < .001, d = 2.22—while participants had more negative than positive outgroup connections when using network data—Whites: t(74) = 2.68, p < .05, d = 0.43; Asians: t(80) = 3.03, p < .01, d = 0.43. Moreover, as in Study 1, intercorrelations between positive and negative self-reported and network-based contact parameters were low to moderately high, indicating once again that network data tap a different facet of intergroup contact.
Descriptives of Direct Contact Measures (Study 2).
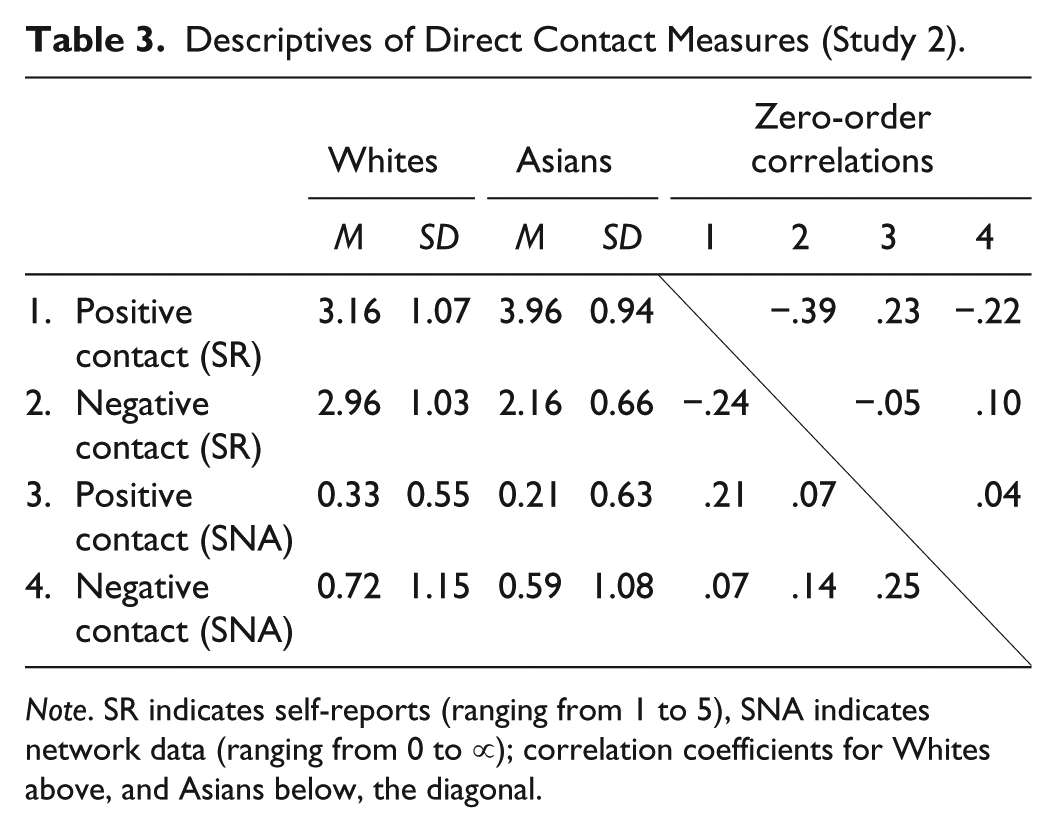
Note. SR indicates self-reports (ranging from 1 to 5), SNA indicates network data (ranging from 0 to ∝); correlation coefficients for Whites above, and Asians below, the diagonal.
Effects of positive and negative contact
Table 4 reports results of a series of two regression models that predicted students’ intergroup attitudes, separately for Whites and Asians: Model A shows the effects of self-reported positive and negative contact, while Model B shows the effects of network-based positive and negative contact.
Prediction of Intergroup Attitudes (Study 2).
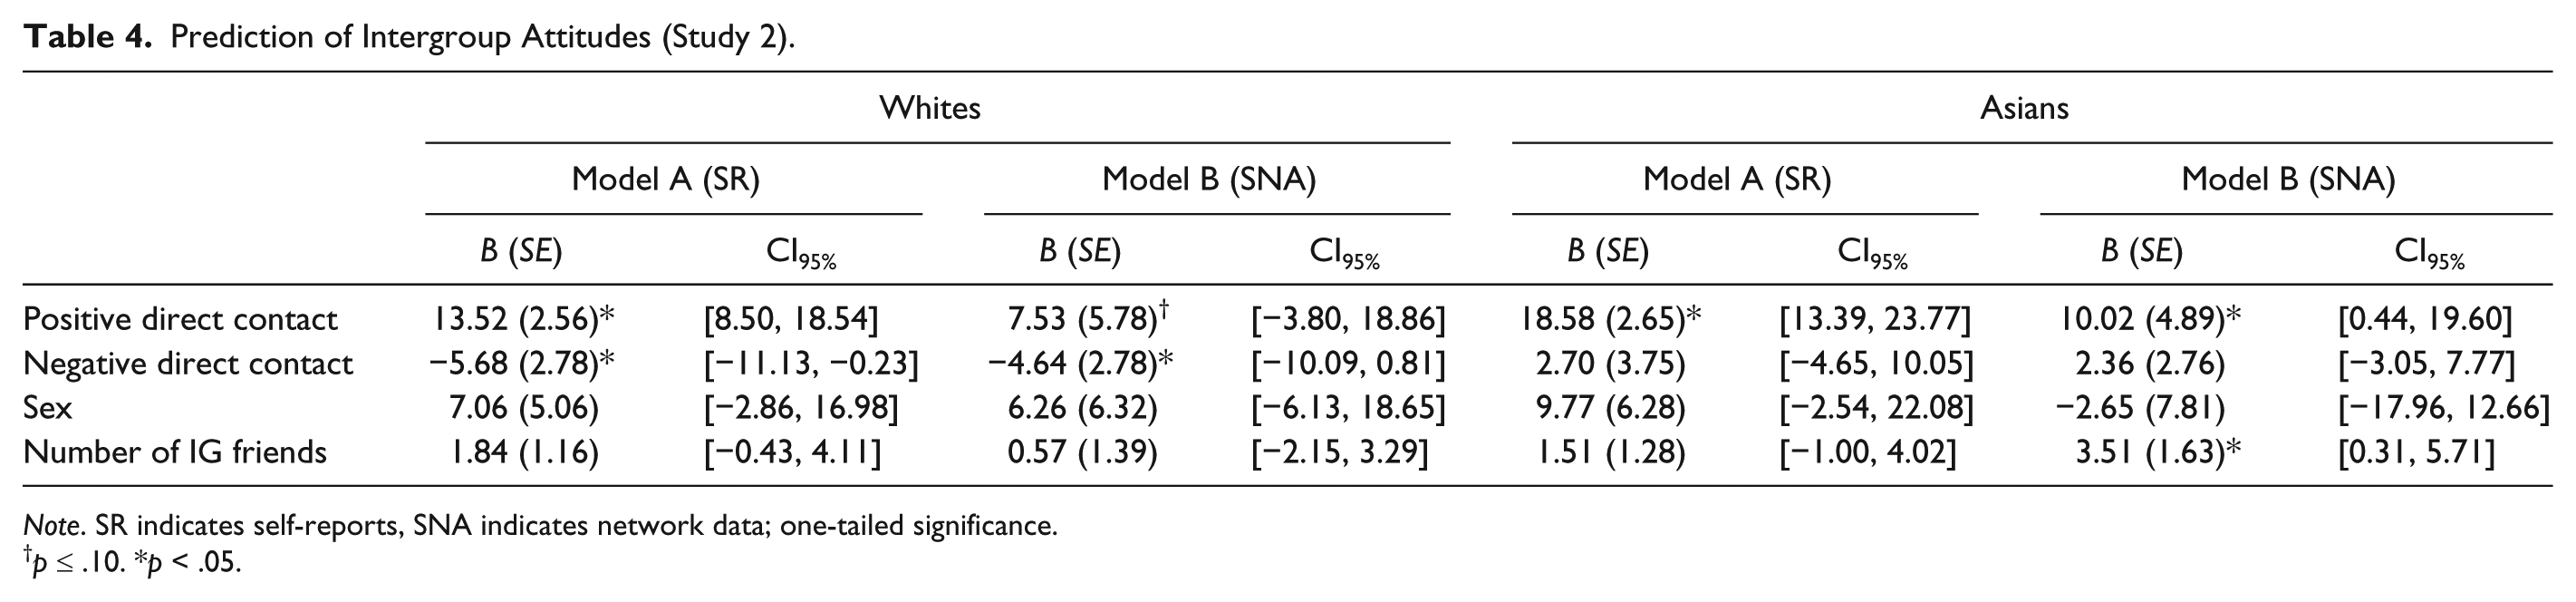
Note. SR indicates self-reports, SNA indicates network data; one-tailed significance.
p ≤ .10. *p < .05.
For Whites, both Models reveal the expected effects, with positive contact being positively related, and negative contact being negatively related, to intergroup attitudes. The effect of positive contact was significantly stronger than that of negative contact in Model A, t(146) = 2.07, p < .05, but equally strong in Model B, t(146) = 0.45, p > .05. Comparing the strength of negative contact across both models revealed that negative contact was equally powerful when using self-reports or SNA, t(146) = 0.26, p > .05. For Asians, both Models revealed the expected effect for positive contact only. Negative contact, in contrast, was not related to intergroup attitudes, neither when measured with self-reports nor with network data.
Study 3
Studies 1 and 2 provided initial evidence for the potential of SNA, given that self-reports and network data largely revealed the expected effects with intergroup attitudes. Both studies are, however, characterized by central limitations, such as (a) the small sample size within a specific setting, (b) the focus on direct forms of positive and negative contact, and (c) the cross-sectional design. Therefore, in Study 3, we use a large-scale, longitudinal dataset of more than 10,000 students from three European countries. This unique dataset allows us to replicate the previous findings in a large sample including multiple diverse social networks. Moreover, the large sample size provides us with the analytic power to explore a broader perspective on intergroup contact and investigate extended forms of positive and negative contact using SNA. Finally, the longitudinal design of this dataset helps us gain a better understanding of the long-term effects of different types of contact for future intergroup relations, which is especially informative in the case of negative forms of contact where longitudinal evidence is missing from the extant literature.
Method
Sample
Participants were part of the “Children of Immigrants Longitudinal Survey in Four European Countries” (CILS4EU; Kalter et al.,2014, 2015). The presented data in this study include the first and second waves of this ongoing international collaboration between England, Germany, the Netherlands, and Sweden. At Wave 1, the target group of 14-year-old students was recruited and followed-up approximately 1 year later. A school-based sample selection design was applied that systematically oversampled ethnically diverse schools with a high proportion of immigrant minority groups. The participation rate was high for schools (84%) and students (85% within participating schools). From the four initial countries, England had, however, to be excluded for the current analyses due to a technical problem during the assessment of the social network data. In the remaining three countries, classes with fewer than 15 students (11%) were excluded in order to conduct meaningful analyses in sufficiently large networks.
These exclusion criteria left a total of 12,988 students from 616 ethnically mixed school classes with differing proportions of majority group members (i.e., participants who were born and have parents who were born in the survey country) and immigrant minority group members (i.e., participants who were born or have at least one parent who was born in a different country). At Wave 1, completed data were available from 84% of the sample, who differed marginally from students with missing data regarding gender (d = .06) and age (d = .11), and at Waves 1 and 2, completed data were available from 73%, who similarly differed marginally from students with missing data regarding gender (d = .02) and age (d = .09); in both cases, slightly more girls and older students provided completed data. Thus, attrition can be considered unsystematic. The final cross-sectional sample from Wave 1 comprised 10,922 students (MAGE = 14.97 years; 51% girls) including 4,465 immigrant minority students, and the final longitudinal sample from Waves 1 and 2 comprised 9,456 students (MAGE = 15.98 years; 51% girls) including 3,527 immigrant minority students (mainly from Turkey, Morocco, and Iraq).
Measures
Data of both waves were collected in the regular school setting by the middle of the school years 2010/2011 and 2011/2012, respectively. With the help of trained test administrators, participants answered standardized questionnaires that primarily assessed migration-specific characteristics, core dimensions of integration, and social network data, from which we analyzed the measures described below.
Intergroup attitudes
As in Studies 1 and 2, participants evaluated the outgroup on the feeling thermometer. Majority students reported their intergroup attitudes toward the largest immigrant minority groups within each respective country, while minority students reported their intergroup attitudes toward the country-specific majority group. 3
Intergroup contact
We measured intergroup contact by using self-reports as well as social network data. In contrast to Studies 1 and 2, we had no information regarding participants’ self-reported negative contact. Thus, for positive contact, we used self-reports and social network data, whereas for negative contact, we focused on social network data only.
Positive direct contact
For the assessment with self-reports, participants reported how many outgroup friends they had at each wave (“Thinking now about all of your friends. How many of them have a [OUTGROUP] background?” from 1 = none or very few to 5 = almost all or all; see Note 1). Majority students reported their outgroup contact with the main country-specific minority groups, while minority students reported their outgroup contact with the country-specific majority group. 4 The Wave 1 score served as a predictor (positive direct contact), whereas the Wave 2 score served as the main outcome variable (future positive contact) for testing longitudinal contact effects. For the assessment with social network data, we used a peer nomination procedure (up to five classmates in response to “Who are your best friends in class?”) in order to assess each participant’s number of reciprocal outgroup friends.
Negative direct contact
We determined this contact type by using a peer nomination procedure (up to five classmates in response to “Who is sometimes mean to you?”) to assess the number of negative links to outgroup members.
Positive extended contact
We determined this type of contact with a combination of self-reports and SNA, and with SNA alone. The combined assessment using self-reports and social network data aims to avoid the problematic overlap between direct and extended contact that is produced by transitivity (i.e., friends of my friends are my friends), especially in smaller positive networks. For this measure, we applied a two-step procedure. First, we elicited friendship networks based on the same peer nomination procedure described above and determined each student’s reciprocal ingroup friends. Second, we averaged the self-reported positive direct contact that these identified ingroup friends reported having in order to look beyond the small boundary of class networks and assess participants’ general intergroup contact (see Wölfer et al., 2016). To empirically demonstrate the transitivity problem in small networks, we also assessed extended contact with social network data only (cf., Munniksma, Stark, Verkuyten, Flache, & Veenstra, 2013) by identifying students’ reciprocal ingroup friends and, in a following step, their reciprocal outgroup friends in the network. The sum of reciprocal outgroup friends of students’ reciprocal ingroup friends represents the alternative measure of positive extended contact.
Negative extended contact
We determined this type of contact with multiple social network data. Negative networks are less dense and less clustered than positive networks, which decreases the overlap problem between negative direct and negative extended contact when using network data only. To measure negative extended contact, we applied a similar two-step procedure: We first identified individuals’ reciprocal ingroup friends using friendship networks and, in a second step, determined these ingroup friends’ negative outgroup contact using negative networks. The sum of negative outgroup links of students’ reciprocal ingroup friends represents each participant’s amount of negative extended contact.
Control variables
In our main analysis, we controlled for relevant sociodemographics (i.e., sex and age) as well as variables that determine the opportunity for positive and negative types of direct and extended contact (i.e., number of ingroup friends, diversity, and class size).
Statistical analyses
We used multilevel modeling (Raudenbush & Bryk, 2002) to adequately consider the nested data structure with students on Level 1 and school classes on Level 2. Our models predicted, separately for the majority group and the minority group, (a) intergroup attitudes at Wave 1 and (b) future positive contact at Wave 2, with the help of positive and negative types of direct and extended contact, while controlling for sex, age, and number of ingroup friends on Level 1 as well as class size and diversity on Level 2. To this end, we either modeled positive direct contact based on self-reports and positive extended contact based on the combination of self-reports and network data (Model A), or we modeled positive direct and extended contact based on network data only (Model B). Across both models, negative direct and extended contact parameters were based on network data only. Continuous predictors were z-standardized in order to facilitate the interpretation of regression coefficients.
Results and Discussion
General descriptives
While friendship networks were based on 46,353 nominations (per student: M = 3.57, SD = 1.43) forming a total of 31,566 reciprocal friendship relationships (per student: M = 2.43, SD = 1.40), negative networks were based on 8,753 nominations (per student: M = 0.67, SD = 1.14), which again confirms the findings of Studies 1 and 2 in that friendship networks are denser than negative networks, t(12,987) = 108.31, p < .001, d = 1.38.
Table 5 presents the descriptives and intercorrelations of all contact measures for majority and minority students. These descriptives yield low to moderate scores for positive contact types and low scores for negative contact types. Contrasting the frequency of positive and negative contact by using the network parameters reveals moderate effect sizes for the higher occurrence of positive contact for the majority (positive direct contact vs. negative direct contact: d = 0.49; positive extended contact vs. negative extended contact: d = 0.49) and the minority (positive direct contact vs. negative direct contact: d = 0.72; positive extended contact vs. negative extended contact: d = 0.50). Moreover, comparing majority and minority students indicates that minority students tended to have more positive contact, with the exception of one measure, while both groups did not differ in terms of negative contact. That is, more contact opportunities for minority students—an inevitable result of their relative proportion and the larger outgroup size of majority students—seem to increase the quantity of positive contact experiences but not of negative contact experiences. In line with the descriptives for positive contact, we reveal similar group differences showing that minority members had more positive intergroup attitudes than majority members (MMin = 72.47, SD = 25.57; MMaj = 56.43, SD = 23.25; d = 0.66), and higher future positive contact scores at Wave 2 (MMin = 3.05, SD = 1.32; MMaj = 1.68, SD = 0.83; d = 1.32). Finally, similar to Studies 1 and 2, the intercorrelations between contact parameters were low to moderately high, indicating that the different types and methods of intergroup contact captured different aspects of intergroup relations.
Descriptives of Contact Measures (Study 3).
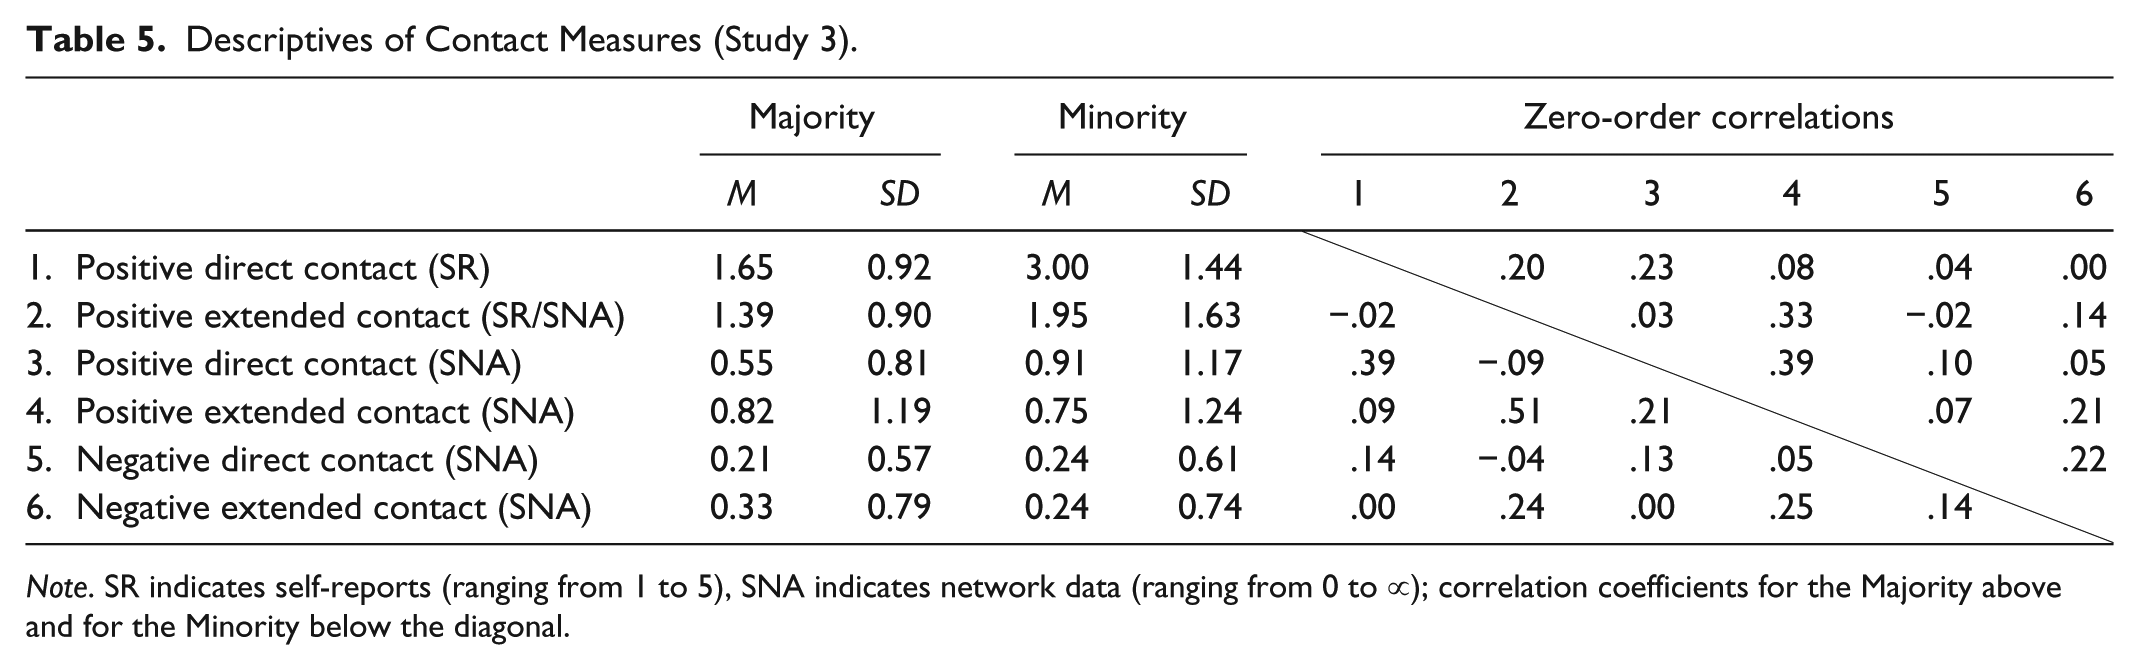
Note. SR indicates self-reports (ranging from 1 to 5), SNA indicates network data (ranging from 0 to ∝); correlation coefficients for the Majority above and for the Minority below the diagonal.
Cross-sectional associations with intergroup attitudes
To examine cross-sectional associations between different types of contact and intergroup attitudes, we ran a set of three models, separately for the majority and for the minority: (a) an Unconditional Model without any predictors; (b) Model A in which positive contact parameters were measured with self-reports or a combination of self-reports and network data, while negative contact parameters were measured with network data only; and (c) Model B in which both positive and negative contact parameters were measured with network data only. The Unconditional Model determined the variance proportion in the outcome variable across the two levels, and revealed intraclass coefficients of .13 for the majority and of .16 for the minority. This indicates that 13% and 16% of the variance in intergroup attitudes was on the contextual level for majority and minority students, respectively, which differs significantly from zero, χ2(589) = 1505, p < .001, and χ2(598) = 1501, p < .001, respectively. Table 6 summarizes, separately for the majority and the minority, the multilevel results of Model A and Model B that estimated students’ intergroup attitudes utilizing different operationalizations of positive contact.
Multilevel Prediction of Intergroup Attitudes (Study 3).
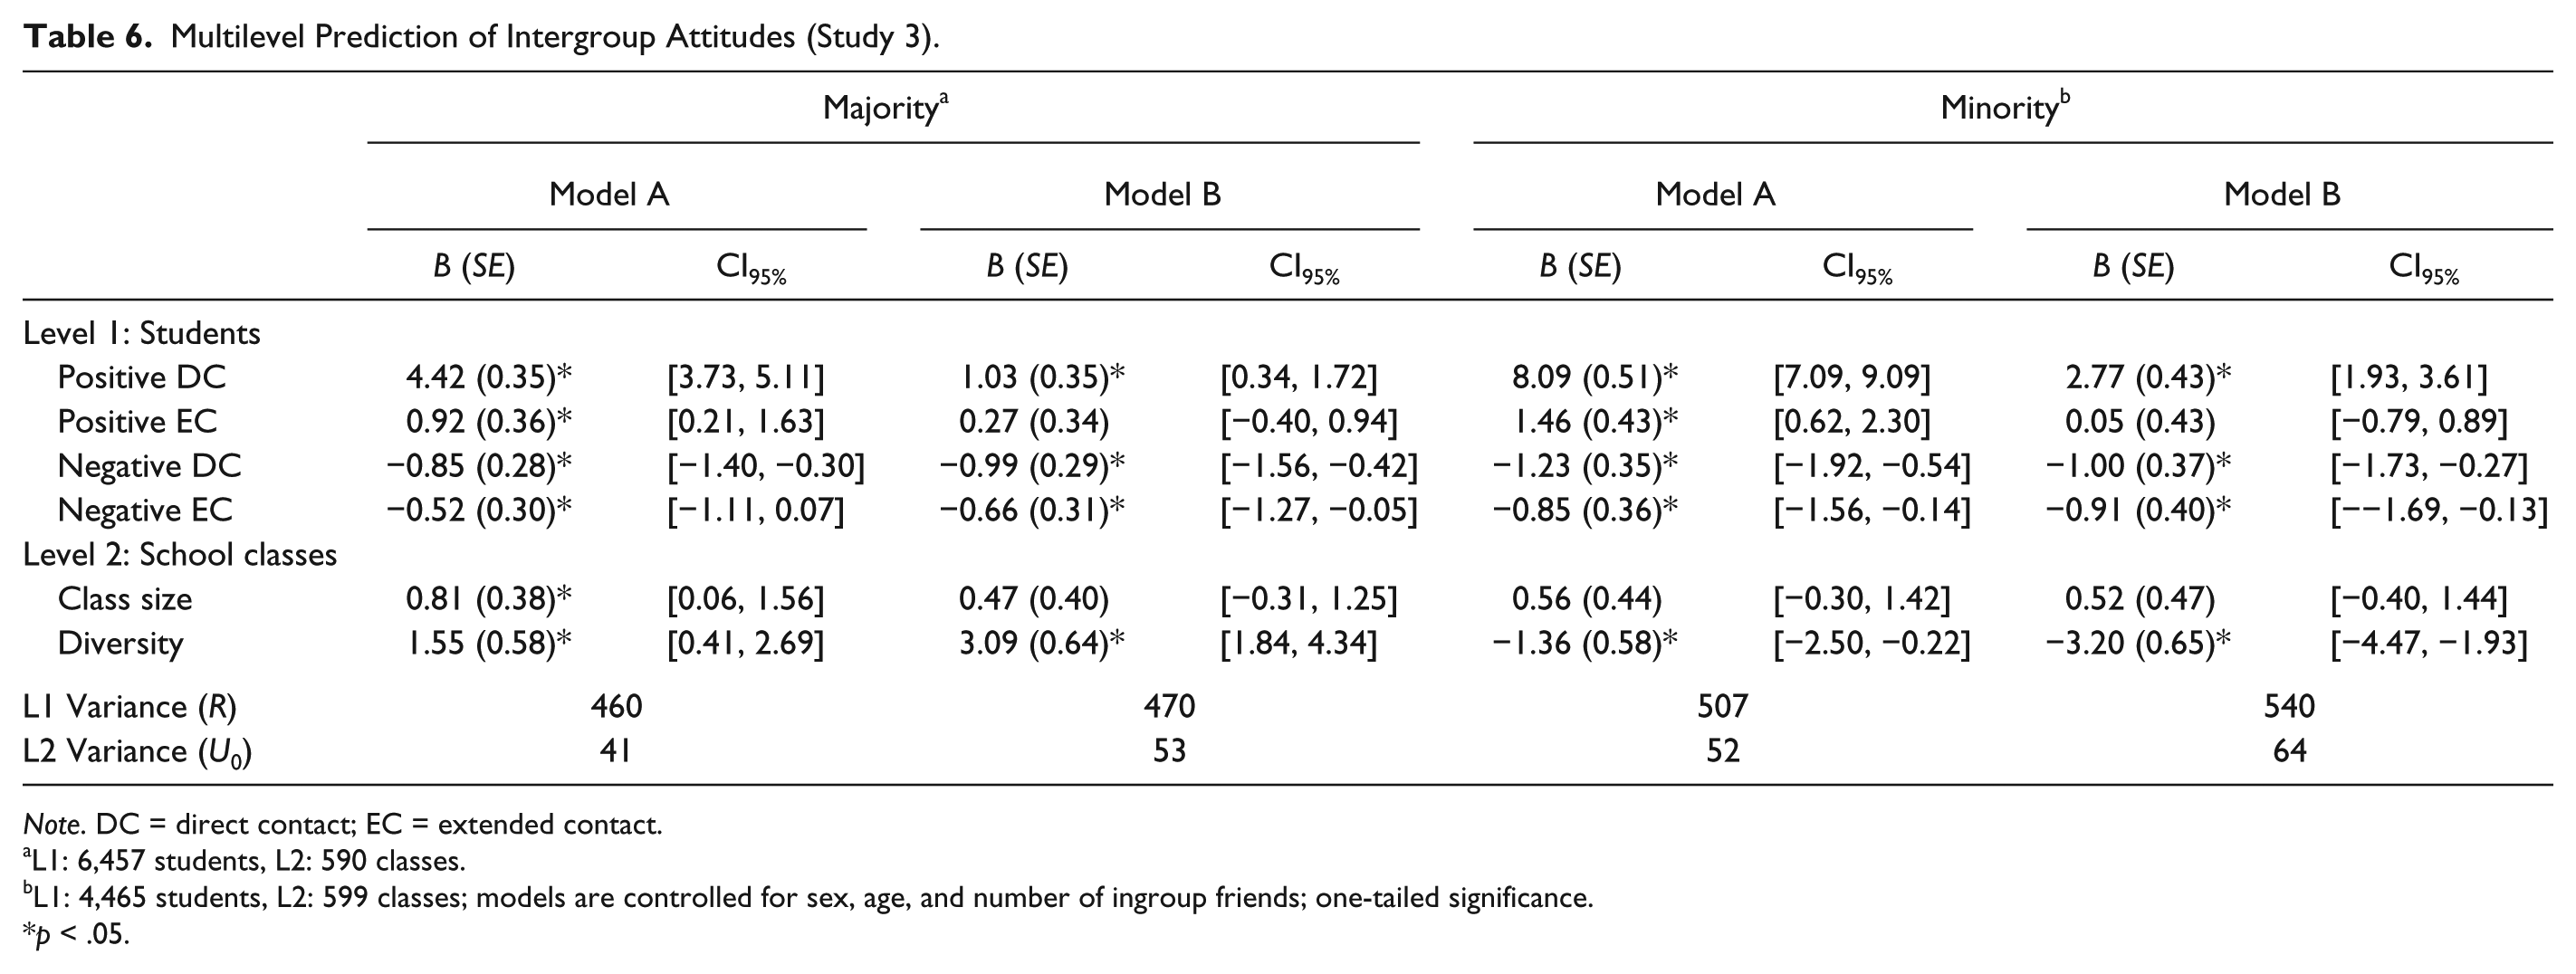
Note. DC = direct contact; EC = extended contact.
L1: 6,457 students, L2: 590 classes.
L1: 4,465 students, L2: 599 classes; models are controlled for sex, age, and number of ingroup friends; one-tailed significance.
p < .05.
Model A demonstrates the expected effects across the majority and minority groups: Positive contact types were positively associated, and negative contact types were negatively associated, with intergroup attitudes, while controlling for sex, age, number of ingroup friends, class size, and diversity. To illustrate, the size of effects indicates the difference in intergroup attitudes between two people (assessed in points on the feeling thermometer, scale = 0-100), who differ in the corresponding predictor by one standard deviation. Comparing the strength of these contact effects suggests that positive direct contact was the strongest predictor for members of both the majority and the minority group. Particularly relevant is the significant difference in the effect of positive direct contact compared with negative direct contact—majority, t(12910) = 7.96, p < .001; minority: t(8926) = 11.09, p < .001. The effects of all other contact measures do not differ significantly and can be considered equally important for predicting intergroup attitudes.
Results of Model A can be replicated with Model B, with the exception of two important differences. First, positive extended contact failed to reach the level of statistical significance in either the majority or the minority model. Second, the strength of positive direct contact decreased significantly in the majority, t(12910) = 6.85, p < .001, and in the minority, t(8926) = 7.98, p < .001. For majority students, this change equalized the effects of positive direct contact and negative direct contact, t(12910) = 0.09, p = .93, whereas for minority students, positive direct contact remained significantly stronger than negative direct contact, t(8926) = 3.12, p < .01. Interestingly, the effects of negative direct and negative extended contact did not differ significantly and remained equally important for predicting intergroup attitudes across the majority and minority group.
Longitudinal effects on future positive contact
To examine longitudinal effects of different contact types for the formation of future positive contact, we ran the same set of three models, separately for the majority and minority, using Wave 1 and Wave 2 data. The Unconditional Model revealed intraclass coefficients of .50 for the majority and .33 for the minority, indicating that 50% and 33% of the variance in future positive contact is attributable to the contextual level for majority and minority students, respectively, which differs significantly from zero, χ2(560) = 5005, p < .001, and χ2(557) = 2425, p < .001, respectively. Table 7 summarizes, separately for the majority and the minority, the multilevel results of Model A and Model B that estimated future positive contact at Wave 2 utilizing different operationalizations of positive contact.
Multilevel Prediction of Future Positive Contact at Wave 2 (Study 3).
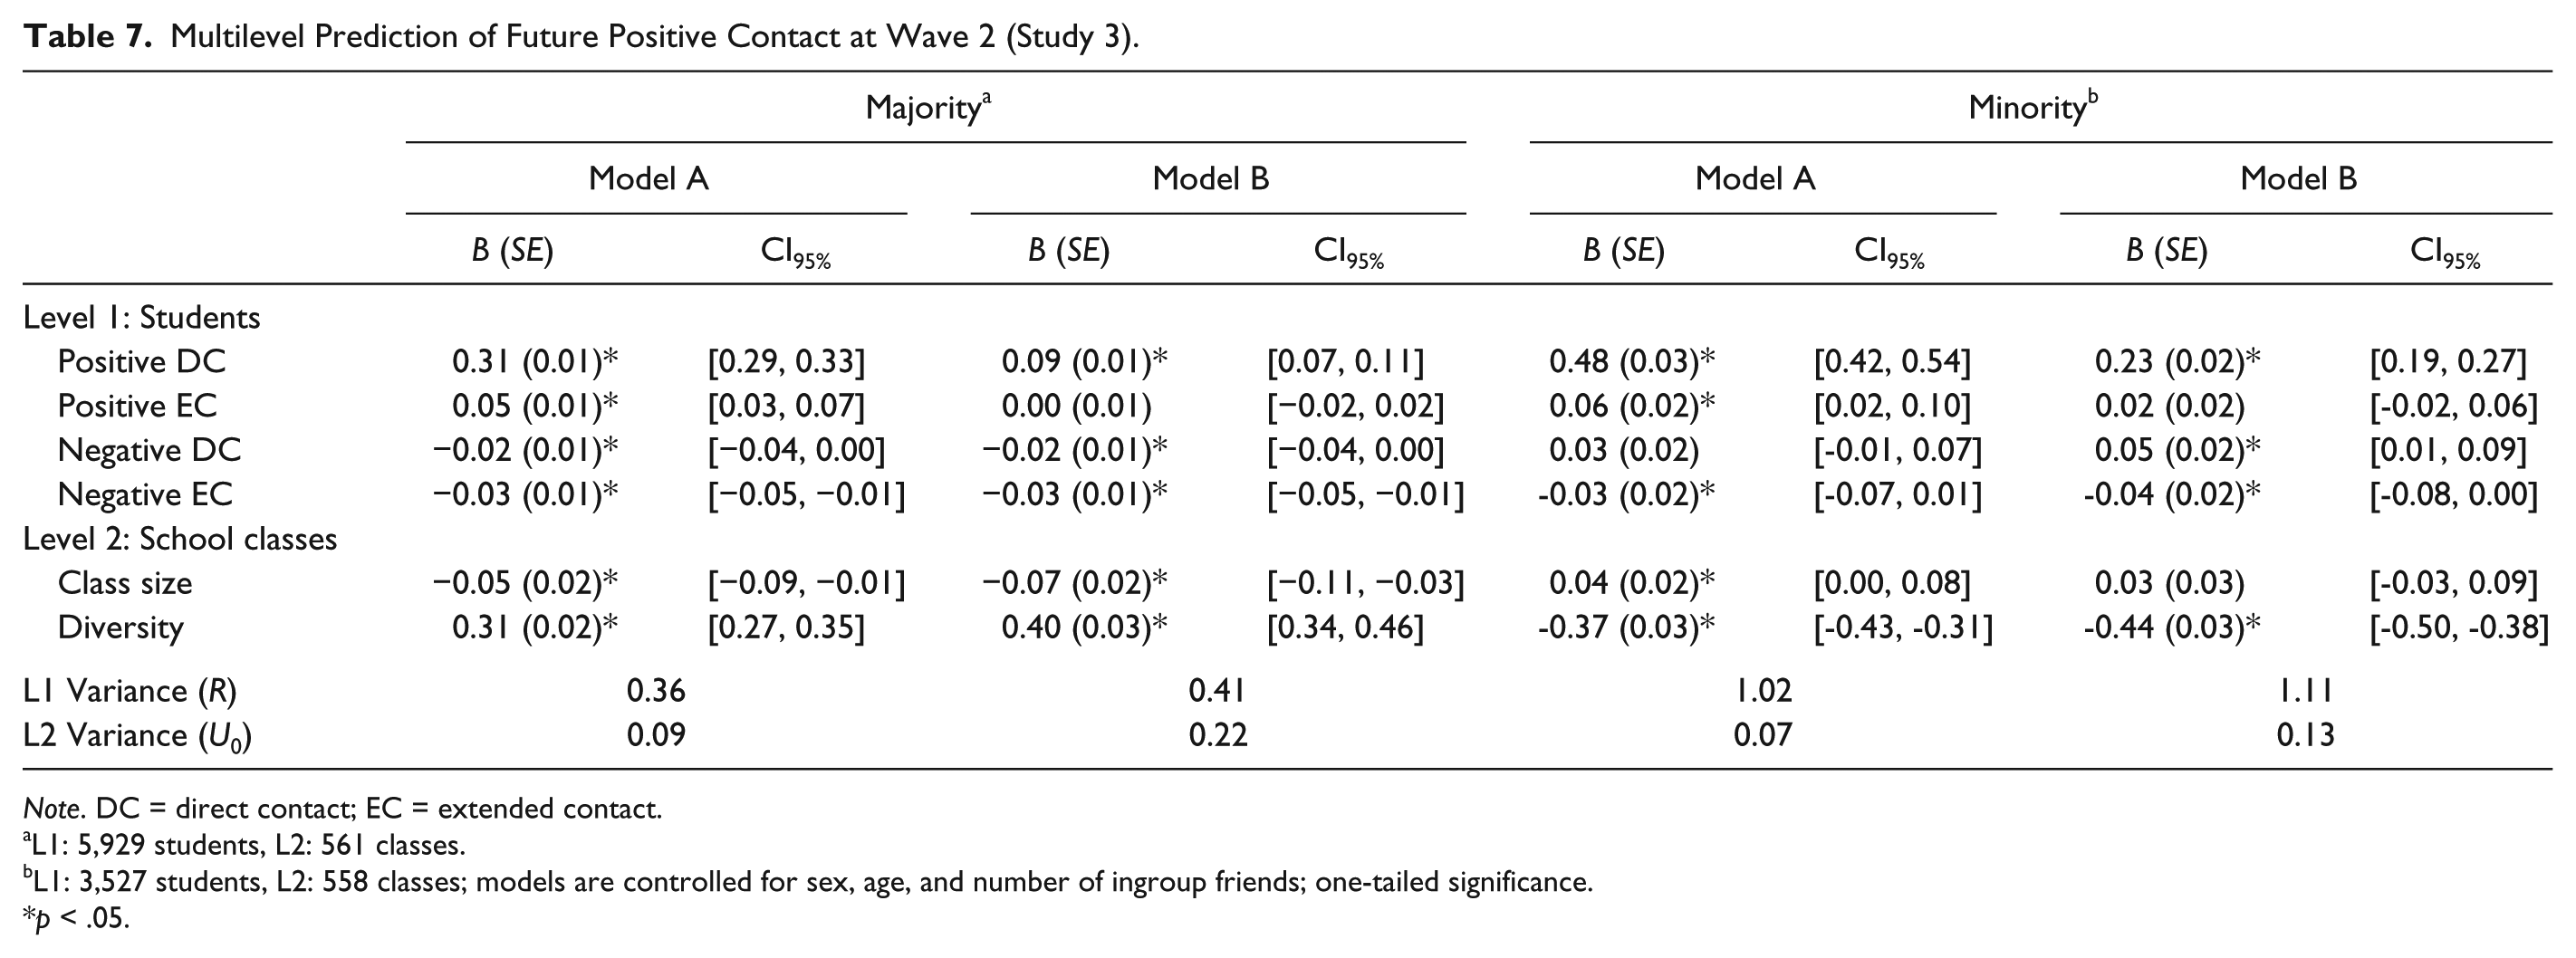
Note. DC = direct contact; EC = extended contact.
L1: 5,929 students, L2: 561 classes.
L1: 3,527 students, L2: 558 classes; models are controlled for sex, age, and number of ingroup friends; one-tailed significance.
p < .05.
The longitudinal results of Model A largely replicate the cross-sectional findings reported above. Across the majority and minority group, positive contact types had a positive effect, and negative contact types tended to have a negative effect, for the formation of future positive contact, while controlling for sex, age, number of ingroup friends, class size, and diversity. Only one out of eight longitudinal contact effects failed to reveal the expected result, namely, negative direct contact in the minority. The size of effects indicates the difference in future positive contact between two people at Wave 2 (scale = 1-5), who differ in the corresponding predictor by one standard deviation. 5 Because positive direct contact in Model A represents a stability path, this renders an effect comparison with other predictors impossible. All other contact effects were equally strong for the prediction of future positive contact.
All findings of Model A can be replicated in Model B, except for the same two differences that we also found when comparing both cross-sectional models: In the majority and in the minority group, the significant effect of positive extended contact disappears when operationalizing this measure with the exclusive use of network data. Moreover, the strength of positive direct contact decreased significantly in comparison with Model A—majority: t(11854) = 15.56, p < .001; minority: t(7050) = 6.93, p < .001—partly because it was not confounded with an autocorrelative effect. Despite this decrease, however, positive direct contact was significantly stronger than negative direct contact in both the majority, t(11854) = 4.95, p < .001, and the minority, t(7050) = 6.36, p < .001, groups, while all other contact effects were found to be equally strong across both the majority and the minority group.
General Discussion
The primary purpose of the present research was (a) to exploit the potential of SNA for examining intergroup contact and (b) to move beyond the analysis of direct positive contact by considering the full complexity of intergroup contact including direct (Studies 1 and 2) as well as extended (Study 3) forms of positive and negative contact.
Studying Intergroup Contact With SNA
Across three studies, the present paper demonstrated that SNA represents a valid method that helps study intergroup contact, besides the established traditional approaches. That is, findings consistently revealed that self-reports and network data seem to be equally adequate for studying the effects of intergroup contact on intergroup relations.
However, the network approach is likely to be of particular value for measuring negative contact and extended contact. That is, whenever contact researchers are interested in studying a broader perspective on intergroup contact, including negative contact and extended contact, the consideration of social network data has the potential to enrich the traditional assessment of intergroup contact. For the assessment of negative contact, SNA helps the researcher to deemphasize the group membership during the data collection and, thus, minimize response tendencies by eliciting negative networks without any reference to intergroup relations, which only come into play later utilizing respondents’ provided sociodemographic information. For the assessment of extended contact, SNA helps us to study indirect links within the entire social network and, thereby, provides what is likely to be a more accurate measure of extended contact. It achieves this because it neither relies on report of other ingroup members’ contact, nor risks projection from one’s own level of contact, by decomposing the assessment into two separate analytic steps. For positive extended contact, however, results in Model B of Study 3 demonstrated that network data alone consistently reveal nonsignificant results, which is in line with previous research that failed to find extended contact effects with the exclusive use of social network data (Munniksma et al., 2013), but it challenges previous research on extended contact using self-reports. We argue that a more optimal approach represents the combination of network data and self-reports, as applied in Model A of Study 3, to avoid the problematic overlap between direct contact and extended contact with the exclusive use of network data, at least when studying smaller positive networks (see Wölfer et al., 2016).
This last suggestion underscores the idea for triangulating different research methods. Notwithstanding its advantages, and cognizant of its limitations (see below), we do not advocate that the SNA approach should replace self-reports in studies of intergroup contact. The low to moderately high intercorrelations between self-reported and network-based contact parameters across all three studies indicate that SNA and self-reports each offer a unique perspective for the study of intergroup contact, while both measures also have their limitations. There are many ways that one can measure positive and negative contact, and it is not our intention to argue that network measures are superior but, rather, that they have the potential to advance the study of intergroup contact as an additional methodological perspective.
Positive and Negative Direct and Extended Contact
A unique aspect of this research is that we went beyond the traditional focus of positive direct contact and considered the full complexity of intergroup contact, including positive and negative forms of direct and extended contact. Across all three studies, findings indicate that both positive and negative contact explain intergroup attitudes, which was found to be robust for self-reports and social network data, for the majority and minority group, and for conflictual (Norther Ireland and Oldham) and nonconflictual (Western Europe) settings. Study 3 further demonstrated that (a) positive and negative contact reveal not only the expected cross-sectional but also longitudinal effects, and (b) direct as well as extended positive and negative contact uniquely predict intergroup relations in the expected direction in most models. It is worth noting that the different contact types were modeled simultaneously, which supports the existence of each contact type above and beyond all other contact types. We believe that the joint consideration of positive and negative direct and extended contact is a crucially important advancement, which helps improve our understanding of increasingly diverse societies, because all contact types contribute uniquely to the quality of intergroup relations. Three findings deserve further discussion: the role of negative extended contact, the positive longitudinal effect of negative direct contact for minority students, and the difference between the majority and minority group.
Consistent with available within-study comparisons (e.g., Christ et al., 2010), we found that the effect of positive direct contact was stronger than that of positive extended contact (but see the recent meta-analysis by Zhou, Page-Gould, Aron, Moyer, & Hewstone, under review). Both forms of negative contact were, however, equally strong for the prediction of intergroup relations across all models in Study 3. This pattern suggests that negative contact is similarly harmful, whether experienced directly or via an ingroup friend. It is, therefore, possible that unique mechanisms underlie the experience of negative extended contact compared with positive extended contact. More specifically, it is plausible that the indirect receiver might judge negative extended contact more harshly. That is, when people talk about a negative outgroup experience with ingroup members, they might leave out important details, such as their own behavior, that would help understand the outgroup’s negative behavior. Consequently, this biased negative extended contact information might lead to an over-interpretation of the indirectly experienced negative contact event and result in comparably strong effects than negative direct contact.
Another unexpected effect was the positive longitudinal effect of negative direct contact in the minority models of Study 3. Initially, this effect seems to be somewhat paradoxical, but it finds conceptual support in the literature. A study by Birtel and Crisp (2012) provided evidence for their hypothesis that negative contact increases the effect of subsequent positive contact. They argued that, while drawing a parallel with the psychotherapeutic approach to anxiety reduction, patients must first confront anxiety-provoking stimuli before attempting to modify their responses. Given that most individuals experience, on average, a mix of positive and negative contact, this effect could explain the positive longitudinal effect of negative direct contact. However, it remains unclear why this effect only occurs in the minority.
In contrast to literature suggesting that members of the disadvantaged minority group might be more likely to anticipate prejudice and discrimination from the advantaged majority group and are, therefore, biased in favor of perceiving or reporting negative contact experiences (cf., Shelton, 2003; Tropp, 2006), our results, in fact, indicate the opposite. Minority group members (i.e., Catholics in Study 1, Asian British students in Study 2, and immigrants in Study 3) reported less or an equal amount of negative contact compared with the majority group. Moreover, we found almost no differences in the effects of contact on intergroup relations for the majority and minority group; Study 2 even found that negative contact effects were, in contrast to the majority, nonexistent in the minority. This unexpected result might differ for other, more disadvantaged minority groups. Although there is room for improvement in the status and integration of Asian students in England and immigrant minority students in Europe, the amount of perceived conflict and structural discrimination is worse for minority groups in other contexts (e.g., Blacks in South Africa or “Dalits” in India).
Limitations and Future Research Directions
Despite the demonstrated validity of SNA for the field of intergroup contact, it is worth noting that this approach is, as every method, characterized by some limitations. These limitations differ between complete networks, ego networks, and snowball networks (Wölfer & Hewstone, in press). With regard to complete social networks, which provide the most relevant information for contact researchers, researchers need to be aware of three limitations. First, complete social networks are, by definition, characterized by a network boundary (e.g., school, neighborhood, or workplace), which captures only a specific part of the population to which we want to generalize our findings, and must be well-defined and conceptually meaningful. Second, SNA in general is, and complete social networks in particular are, sensitive to missing data, because nonparticipating individuals result not only in a lack of data but can also change the structure of the network dramatically. Third, in complete social networks that are smaller and structured by positive ties, transitivity can produce a problematic overlap between direct and extended contact due to many closed triads, in which a network member has direct and extended contact to the same outgroup member. As demonstrated in Study 3, one possible way to handle this problem is to combine network data and self-reports using the applied two-step procedure for measuring extended contact. Given these evidential advantages and disadvantages, SNA is helpful for providing an additional perspective on intergroup contact and has the potential to complement, rather than replace, other established research methods.
A specific limitation of the present paper concerns the lack of comparability between contact parameters. The comparison of contact parameters across methods, especially in the first two studies, revealed some interesting differences, but self-reported and network-based contact measures differ with respect to at least two fundamental aspects, namely, the investigated context (within vs. beyond a network boundary) and the assessed form of intergroup contact (number of nominated outgroup connections vs. general frequency of contact experiences). Relatedly, positive and negative contact parameters are also not perfectly comparable with each other, neither across different methods nor when focusing on network data or self-reports. Although findings from most models of the present paper suggest that direct positive contact is the strongest predictor for intergroup relations, which challenges previous literature (e.g., Barlow et al., 2012), the wording of positive and negative contact parameters does not allow a sound comparison. Future research should further explore the difference between positive and negative contact by using better harmonized (self-reported and network-based) measures of positive and negative contact. In sum, we sound a note of caution concerning direct comparisons between the different contact measures in this study. The primary value of our research is, rather, in showing that different contact measures contribute uniquely to the explanation of intergroup contact, have the potential to enrich each other, and together provide a more nuanced and detailed analysis of intergroup contact in each context studied.
Finally, apart from its empirical contributions, this paper also highlights the urgent need for a fundamental theoretical advancement that better explains the simultaneous existence of different types of contact, their underlying mechanisms, and the complex interplay between them within diverse settings. We believe that analytical refinements, such as SNA, that enrich the traditional dyadic perspective of intergroup contact research will produce valuable insights and inspire new theoretical advancements. As shown throughout this paper, SNA helps assess previously neglected but important contact parameters and provides a unique perspective on intergroup contact that can improve our understanding of intergroup relations within our increasingly diverse societies.
Footnotes
Declaration of Conflicting Interests
The author(s) declared no potential conflicts of interest with respect to the research, authorship, and/or publication of this article.
Funding
The author(s) disclosed receipt of the following financial support for the research, authorship, and/or publication of this article: The Longitudinal Study of Intergroup Contact research project reported in Study 1 was funded by a grant from Atlantic Philanthropies to Joanne Hughes and Miles Hewstone. The CILS4EU research project reported in Study 3 was funded by a grant from the NORFACE ERA NET Plus Migration in Europe-programme to Miles Hewstone. The article was also supported by a VENI grant to Eva Jaspers from the The Netherlands Organisation for Scientific Research (NWO) (Grant 016-125-141).
Supplemental Material
Supplementary material is available online with this article.
Notes
References
Supplementary Material
Please find the following supplemental material available below.
For Open Access articles published under a Creative Commons License, all supplemental material carries the same license as the article it is associated with.
For non-Open Access articles published, all supplemental material carries a non-exclusive license, and permission requests for re-use of supplemental material or any part of supplemental material shall be sent directly to the copyright owner as specified in the copyright notice associated with the article.