
Abstract
Across five experiments (four pre-registered, N = 4,431), we investigate whether emphasizing similarities between Republicans and Democrats can improve intergroup relations between the two groups. Members of both groups who were presented with evidence emphasizing similarities rather than differences in the psychological attitudes of both parties reported greater inclusion of the political opposition in the self, greater belief that common ground can be reached for major social issues, and warmer feelings toward the opposition. Inclusion of the political outgroup in the self mediated the effect of the similarities condition on additional outcomes, relating to more positive and less threatening perceptions of political opposition members. These findings held even when compared with a baseline condition with no information presented to participants. We conclude that by emphasizing the study of group similarities and by disseminating research in a way that highlights similarities, researchers could reduce intergroup hostilities in the political domain.
The United States is deeply politically divided, and this division is rather unique from a global perspective (Dimock & Wike, 2021). Years of faction antagonism have created a political divide that has only exacerbated in recent years, becoming an obstacle to the economy and to democracy (Galston & Kamarck, 2022). Political animosity specifically has been rising for decades now (Boxell et al., 2022; Iyengar et al., 2019). This increasing partisan animosity has deleterious consequences for the American society. Research suggests that it can worsen close relationships, including both family (Chen & Rohla, 2018) and romantic bonds (Huber & Malhotra, 2017). Perhaps most importantly it fuels intergroup violence and antidemocratic principles (Graham & Svolik, 2020; Greve & Gambino, 2022; Lonsdorf et al., 2022).
Not surprisingly then, politicians, pundits, and scientists alike tirelessly emphasize and focus on the differences between Democrats and Republicans (e.g., Haidt, 2012; Jost, 2017). One prominent finding for example is that Republicans tend to focus on preserving American society, its values, and norms “as is,” while Democrats express support for beliefs that challenge, and aim to change, the status quo. Considering this division, the aim of the current investigation is to highlight how an emphasis on similarities in the attitudes between Democrats and Republicans could potentially help improve intergroup political attitudes between these two groups. In particular, our emphasis was on how psychological and social science research more broadly tends to focus primarily on differences overlooking at similarities. When these differences are presented to the public, this could further entrench intergroup political divisions. Instead, we posit highlighting similarities between divided groups such as Democrats and Republicans could help them find common ground and perceive the political opposition in a more positive view. We tested these phenomena in five experiments (four pre-registered) using stimuli obtained from a large online survey (see Supplemental Materials). Results from these studies highlight how a potential emphasis on similarities (rather than differences) could aid in efforts to decrease affective polarization.
Similarities Are Important
Within the science of psychology, more than 90% of published research describes statistically significant differences (Fanelli, 2010; Open Science Collaboration, 2015). The constant emphasis that social sciences place on highlighting differences within and between groups might inadvertently help reinforce beliefs in intergroup divisiveness (Hanel et al., 2019). Nowhere is this potential larger than in the psychological investigation of political phenomena. Psychologists have mapped the differential psychological typology of Democrats and Republicans extensively (e.g., Amodio et al., 2007; Clifford, 2020; Jost & Amodio, 2012; Jost et al., 2009).
However, to date, psychology has not strived to illuminate similarities between groups. Exceptions to this consensus include research, which has mapped the similarities in people’s values (Fischer & Schwartz, 2011; Schwartz, 1992; Schwartz & Bardi, 2001), and the cultural orientation of nations (Kaasa & Minkov, 2020). Further research on the gender similarity hypothesis (Hyde, 2005, 2014) also emphasizes that unlike what most empirical findings promoting notable gender differences propose, there exists a large degree of similarity on the basis of gender. This is primarily the consequence of the field being hesitant to publish findings that do not focus on significant differences (Franco et al., 2014). However, focusing on the psychological similarities between groups could prove instrumental for social scientists, especially within the realm of politics. In a recent preregistered study (e.g., Bakker et al., 2020), scientists found evidence that liberals and conservatives display similar physiological reactions to different threats, thus failing to replicate past studies which found a significant difference (Oxley et al., 2008). The original study, which stressed that liberals and conservatives exhibit physiological differences in their responses to threats, garnered a lot of media attention (Mooney, 2012; Vedantam et al., 2018; Worthen, 2018), with media outlets rushing to claim that liberals and conservatives are inherently different and therefore will not be able to cooperate effectively, potentially furthering the already extensive political polarization in the United States (Lauka et al., 2018).
In the current investigation, we examined whether such a focus on similarities can redraw the boundaries between opposed parties. We theorized that exposure to information that highlights the commonalities between opposing parties can influence outgroup perceptions. Our predictions are in tandem with recent large-scale efforts to reduce partisan animosity, namely the Strengthening Democracy Challenge (SDC; Voelkel et al., in press). The SDC was a competition that brought together researchers and practitioners with the goal of generating short interventions that would decrease partisan animosity and increase support for democracy. Several of the interventions included in the SDC targeted mechanisms that our investigation could also activate. For example, some interventions in that mega-study sought to emphasize similarities (e.g., Common National Identity intervention, Moral Similarities and Differences intervention, and Party Overlap on Policies intervention), and others sought to correct misperceptions (Correcting Opportunism Misperceptions intervention, Correcting Division Misperceptions intervention, and Correcting Democracy Misperceptions intervention). What all these investigations have in common is that they show emphasizing similarities can reduce partisan animosity. However, given the many-labs component of the SDC, it was not feasible to examine potential explanatory mechanisms of this effect.
Even in another smaller-in-scale investigation that utilized the same methodological design (i.e., a direct emphasis on actual data highlighting similarities), the potential underlying mechanism of the observed effect was not considered. This experiment was conducted in the Brexit context (Hanel & Wolf, 2020). This study found that emphasizing similarities between those who voted for Britain to remain in the European Union and those who voted for Brexit improved intergroup relations. In addition, it is not clear whether such interventions are more or less effective for specific intergroup outcomes. Seeking to address this gap, in the present study, we both investigated a potential explanatory mechanism of this effect, namely recategorization of the outgroup closer to oneself, and examined the effects of emphasizing similarities on a variety of outcomes.
In a recent review of the literature on interventions that seek to reduce partisan animosity (Hartman et al., 2022), the researchers introduced the Thoughts–Relationships–Institutions (TRI) Framework. This framework summarizes the three major approaches aiming to reduce partisan animosity. From this framework, the most relevant approach to this investigation is the “T” component, as it pertains to investigations that seek to correct misperceptions and highlight commonalities between political groups. Several investigations have effectively reduced misperceptions between political groups, which in turn reduced negative partisan attitudes (e.g., Lees & Cikara, 2020; Ruggeri et al., 2021). We argue that, in a similar manner, presenting scientific information about differences between political groups as intergroup similarities rather differences, especially when small effects are concerned, could help reduce potential misperceptions about group differences between groups. Perhaps most importantly, focusing on similarities can increase perceptions of how much factors the two groups have in common. Such claims utilize the common ingroup identity model as a theoretical basis (e.g., Gaertner et al., 1989), with some investigations having successfully reduced partisan animosity (e.g., Brandt et al., 2020; Hanel & Wolf, 2020; Levendusky, 2018; Riek et al., 2010). However, the authors of the review speculate that such effects might be temporally short-lived (Hartman et al., 2022). Thus, a third goal of this investigation is to examine whether the effects of emphasizing similarities can be successful in the long term.
We argue that a key mechanism in this process is people’s changes in how much overlap they see with the political opposition (defined as increased inclusion of the political opposition in the self, Aron et al., 1992). Although we do not necessarily believe that Republicans and Democrats would perceive each other as members of one ingroup, we do believe an emphasis on similarities rather than differences could decrease the perceived distance between the two groups. As a result of this increased positive outgroup perception, we posit that a reduction in intergroup bias could be observed, which would ultimately increase cooperation between supporters of ideologically opposed parties.
Operationalizing Similarities
Using the methodological approach recommended by Hanel et al. (2019), we operationalized similarities by utilizing an overlap coefficient (OVL). Hanel et al. (2019, p. 543) highlight that “a possible and often neglected application of (Cohen’s) d is that it can be transformed to yield an OVL, which allows one to draw conclusions about the distribution of all the data, not just the means.” Importantly, the OVL estimates the percentage of overlap between two specified normal distributions (Inman & Bradley, 1989). Multiplying the OVL by 100 allows us to estimate a new index capturing the percentage of common responses (PCR). Hanel et al. generated the PCR to examine the prevalence of similarities across different psychological measures. In their 2019 article, Hanel et al. examined the PCR in comparison to other measures of similarities: an intraclass correlation, the probability of superiority, percentage of common scores (a new measure developed by Hanel et al.), equivalence tests, and response surface analysis. From this comparison, the researchers argued that the PCR is the most parsimonious measure. In subsequent experiments, the researchers found presenting information by highlighting similarities (using a PCR and visual representation of data), compared with mainstream method of presenting differences (i.e., barplots with confidence intervals), led to participants having more accurate perceptions of the findings and more positive attitudes toward a target outgroup (Hanel et al., 2019).
The Current Studies
Drawing on research highlighting that a focus on similarities improves laypeople’s comprehension of scientific information (Hanel & Mehler, 2019; Mussweiler, 2003; Suls & Wheeler, 2000) and attitudes toward outgroups (e.g., Byrne, 1961; Montoya et al., 2008), the current investigation aimed to shed light on similarities between Democratic and Republican supporters. We theorized that such an emphasis on similarities, contrary to differences, could reshape the way in which people construct members of the political opposition relative to themselves. For example, when presented with evidence that the political outgroup’s attitudes are more similar to those of their political ingroup, partisans would potentially include outgroup members in their own self-construal to a greater degree (i.e., inclusion of the other in the self; Aron et al., 1992), which would then potentially relate to increased political outgroup prosociality. Studies 1–4 examined this phenomenon using different outcome variables and by comparing a manipulation emphasizing similarities relative to a condition highlighting differences between Republicans and Democrats, a commonplace practice in psychology. Study 5 examined this phenomenon longitudinally and relative to a baseline condition with no information provided to participants.
All data and syntax files relevant to the current investigation are available on the Open Science Framework (OSF) at https://osf.io/dx2b3/?view_only=046cc8d3672245409f373efa066c268d.
Study 1
We conducted a preregistered experiment (https://aspredicted.org/blind.php?x=6q89xw) where we presented participants with information on the similarities and differences in the sociopolitical attitudes of Republicans and Democrats. Importantly, these stimuli were generated from a large online survey (N = 2,423) fielded by the research team on MTurk in February 2020, leading up to the 2020 U.S. presidential elections. This study is described in the Supplemental Materials. Of note is that the highest degree of similarity in the attitudes of Republicans and Democrats was observed for their endorsement of the moral foundations of care and fairness, their support for bipartisanship, and their support for democracy. We presented this evidence in the form of similarities between the two groups or in the form of differences between the two groups (in a manner similar to that of Hanel et al., 2019). We performed this experiment on the eve of the 2020 presidential elections (October 30–November 4) with our rationale being that this will be a time where political issues and intergroup rivalry will be the most salient.
Method
Participants
We based our sample on recent findings which suggest a small effect size (d = .17) for an independent sample t-test (Hanel & Wolf, 2020). Based on that effect size, with alpha set to .05 and power set to .80, we will require a sample of 860 participants. We rounded this number up to 1,000 participants to account for an expected 15%–20% exclusion rate due to bad data quality. After excluding participants who were not U.S. citizens (N = 10), who did not take the survey seriously enough (indicated by their response being below the midpoint of a 1–9 slider scale; N = 18), who missed attention checks to either condition’s stimuli (N = 30), and who were multivariate outliers based on their responses to our survey’s measures (N = 21), 830 participants remained in our sample. In the final sample, 310 participants were male, 516 were female, and 4 were nonbinary. The majority of the sample was White (N = 500), 150 were Black, Indigenous, and people of color (BIPOC), and 180 did not provide a response/provided an uncodable response. The average age was 42.13 years (SD = 13.84), and the average political ideology tended to be moderate (M = 4.30, SD = 2.44, min = 1, max = 9).
Procedure
Participants were recruited on MTurk. To ensure that our data had adequate quality, we utilized CloudResearch (Litman et al., 2017), which allowed us to utilize additional screening criteria that reduce the number of bots and invalid responses in psychological research. After providing consent, participants provided some initial demographic information (primarily about their political ideology and partisan identity) and were randomly assigned to one of two conditions.
Regardless of the condition they were in, participants were first presented with a fictional scenario to familiarize them with the bar graphs (differences condition) and the superimposed normal distribution graphs (similarities condition). This fictional example focused on gender differences/similarities in social media use. Furthermore, an explanation was provided on what an OVL is and what an effect size (Cohen’s d) was. Then participants were presented with information on the four measures that were selected from Study 1 as stimuli (moral foundation of fairness and care, their support for democracy, and their support for bipartisanship). These were selected because of their relatively high PCR.
In the differences condition (N = 405), participants were presented with information obtained from our lab in a previous survey, which discussed differences between Republicans and Democrats in their endorsement of the moral foundation of fairness and care, their support for democracy, and their support for bipartisanship, presented in the form of a bar graph. In the similarities condition (N = 425), participants were presented with the exact same information discussed as similarities between the two groups and visualized with a superimposed normal distribution graph. These stimuli were adapted from the study by Hanel et al. (2019) with the only change being that we used our own lab’s previously collected data to create the stimuli.
Then participants provided demographic information and were subsequently debriefed about the purpose of the study. The graphs used as stimuli in Study 1 are displayed in Figure 1. Notably, in Study 1, we opted to utilize bar graphs with restricted y axes for the differences condition. This choice was made for two reasons. First, even though it is normative (and a good practice) to display the full range of values for the y axis, in certain occasions, researchers still only present a superimposed y axis relative to the full range of values, to illustrate their results (which emphasize differences) more clearly. Second, we posited that finding an effect against the differences condition with restricted y axis would be the lowest possible threshold for a positive effect of emphasizing similarities. In subsequent studies, we provided the full range of values for the y axis for the differences condition to conduct a more stringent test of our hypothesis.
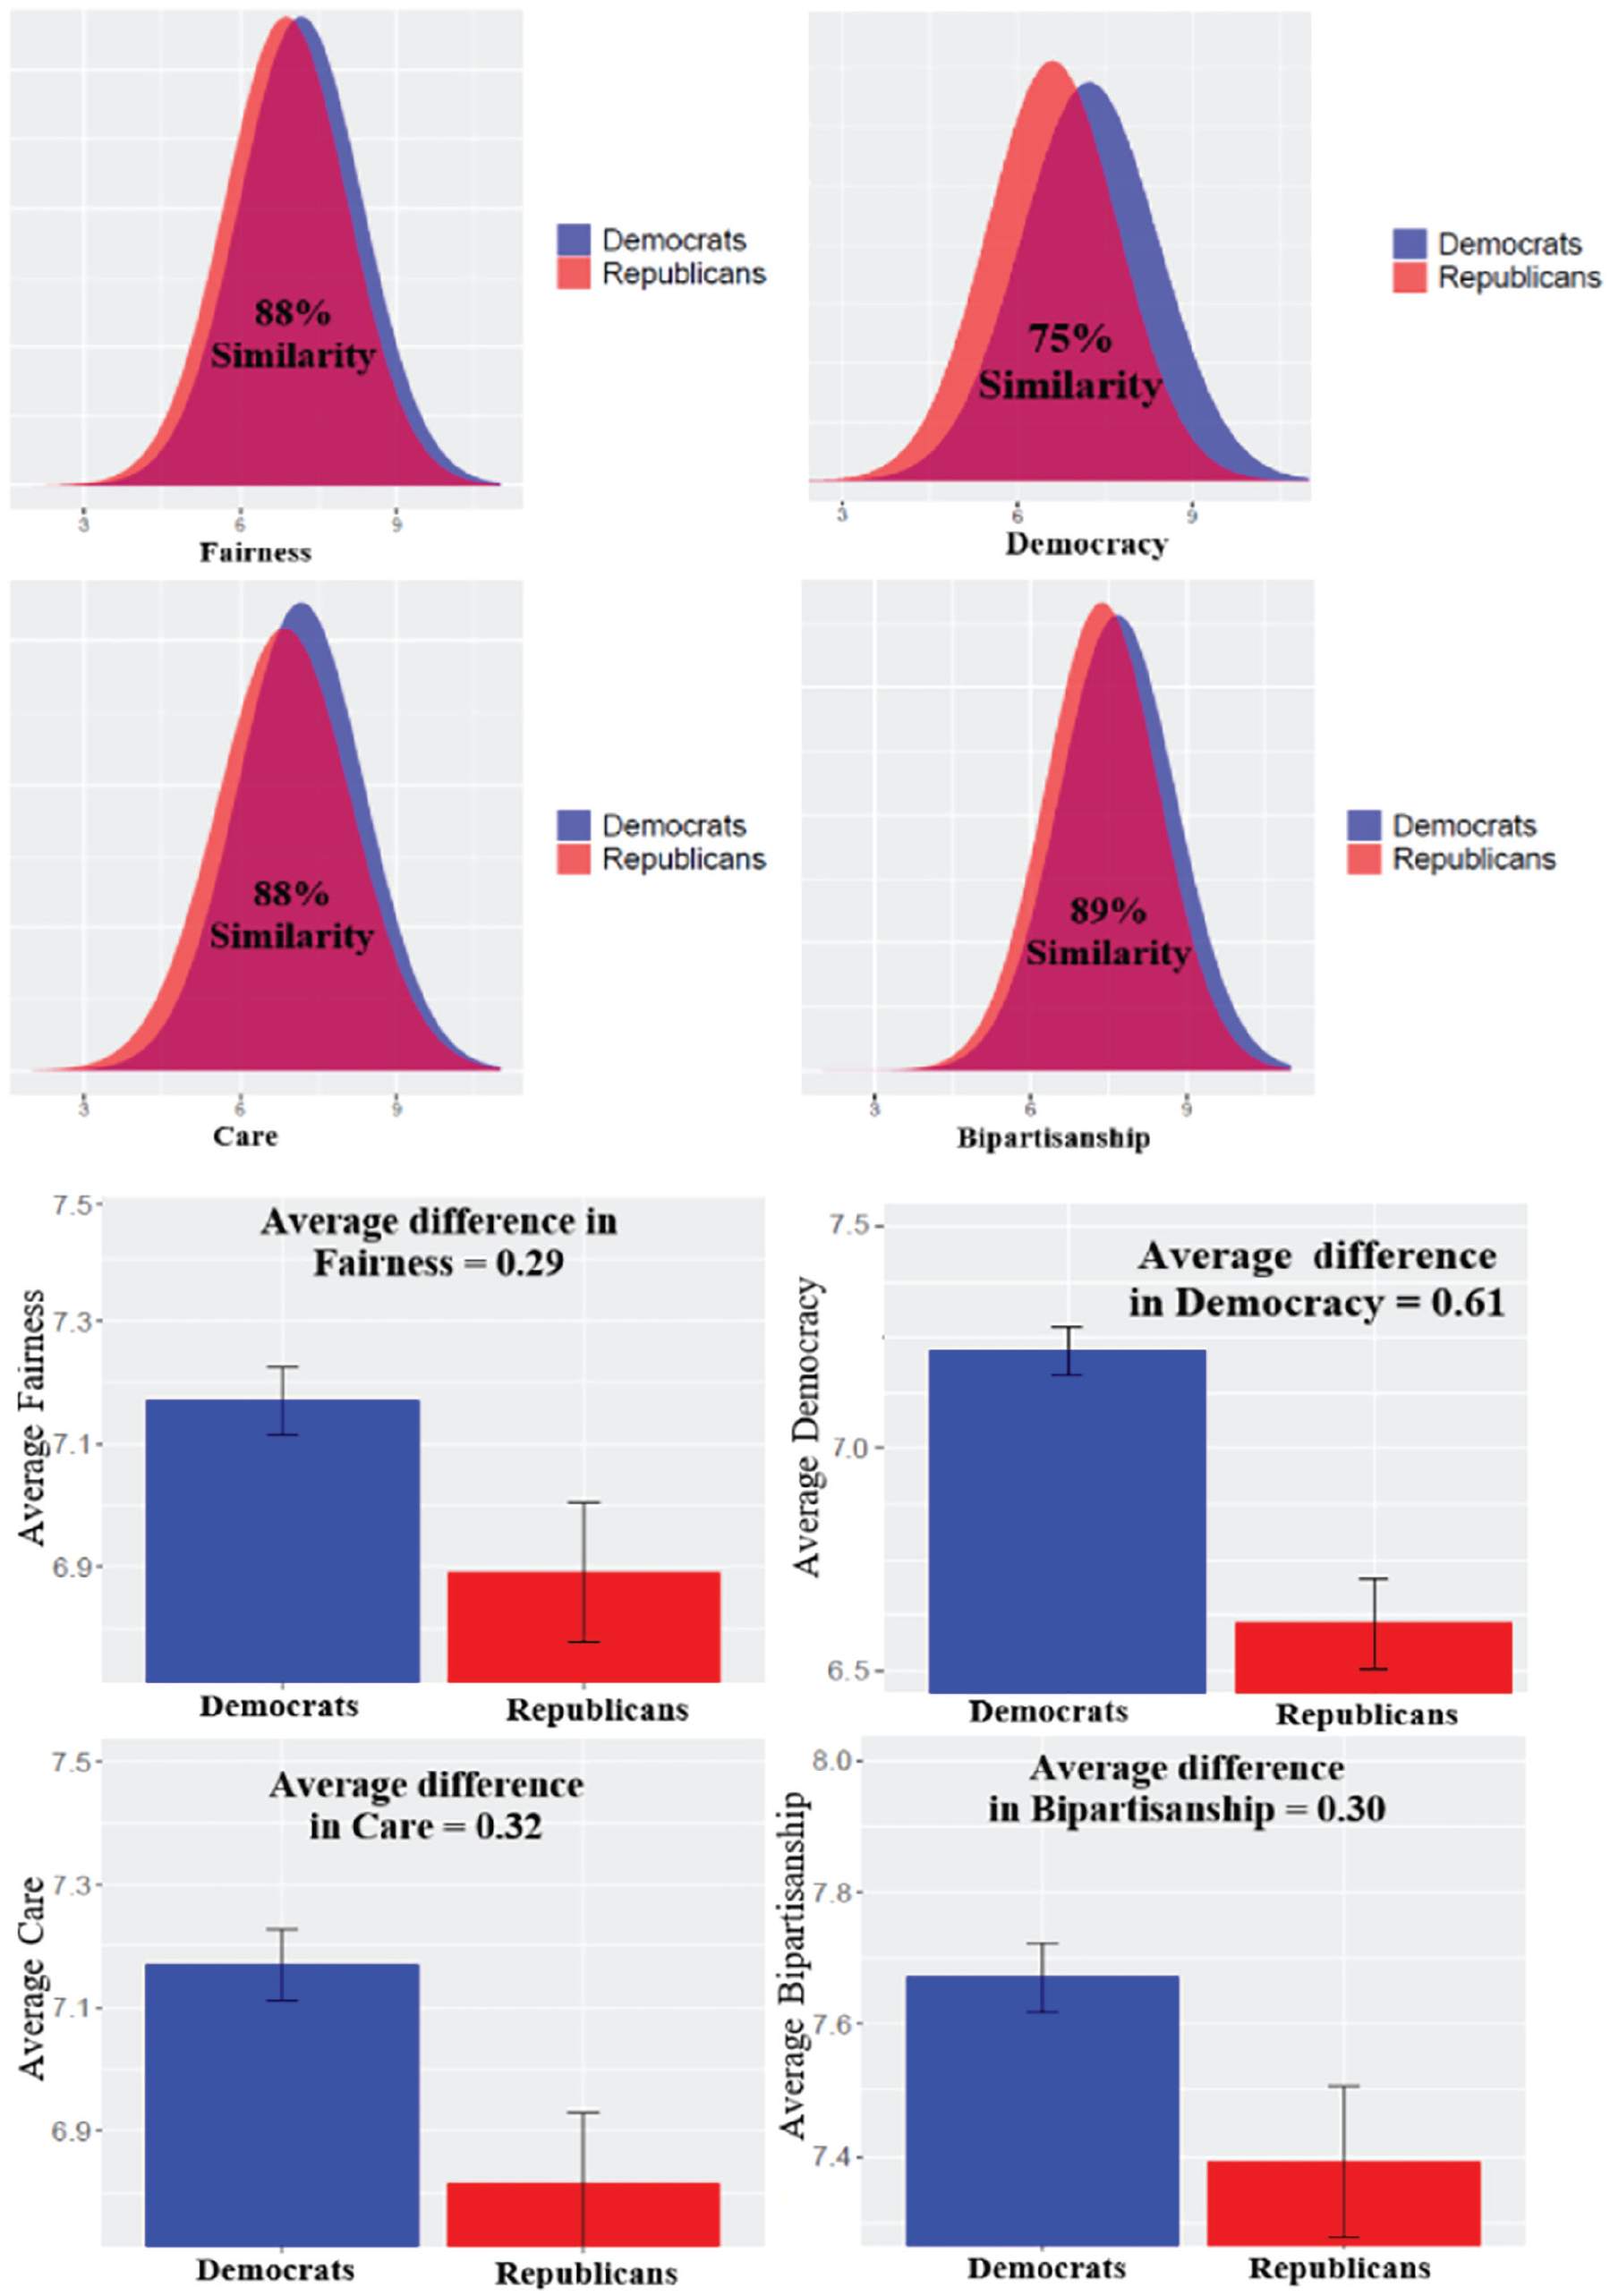
Graphs Used in the Similarities (Superimposed Normal Distribution; Top) and Differences Condition (Bar Graphs With Standard Errors; Bottom).
Measures
Unless otherwise noted, all measures in Studies 1–5 were presented on a 1–9 slider scale.
Manipulation Checks
Participants responded to seven statements asking them to rate how different versus similar they thought Republicans and Democrats were: (a) in general, (b) in their values, (c) their morality, and specifically in their support of (d) fairness, (e) care, (f) bipartisanship, and (g) democracy. These responses were reliably averaged into one construct (α = .97).
Inclusion of Outgroup in the Self
Participants were presented with a measure of inclusion of others in the self (adapted from Aron et al., 1992; 1 = least amount of inclusion to 7 = most amount of inclusion). If a participant was a Democrat (N = 367) or leaning toward Democrats (N = 133), they were presented with this measure asking them to what extent they feel close to Republicans. If they were Republican (N = 246) or leaning toward Republicans (N = 84), they were asked how close they felt toward Democrats.
Feeling Thermometers
Participants rated their feelings toward Republicans and Democrats. They also expressed their feelings toward Independents, President Trump, and Presidential candidate Joe Biden, all of which acted as cover items. Responses were recorded on a scale from 0 = very cold to 100 = very warm.
Perceived Outgroup Threat
We generated a four-item measure of threat (e.g., “Democrats/Republicans pose a threat to society”). Democrats (actual and leaning) reported their perceived threat toward Republicans (α = .94), while Republicans (actual and leaning) did the opposite (α = .93).
Positivity Toward Outgroup
We generated a five-item measure of outgroup positivity (e.g., “I think that the average Democrat/Republican could be friends with me”). Democrats (actual and leaning) reported their perceived threat toward Republicans (α = .92), while Republicans (actual and leaning) did the opposite (α = .92).
Support for Bipartisanship
We utilized two measures that captured attitudes toward bipartisanship. One measure focused on bipartisanship as an abstract attitude toward U.S. politics and overall cooperation among party lines (five items, e.g., “I think that Republicans and Democrats should compromise to find solutions to state and federal issues”; α = .91). Participants also completed a 10-item measure of how likely they thought it was for Republicans and Democrats to find common ground on major current social issues (e.g., abortion, racial inequality, gun control, climate change, LGBTQ rights). This measure was reliably averaged into one parsimonious construct (α = .90).
Strategies for Political Conflict Resolution
We utilized an adapted version of the escalatory and cooperative strategies from the Strategies for Political Conflict Resolution Questionnaire (Golec & Federico, 2004). These asked participants to imagine themselves as a powerful representative of their party and then specify to what degree they would engage in different resolution strategies. The items had Democrats as the target outgroup for Republicans and vice versa for Republicans. An exploratory factor analysis (principal axis factoring, oblimin rotation) suggested that eight items should be grouped into one factor comprising escalatory political strategies (e.g., “You will use fraud and deception to weaken Democrats’ position”; α for Democrats = .87; α for Republicans = .90), and three items should be grouped into a second factor of cooperative strategies (e.g., “You will explain your position and listen to Democrats: you will search for a ‘middle-of-the road’ solution”; α for Democrats = .60; α for Republicans = .58).
Political Ideology
Political ideology was measured with a three-item construct ranging from liberal/left to conservative/right that measured people’s attitudes toward economic, social, and foreign policy issues (α = .92). Higher scores captured political conservatism.
Results
For all studies, analyses were performed in SAS version 9.4. We utilized the “GLM” (General Linear Model) procedure, which outputs F and not t values but is equivalent to using a regression procedure with effect coding of the dichotomous variables, and thus we report F values below. A corresponding t value can be estimated based on F = t2. Means and standard deviations for the outcome variables in both conditions are presented in Table 1. Furthermore, results without covariates (estimated via independent sample t tests) are presented in Table 1 as well.
Means and SDs by Condition for Study 1.
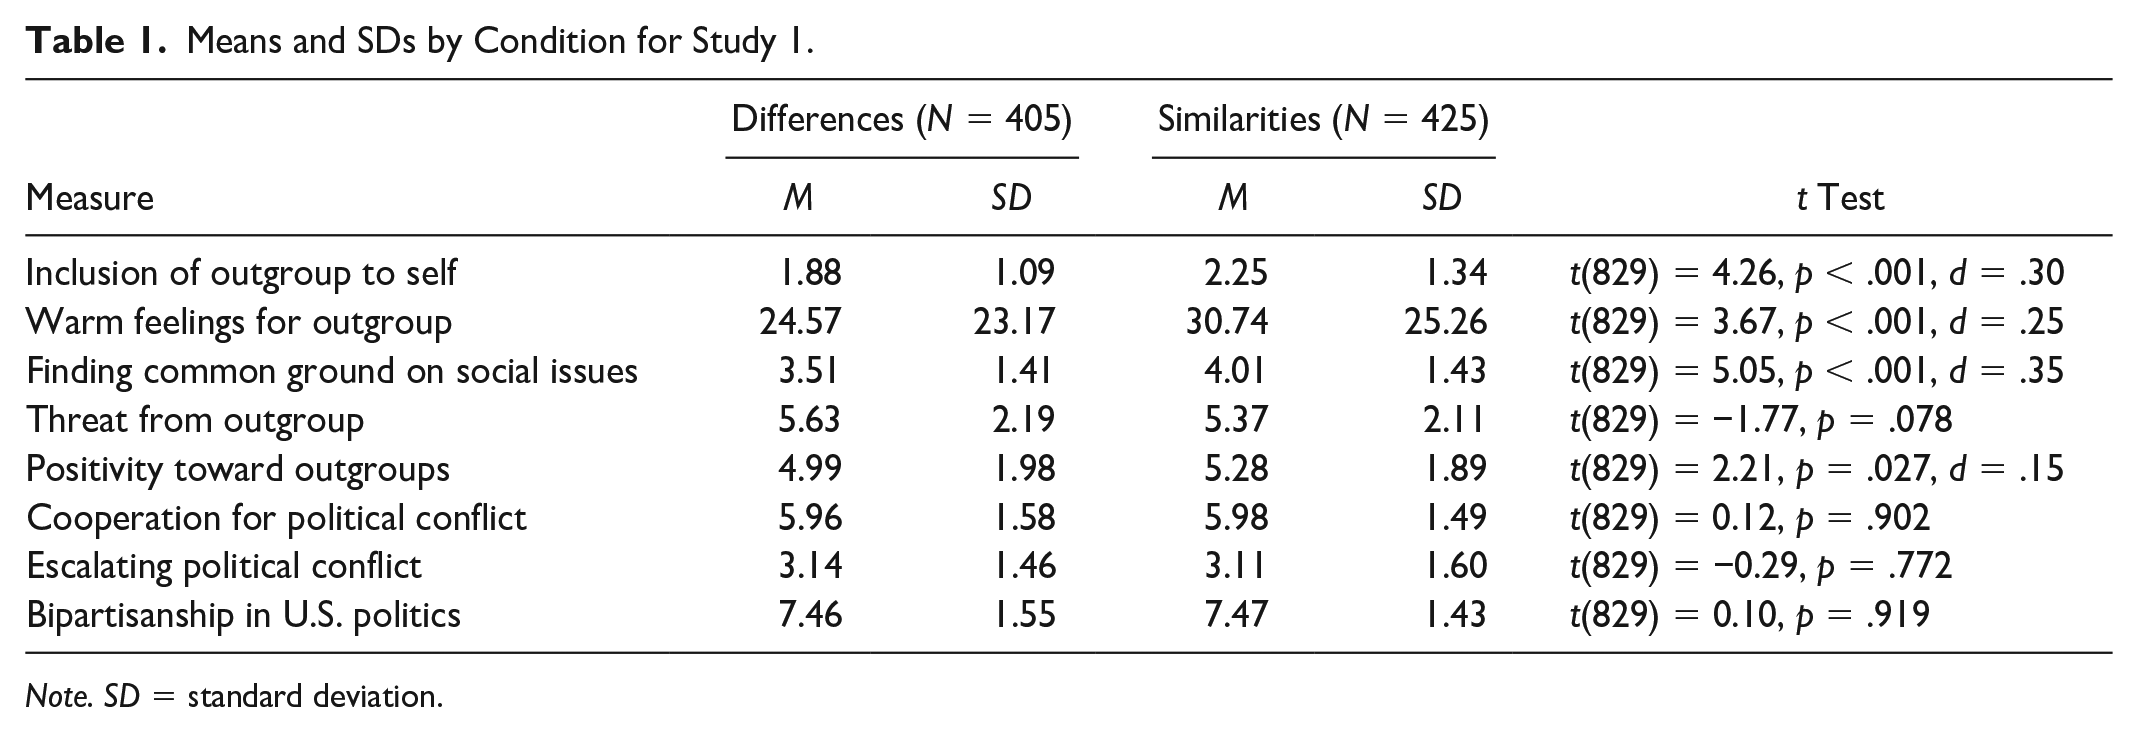
Note. SD = standard deviation.
Main Effects on Perceived Similarity
Participants in the similarities condition reported significantly more similarities between Republicans and Democrats than participants in the differences condition: F(1, 829) = 1,025.38, p < .001,
Main Effects on Inclusion of Outgroups
Controlling for all covariates (age, education, and income), participants in the similarities condition reported that the political opposition was significantly closer to them than participants in the differences condition: F(1, 825) = 16.74, p < .001,
Main Effects on Feelings Toward Outgroups
Controlling for all covariates, participants in the similarities condition reported significantly warmer feelings toward the political opposition than participants in the differences condition: F(1, 825) = 12.40, p < .001,
Main Effects on Perceptions of Outgroups
Controlling for all covariates, participants in the similarities condition reported significantly greater positivity toward the political opposition than participants in the differences condition: F(1, 825) = 6.21, p = .013,
Main Effects on Support for Bipartisanship and Strategies for Political Conflict Resolution
Controlling for all covariates, participants in the similarities condition reported significantly higher beliefs that common ground can be found for major social issues of our time than participants in the differences condition: F(1, 825) = 25.36, p < .001,
No significant effect was found for bipartisanship about between party lines cooperation in general: F(1, 829) = 0.01, p = .919,
Path Modeling
Since our manipulation focused on presenting scientific data as similarities rather than differences, we considered the possibility that the increased inclusion of the outgroup in oneself (alternatively operationalized as increased closeness to the political outgroup), resulting from being presented evidence for intergroup similarities, would in turn be related with more positive attitudes toward and perception of the political opposition. To test this possibility, we estimated a path model in which the condition (1 = similarities, 0 = differences) was inserted as the exogenous variable, followed by the measure of closeness toward the outgroup as the mediator, and the different measures of perception of and attitudes toward the outgroup as simultaneous outcomes (i.e., reaching common ground on social issues, feeling thermometer toward outgroup, cooperation and escalation strategies for political conflict, perceived outgroup threat, and positivity toward the outgroup). To evaluate model fit, we used the recommendations proposed by Kline (2016), which suggest that adequate fit to the data is provided in a model with nonsignificant chi-square, Comparative Fit Index (CFI) ≥ .95, Root Mean Square Error of Approximation (RMSEA) ≤ .08, and Standardized Root Mean Square Residual (SRMR) ≤ .08. Extant research has suggested, however, that large sample sizes can inflate a chi-square value, leading to a significant chi-square even if the model has an adequate fit (e.g., Kenny, 2020). Since our sample was quite large (N = 830), we primarily relied on the fit indexes to assess model fit.
The model provided a good fit to the data: χ2 (6) = 15.59, p = .016, CFI = .995, RMSEA = .044, SRMR = .020. All direct and indirect effects were significant and in the expected direction and are depicted in Figure 2 (direct effects) and Table 2 (indirect effects). These results remain significant when controlling for demographic covariates, and therefore, we are presenting that model in the Supplemental Materials.
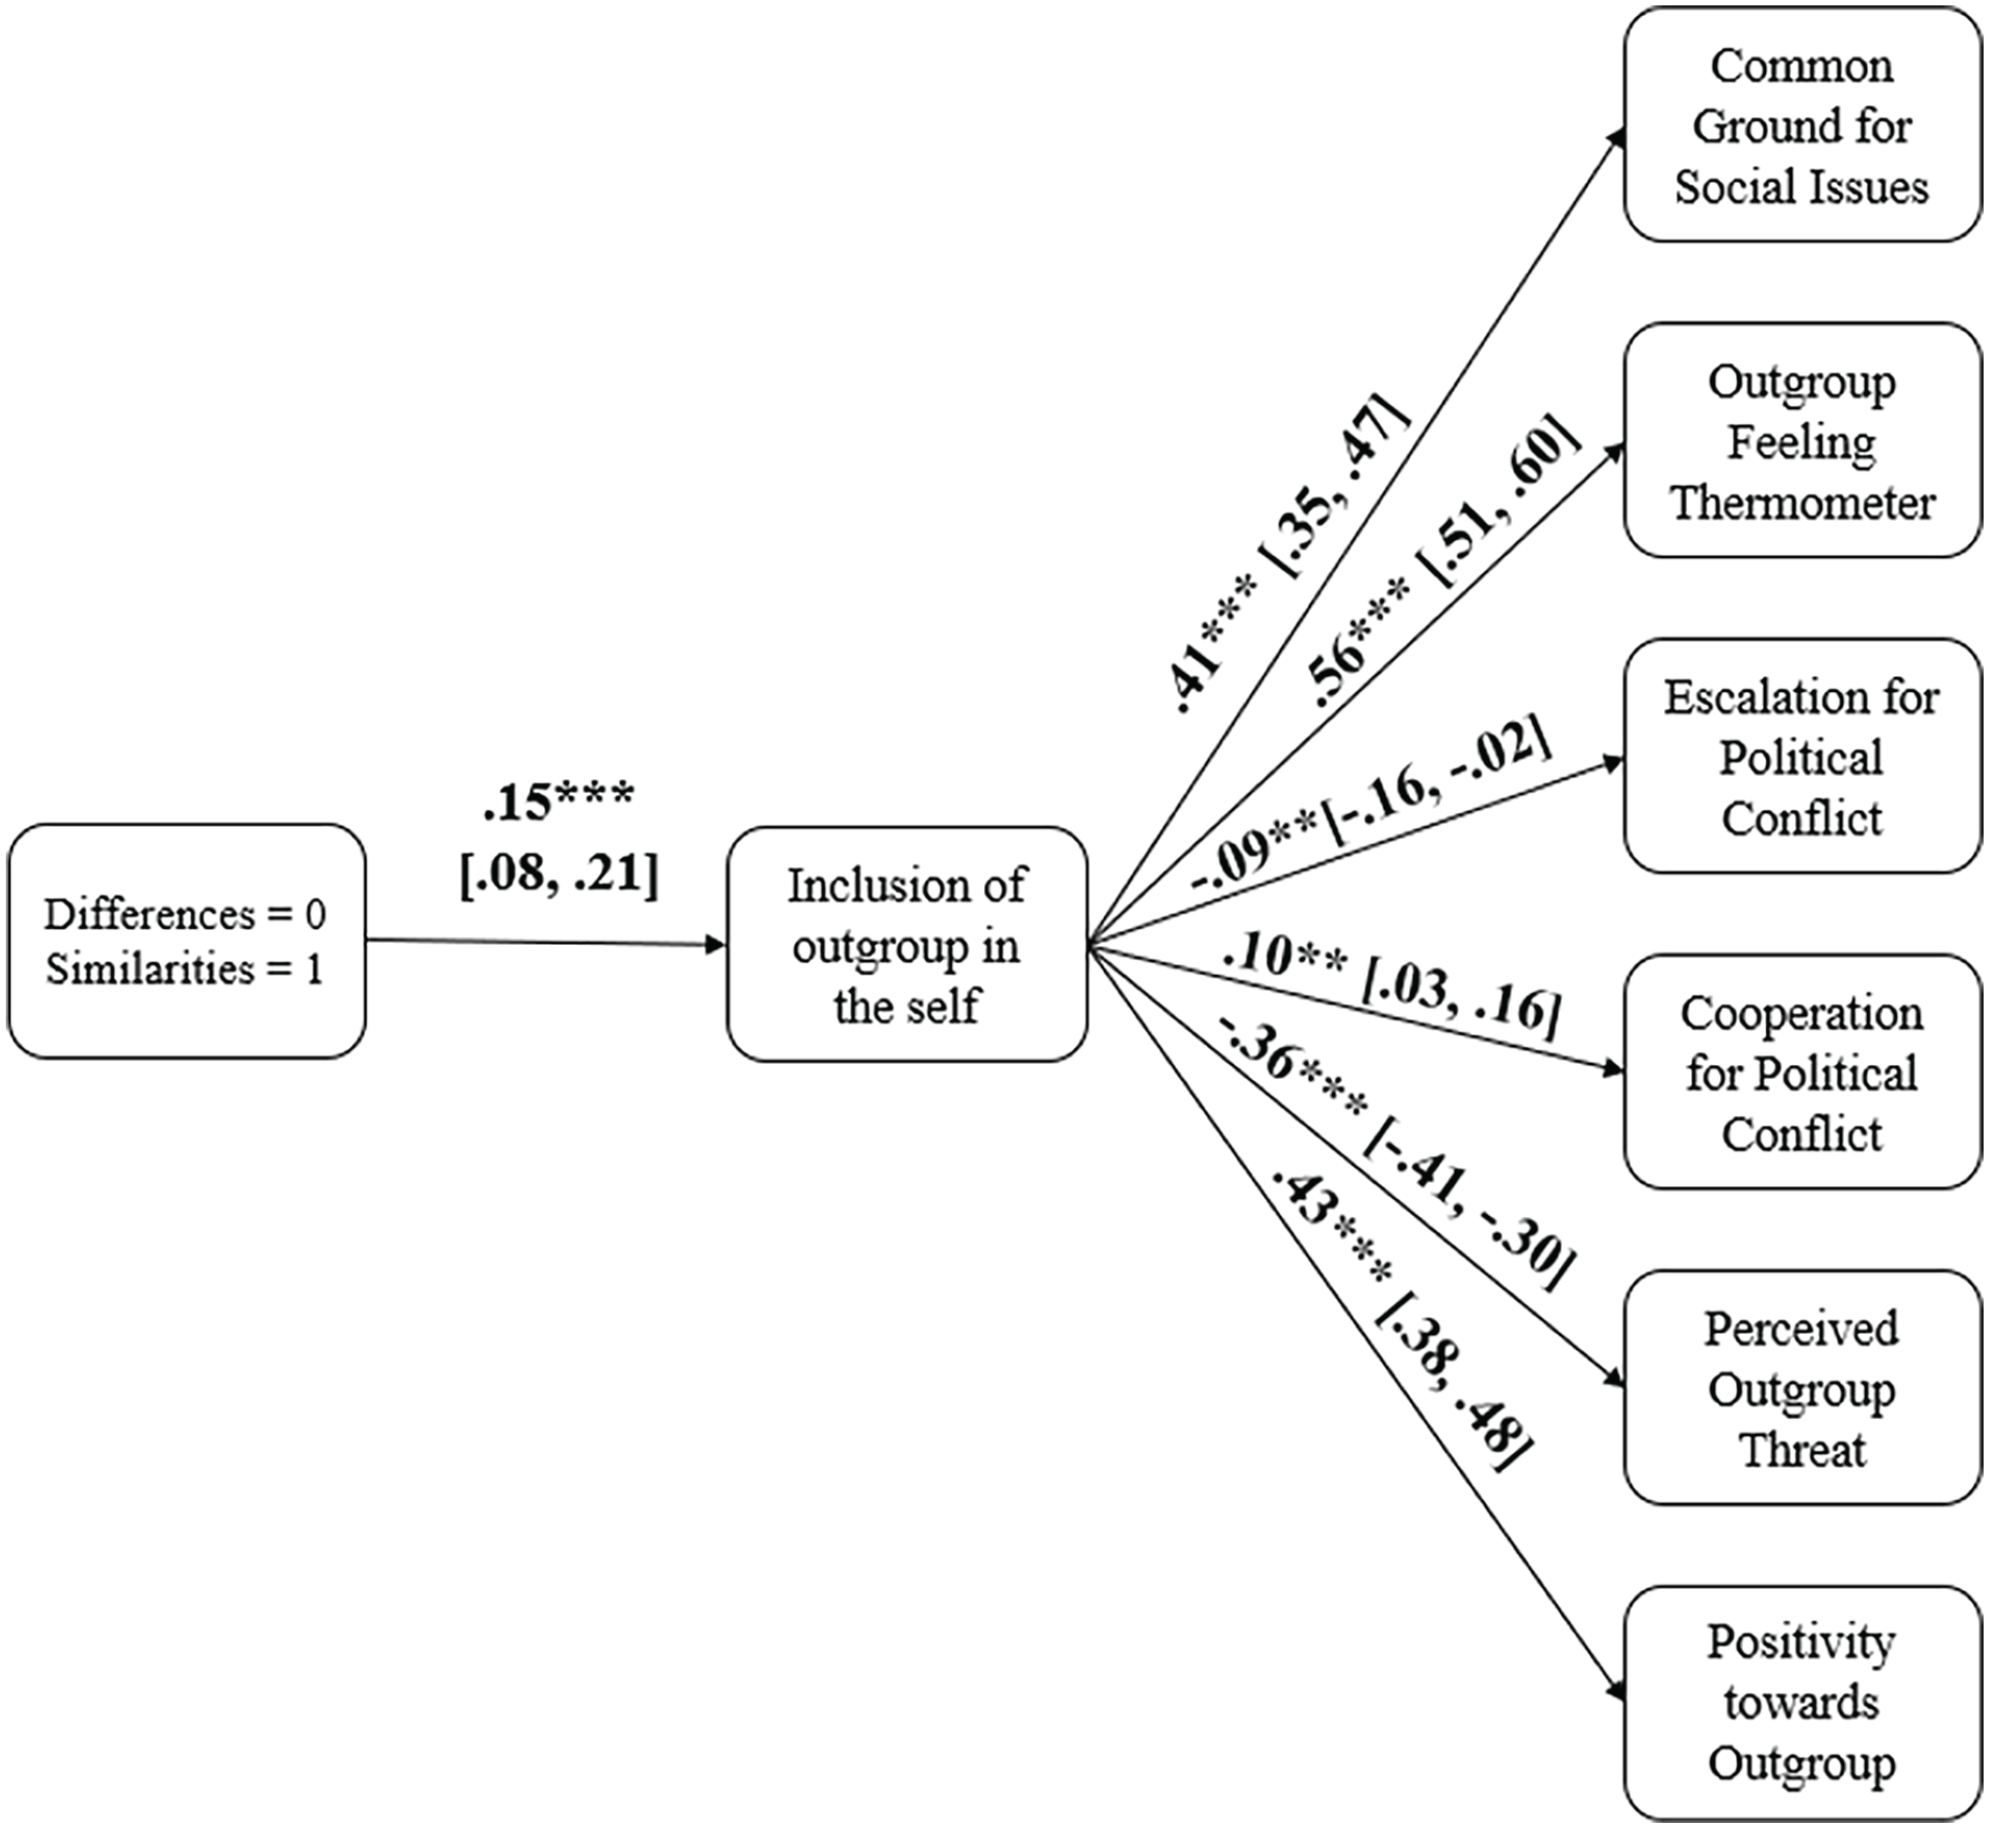
Path Model for the Indirect Effect of Condition Via Increased Inclusion of the Outgroup in the Self on Attitudes Toward and Perception of the Political Opposition for Study 1.
Indirect Effects of Condition Via Increased Inclusion of the Outgroup in the Self for Study 1.
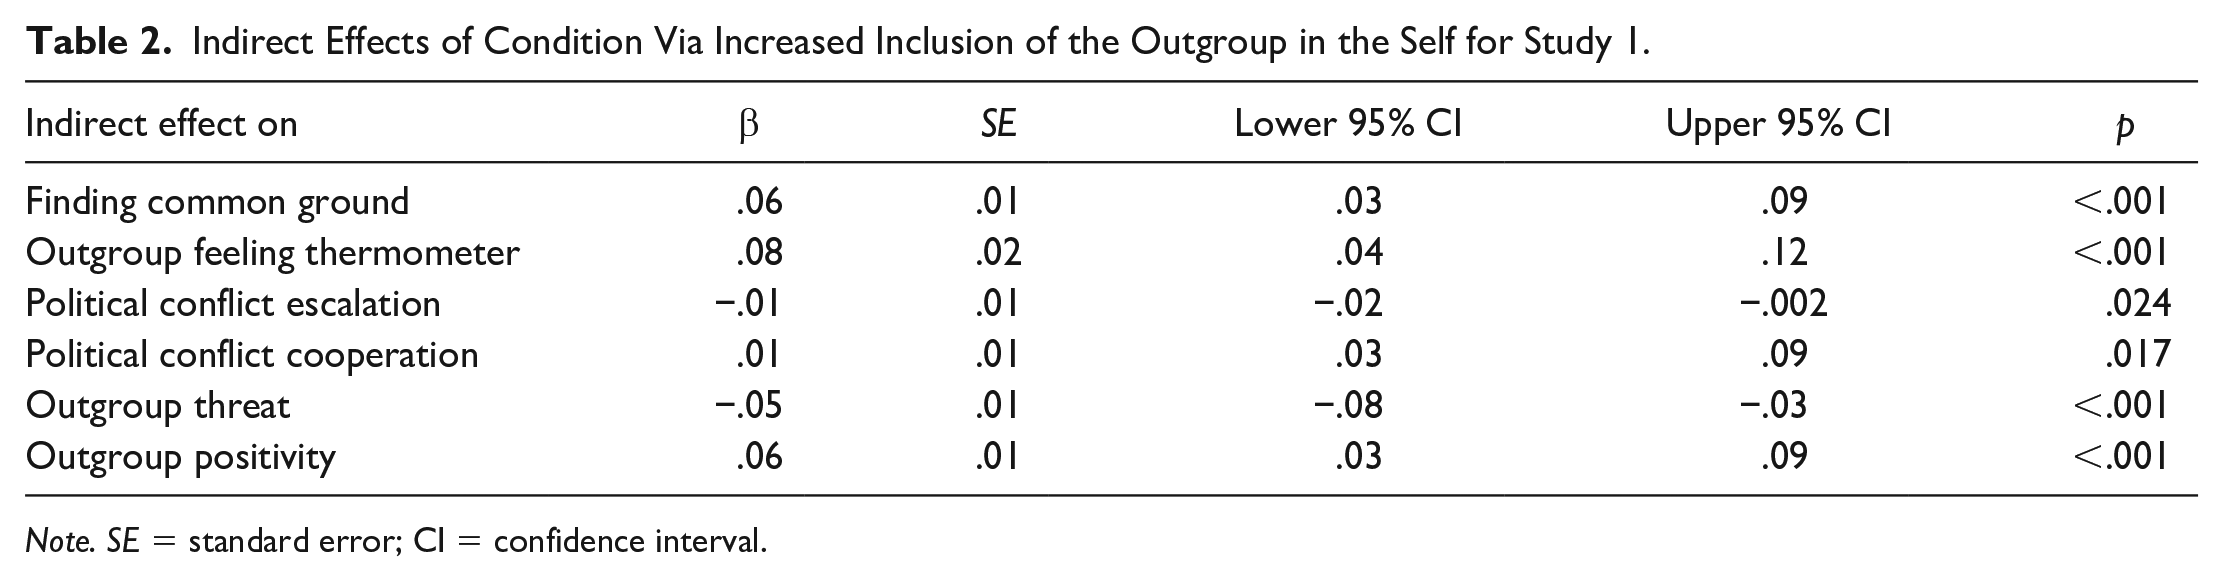
Note. SE = standard error; CI = confidence interval.
Discussion
Our first experimental study conceptually replicated the findings of Hanel et al. (2019). Even in a highly polarized environment such as the political context of the United States, the presentation of scientific evidence as intergroup similarities, rather than differences, directly and indirectly lead to increased intergroup positivity and harmony. Importantly, this effect might have been inflated due to the fact that the y axis on the differences condition was restricted (i.e., it did not display the whole range of values from a minimum of 1 to a maximum of 9). Our next study sought to remedy this issue.
Study 2
Our second experiment sought to replicate these findings. It also sought to extend them by using a more rigorous differences condition which would showcase the full range of possible values in the bar graphs, rather than the superimposed range that was used in Study 1. Furthermore, we also controlled for potential covariates to ensure that our effect was not due to some potential alternative explanation.
Method
Participants
We based our sample on that of Study 1. Data collection was conducted during December 2020, following the U.S. presidential election. We preregistered this experiment (https://aspredicted.org/blind.php?x=r75sh6). After excluding participants who were not U.S. citizens (N = 12), who did not take the survey seriously enough (N = 23), who missed attention checks to either condition’s stimuli (N = 70), and who were multivariate outliers based on their responses to our survey’s measures (N = 6), 813 participants remained in our sample. In the final sample, 507 participants were female, 299 were male, 6 were nonbinary, and 1 did not provide a response. In terms of race, the majority of the sample was White (N = 522), 164 were BIPOC, and 127 did not provide a response or provided an uncodable response. The average age was 41.27 years (SD = 13.78), and the average political ideology tended to be moderate (M = 4.33, SD = 2.29).
Procedure
Participants were again recruited on MTurk via CloudResearch. An identical process as Study 1 was employed, with the only difference being the range of values on the y axes in our differences condition stimulus, which now included the full 1–9 range. The revised stimulus used in the differences condition is shown in Figure 3.
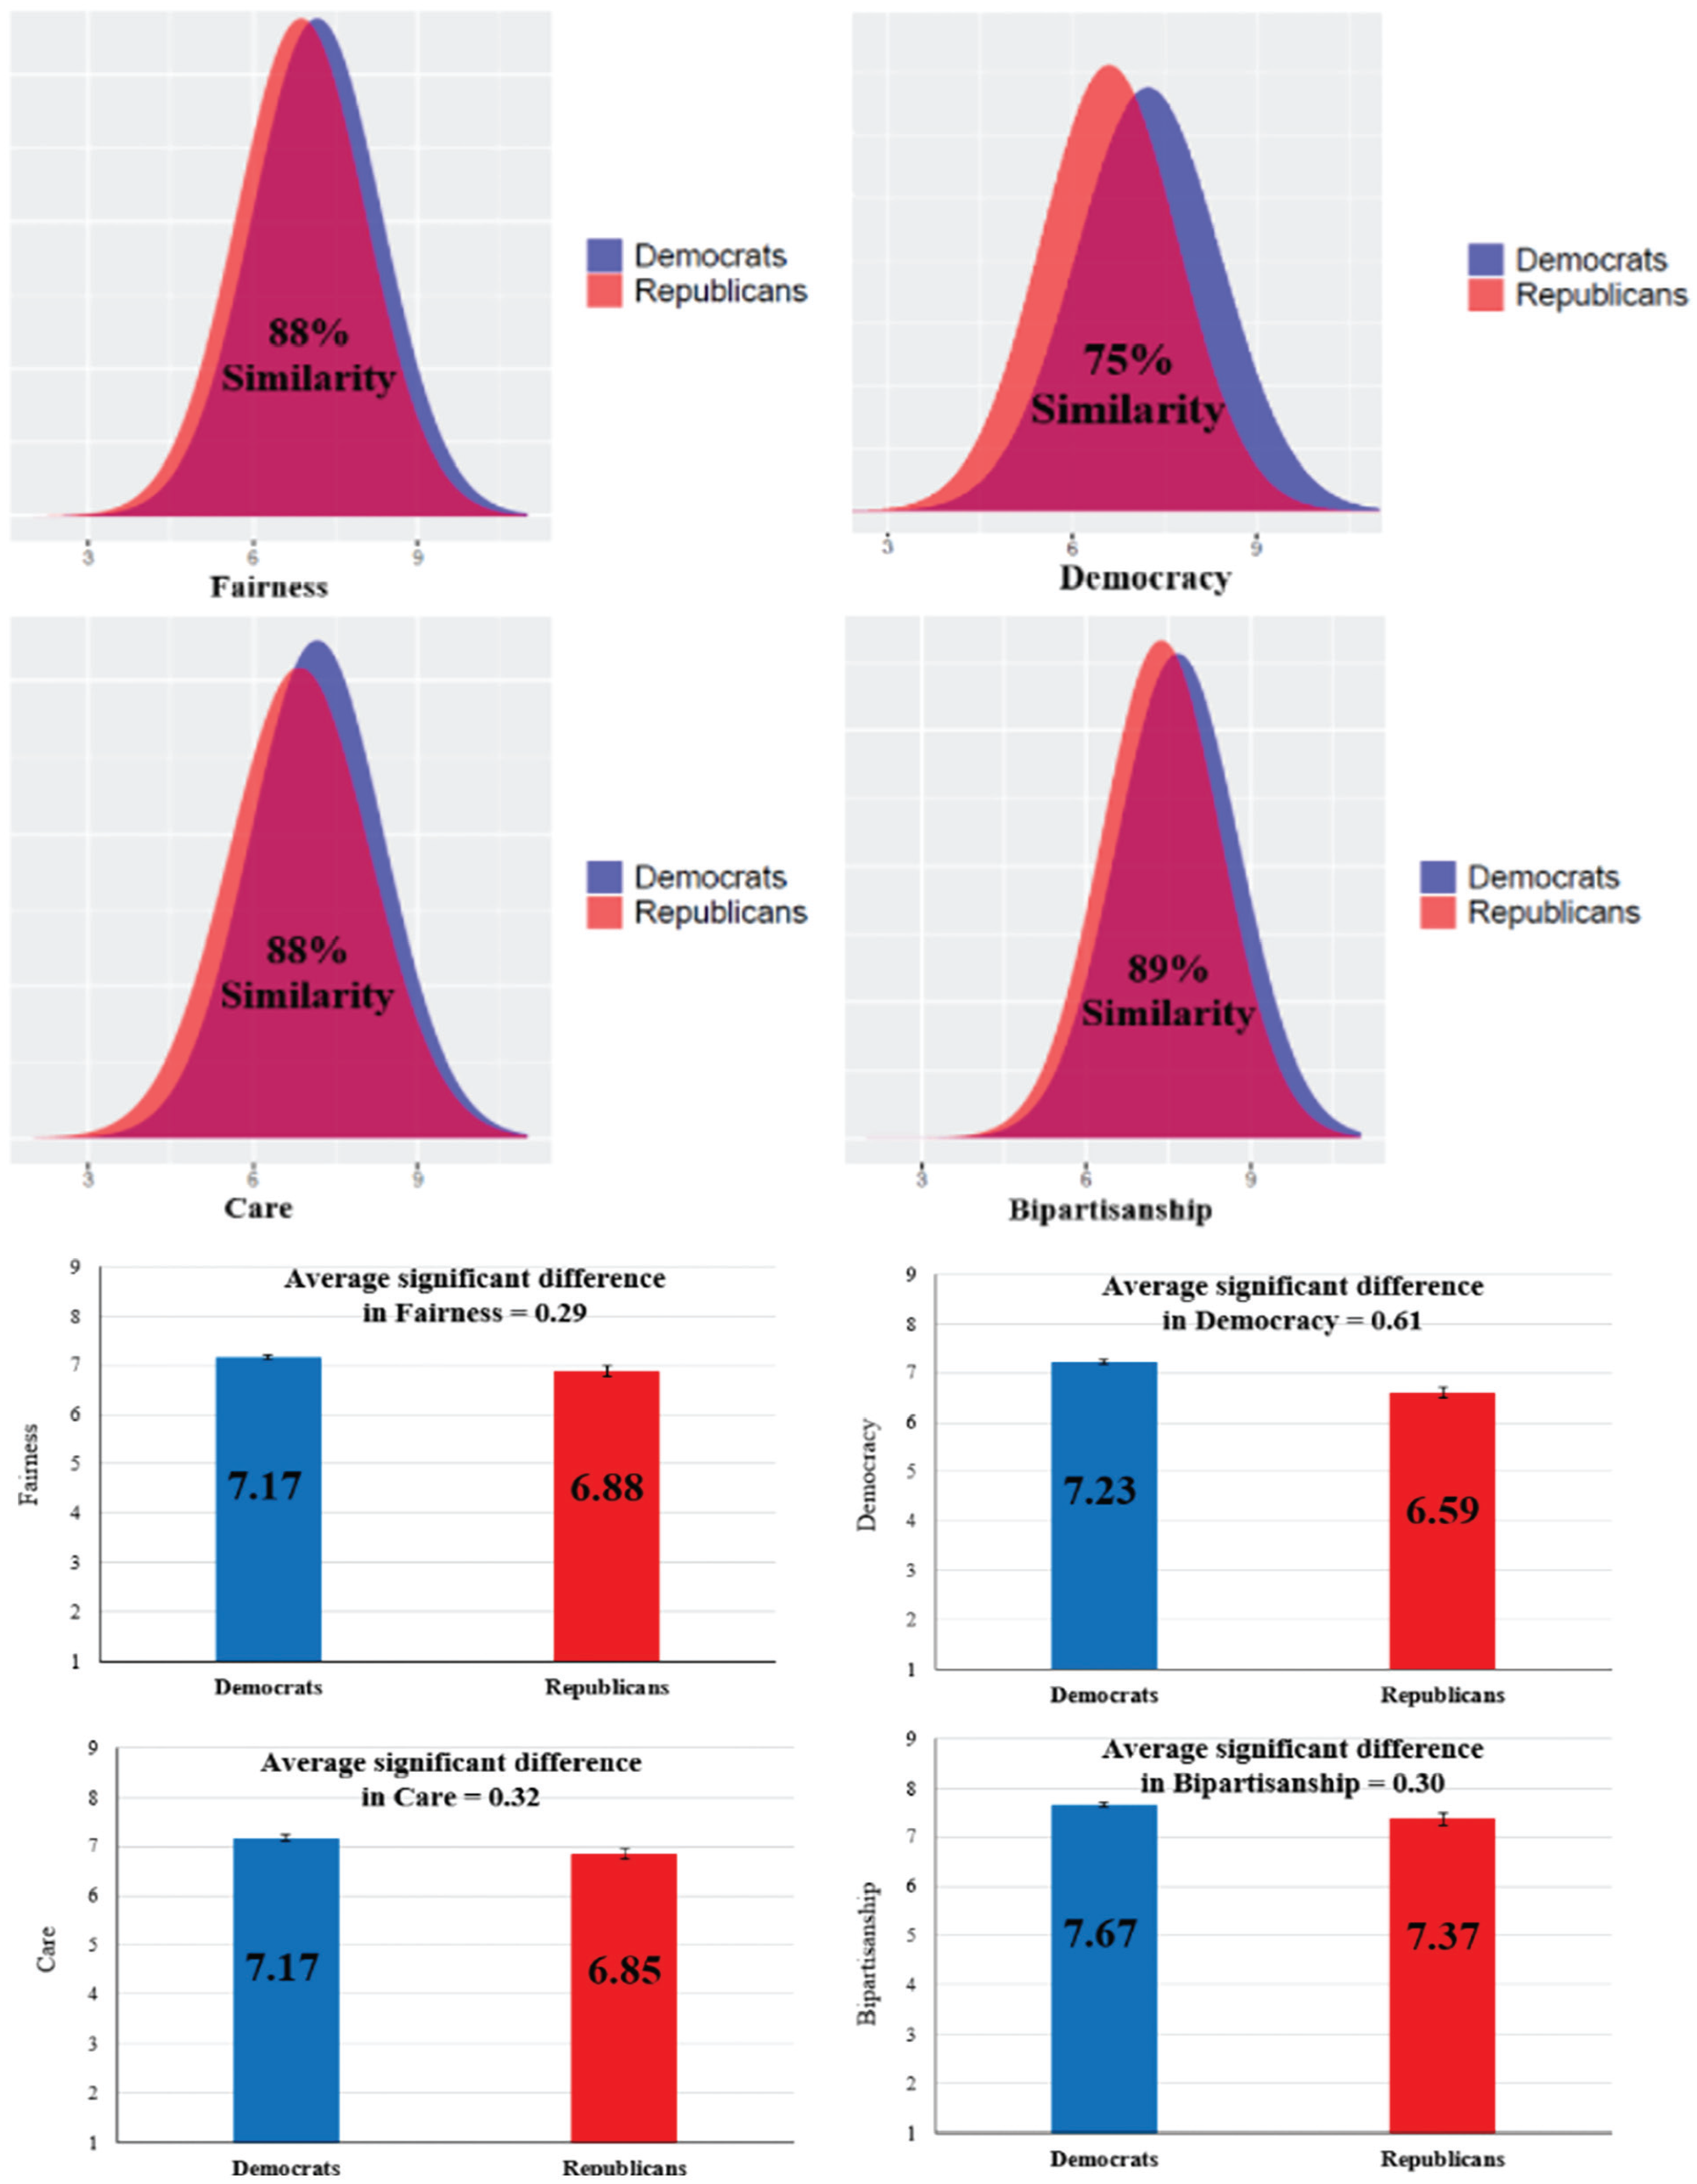
Graphs Used in the Similarities (Superimposed Normal Distribution; Top) and Differences Condition (Bar Graphs With Standard Errors; Bottom) in Studies 2–5.
Measures
The following measures were identical to Study 1: (a) the manipulation checks, (b) inclusion of outgroup in the self, (c) feeling thermometers, (d) perceived outgroup threat, (e) positivity toward the outgroup, (f) finding common ground on major social issues, and (g) conservative political ideology. All these measures had great reliability (as > .90).
We added three new measures: an eight-item measure of social desirability (eight items, a = .71; Paulhus, 1988), a measure of scientific knowledge (seven items, a = 47, e.g., “all radioactivity is man-made.”), 1 and a measure of acceptance of the 2020 presidential election results (seven items created by the research team, a = .97, e.g., “To what degree do you believe that President Trump should concede the 2020 presidential election to ensure a peaceful transition of power?”). The first two measures were included in this study to be used as covariates in our analyses. The measure pertinent to the 2020 presidential elections was added as an exploratory measure specifically for Republican/conservative participants in our study with the rationale that if Republicans/conservatives consider themselves as more similar to Democrats, that might increase their acceptance of the 2020 presidential election results, which saw Joe Biden winning against Donald Trump.
Results
After testing the efficacy of our manipulation, we computed general linear models in which the effect of age, education, income, scientific knowledge, and social desirability was accounted for. The means, standard deviations, and results without covariates for these analyses are given in Table 3.
Means and SDs by Condition for Study 2.
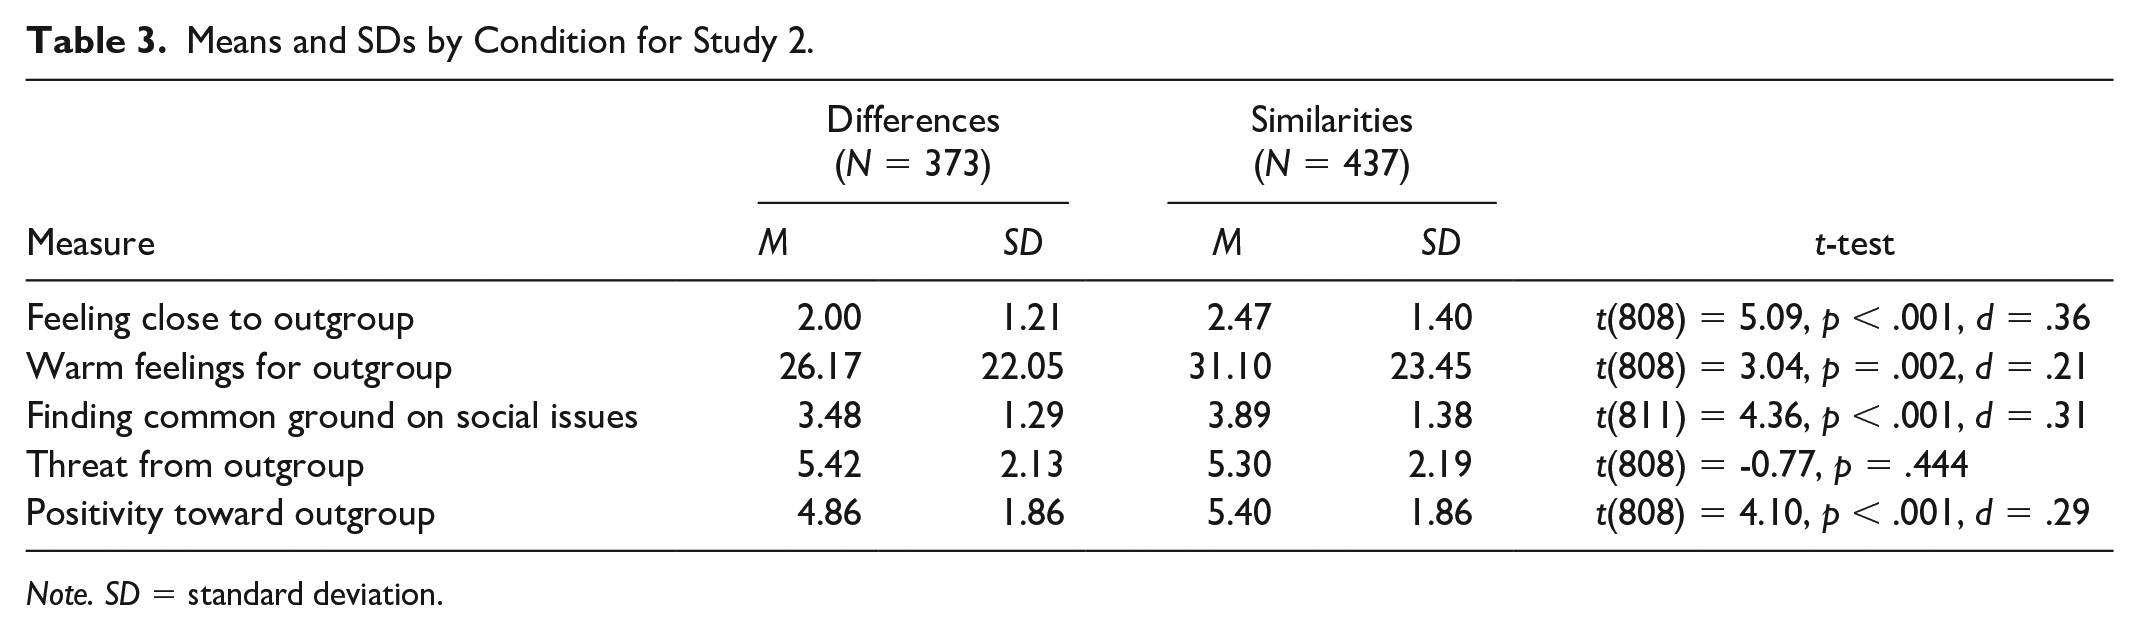
Note. SD = standard deviation.
Main Effects on Perceived Similarity
Participants in the similarities condition reported significantly more similarities between Republicans and Democrats than participants in the differences condition: F(1, 811) = 288.11, p < .001, = .262, 95% CI = [.213, .310].
Main Effects on Inclusion of Outgroups
Controlling for all covariates, participants in the similarities condition reported that the political opposition was significantly closer to them than participants in the differences condition: F(1, 801) = 25.11, p < .001,
Main Effects on Feelings Toward Outgroups
Controlling for all covariates, participants in the similarities condition reported significantly warmer feelings toward the political opposition than participants in the differences condition: F(1, 804) = 9.35, p = .002,
Main Effects on Perceptions of Outgroups
Controlling for all covariates, participants in the similarities condition reported significantly greater positivity toward the political opposition than participants in the differences condition: F(1, 807) = 17.95, p < .001,
Main Effects on Support for Bipartisanship
Controlling for all covariates, participants in the similarities condition reported significantly greater inclination to find common ground for key social issues than participants in the differences condition: F(1, 804) = 19.21, p < .001,
Acceptance of 2020 Presidential Elections
Since the 2020 Presidential election was contentious, with Democrats accepting the results and Republicans considering them fraudulent, we used a 2 × 2 (manipulation level × partisan identity) general linear model. As expected, partisan identity had a significant effect: F(1, 804) = 928.83, p < .001,
Path Modeling
We estimated a model which conceptually replicated the same path model as Study 2. This model provided a good fit to the data: χ2 (4) = 14.22, p = .001, CFI = .993, RMSEA = .056, SRMR = .023. All direct (see Figure 4) and indirect effects (see Table 4) were significant and in the expected direction.
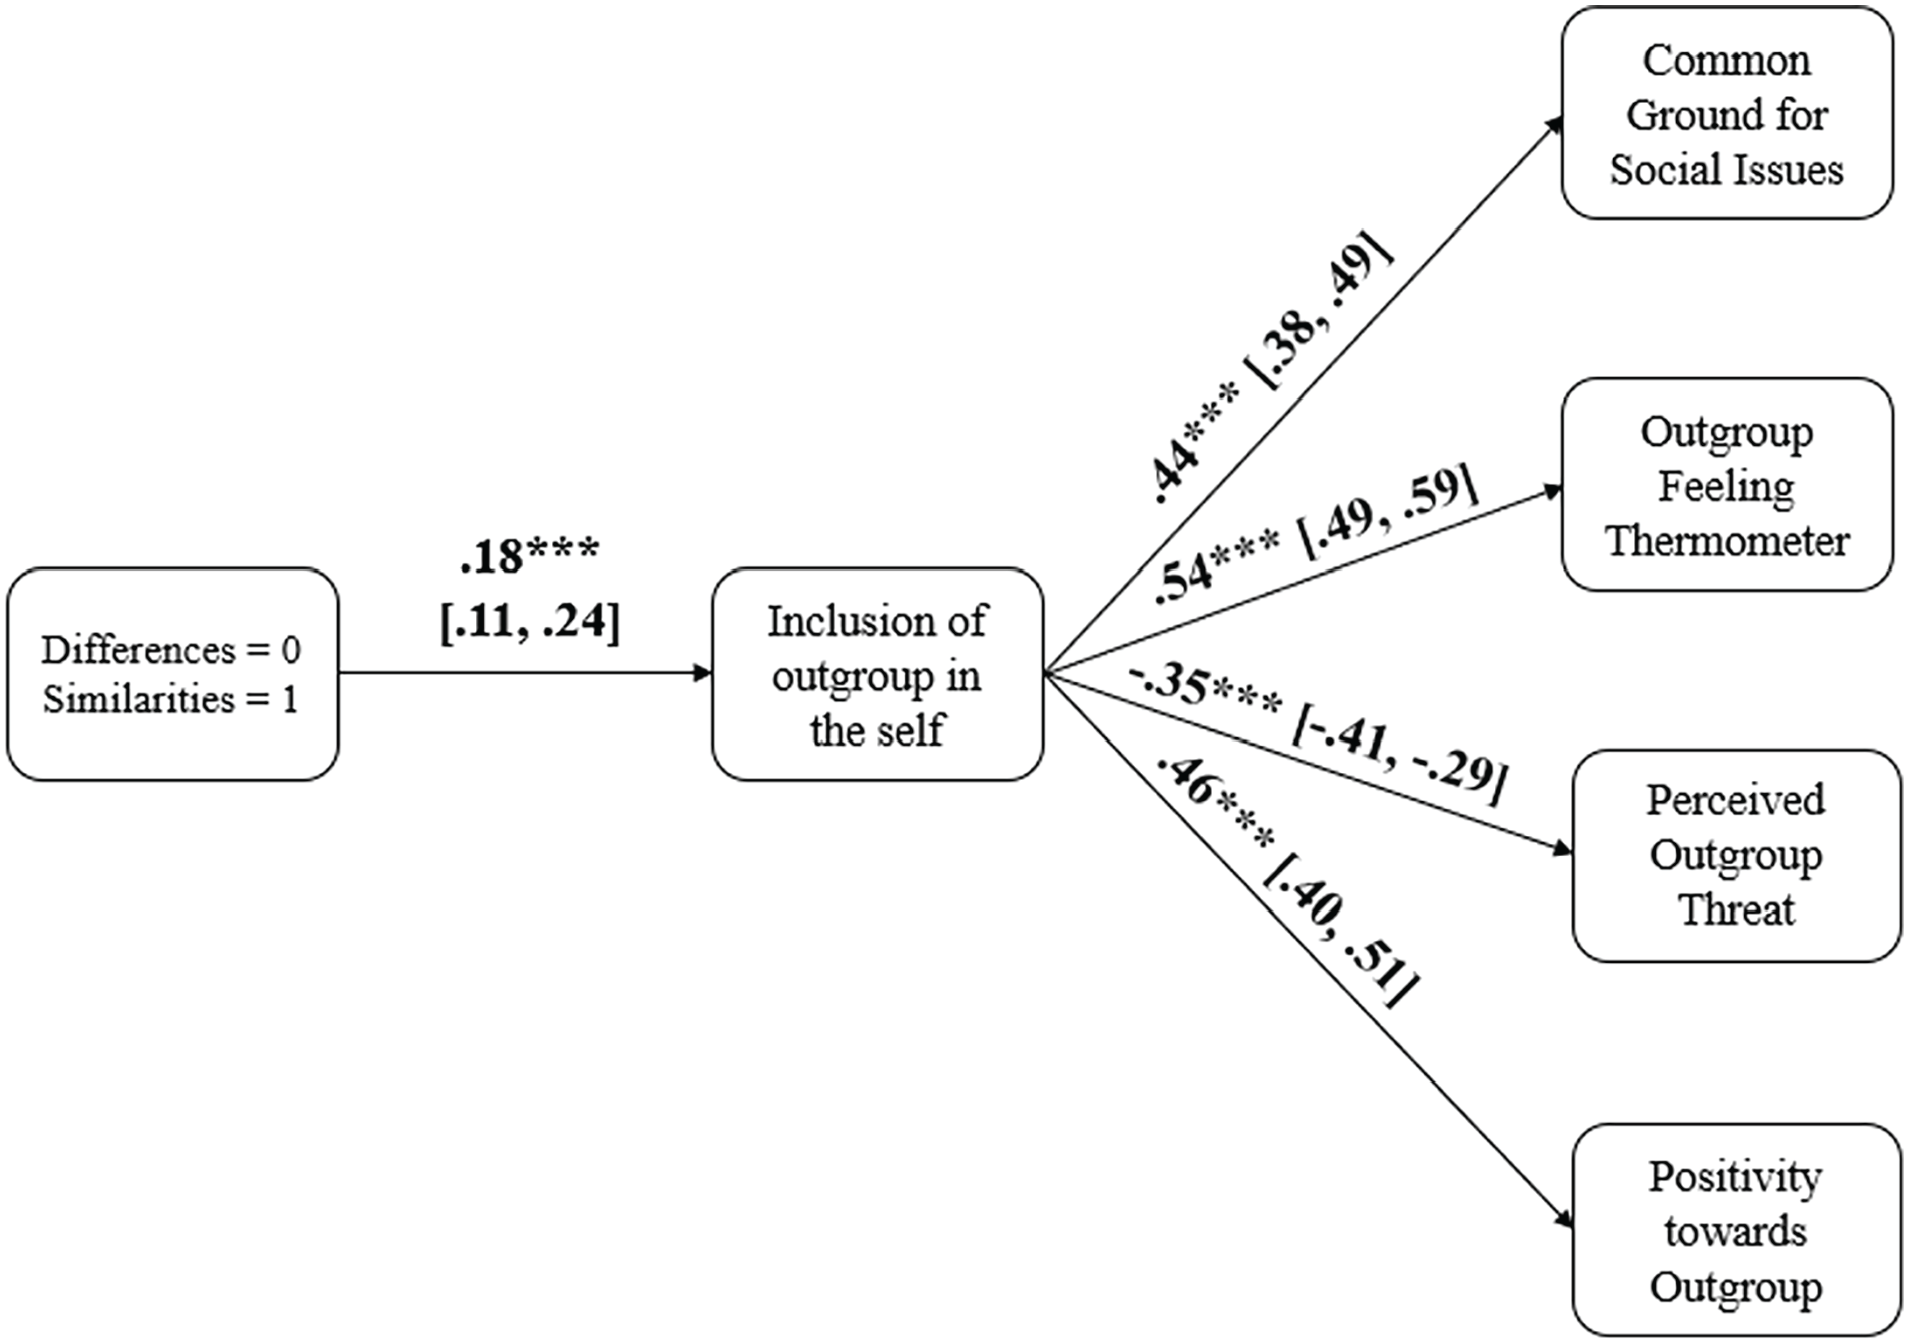
Path Model for the Indirect Effect of Condition via Increased Inclusion of the Outgroup in the Self on Attitudes Toward and Perception of the Political Opposition for Study 2.
Indirect Effects of Condition via Increased Inclusion of the Outgroup in the Self for Study 2.
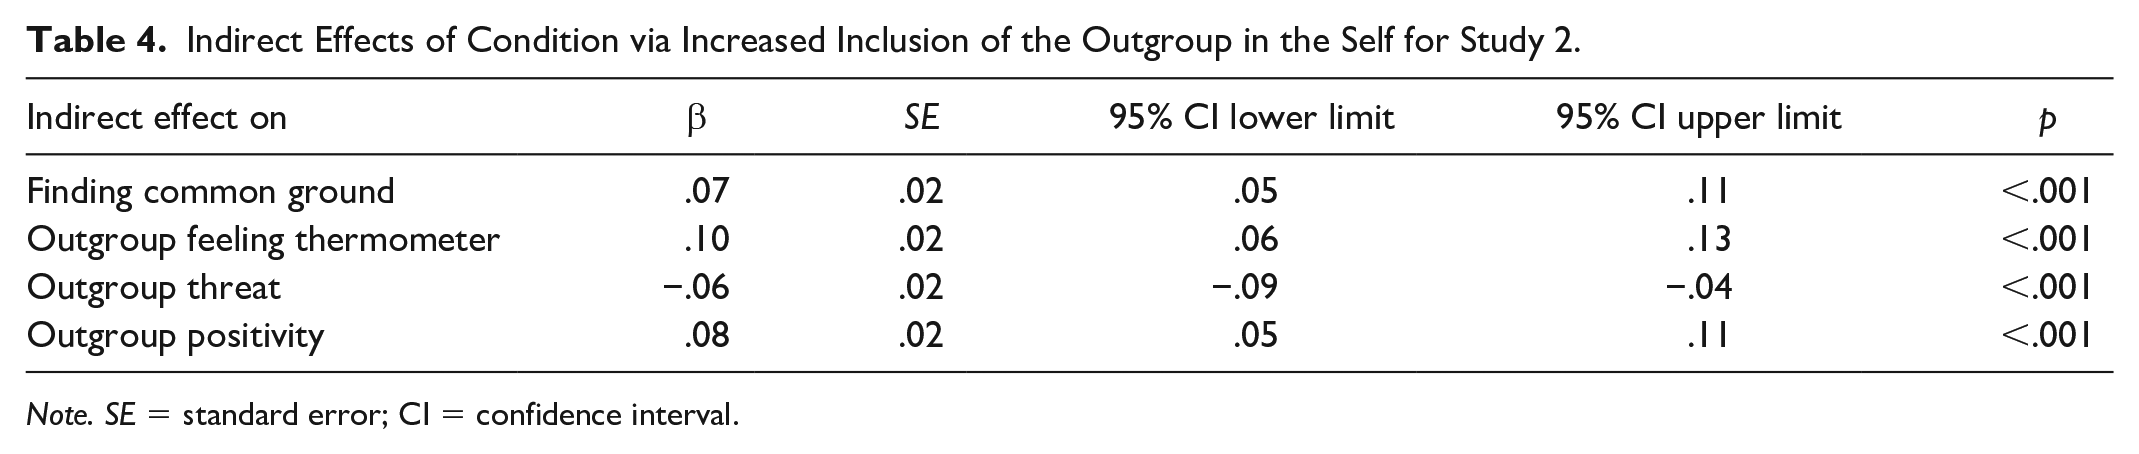
Note. SE = standard error; CI = confidence interval.
Discussion
Study 2 replicated the results of Study 1. Furthermore, it ensured that the scale of the differences condition, social desirability, and scientific knowledge did not influence our hypothesized pattern of results. These results further demonstrate that focusing on similarities rather than differences can promote greater intergroup harmony in the political sphere. In fact, our results suggest that it could also potentially increase Republicans’ acceptance of the 2020 presidential elections results, even though these were highly contested by Republicans.
Study 3
In our third experiment (which was not preregistered), our aim was twofold. Our primary goal was to examine whether highlighting evidence that showcase similarities in the attitudes and beliefs of Republicans and Democrats can improve prosociality toward the political opposition. Second, we sought to replicate our previous findings in a third sample to be able to make a more generalizable claim about the psychological influences that being exposed to information about intergroup similarity can have on members of different political parties.
Participants
We based our sample on that of Studies 1 and 2. After excluding participants who were not U.S. citizens (N = 11), who did not take the survey seriously enough (N = 31), who missed attention checks to either condition’s stimuli (N = 60), and who were multivariate outliers based on their responses to our survey’s measures (N = 4), 818 participants remained in our sample. In the final sample, 314 participants were male, 502 were female, and 2 were nonbinary. In terms of race, the majority of the sample was White (N = 516), 146 were BIPOC, and 156 did not provide a response or provided an uncodable response. The average age was 40.27 years (SD = 13.44), and the average political ideology tended to be moderate (M = 4.41, SD = 2.37).
Procedure
Participants were again recruited through the use of CloudResearch, during March 2021. An identical process as Study 2 was employed, with the addition of two game tasks. Participants were randomly assigned to the intergroup similarities (N = 444) or the intergroup differences condition (N = 374). 2 First, they provided some initial demographic information. Then they followed the same procedure as Study 2 with regards to the stimuli focusing on presenting real data on the psychology of Republicans and Democrats. Participants then either completed all outcome measures or they participated in two game tasks (this order was randomized). The first task they completed was the Dictator’s game (Forsythe et al., 1994), followed by the Ultimatum game (Güth et al., 1982) in a fixed order.
For both tasks, participants were instructed that they would be presented with two fictional scenarios. In the first scenario (i.e., Dictator’s game), participants were asked to imagine the following scenario: “You have been given a prize of $10,000. The money is yours now, but you can choose to share none, some, or all of it with another MTurker who is a [demonym].” The target outgroup in this task was always a member of the opposing political party. Participants were able to keep all US$10,000 for themselves and were also given the choice of giving away multiples of US$2,000 (all the way up to giving away all US$10,000) to the outgroup member. In the second task (i.e., Ultimatum game), participants were given the following instructions: In this situation, imagine that there is $10,000 of prize money. Unlike in the previous situation, the money is not yours yet. To receive some of the prize money, you have to talk to another MTurker and make a proposal to them on how to split the money between the two of you. The only information that you have about the other MTurker is that they are a [demonym]. This [demonym] MTurker can either refuse or accept your proposal. If the [demonym] MTurker accepts your proposal, you would both receive the amounts that you proposed. If the [demonym] MTurker refuses your proposal, neither of you receive anything.
Participants were given the same six options as the Dictator’s game (i.e., giving US$0/keeping US$10,000, all the way up to giving US$10,000/keeping US$0, with choices in between for each US$2,000). Finally, participants were also asked to report what in their thought would have to be the minimum amount that they would have to give to the outgroup member to ensure that they accepted the participant’s offer (importantly this amount could but did not have to be the same as the amount they proposed to give to the outgroup MTurker earlier in the task). 3
Measures
The following measures were identical to those in Studies 1 and 2: (a) the manipulation checks (a = .96), (b) inclusion of outgroup in the self, (c) feeling thermometers, (d) finding common ground on major social issues (a = .90), (e) scientific knowledge (a = .57), and (f) conservative political ideology (a = .92).
The measure of acceptance for the 2020 presidential elections was shortened from seven items to four (a = .97). Finally, we also added a measure of support for national unity (five items created by the research team presented on a 1–9 slider scale; a = .83, e.g., “With time Americans will come together despite the current political divide.”).
Results
We replicated the analytical process of our previous experimental studies. After testing the efficacy of our manipulation, we computed general linear models in which the effect of age, education, income, scientific knowledge, and social desirability was accounted for. The means, standard deviations, and results without covariates for these analyses are given in Table 5.
Means and SDs by Condition for Study 3.
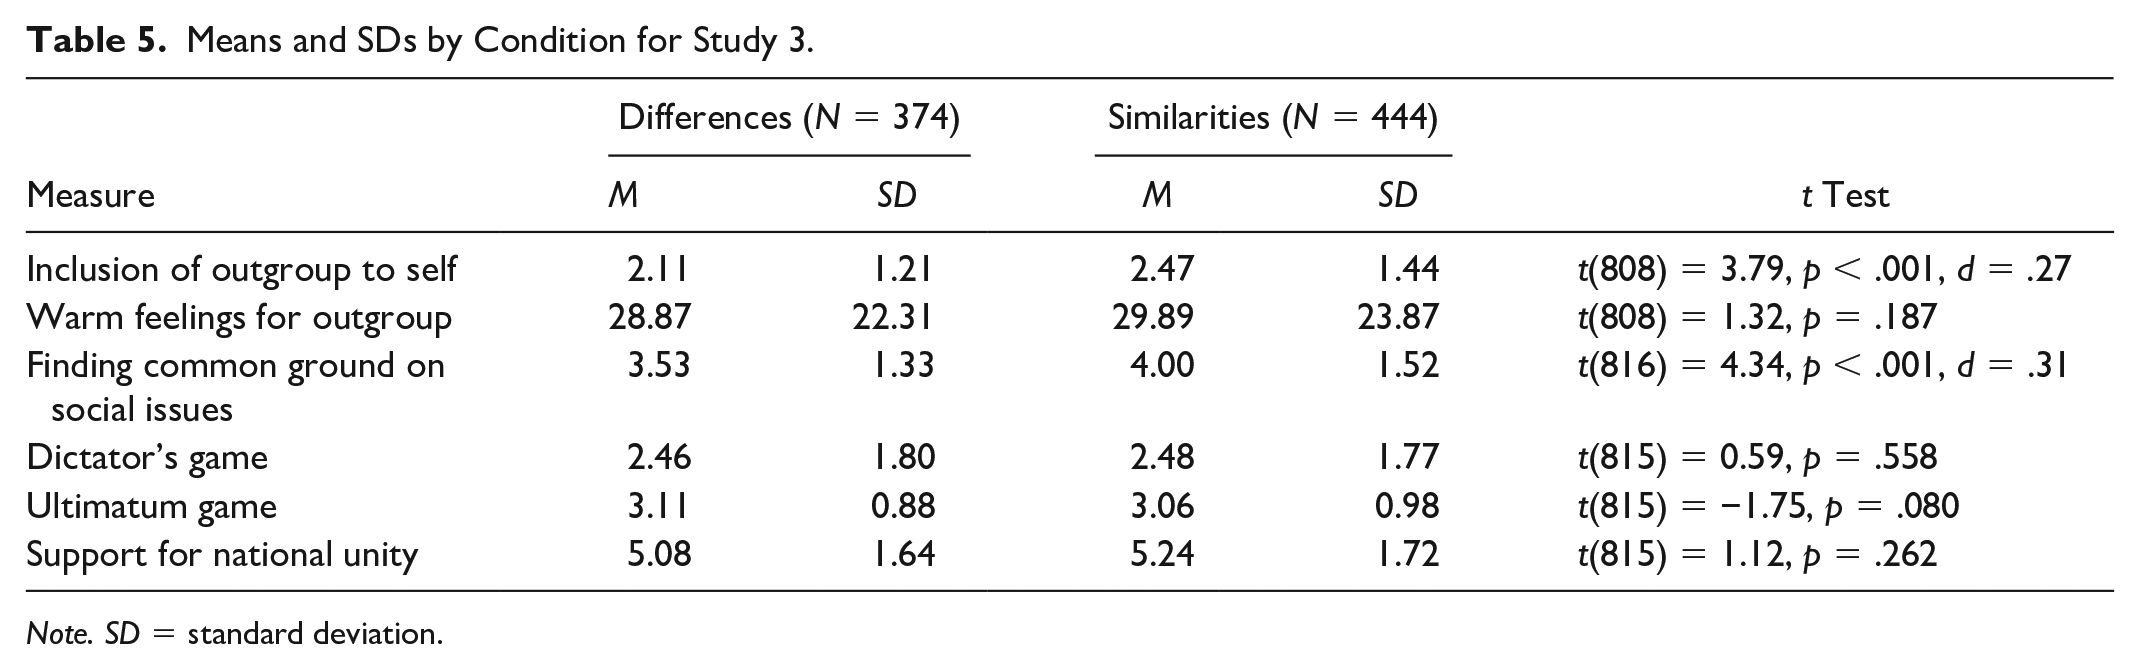
Note. SD = standard deviation.
Main Effects on Perceived Similarity
Participants in the similarities condition reported significantly more similarities between Republicans and Democrats than participants in the differences condition: F(1, 816) = 510.98, p < .001,
Main Effects on Inclusion of Outgroups
Controlling for all covariates, participants in the similarities condition reported significantly greater inclusion of the political opposition in their selves than participants in the differences condition: F(1, 810) = 13.41, p < .001,
Main Effects on Feelings Toward Outgroups
Controlling for all covariates, although participants in the similarities condition reported descriptively warmer feelings toward the political opposition than participants in the differences condition, this effect was not significant: F(1, 810) = 1.38, p = .241,
Main Effects on Support for Bipartisanship
Controlling for all covariates, participants in the similarities condition reported significantly greater inclination to find common ground for key social issues than participants in the differences condition: F(1, 762) = 22.16, p < .001,
Main Effect on Support for National Unity
Controlling for all covariates, no significant main effect emerged for support for national unity: F(1, 762) = 1.52, p = .218,
Acceptance of 2020 Presidential Elections
In an effort to replicate the significant manipulation level × partisan identity interaction of Study 2 for the acceptance of the 2020 presidential election results, we estimated an identical general linear model. No significant main effect—F(1, 765) = 1.59, p = .208,
Main Effects for the Game Tasks
Controlling for all covariates, no significant effect was observed for decisions made in the Dictator’s game (F(1, 762) = 0.04, p = .836,
Path Modeling
Once again, we conceptually replicated our model tested in Studies 1 and 2. This model provided a good fit to the data: χ2 (3) = 17.46, p < .001, CFI = .981, RMSEA = .079, SRMR = .028. All direct (see Figure 5) and indirect effects (see Table 6) were significant and in the expected direction. When controlling for key demographic covariates, all paths remain significant (see Supplemental Materials).
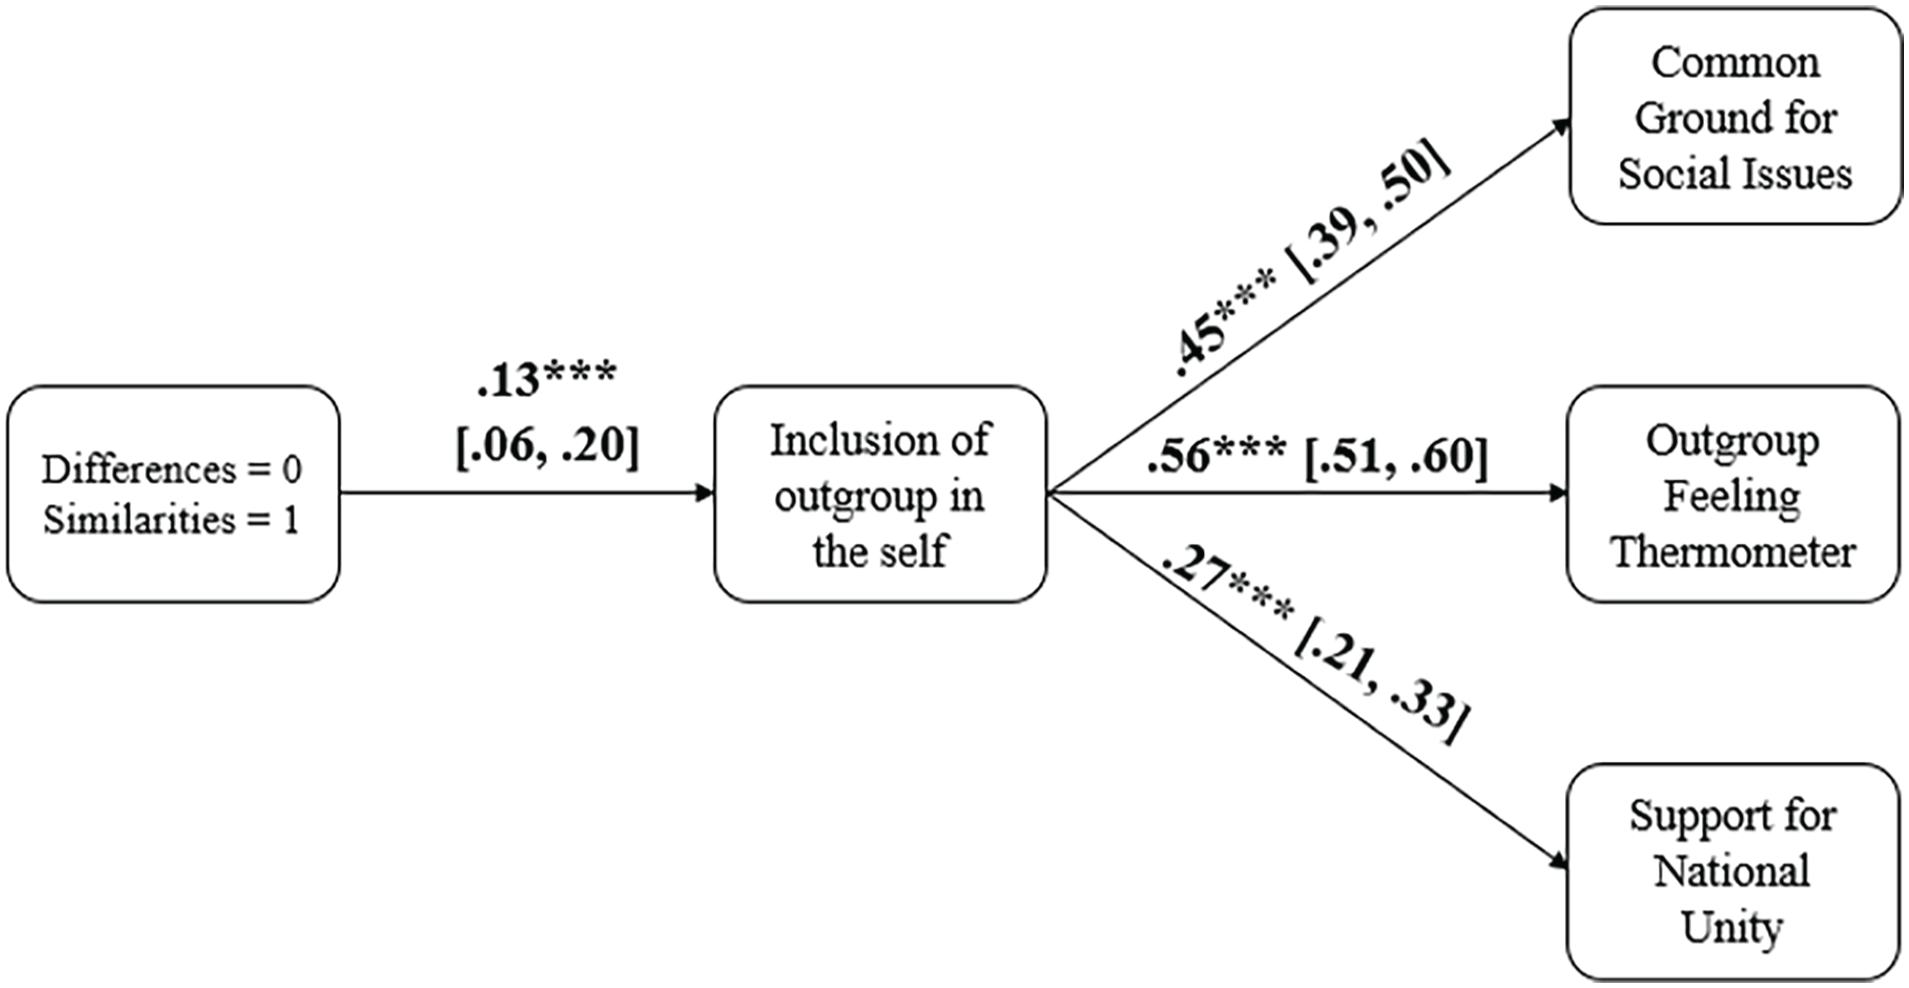
Path Model for the Indirect Effect of Condition via Increased Inclusion of the Outgroup in the Self on Attitudes Toward and Perception of the Political Opposition for Study 3.
Indirect Effects of Condition via Increased Inclusion of the Outgroup in the Self for Study 3.
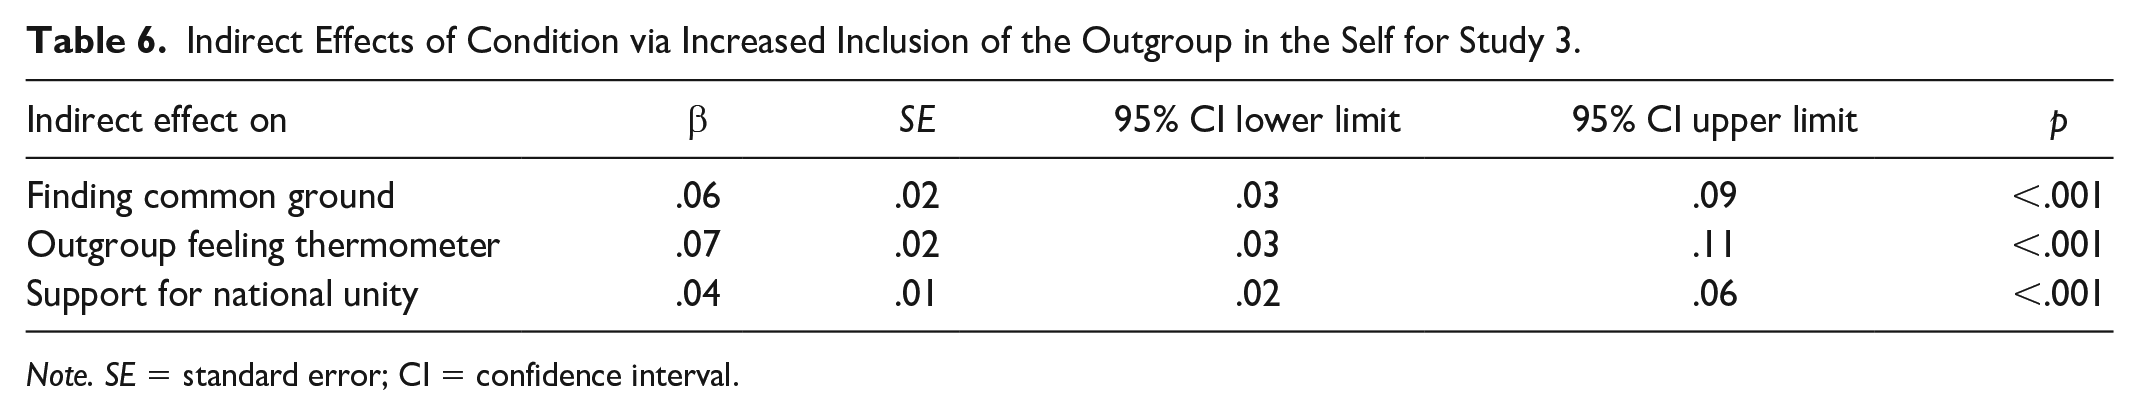
Note. SE = standard error; CI = confidence interval.
Discussion
Study 3 partially supported our hypotheses. It illustrated that being presented with the same information about the attitudes of Republicans and Democrats in the form of similarities rather than differences between the groups increased intergroup harmony. Furthermore, and in line with Studies 1 and 2, the underlying mechanism that emerged was that of increased inclusion of the outgroup in oneself. However, certain results did not replicate. In particular, the effects for the increased acceptance of the 2020 presidential elections for Republicans were now nonsignificant. In addition, we did not find an effect in any of the two experimental games assessing intergroup trust and cooperation. Considering that this study was conducted relatively soon (temporally) after the January 6th insurrection, it is possible that animosity was too high for such a manipulation to be directly effective. Evidence from large and nationally representative surveys showcasing differential responses to the January 6th incident lends support to this claim (Hartig, 2021). Furthermore, for our experimental games, we focused on a scenario that involved a hypothetical payment, thus limiting the efficacy of our outcome measures.
So far, our results highlight that an emphasis on similarities relative to differences seems to increase inclusion of the political opposition in oneself, the overall perception of how similar members of both parties are, and how likely members of both parties think it is to find common ground for major social issues. However, more inconsistent results emerge for other outcomes. Given this inconsistency in our results, in our next study, we sought to evaluate whether a focus on similarities rather than differences would result in an increased tendency to trust and potentially cooperate with the political opposition.
Study 4
In our fourth study, we were interested to examine whether emphasizing similarities and not differences can help increase intergroup cooperation. To that end, we included self-report measures of compromise with the political opposition and trust of the political opposition. This study was preregistered (https://aspredicted.org/blind.php?x=8dv3ze).
Method
Participants
We based our sample on that of Studies 1–3. After excluding participants who were not U.S. citizens (N = 17), who did not take the survey seriously enough (N = 8), who missed attention checks to either condition’s stimuli (N = 64), and who were multivariate outliers based on their responses to our survey’s measures (N = 10), 789 participants remained in our sample. In the final sample, 307 participants were male, 474 were female, and 8 were nonbinary. The majority of the sample was White (N = 543), 131 were BIPOC, and 115 did not provide a response/provided an uncodable response. The average age was 39.49 years (SD = 13.16), and the average political ideology tended to be moderate (M = 4.24, SD = 2.32).
Procedure
Participants were again recruited via CloudResearch during late May to early June 2021. An identical process as Studies 1–3 was employed. Participants were randomly assigned to the intergroup similarities (N = 429) or the intergroup differences condition (N = 360).
Measures
The following measures were identical to those of Studies 1–3: (a) the manipulation checks (a = .95), (b) inclusion of outgroup in the self, (c) feeling thermometers, (d) finding common ground on major social issues (a = .89), (e) scientific knowledge (a = .51), (f) conservative political ideology (a = .92), and (g) positivity toward the political opposition (αRepublicans = .93; αDemocrats = .91).
The following two measures were added: trust toward the political opposition (five items loosely adapted from Dhont & Van Hiel, 2011; e.g., “In general, I trust [DENONYM] to have a dialogue with other political parties with the potential to find common ground on policy issues.”; αRepublicans = .93; αDemocrats = .94) and compromise with the political opposition (five items adapted from Willis et al., 2017; e.g., “Compromising with [DENONYM] could lead to things that will enrich our country.” αRepublicans = .87; αDemocrats = .88).
Results
We followed the same analytical procedure as Studies 1–3. The means, standard deviations, and results without covariates for these analyses are given in Table 7.
Means and SDs by Condition for Study 4.
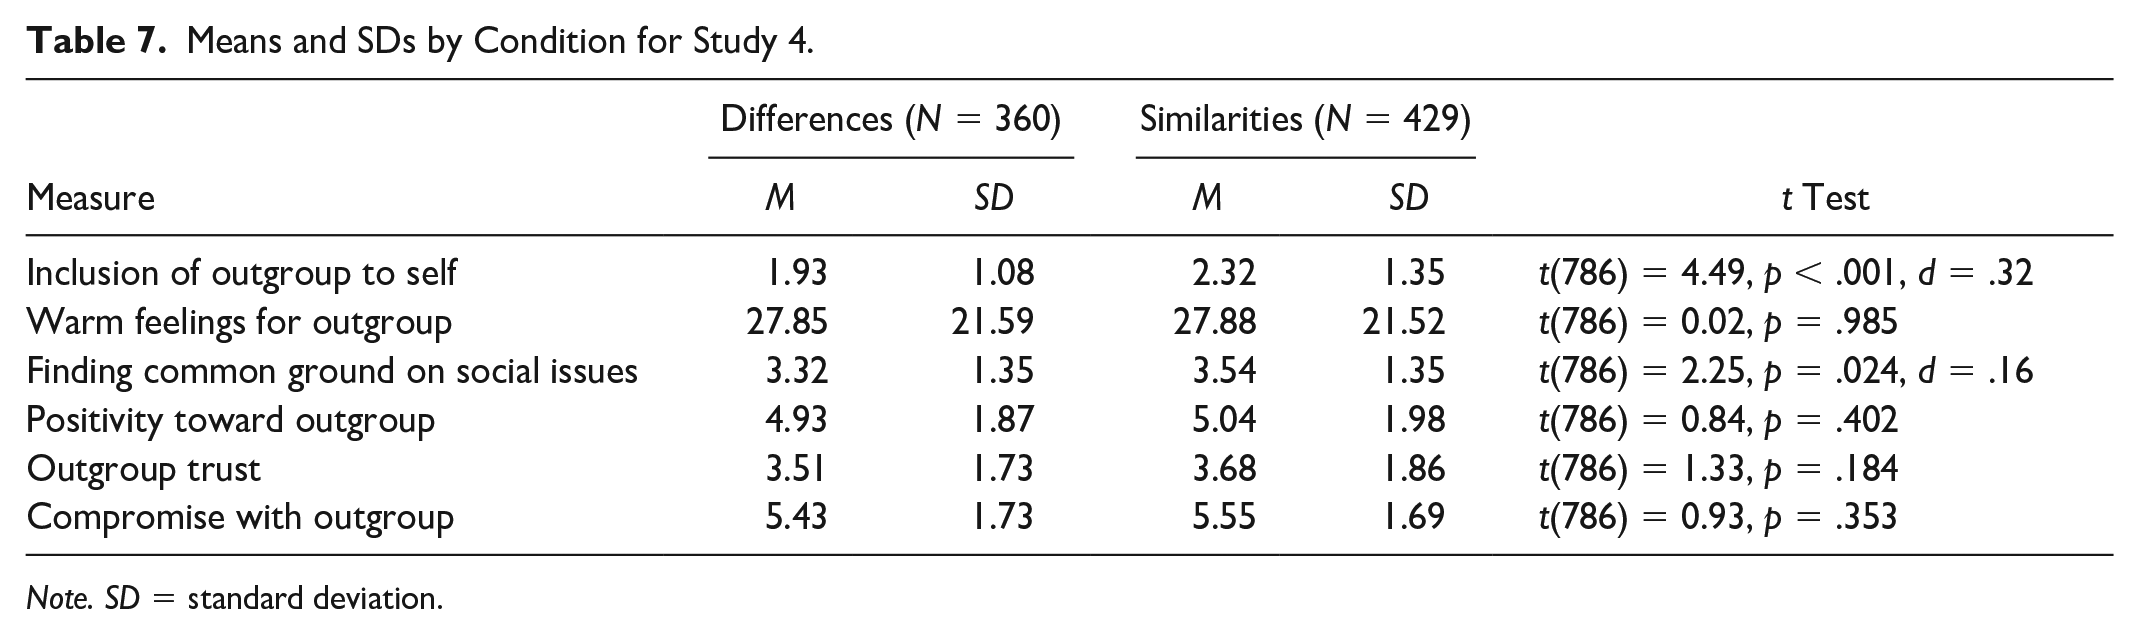
Note. SD = standard deviation.
Main Effects on Perceived Similarity
Participants in the similarities condition reported significantly more similarities between Republicans and Democrats than participants in the differences condition: F(1, 787) = 365.58, p < .001,
Main Effects on Inclusion of Outgroups
Controlling for the same covariates, participants in the similarities condition reported being significantly closer to the political opposition than participants in the differences condition: F(1, 782) = 21.58, p < .001,
Main Effects on Feelings Toward Outgroups
Controlling for all covariates, no significant effect emerged for the feeling thermometer: F(1, 783) = 0.01, p = .241,
Main Effects on Support for Bipartisanship
Controlling for all covariates, participants in the similarities condition reported significantly greater inclination to find common ground for key social issues than participants in the differences condition: F(1, 783) = 4.68, p = .031,
Main Effect on Positive Attitudes Toward Outgroups
Controlling for all covariates, no significant main effect emerged for positivity toward outgroups (F(1, 782) = 0.82, p = .353,
Path Modeling
A path model similar to those tested in Studies 1–3 was estimated. This model provided a good fit to the data: χ2 (5) = 11.39, p = .044, CFI = .997, RMSEA = .040, SRMR = .020. All direct (see Figure 6) and indirect (see Table 8) associations were significant and in the expected direction. When controlling for key demographic covariates (political ideology, income, education level, age, and gender), all paths remain significant (see Supplemental Materials).
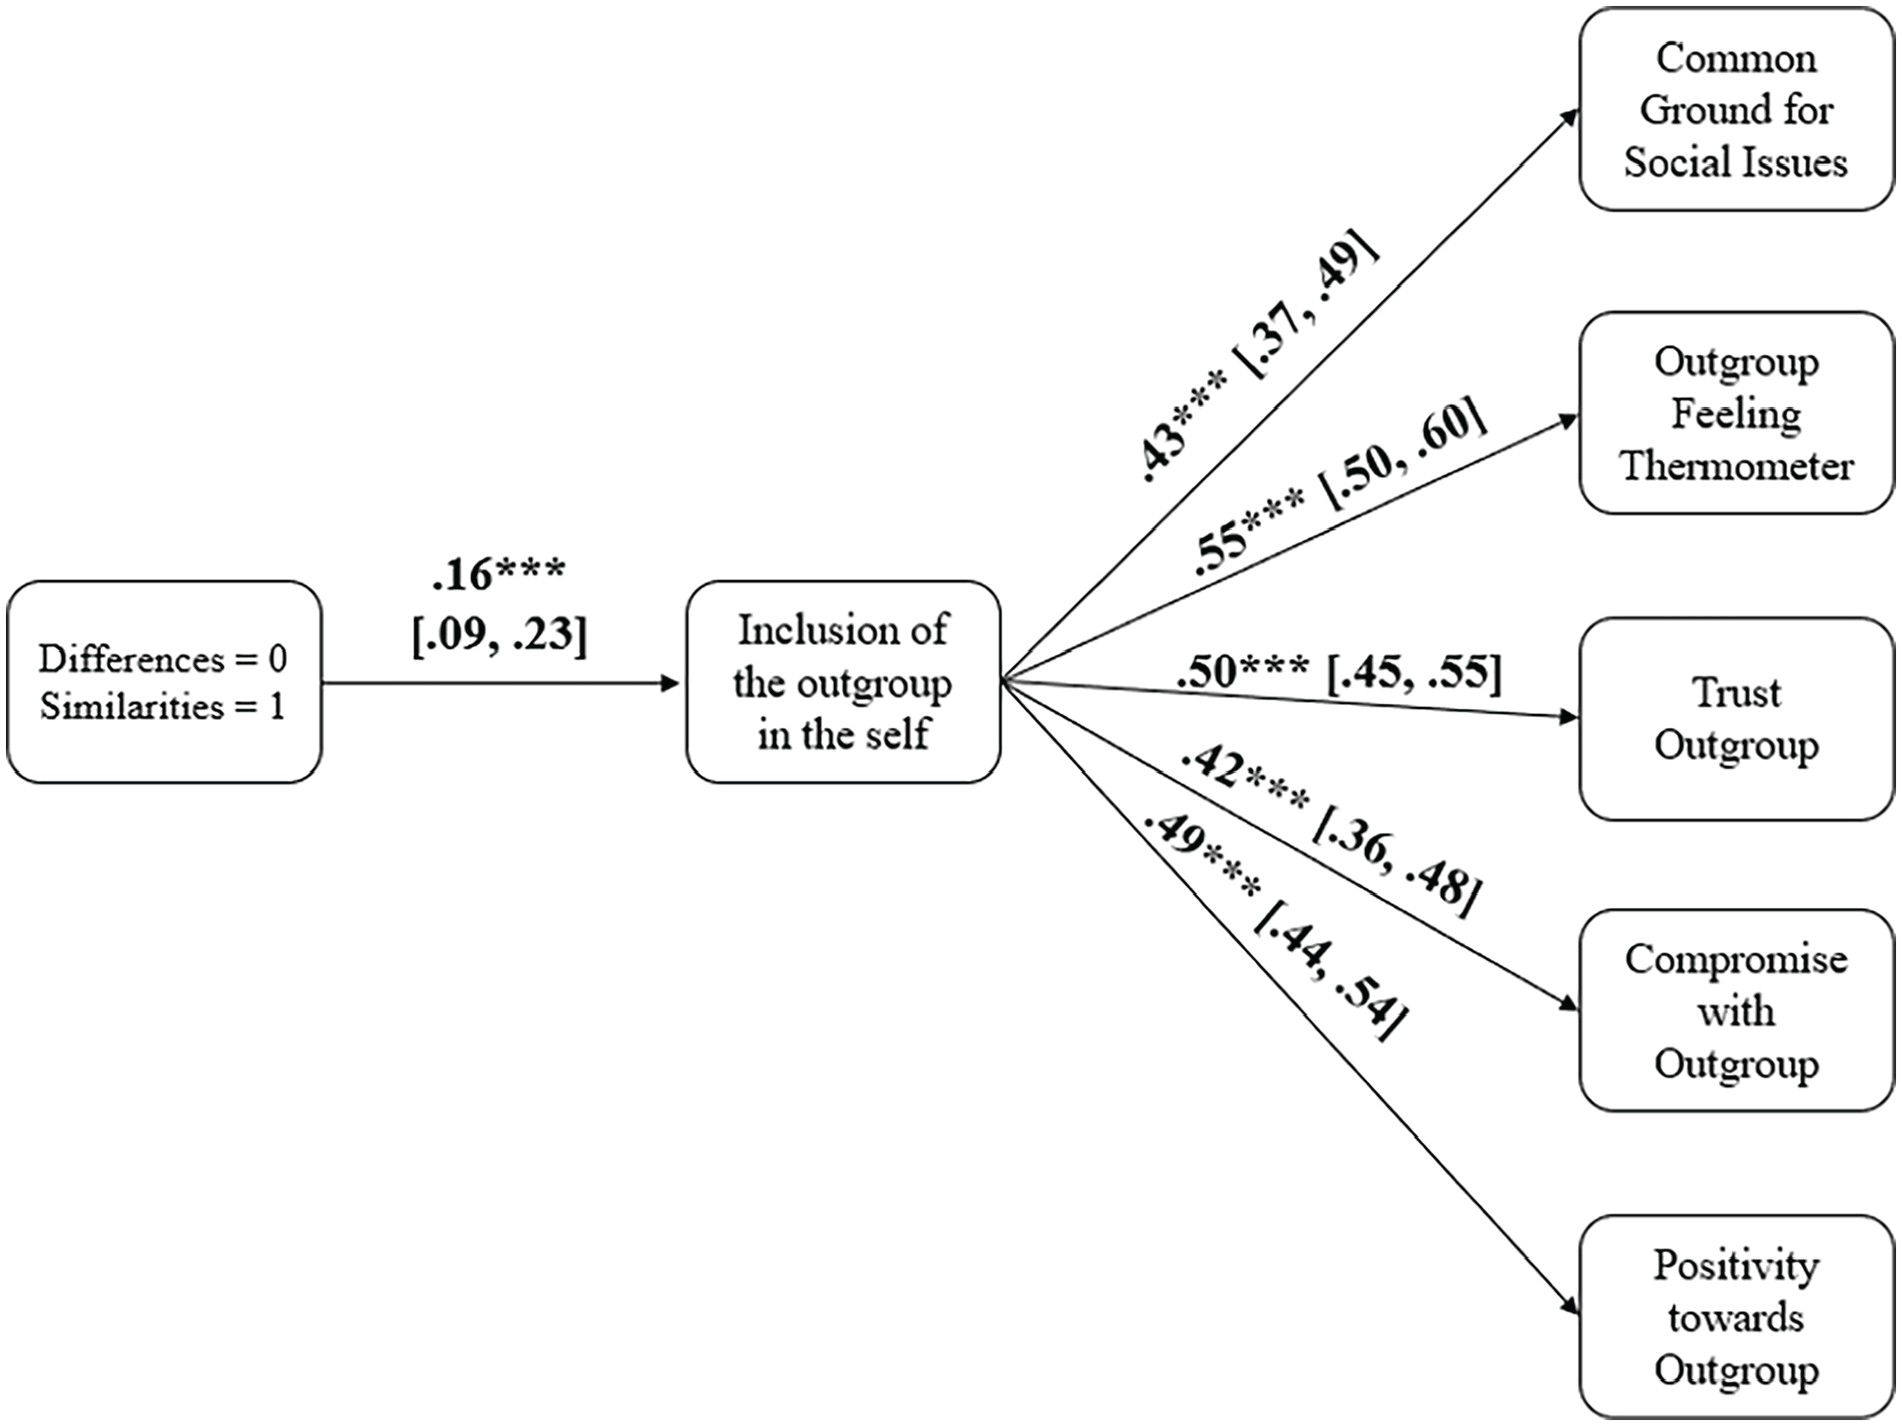
Path Model for the Indirect Effect of Condition via Increased Inclusion of the Outgroup in the Self on Attitudes Toward and Perception of the Political Opposition for Study 4.
Indirect Effects of Condition via Increased Inclusion of the Outgroup in the Self for Study 4.

Note. SE = standard error; CI = confidence interval.
Discussion
In our fourth experiment, we sought to replicate the effects observed in Studies 1–3 and also determine whether an emphasis on similarities could increase trust toward and willingness to compromise with the political opposition. Although direct influences on these measures were not observed, all indirect associations via increased inclusion of the outgroup in the self emerged as significant, suggesting an indirect contribution to our manipulation.
Study 5
In our fifth and final experiment, we sought to determine whether information on similarities would increase intergroup harmony relative to a baseline condition where no information would be presented, as well as whether these positive perceptions would not phase out a week after our experiment. In doing so, we would be able to rule out alternative explanations about the differences condition potentially causing the observed effect. This experiment was preregistered on AsPredicted, https://aspredicted.org/JNH_DJJ.
Method
Participants
Based on an a priori power analysis (G*Power, Faul et al., 2007), with alpha set to .05, power set to .80, and a small effect size (f = .10) for three groups, we required a sample of 969 participants. We rounded this number up to 1,200 participants to account for an expected 15%–20% exclusion rate due to poor data quality and attrition across time. At T1, after excluding participants who were not U.S. citizens (N = 8), who did not take the survey seriously enough (N = 13), and who missed attention checks to either condition’s stimuli (N = 55), 1,126 participants remained in our sample. For the T1 sample, 518 participants were male, 595 were female, and 13 were nonbinary. The majority of the sample was White (N = 625), 227 were BIPOC, and 274 did not provide a response/provided an uncodable response. The average age was 40.34 years (SD = 12.39), and the average political ideology tended to be moderate (M = 4.43, SD = 2.41).
At T2, conducted roughly between 7 and 12 days later, 909 participants remained. Furthermore, and at this point, participants who were multivariate outliers based on their responses to our survey’s measures (N = 31) were also removed. In the T2 sample (N = 878), 401 participants were male, 465 were female, and 12 were nonbinary. The majority of the sample was White (N = 498), 154 were BIPOC, and 226 did not provide a response/provided an uncodable response. The average age was 41.10 years (SD = 12.56), and the average political ideology tended to be moderate (M = 4.44, SD = 2.41).
Procedure
Participants were again recruited via CloudResearch during late April to early May 2021. An identical process as that of Studies 2–4 was employed. The only difference was that a third condition, one where no information was displayed to participants, was included (i.e., a baseline condition). Furthermore, participants who indicated so at the end of the survey were contacted roughly a week later to participate at T2. Thus, participants were randomly assigned to the intergroup similarities (N = 377), the intergroup differences condition (N = 316), or the baseline condition (N = 433).
Measures
Four items from the previous studies assessing beliefs about how similar Democrats and Republicans are in their moral foundations of fairness, care, and their support for democracy and bipartisanship were retained as manipulation checks (a = .94). The measures of inclusion of outgroup in the self, feeling thermometers toward the political opposition, and the belief that common ground on major social issues can be reached (a = .90) were identical to our previous studies.
Results
We followed the same analytical procedure as Studies 2–4. The means for these analyses are given in Table 9. Graphic representations of the findings are displayed in Figures 7-10.
Means and SDs by Condition for Study 5.
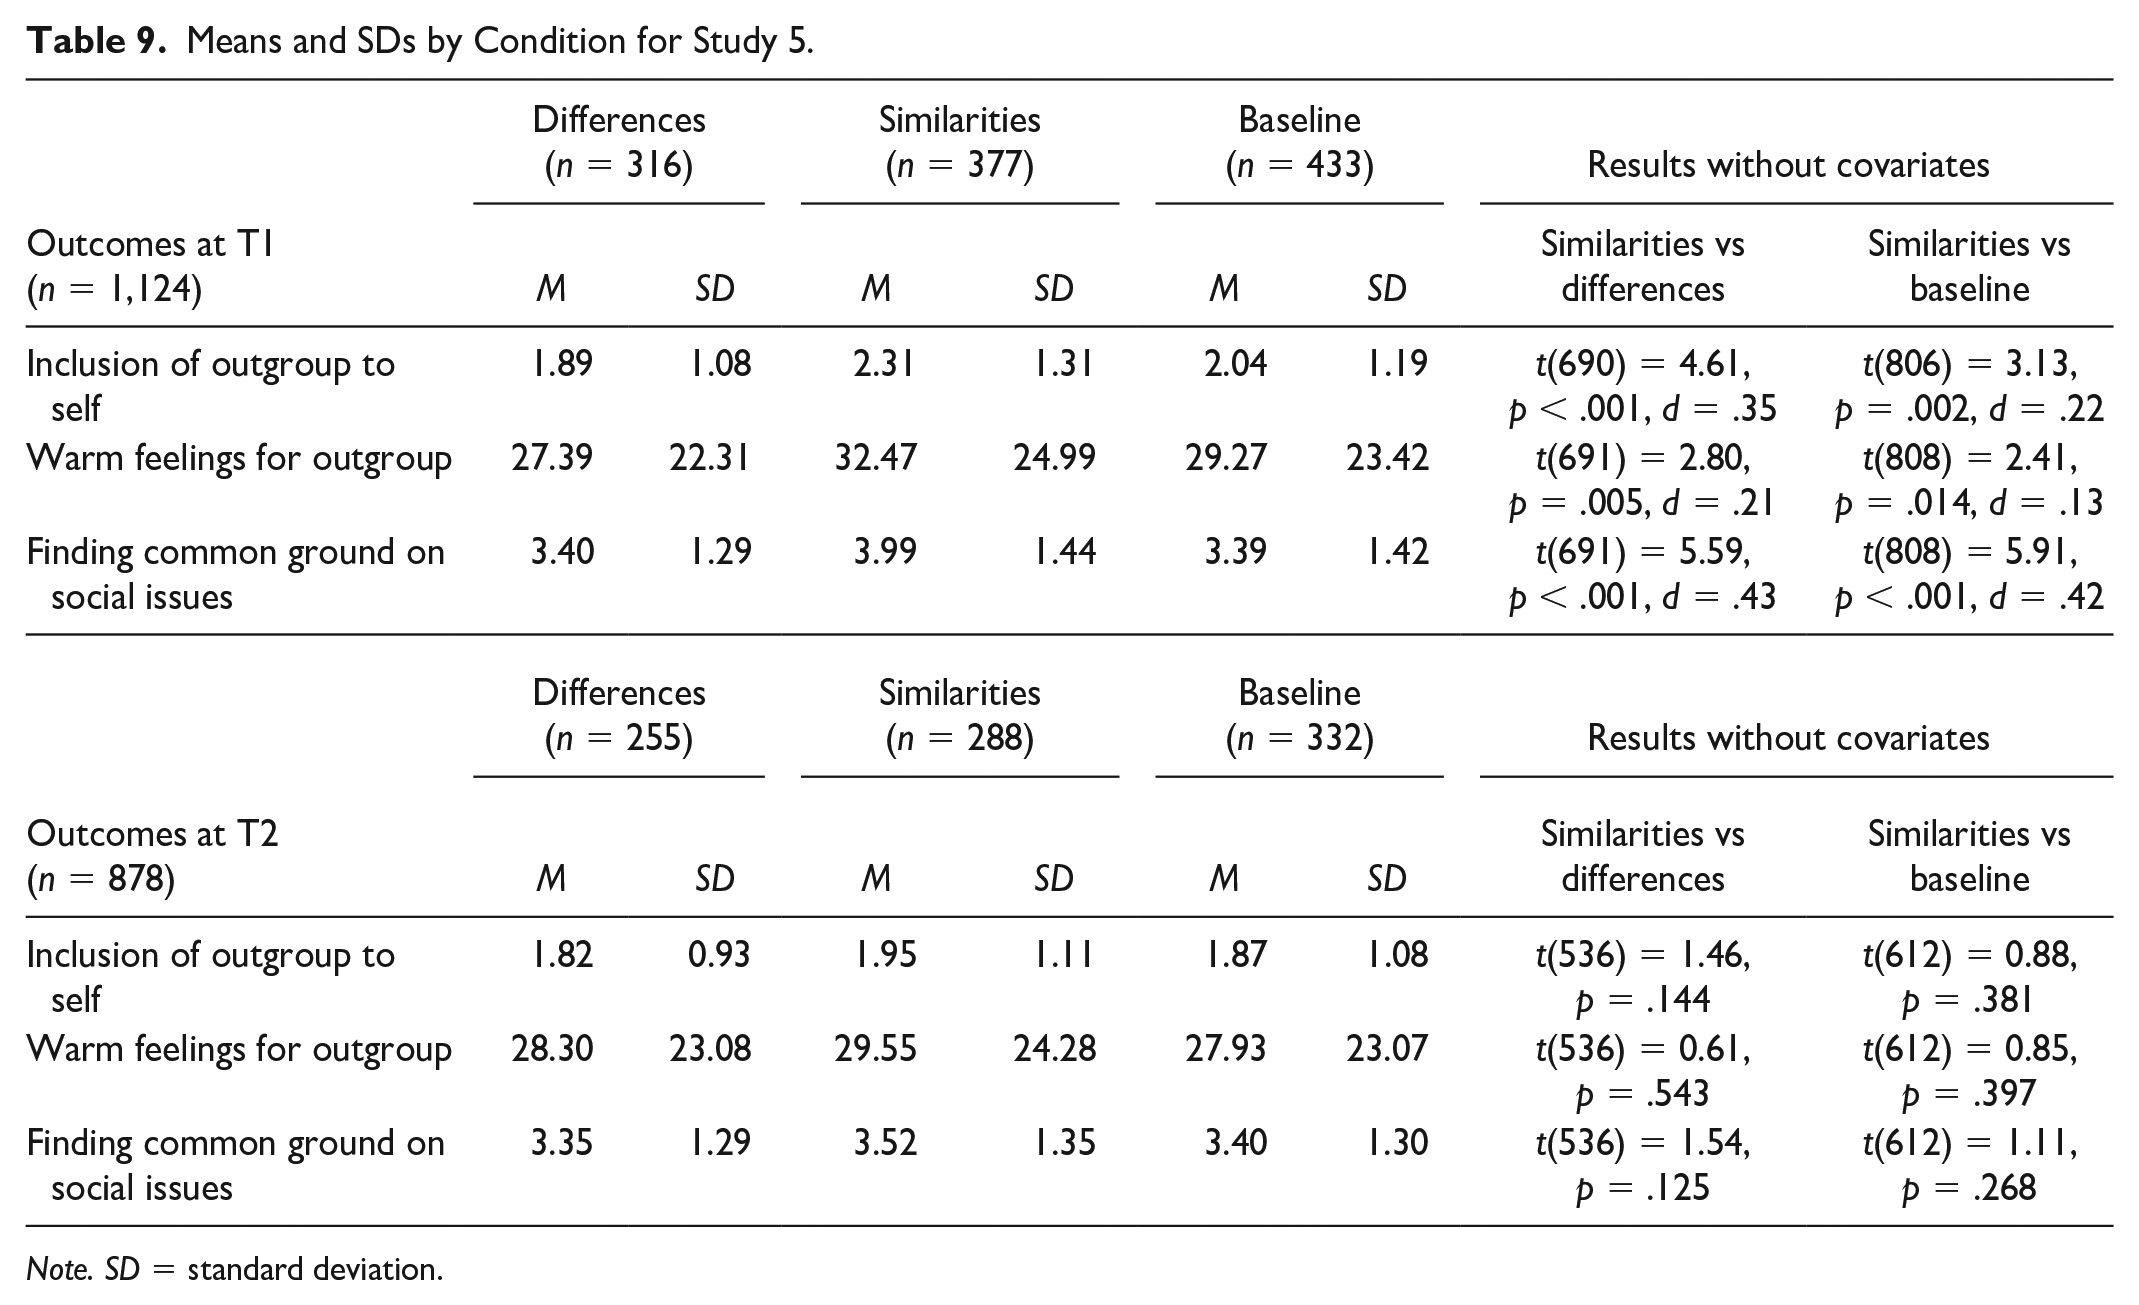
Note. SD = standard deviation.
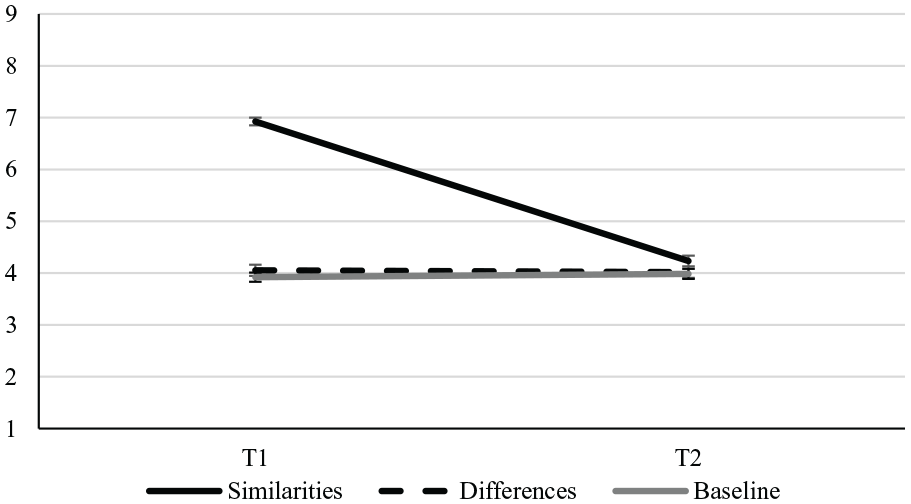
Line Graph Depicting Average Scores for Manipulation Check (Perceived Similarity Between Political Ingroup and Outgroup) at T1 and T2. Error Bars Depict ±1 SE From the Mean.
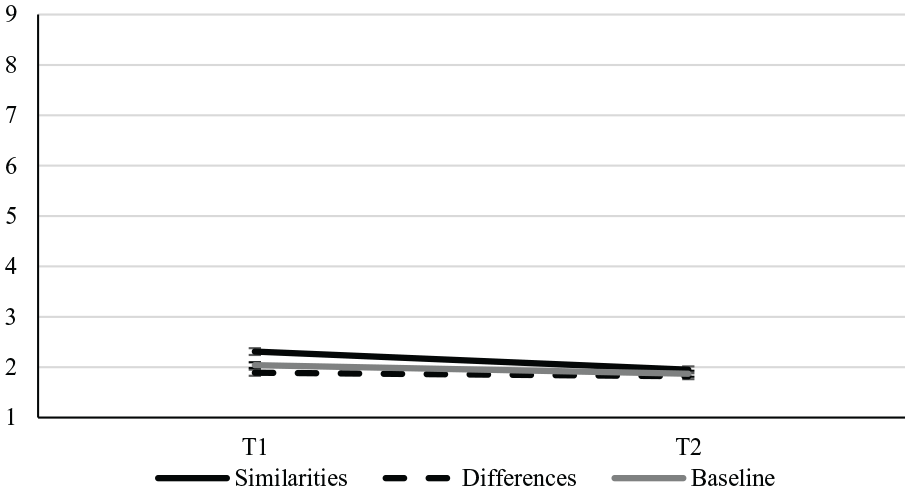
Line Graph Depicting Average Scores for the Inclusion of Outgroup in the Self at T1 and T2. Error Bars Depict ±1 SE From the Mean.
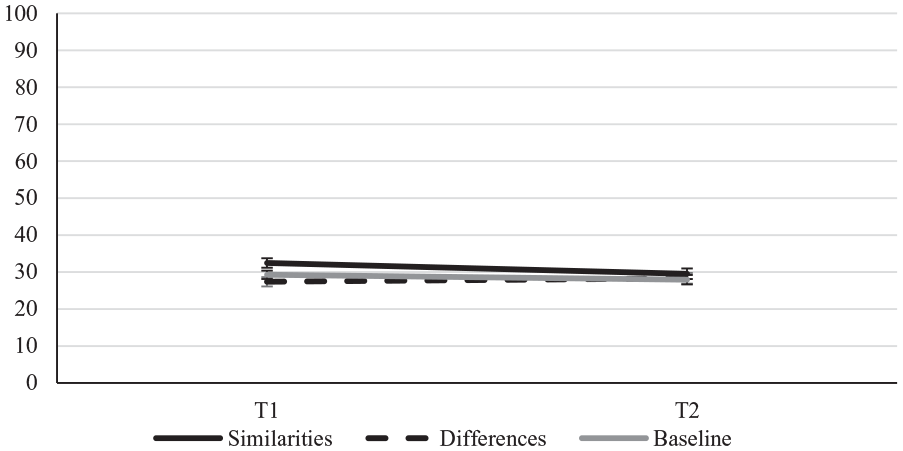
Line Graph Depicting the Average Feeling Thermometer Toward Outgroup Scores at T1 and T2. Error Bars Depict ±1 SE From the Mean.
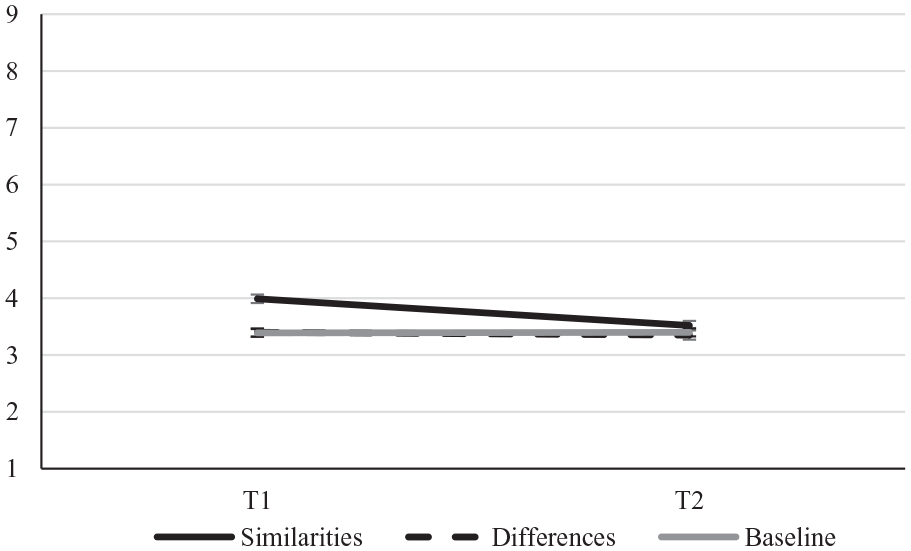
Line Graph Depicting the Average Scores for Finding Common Ground at T1 and T2. Error Bars Depict ±1 SE From the Mean.
Main Effects on Perceived Similarity
An overall main effect of condition was observed, F(2, 1,123) = 359.18, p < .001,
Main Effects on Inclusion of Outgroups
Controlling for all covariates (age, income, and education), a significant main effect emerged, F(2, 1,118) = 8.22, p < .001,
Main Effects on Feelings Toward Outgroups
Controlling for the same covariates, a significant main effect for the feeling thermometer measure emerged, F(2, 1,120) = 5.63, p = .012,
Main Effects on Support for Bipartisanship
Controlling for all covariates, a significant main effect of condition on support for bipartisanship emerged, F(2, 1,120) = 23.29, p < .001,
Path Modeling
A path model similar to those tested in Studies 2–4 was estimated only for the measures at T1, as no significant difference was observed in T2. In this model, the exogenous variable was condition, coded as similarities = 1 and baseline and differences = 0, as our focus was solely on the similarities condition and since no difference between the other two conditions was noted. After allowing the direct effect of condition on bipartisanship to be estimated, the resulting model provided a good fit to the data: χ2 (1) = 0.44, p = .506, CFI = .999, RMSEA < .001, SRMR = .006. All direct (see Figure 11) and indirect (condition → inclusion of outgroup → finding common ground, β = .06, SE = .01, p < .001, 95% CI = [.03, .09]; condition → inclusion of outgroup → outgroup feeling thermometer, β = .07, SE = .02, p < .001, 95% CI = [.04, .11]) associations were significant and in the expected direction. When controlling for key demographic covariates (political ideology, income, education level, age, and gender), all paths remain significant (see Supplemental Materials).
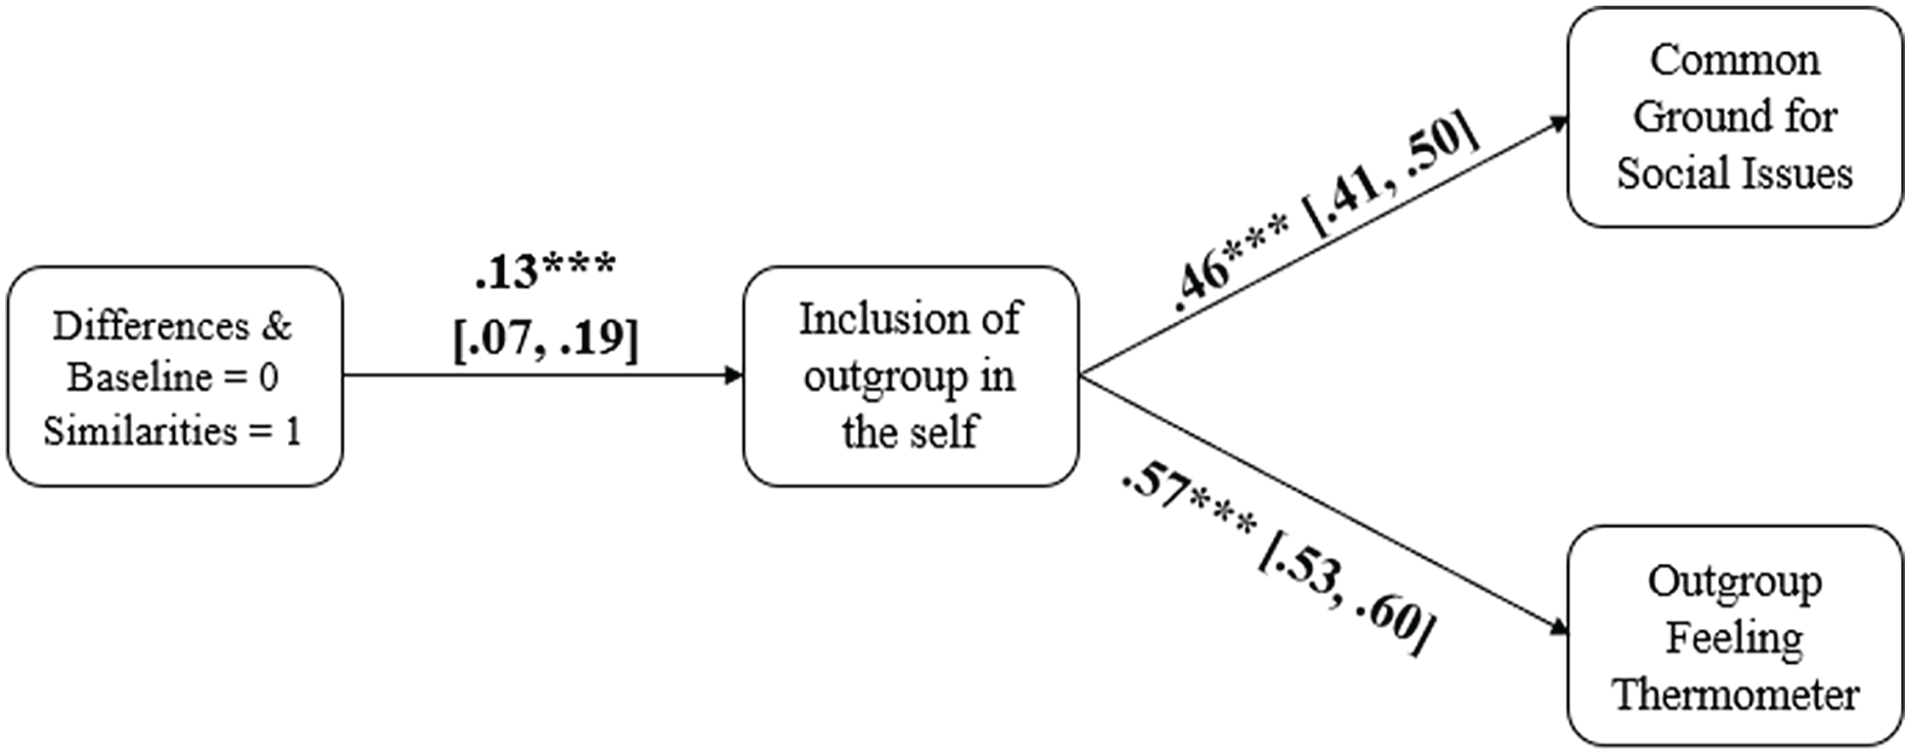
Path Model for the Indirect Effect of Condition Via Increased Inclusion of the Outgroup in the Self on Attitudes Toward and Perception of the Political Opposition for Study 5.
Discussion
Our final study examined our hypothesis in an even more comprehensive manner. It included a baseline condition where no information was presented to participants, and the participants were contacted roughly 7–10 days later to examine the stability of the manipulation. Overall, we find that it is actually the intergroup similarities condition that is driving the hypothesized effect, as it differed significantly from both the differences and the baseline condition. Importantly, in all cases, the differences condition did not differ from the baseline condition. However, all observed effects were not significant at T2, even though, descriptively, participants in the similarities condition scored higher in all three outcomes. Thus, a focus on intergroup similarities can temporarily increase outgroup positivity. However, we speculate that to ensure more longer-lasting effects, repeated exposure to information about intergroup similarities is potentially required.
Meta-Analysis of Results
To provide a more detailed overview of the results of the five studies, we conducted a meta-analysis of the results of the five studies based on the methodology recommended by Goh et al. (2016). Since only Study 5 included a baseline condition, we only performed meta-analyses for the results between the similarities and the differences conditions (excluding the results for T2 of Study 5, as no manipulation occurred). Furthermore, we conducted these analyses only for measures that were repeated across studies. These measures were inclusion of outgroup in the self, warm feelings for outgroups, finding common ground on social issues, outgroup threat, positivity toward outgroups, and perceived similarity (i.e., the manipulation check). 4
As seen in Table 10, results suggested that a very large effect was observed for perceptions of similarity (i.e., the manipulation check; d = 1.99). A small to moderate effect was observed for inclusion of outgroups in the self (d = .32) and finding common ground for social issues (d = .31), and a small, but significant, effect was observed for positivity toward the outgroup (d = .17) and warm feelings toward the outgroup (d = .14). A nonsignificant effect was observed for threat from the outgroup (d = −.09).
Internal Meta-Analysis of Outcomes That Were Included in Two or More Studies.
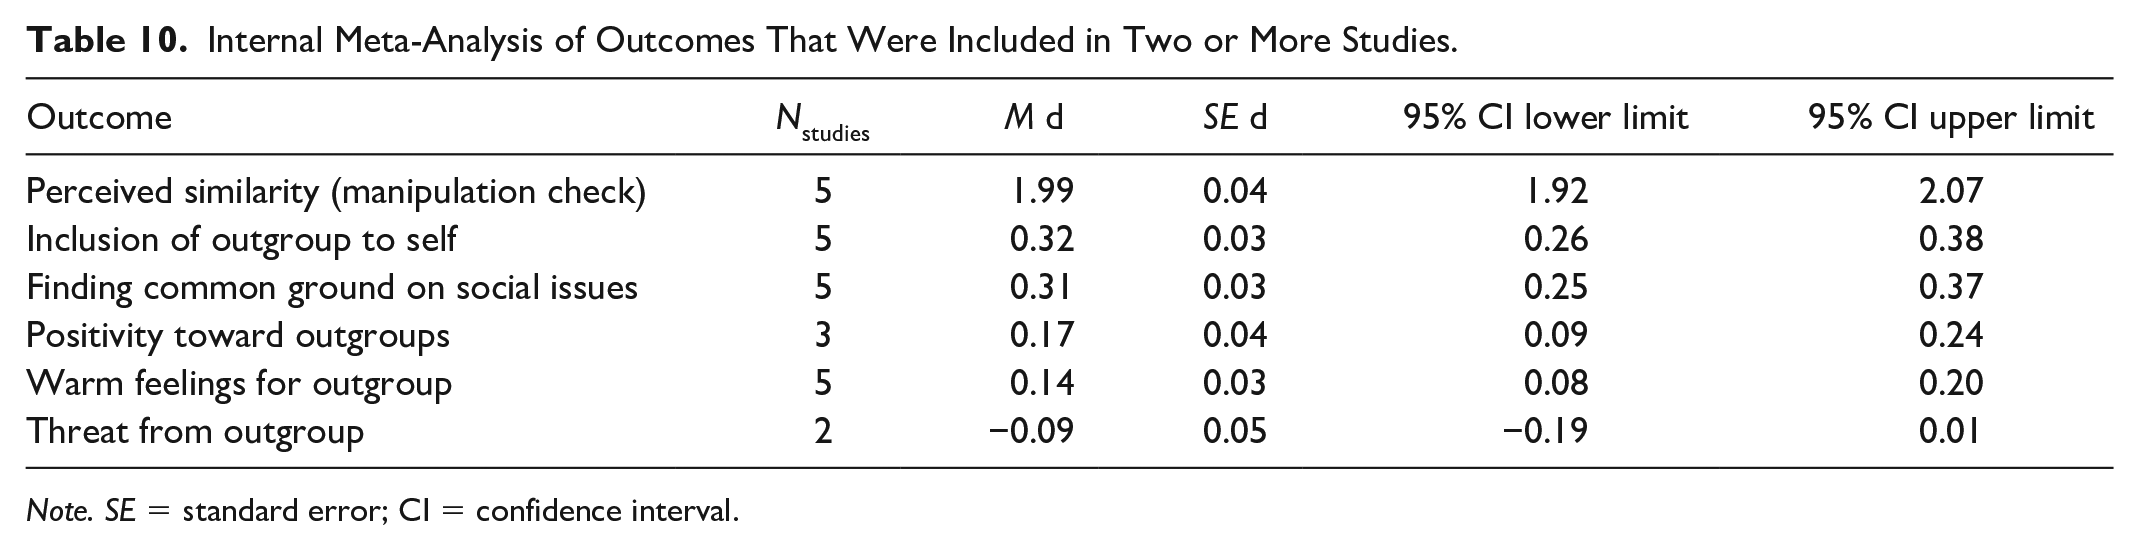
Note. SE = standard error; CI = confidence interval.
General Discussion
Political polarization in the United States has led to both within- and between-party divisions, which ultimately increase political conflict. This polarization is observable both in the public and in elected officials (Desilver, 2022) and exerts a powerful influence on Americans’ attitudes toward pressing social issues (e.g., McLamore et al., 2022). However, is this ever-increasing political divide observable in core sociopolitical attitudes? Furthermore, does our field also potentially contribute to this divide by highlighting intergroup differences instead of using the same statistical results to focus on intergroup similarities?
Results from five experiments highlight that there are meaningful improvements toward outgroup attitudes as a result of emphasizing similarities between politically opposed groups. In detail, consistent direct effects of small to moderate size were observed for increased inclusion of the political opposition in the self, increased willingness to find common ground on major social issues as well as overall positivity and warm feelings toward the political opposition. We consider these findings to be in line with the TRI framework (Hartman et al., 2022). It appears that presenting the same empirical findings as similarities compared with differences influence positive outgroup attitudes. However, no significant effect was observed for more direct attitudes, such as threat, strategies for conflict resolution, compromise, and trust. For some of these measures, results were skewed positively or negatively, suggesting that respondents were either already very supportive (e.g., bipartisanship in Study 1) or very biased toward the outgroup (e.g., experimental game paradigms in Study 3). It is possible that other intervention types (e.g., intergroup contact, messages by an ingroup authority) might fare better at addressing outcomes that are more entrenched in a person’s identity. Alternatively, in the case of such entrenched views of the outgroup, dynamic norm interventions (e.g., Sparkman & Walton, 2017) suggesting a trend for cooperation and trust between groups, if such trends are indeed observable, could also prove effective as they would signal a preconformity toward intergroup cooperation.
It is worth noting that in line with our preregistered analysis plan, emphasizing similarities relative to differences had significant indirect effects on almost all outcome variables, via increased inclusion of the outgroup in the self. The consistent main effect of condition on this variable and the consistent indirect effects on most of the outcome variables lend support to the common ingroup identity model (Gaertner et al., 1989). The addition of the baseline condition in Study 5 also allows us to conclude that it is an emphasis on similarities that is driving these effects and not on differences that increases animosity. By surveying a majority of the participants of Study 5 a week later, we were also able to determine whether these effects last longer than the intervention point. Our results suggest that they do not, in line with extant theoretical arguments (Hartman et al., 2022).
Limitations and Future Directions
Crucially, although our findings do suggest that an emphasis on intergroup similarities exhibits a proclivity for increased intergroup harmony, there are several limitations that should be considered and addressed in future research. First, all samples were drawn from MTurk. Although we included several checks both in our recruitment and in our data management to ensure high data quality, our sample was not representative of the entire U.S. population. Thus, a first step toward ensuring the generalizability of these findings is the recruitment of more diverse and representative samples of the U.S. population. Although findings from other settings (e.g., United Kingdom, Hanel & Wolf, 2020) lend support to the generalizability of our findings, at least in the highly-polarized political setting of the United States, further research with more representative samples is required.
A second consideration worth noting is that the effect of our manipulation was not robust over time. Approximately 7–10 days later, participants’ attitudes seemingly reverted to their average scores; however, descriptively in all cases, those in the similarities condition still had higher attitude scores. We theorize that exposure to information on intergroup similarities can boost positivity toward the outgroup in the short term, but without more consistent exposure to such information (or even with exposure for information highlighting differences), this effect washes away. Thus, future research should re-examine how an emphasis on intergroup similarities can prove useful, via the implementation of more-intensive longitudinal designs. Such efforts could also employ a more ecologically valid approach through targeted ads on social media websites or in community samples. In the same vein, examining which attitudes might be worth targeting (i.e., focusing on similarities for specific issues) could prove instrumental in increasing the efficacy of such an intervention. For instance, there could be some attitudes that, if targeted, could elicit distinctiveness threat (e.g., Badea et al., 2010). A few examples include but are not limited to abortion, gun control, or climate change. For these issues, similarity in responses between the two groups could be low, and if it is not, then highlighting that might push individuals from both groups to take an extreme stance. Thus, in these cases, it is possible that such an emphasis on similarities could drive the two groups further apart.
Another limitation worth acknowledging is that although people’s attitudes toward the political opposition did shift, their (hypothetical) willingness to cooperate (as recorded through their participation in the Dictator’s and Ultimatum games) did not. We speculate that there are three reasons behind this nonsignificant effect. First, the task could potentially have lacked in realism. We asked participants to imagine winning a large sum of money, rather than using any actual amount that they could be awarded. Second, this study was conducted about a month and a half after the January 6th capitol attack, which could have polarized partisans’ attitudes to such a degree, that hypothetical action outcomes (e.g., Dictator and Ultimatum games) could not shift. Third, it is quite possible that our intervention is simply not capable of shifting cooperation intentions and that other approaches might prove more effective.
An additional noteworthy limitation is that we focused on similarities between Democrats and Republicans on four specific variables (moral foundations of care, fairness, support for bipartisanship, and democracy). It is not clear whether emphasizing similarities in other domains would prove effective, although findings from the SDC suggest that it might. Furthermore, it is also not clear whether emphasizing similarities of a smaller scale (i.e., displaying smaller PCRs that correspond to larger effect sizes) would be effective at reducing negative attitudes. This is worth exploring in future studies, as it could have implications for the communication of scientific results to the public.
A final limitation worth acknowledging is the inconsistent number of participants excluded for each condition. Across our studies, more participants were tended to be excluded in the differences conditions than those in the similarities condition. Participants were correctly randomly assigned via Qualtrics randomization to be randomly shown one of two conditions (or one of three for Study 5); however, they were more likely to fail the manipulation check in the differences condition. We speculate that this could be the case because they had more difficulty comprehending the information presented in this condition. Such theorization is in line with existing work highlighting that information presented as similarities (compared with differences) is easier to comprehend (e.g., Hanel et al., 2019). Even if this is not the case, running analyses without excluding any participants produces highly consistent results (see Table S23 in the Supplemental Materials).
Conclusion
Based on this preliminary set of results, we recommend that scientists and media outlets should be cautious when they present results focusing on intergroup differences. Existing work suggests that the public is better at comprehending intergroup similarities (Hanel et al., 2019). Furthermore, our results suggest that emphasizing similarities can have some short-lived positive effects. In fact, by far the largest effect was observed for perceived similarities between the two groups (i.e., our manipulation check). Participants’ perceived similarities between their ingroup and the political opposition increased by roughly 2 standard deviations. The estimation and presentation of overlap coefficients, especially for small effect sizes, thus could prove useful, especially when communicating findings to the public. After all, prolonged exposure to scientific results emphasizing similarities could yield the most lasting prosocial effect.
Political scientists agree that political polarization is increasing especially in the United States (Abramowitz, 2017; Abramowitz & Webster, 2016; Cramer, 2016; Inglehart & Norris, 2016). Furthermore, political parties often act as social identities (Iyengar et al., 2012; McCoy et al., 2018). As a consequence, political supporters of a specific party feel dispositionally closer to people from groups that they feel the most similar to (Iyengar et al., 2012; Lupu, 2015; Tajfel, 1970; Tajfel & Turner, 1979). Given this division between people based on politicized identities, examinations of similarities between political/politicized groups could help bridge the gap that exists between them. Focusing on similarities has the potential to increase the communication of research in the political sphere, making it easier to disseminate findings to more and broader segments of the general public on both sides of the political aisle (Kaslow, 2015; Schalet et al., 2020). In this way, reporting evidence for commonalities across party lines can foster a sense of cooperation rather than division or competition.
Supplemental Material
sj-docx-1-psp-10.1177_01461672231192384 – Supplemental material for Emphasizing Similarities Between Politically Opposed Groups and Their Influence in Perceptions of the Political Opposition: Evidence From Five Experiments
Supplemental material, sj-docx-1-psp-10.1177_01461672231192384 for Emphasizing Similarities Between Politically Opposed Groups and Their Influence in Perceptions of the Political Opposition: Evidence From Five Experiments by Stylianos Syropoulos and Bernhard Leidner in Personality and Social Psychology Bulletin
Footnotes
Declaration of Conflicting Interests
The author(s) declared no potential conflicts of interest with respect to the research, authorship, and/or publication of this article.
Funding
The author(s) disclosed receipt of the following financial support for the research, authorship, and/or publication of this article: Part of this work was funded through a Keith Rayner Memorial Graduate Student Research Award to the first author.
Supplemental Material
Supplemental material is available online with this article.
Notes
References
Supplementary Material
Please find the following supplemental material available below.
For Open Access articles published under a Creative Commons License, all supplemental material carries the same license as the article it is associated with.
For non-Open Access articles published, all supplemental material carries a non-exclusive license, and permission requests for re-use of supplemental material or any part of supplemental material shall be sent directly to the copyright owner as specified in the copyright notice associated with the article.