
Abstract
Test equating is a method of making the test scores from different test forms of the same assessment comparable. In the equating process, an important step involves continuizing the discrete score distributions. In traditional observed-score equating, this step is achieved using linear interpolation (or an unscaled uniform kernel). In the kernel equating (KE) process, this continuization process involves Gaussian kernel smoothing. It has been suggested that the choice of bandwidth in kernel smoothing controls the trade-off between variance and bias. In the literature on estimating density functions using kernels, it has also been suggested that the weight of the kernel depends on the sample size, and therefore, the resulting continuous distribution exhibits bias at the endpoints, where the samples are usually smaller. The purpose of this article is (a) to explore the potential effects of atypical scores (spikes) at the extreme ends (high and low) on the KE method in distributions with different degrees of asymmetry using the randomly equivalent groups equating design (Study I), and (b) to introduce the Epanechnikov and adaptive kernels as potential alternative approaches to reducing boundary bias in smoothing (Study II). The beta-binomial model is used to simulate observed scores reflecting a range of different skewed shapes.
Through the years, the potential impact of outliers on the statistical analysis performed on the data has been a source of concern (Butler, 1983; Chambers & Heathcote, 1981; Fox, 1972). Outliers are often examined with respect to their impact on the distribution of statistics such as the mean, median, and variance. For example, the impact of outliers on estimates of reliability has received some attention in the psychometric literature (Liu, Wu, & Zumbo, 2010; Liu & Zumbo, 2007). Although different terms (e.g., contaminants, spurious observations, discordants) have been used to refer to outliers in this area of study, the general emphasis has been on examining the potential effect of observations that stand out from the majority of the data due, for example, to data recording errors, participant’s guessing, or inattentiveness (Barnette, 1999).
Outliers may also pose a challenge in the area of test equating. If outliers—often referred to as atypical scores or “spikes” in the distribution in test equating—affect in an unpredictable manner how a particular equating method makes the test scores from different test forms of the same assessment comparable, the method may result in biased test scores. In test equating, the influence of outliers has generally been investigated as (a) test score boundaries or scores at low and high ends of the test score range (Cope, 1989; Godfrey, 2007; Kolen, 1985), (b) atypical scores such as gaps and spikes in the distributions (Moses & Holland, 2006; Moses & von Davier, 2005; von Davier, Holland, & Thayer, 2004), and (c) zero-frequencies in the middle of the distributions as artifacts of the methodology used (Puhan, von Davier, & Gupta, 2010). In the first set of studies, the focus has been on the impact of the random error due to small samples at the lowest and highest scores. The other studies have focused on various applications of the versatile log-linear models to fit all types of distributions that can be encountered in educational assessment.
The purpose of this article is (a) to explore the potential effects of atypical scores (spikes) at the extreme ends (high and low) on kernel equating (KE; Holland & Thayer, 1989; von Davier et al., 2004), using test distributions with different degrees of asymmetry and with data collected following an equivalent groups equating design (Study I); and (b) to explore the Epanechnikov and adaptive kernels as alternative continuization methods (Study II). The effects of the Epanechnikov and adaptive kernels on the equating results will be investigated in a separate article because there are many factors besides asymmetry that need to be varied for a rigorous comparison of equating functions.
KE—a relatively new equating framework—has been proposed as a unified approach to observed-score equating “based on a flexible family of equipercentile-like equating functions that contains the linear equating as a special case” (von Davier et al., 2004, p. 45). The use of Gaussian kernel smoothing in KE to convert score distributions from discrete to continuous distributions motivated this study’s attempt to evaluate the impact of atypical scores (spikes) at the extreme ends of distributions with different shapes. The perspective taken in this article is that one can account for spikes or for sparseness in the data at the extreme scores through the continuization methods. It is important to note that addressing all of these issues—spikes and sparseness simultaneously is challenging as solving one problem might exacerbate another.
The study of the effect of atypical scores or spikes in test equating is particularly important especially because they can occur in the high scores range of a distribution, where decisions about the test takers are made. For example, if a difficult test for the general population is taken by examinees whose abilities are substantially above the average, they may get extreme high scores. However, if the sample sizes are small, such scores may be “spikes” of a skewed distribution. If a medium difficult test for the general population is also taken by the same high ability examinees, they may get extreme high scores but such scores would occur in a symmetric distribution. In fact, among the reasons that can contribute to the occurrence of spikes in the distributions at extreme scores are (a) test takers’ ability and motivation, (b) formula-scored tests, and (c) small sample sizes. For example, in a mandatory test administered to English Language Learners, it is possible to have non-motivated, low ability examinees that leads to spikes around the guessing point. For formula-scored tests, sometimes negative scores are rounded up to zero, which leads to a spike at 0. With small sample sizes increased variation for both high and low scores is possible. These possibilities raise the question of whether the proportion of observations at the extreme scores might impact the equating results.
Furthermore, the impact of extreme scores at the lower or higher end of a distribution may also depend on the nature of the test. Kolen (1985) reminded us that skewed score distributions are frequent in many testing programs. The degree of asymmetry of the distributions often reflects extreme scores. For example, some tests have been reported to have specific distributions that may result from different ceilings of the tests. Cope (1989) investigating equipercentile methods in the scaling of the ACT ASSET battery of college placement tests reported that Writing and Reading skill tests had negatively skewed score distributions and Numerical skill tests had nearly symmetrical distributions. He concluded that the skewness caused the compression of low scores and separation of high scores in the raw-to-scale conversion.
In summary, in this article, two studies are presented: One in which the impact of outliers on the KE results is investigated and one in which the performance of the existing kernel continuization methods—the uniform and the Gaussian kernels—is briefly compared with the Epanechnikov and adaptive kernels when the distributions have various degrees of atypical extreme scores. The analyses are performed on simulated data.
Observed-Score Equating and Continuization Methods
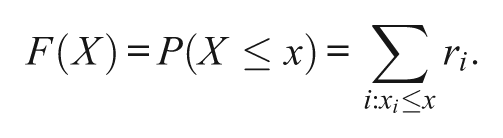
The KE method—an observed-score equating method—is a special case of the equipercentile equating method. All observed-score equating methods can be expressed in the form of the equipercentile equating function. In equipercentile equating, number-correct scores are converted to percentile rank scores from test form X to the scale of test form Y. The scores on two different forms with the same percentile rank will be equivalent (Petersen, Cook, & Stocking, 1983). To obtain these equivalent scores, one needs to make the discrete test score distribution continuous (see Kolen & Brennan, 2004). For example, the percentile rank equating method uses linear interpolation of the discrete distribution to make the distribution continuous. In contrast, the KE method uses Gaussian kernel smoothing to approximate the discrete histogram by a continuous density function. More specifically, in KE, a log-linear model is fitted first to the distributions of observed scores to reduce the noise in the data and then a continuization step is used to approximate the estimated discrete cumulative density functions (cdf). Two of the most commonly used kernel density estimators—Gaussian and Epanechnikov kernels are discussed in Appendix A of the online version of this article. The Epanechnikov kernel function assigns more weight to observations very close to x and less weight to observations farther away from x. Because the Gaussian kernel is unbounded, the Epanechnikov kernel is sometimes favored when the variable of interest is bounded on one or both sides. Given these properties, it is of interest to evaluate it in an equating context. The KE method is briefly described in the next section.
Gaussian KE
The KE method involves five basic steps: pre-smoothing, estimation of scores probabilities, continuization of the discrete score distributions, computing the equating function, and computing the standard error of equating (SEE). The discrete score distributions of Steps 1 (pre-smoothing) and 2 (estimation of score probabilities) are smoothed into cdfs. The continuization step uses a Gaussian kernel with a parameter or bandwidth (h)—bandwidths, hx and hy, for tests X and Y, respectively. Where
Where positive numbers are used to smooth the cdf using a Gaussian kernel (Holland & Thayer, 1989),
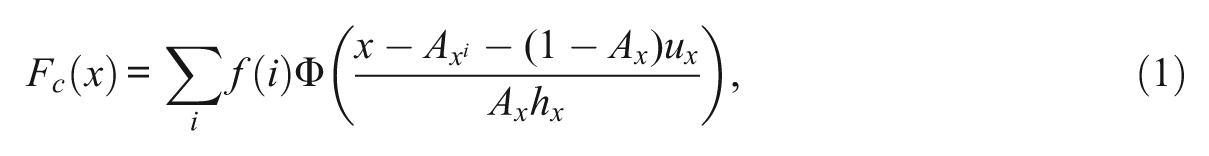
where
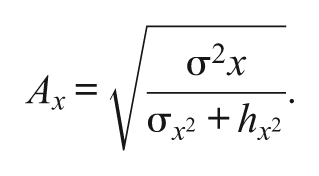
In Equation 1, Fc(x) denotes the continuized F evaluated at x; f(i), the discrete density of the integer score i; Φ, the standard Gaussian cdf; ux, the mean of X, and
Except for extreme scores, different scaled kernel functions (such as logistic, uniform, and Gaussian) tend to produce similar equated scores (Lee & von Davier, 2011). As a result of the disparate results in the area of the extreme scores, the influence of extreme scores on KE results has been a source of concern. Godfrey (2007), exploring the differences between KE and true score equating methods, found that KE with Gaussian kernel showed some deviation from the criterion equating (traditional equipercentile equating with linear interpolation) at the ends of the score scale. However, the equipercentile equating method also uses a kernel, the unscaled uniform kernel, to continuize the distributions. The Gaussian KE was shown to be superior to the traditional equating both in terms of bias and error. In terms of bias, the (scaled) kernel continuization which is used in the Gaussian KE matches perfectly the mean and the variance of the discrete test score distribution, while the traditional linear interpolation method matches only the mean of the original distribution (von Davier, 2013; von Davier, Fournier-Zajac, & Holland, 2007). Despite the concern that the Gaussian kernel may distort the higher moments of the distribution, this was not shown to be the case in the studies focused on equating comparisons (see Lee & von Davier, 2011; Wang, 2011) nor in the more general studies focused on density estimation (Silverman, 1986). More importantly, the SEE for the Gaussian KE is always mathematically defined (because the continuized distribution is continuous and differentiable) and it is lower and more stable than those of the traditional equating (see Moses & Holland, 2006). In addition, the KE function depends on a smoothness parameter, the bandwidth, which can be varied to bring the equating function closer to the traditional equating function, while preserving the differentiability and the other good properties of the Gaussian kernel. A variety of pre-smoothing (e.g., log-linear) and post-smoothing (e.g., cubic splines) procedures have been described to address the irregularities that extreme scores can cause in equipercentile equating functions when data are sparse (Dorans, 2000).
KE and Potential Boundary Bias
In this section, the boundary bias that characterizes the kernel estimators is discussed in the context of KE. Although kernel density estimators are widely used because of their asymptotic properties (e.g., Scott, 1992; Silverman, 1986; Wand & Jones, 1995), one problem that is common to all kernel methods is that they are subject to boundary bias, which occurs near the endpoints of the support of the density to be estimated (Müller & Stadmueller, 1999). Boundary bias occurs when kernel weights assigned to observations become asymmetric at the boundary (or when x values are not equally spaced), because the averaging intervals extend beyond the boundary to areas where there are no observations 1 (Bouezmarni & Rombouts, 2006; Gasser, Müller, & Mammitzsch, 1985; Rice, 1984). The performance of the density estimator at boundary points differs from the interior points because of boundary bias that occurs in nonparametric curve estimation problems. 2 When the support of some variables is bounded, for example, in the case of nonnegative scores, the standard kernel estimator continues to give weight outside the supports. The KE method would not differentiate between regions that have no scores because the density function is near zero and regions which have no scores because they lie outside the scale where information about the function is available. Therefore, fixed kernel density estimators may be drastically affected by atypical scores at the extreme of the distribution. The standard kernel density approach may produce spurious modes in the tails of the distribution (Cheng & Hall, 1999). The averaging of the different values leads to a bias problem and inconsistency of the estimator. In fact, one important drawback to kernel density estimators has been their lack of consistency when estimating a density near the finite endpoints of the support of the density to be estimated (Karunamuni & Alberts, 2004).
Although several correction methods have been proposed for these boundary effects, including but not limited to boundary kernels (Jones, 1993; Müller, 1991; S. Zhang & Karunamuni, 2000), and local linear regression estimation (Fan, 1993; Fan & Gijbels, 1992), adaptive kernels have received some attention given their flexibility (Cheng, Fan, & Marron, 1997; Jones, 1993; Jones & Foster, 1996). Basically, the difference between kernel density and adaptive kernel density is that the latter approach allows parameter h to vary from one data point to another, adapting to the sparseness of the data, using a larger value of h for data points in regions of low density (such as the tails). This is accomplished by using local bandwidths for different points of the sample data through an iterative procedure (Silverman, 1986; Van Kerm, 2003). According to Silverman (1986), adaptive kernel estimation is a two-stage procedure. First, an initial (fixed bandwidth) estimate is computed for all n observations, and then this pilot estimate is used to adapt the size of the bandwidth over the data points when computing a new kernel density estimate. In particular, the adaptive kernel density estimator of Silverman (1986) makes the bandwidths narrower near modes and wider in the extremes.
As mentioned earlier, in this article, the authors explore the potential effects of atypical scores (spikes) at the extreme ends (high and low) on KE method when distributions have different degrees of asymmetry and the data were simulated using the randomly equivalent groups equating design. In this type of design, two randomly equivalent samples are taken from a common population, P; one is given test X and the other is given test Y. How the beta-binomial distribution provides a model that allows us to explore the effect of differently skewed shapes on KE with extreme scores is discussed in Appendix B of the online version of this article.
Method
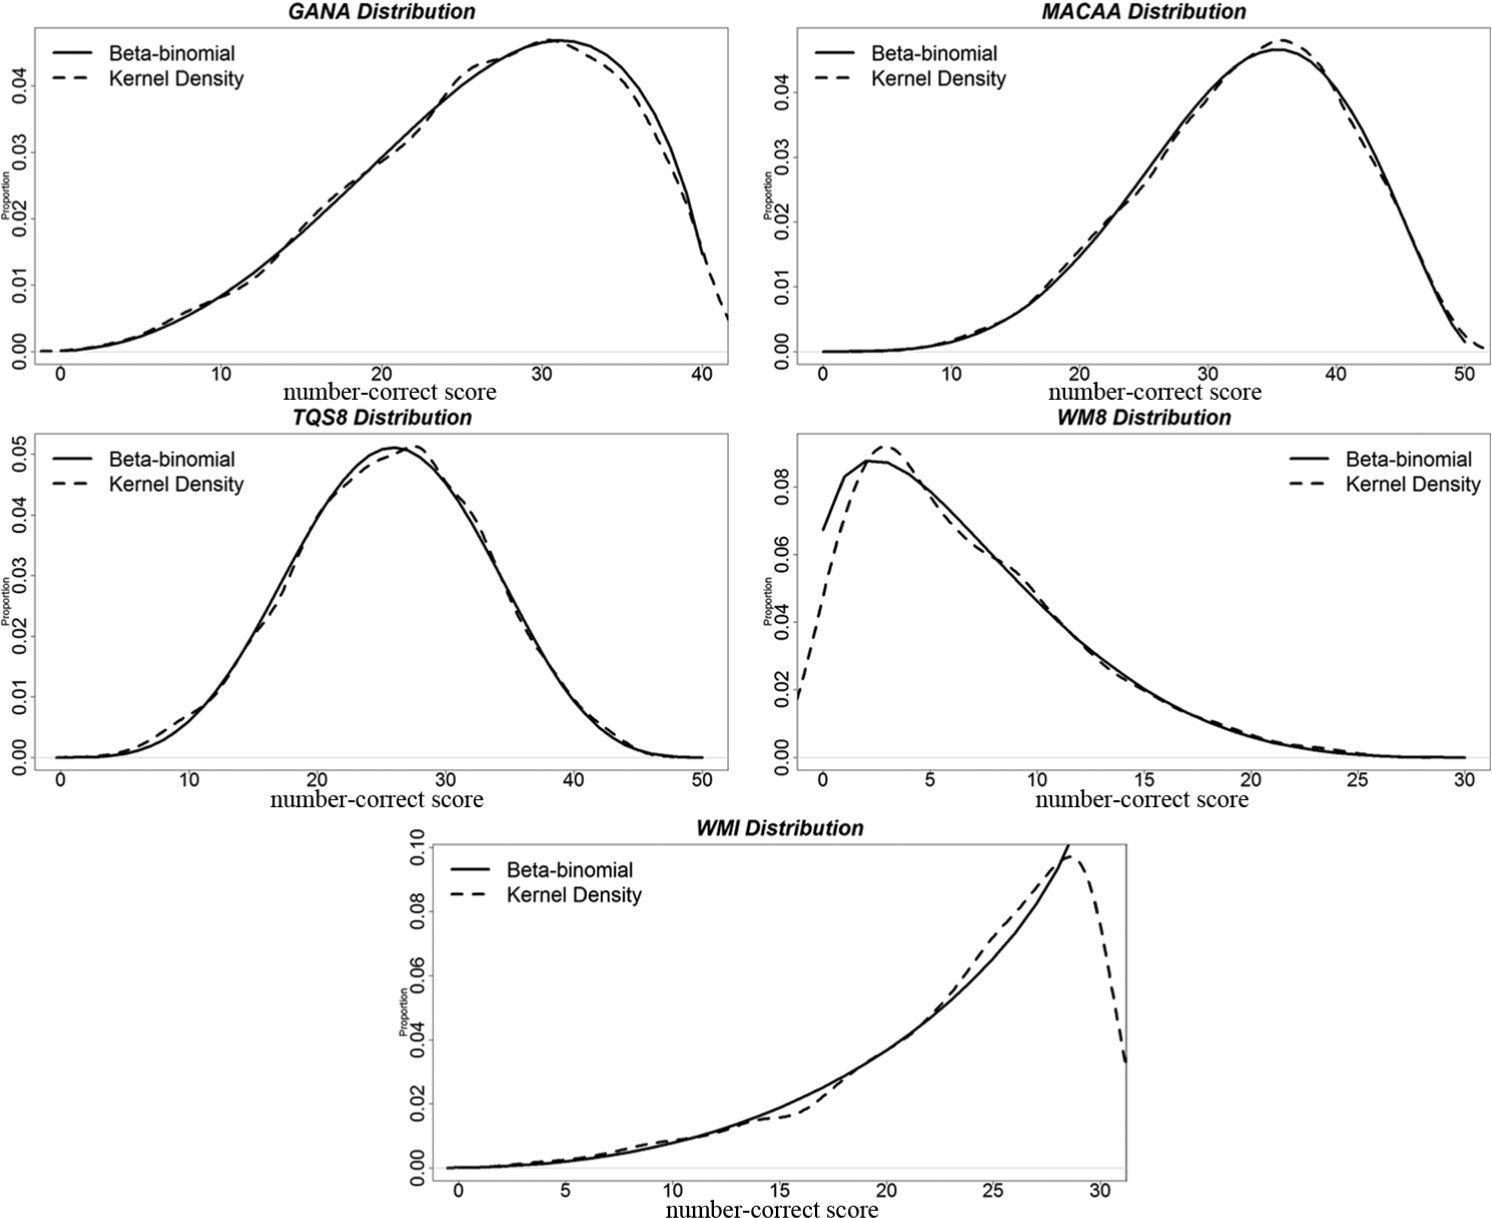
Data were simulated for two groups using a randomly equivalent groups equating design. The observed-score distributions for both tests (Tests X and Y) were simulated using the R-package version 2.8.1 to reflect a range of five differently skewed shapes. The simulation followed the procedures described by Keats and Lord (1962) for generating a negative hypergeometric distribution 3 (the beta-binomial). The data for the five distributions came from Keats and Lord’s (1962) study and used the original test codes. The distributions included one symmetric distribution (TQS8), one positively skewed (WM8), one negatively skewed (WMI), and two slightly negatively skewed distributions (GANA and MACAA). Table 1 describes the data for each simulated observed-score distribution. These distributions were chosen because they represent a variety of possible test score distributions from several testing programs. The two tests (Tests X and Y) were simulated to have approximately the same mean and standard deviation, and were restricted to have the same distribution (see Figure 1). Appendix C of the online version of this article includes summary statistics for each simulated observed-score distribution.
Summary of the Simulated Observed-Score Distributions.
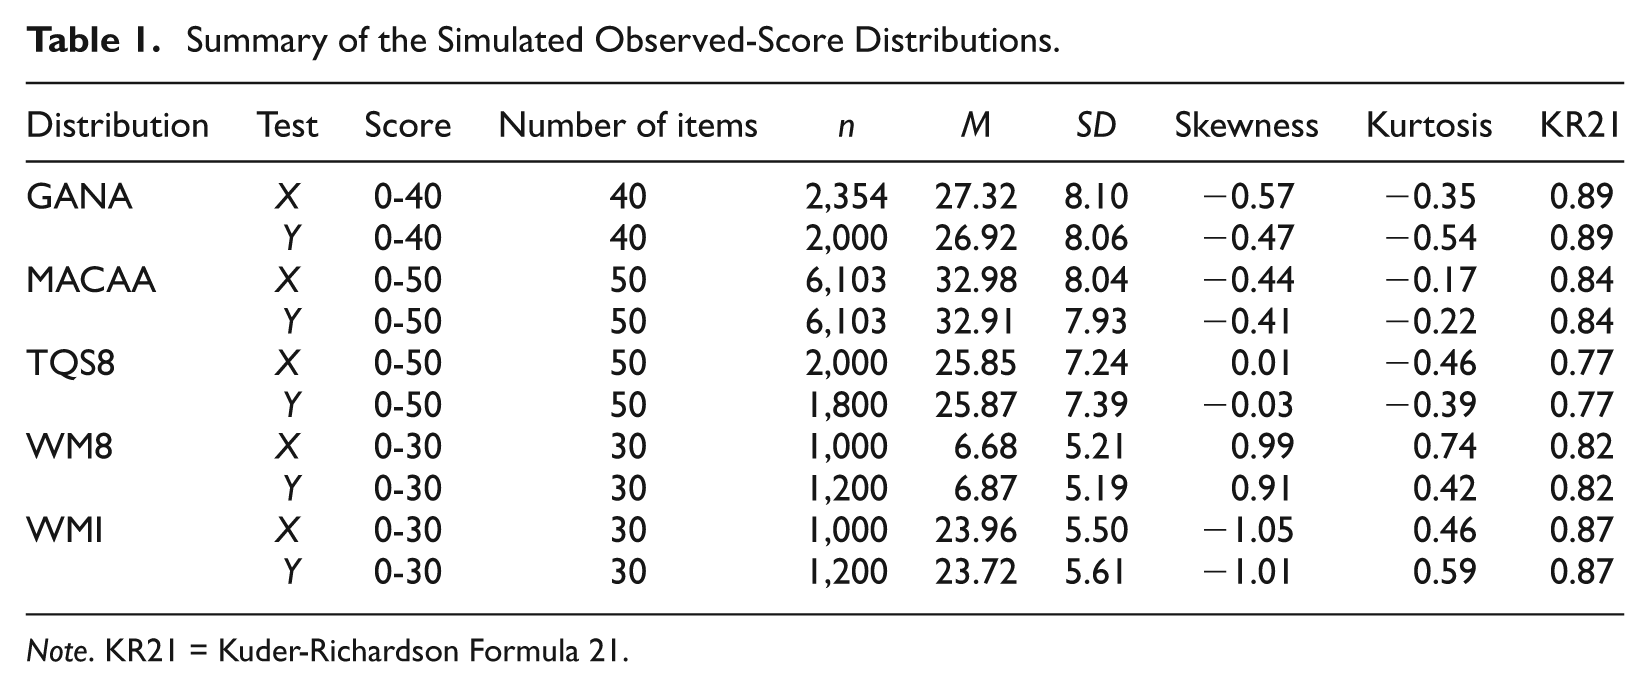
Note. KR21 = Kuder-Richardson Formula 21.
Negative hypergeometric distributions.
Extreme values were defined as values at the 2.5th and at the 97.5th percentiles in each simulated distribution. These values were repeated (nr) times, which equaled 4% and 8% of the test sample size. To investigate the potential effect of extreme atypical scores (spikes) in the KE function, extreme scores were generated in each distribution in different proportions (4% and 8%) resulting in 10 extreme score distributions. Lowest and/or highest values were repeated in each score distribution depending on the skewness of their shapes. The lowest value was repeated n times in three score distributions (GANA, MACAA, and WMI). The highest value was repeated n times in one score distribution (WM8). The lowest value and the highest value were repeated n/2 times in the TQS8 distribution. Thus, for the non-extreme data, N values were drawn from the beta-binomial distribution, and for the extreme data, N − nr values were drawn from the beta-binomial distribution. Further investigation of the effect of extreme scores in the form of spikes was accomplished by generating in each distribution extreme scores based on the minimum and maximum observed scores rather than on the 2.5th and the 97.5th percentiles. Extreme values were defined as the minimum values in each simulated distribution. These values were repeated a number of times (nr) equal to 4% of the test sample size. Again, lowest and/or highest values were repeated in each score distribution depending on the skewness of their shapes.
The simulated observed scores were pre-smoothed using LOGLIN software (Educational Testing Service [ETS], 2008), which resulted in smoothed univariate score distributions and covariance matrices of the score probabilities. To capture the skewness and kurtosis of distributions, all univariate score distributions were fitted using log-linear models that preserved the first four moments.
Study I: The Effects of Outliers on the KE Results
To conduct KE, the smoothed score distributions were inputed into the KE software (ETS, 2008). The optimal h parameters were used to compute the kernel continuous distributions in all equating comparisons as implemented in the KE software. 4 The smoothed distributions were equated under the equivalent groups design. The traditional equipercentile equating—that uses linear interpolation for continuization—was chosen as a criterion because of its wide-spread use, not because it is better than other methods. The traditional equipercentile equating was calculated using the RAGE-RGEQUATE (2005) computer program Version 3.22.
Equipercentile equating of the simulated beta-binomial distributions was used as the criterion equating in the comparison of the differences in the equating functions and their standard errors in the different score distributions. KE functions in the data sets were evaluated using (a) unsmoothed traditional equipercentile equating using percentiles from the fitted beta-binomial distributions and (b) pre-smoothed traditional equipercentile equating using the same log-linear models used in KE. In addition, the evaluation of the KE functions occurred in two scenarios: KE with the second part of the penalty function included (penalty function = 1) and excluded (penalty function = 0). Optimal h’s were used for the KE with and without the second part of the penalty function. The KE results were compared with the traditional equipercentile criteria in both scenarios. Note that the continuous cdfs obtained via KE have been scaled to match both the mean and variance of the original distribution, whereas the cdfs obtained through linear interpolation do not match the variance. The equating functions were examined in several ways: (a) The Percent Relative Error (PRE) statistic as computed by the KE software. PRE is a measure of the differences of moments between the equated scores distribution for the new form (X) and the score distribution for the reference form (Y) on the target population. By comparing the moments of the two distributions, PRE measures how well the distribution of the equated scores matches the distribution of Y. A high absolute value of PRE indicates a less effective score equating; (b) The SEE was compared to evaluate the error observed in the equating comparisons; (c) Difference That Matters—DTM (x)—was compared with the DTM (Dorans & Feigenbaum, 1994) criterion, which is half of the number-correct score unit (0.5) for the three forms considered in the study. Any difference that is less than this criterion was deemed to be negligible.
Study II: Epanechnikov and Adaptive Kernels as Alternative Continuization Methods for Discrete Test Score Distributions
In the analyses that compared the fixed (Epanechnikov and Gaussian kernel functions) and adaptive kernels, bandwidth selectors for the fixed kernel functions were implemented in R using the function bw.nrd0. 5 Univariate adaptive kernel density estimates were implemented using the akj function in the quantreg package in R (Koenker, 2008). In this package, adaptive estimation is based on the procedures outlined by Silverman (1986) and used by Portnoy and Koenker (1989). The Gaussian kernel distribution with Silverman’s Rule for selecting the bandwidth was chosen as a criterion. Then, the continuous distribution functions were plotted and compared.
Results
Study I
Throughout most of the score ranges, the results show little differences between KE functions and unsmoothed equipercentile functions. 6 However, the differences are larger at the extreme of the scores. The differences of these equating functions are plotted in Figure 2. The differences that occur between the equating functions are most noticeable at the high and low extremes, respectively, for the two highly skewed distributions, the WM8 and WMI. In the TQS8 distribution—a curve that resembles the normal distribution—there was a slight discrepancy in the functions at the extreme low end. The results show that the equating function based on the KE method is quite accurate over most of the score range in the five distributions with different shapes. However, in all distributions, the differences increase at the endpoints of the score scale depending on the shape. In some cases (MACAA, WM8, and WMI), the differences exceed 3.0, which would be considered large in most testing programs. In the most symmetric distribution (TQS8), the inclusion of the penalty function does not affect the differences. However, it slightly increases the difference in the other distributions.
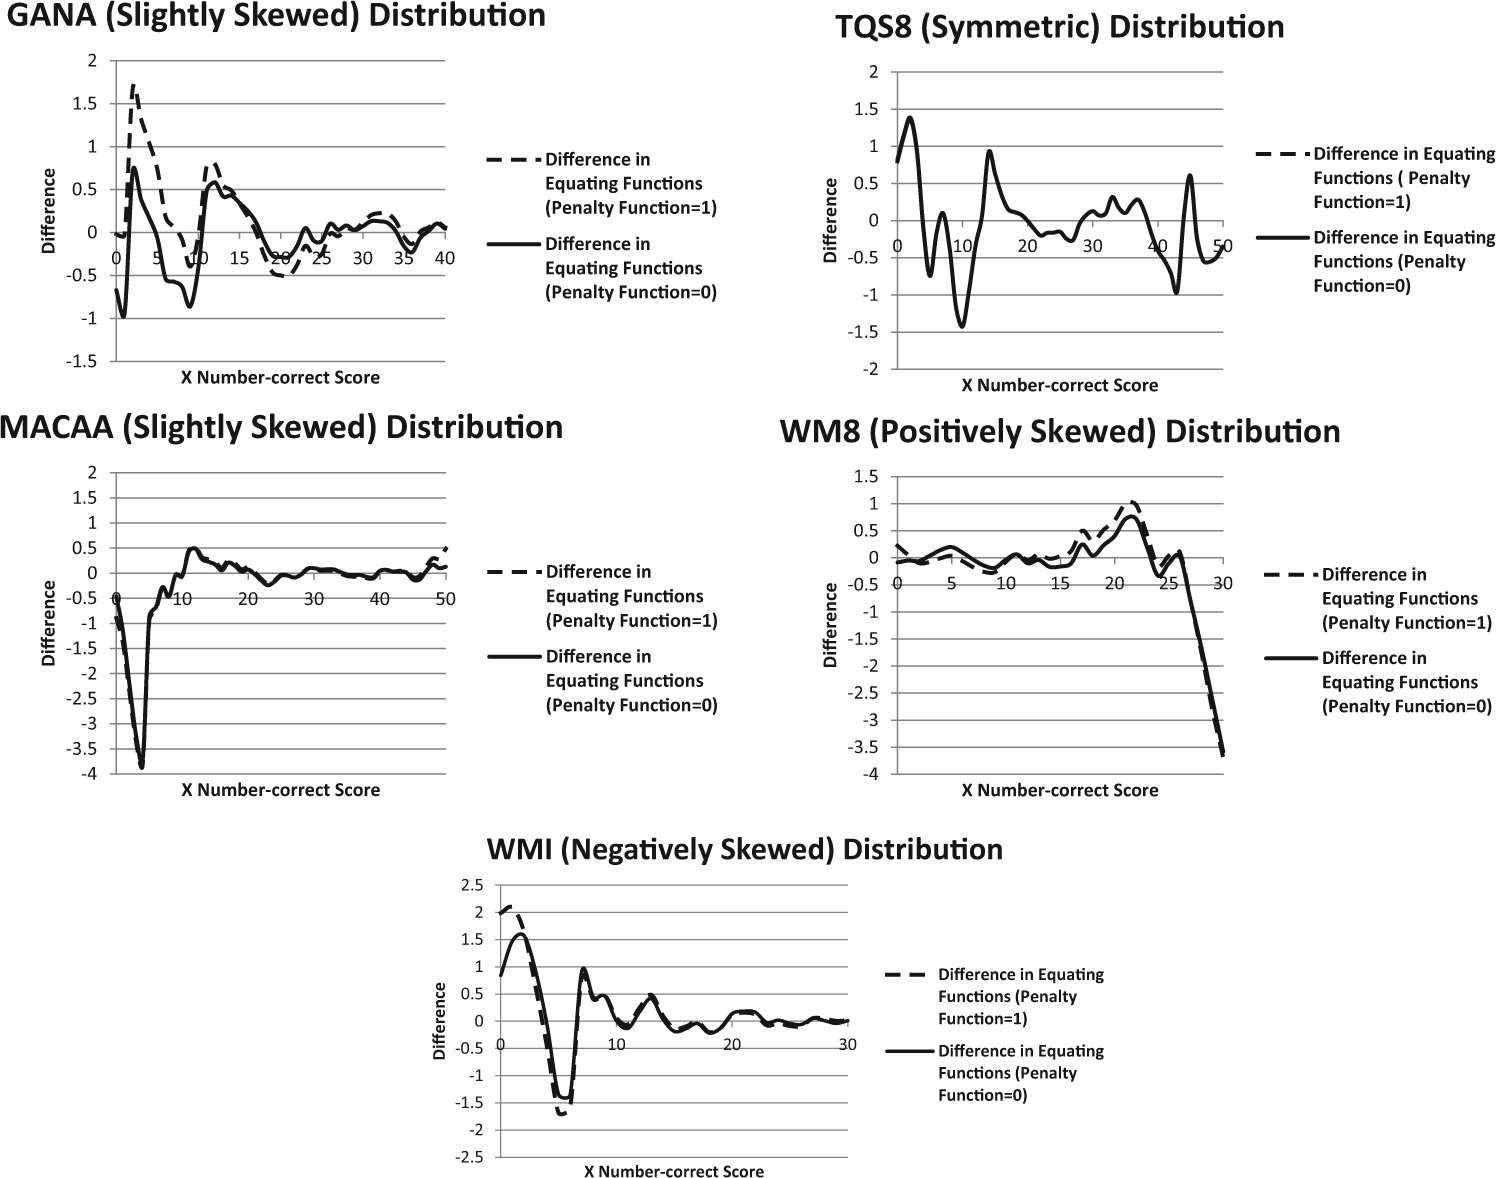
Difference of equating functions between unsmoothed equipercentile and KE (penalty functions 1 and 0) in the five simulated score distributions.
Similar results are observed in the five distributions when extreme scores were generated in different proportions (4% and 8%). In Figure 3, only the results with the WM8 distribution in the 8% condition (negligible differences were observed between the 4% and 8% conditions) are illustrated. Examination of the extreme scores based on the minimum and maximum method further reveals only largest differences between the equipercentile and KE functions at the extreme of the score. The differences in equating functions that included and excluded the second part of the penalty function are negligible in most of the distributions, especially in the TQS8 distribution. Only in the GANA and WM8 distributions, the exclusion of second part of the penalty function appears to have a slight effect in decreasing the difference of the equating functions. Indeed, the GANA and WM8 distributions yield larger PRE values than the other distributions when the second part of the penalty function is included. PRE values are quite smaller and similar across the five distributions. Because negligible differences are observed between conditions that included and excluded the penalty function, the authors present only the plots with the penalty function on. In general, the SEE is larger over scores that are increased in their proportion, with the largest differences occurring at the extremes in areas with fewer observations.
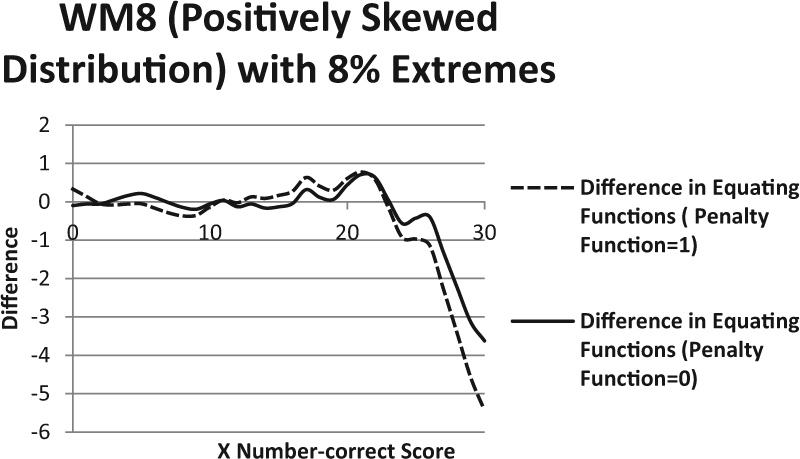
Difference of equating functions between unsmoothed equipercentile and KE (penalty functions 1 and 0) in the WM8 simulated score distribution with extreme scores (8%).
The comparison between the KE function and the pre-smoothed traditional equipercentile equating revealed considerable similarity of the equating functions in all distributions and extreme score conditions, especially when the second part of the penalty function is excluded. Figure 4 illustrates the difference of equating functions between pre-smoothed traditional equipercentile and KE in the TQS8 and WM8 distributions (8% extreme conditions). Although the largest differences occur at the extremes and are associated with the implementation of the penalty function, it is important to note that these differences are smaller than the DTM. Likewise, regardless of the implementation of the penalty function, almost no differences are observed between the functions in the most symmetric of the distributions, TQS8. Appendix D of the online version of this article provides additional plots of the differences of equating functions between pre-smoothed traditional equipercentile and KE in the five distributions (8% extreme and 4% minimum/extreme conditions).
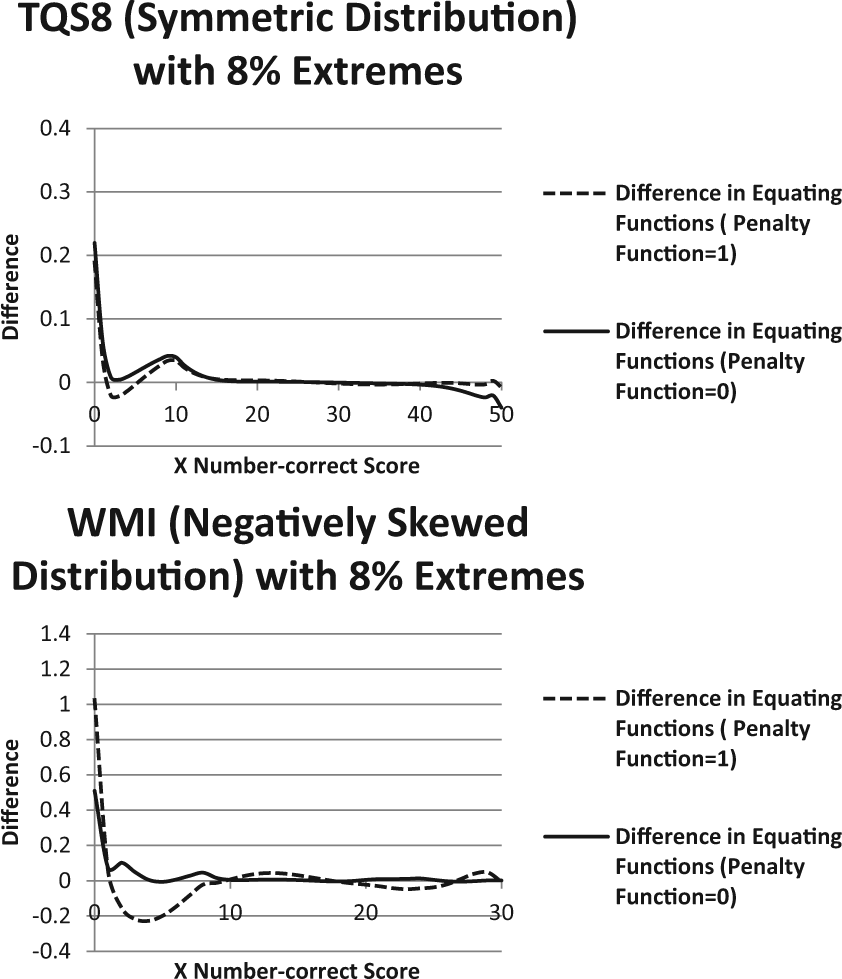
Difference of equating functions between pre-smoothed equipercentile and KE (penalty functions 1 and 0) in the TQS8 and WMI simulated score distributions (8% extreme scores).
Study II
To illustrate the potential application of adaptive kernel density estimates, the fixed (Epanechnikov and Gaussian kernel functions) and adaptive kernels were compared in the five distributions. Recall that bandwidth selectors to compute the Gaussian and Epanechnikov kernel functions were implemented using the Silverman’s rule. This procedure yielded the same default value for both Gaussian and Epanechnikov kernel functions. Although in general, the adaptive and the Gaussian kernel functions follow a similar pattern in the distributions with 8% of extreme scores, the Epanechnikov kernel tends to be slightly smoother than the other two kernels in the tails of the GANA and MACAA distributions. However, in the distributions with minimum and/or maximum extreme scores (see Figure 5), the adaptive kernel is smoother than the Epanechnikov and Gaussian kernel functions at the tails in all the distributions. In general, the Gaussian kernel follows more closely the spikes of the distributions. It is important to stress, however, that these comparisons are exploratory in nature as other bandwidth selection methods (e.g., Sheather & Jones’s method, 1991, or the method implemented in the KE software) may yield different estimates for both Gaussian and Epanechnikov kernels. The bandwidth selection method used in these comparisons was selected because of its common use. However, the authors acknowledge that these methods may not yield optimal values for the two kernels. As the choice of the smoothing parameter affects density estimates, further investigation is needed to draw more general conclusions. Additional plot comparisons for Study II are provided in Appendix E of the online version of this article.
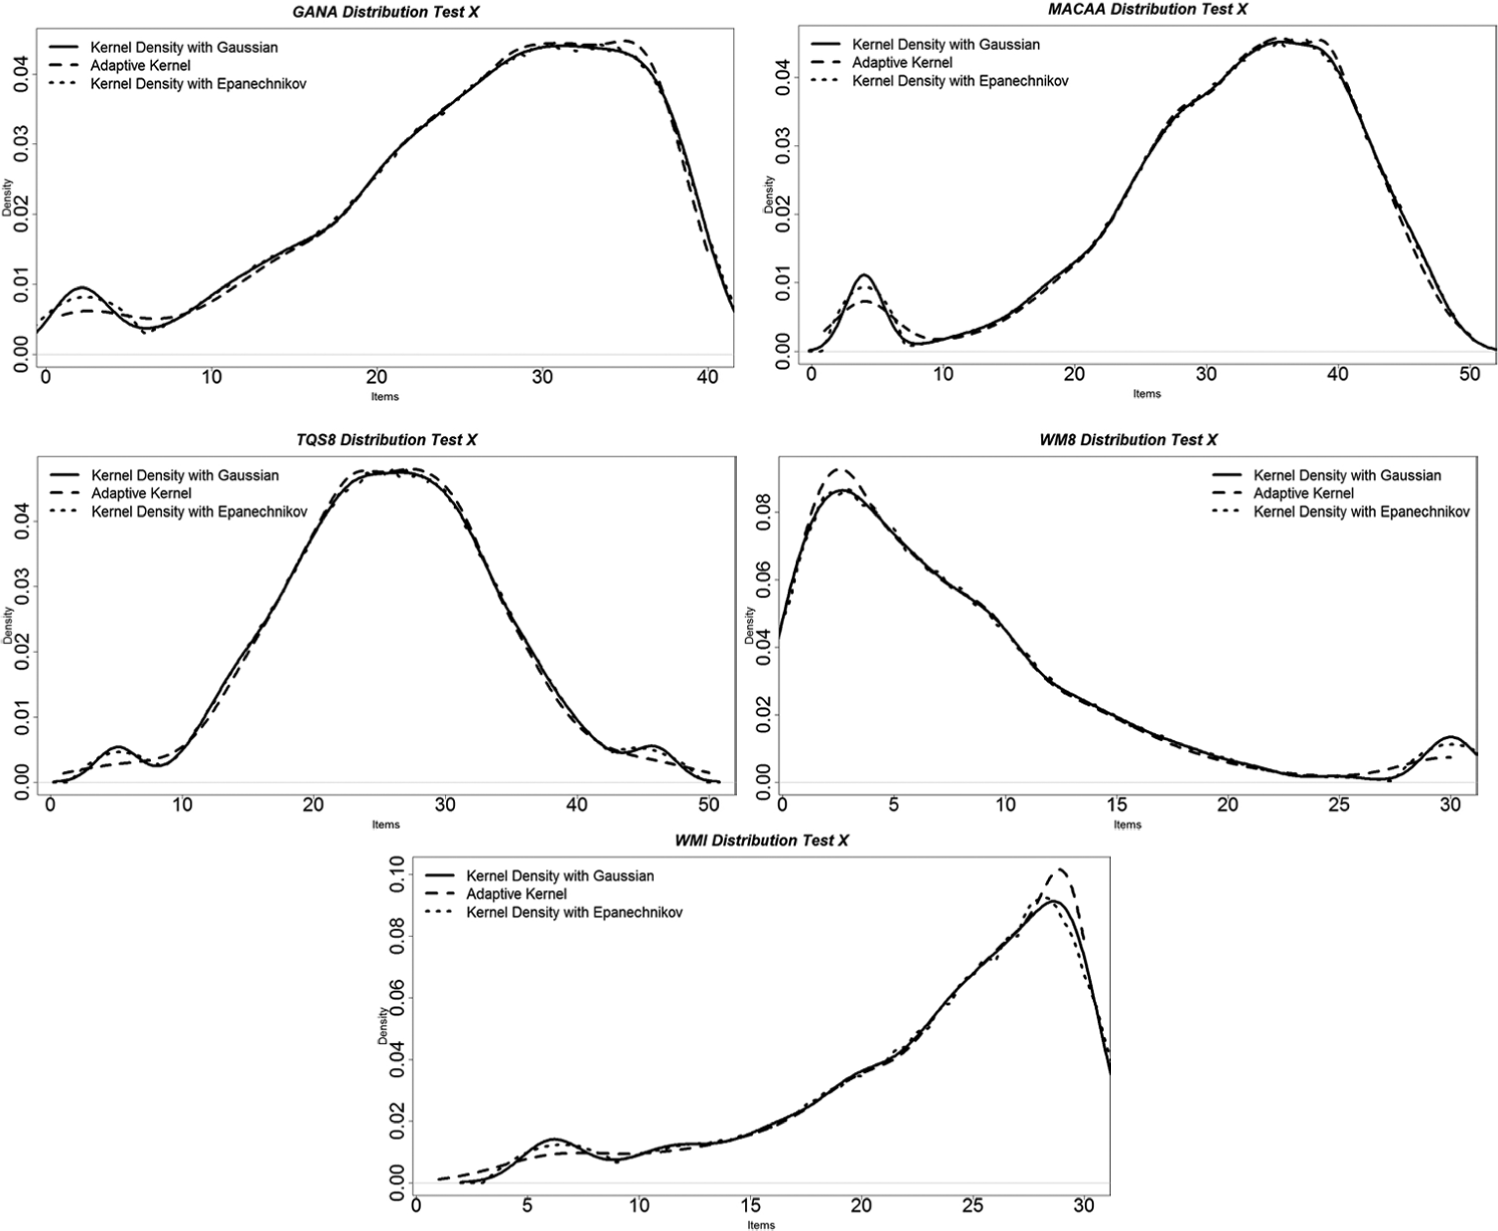
Kernel density estimates in the five distributions with minimum and maximum extreme scores using the adaptive kernel estimates (Test X).
Discussion
This study investigated the effects of atypical extreme scores on test equating. The analysis here focused on the existing methodologies for continuizing distributions, such as the use of the uniform and Gaussian kernels, and investigated other options from the statistical literature on kernel estimators, such as the Epanechnikov and adaptive kernels.
The main contributions of this article are (a) the idea of using smoothing and continuization methods to deal with atypical scores in equating; (b) the observation based on the simulations that although the atypical extreme scores do impact the equating results, the impact is trivial if the spikes are small—smaller than a DTM (Figures 2 and 3); (c) the proposal of the Epanechnikov and adaptive kernels as viable option for continuizing test score distributions in observed-score equating (Figure 5); and (d) the conclusion that the adaptive kernels may provide an alternative continuization method in nonsymmetrical distributions with large spikes at the extreme scores (Figure 5).
One of the takeaway messages from this article is that the traditional equipercentile is not flexible enough to handle spikes in the distributions. In particular, KE offers the practitioner the option of including or not second part of the penalty function, which was shown to have some impact on how close the spikes were tracked on the asymmetric distributions. This issue is particularly important when the distributions are not symmetric. Another consequence for the practitioners is the awareness that because a large bandwidth tends to over-smooth the spikes of the distribution, and a small bandwidth may introduce spurious modes by under-smoothing the real density, adaptive kernel density estimation methods may provide an alternative continuization method in nonsymmetrical distributions with extreme scores (Figure 5). In general, the adaptive kernel estimate was somewhat smoother at the extremes of the distributions (Figure 5). A third message is that the differences in equating functions occur mostly over ranges of scores with few observations located at low or high extremes depending on the shape of the distribution, which again, supports the idea of an adaptive kernel, instead of a one kernel for the whole score range.
Because this study used a variety of possible test score distributions to represent a range of skewed shapes, it is important to note that it is possible that not only the differences in the amount of spikes may have affected the equating results across conditions but also that differences in the chosen statistics (i.e., mean, standard deviation, sample sizes). Therefore, the results should be interpreted with caution. It may be worth pursuing to examine the effect of spikes at extreme scores when the distributions of X and Y are skewed and slightly different. Finally, it would be advantageous to explore the potential effect of extreme scores and the potential boundary bias issue in real data sets that provide various degrees of symmetry.
Another important limitation of this study is that although the potential use of an adaptive kernel as an alternative to the Gaussian kernel is illustrated, its performance in the equating analyses were not evaluated. Further studies that explore the use of the Epanechnikov and adaptive kernels as alternatives continuization methods in KE in a variety of circumstances are being conducted by Gonzalez and von Davier (2014).
Footnotes
Declaration of Conflicting Interests
The author(s) declared no potential conflicts of interest with respect to the research, authorship, and/or publication of this article.
Funding
The author(s) received no financial support for the research, authorship, and/or publication of this article.