
Abstract
At present, there are only a limited number of studies examining how to optimally construct cognitive diagnostic tests. The cognitive diagnostic index (CDI) and attribute-level discrimination index (ADI) have been proposed to assemble such tests. The CDI and ADI have been shown to be instrumental in constructing cognitive diagnostic tests when the attribute relationships are assumed to be nonhierarchical. For greater generality when designing cognitive diagnostic assessment, attribute hierarchy and the ratio of test length to the number of attributes (RTA) are two important factors to be considered. This article proposes modified indices that take into account attribute hierarchy and RTA. Simulation studies show that, under the deterministic input, noisy, “and” gate model (DINA) and the reduced version of the reparameterized unified model (rRUM), the proposed indices provide higher attribute and attribute pattern correct classification rates than the original indices.
Keywords
Introduction
Cognitive diagnosis models (CDMs) belong to a class of statistical models that can be used to assess multiple latent traits. In CDMs, examinees are typically characterized by a set of dichotomous skills or attributes. Each attribute pattern represents the attributes that an examinee has mastered or has not mastered. At present, several studies exist providing guidance on how tests can be constructed from a CDM perspective. First, the cognitive diagnostic index (CDI; Henson & Douglas, 2005) and the attribute-level discrimination index (ADI; Henson, Roussos, Douglas, & He, 2008) can be used to accomplish such a purpose. CDI measures an item’s overall discrimination power by using Kullback–Leibler information and serves as a measure of how informative an item is in correctly classifying the examinees’ true status. However, CDI does not provide any information about an item’s discrimination power for a specific attribute (Henson et al., 2008). To address this issue, ADI was developed to indicate the discrimination power of an item with respect to each of the attributes. Second, genetic algorithm (GA; Finkelman, Kim, & Roussos, 2009) and binary programming (BP; Finkelman, Kim, Roussos, & Verschoor, 2010) have been proposed for test construction purposes in the context of CDMs. Finkelman et al. (2010) provided guidelines on how to choose from different test construction methods, namely, CDI, BP, and GA. In particular, as the only feasible method, GA is recommended when specific correct classification rates (CCRs) are of interest. When targeting specific CCRs that are not specified or may not be feasible (e.g., when test length is fixed and relatively short), GA can still be used to minimize the average error rate or the maximum attribute-level error rate so long as the procedure remains computationally viable. However, when GA becomes computationally burdensome, CDI and BP can be used to accomplish the former and latter goals, respectively. It can be noted that these guidelines do not cover the use of ADI. In addition, although the usefulness of CDI and ADI has been demonstrated in Henson and Douglas (2005) and Henson et al. (2008), respectively, the performance of these two indices has yet to be compared. More importantly, the different test construction procedures discussed above have been studied only in the context of independent and correlated attribute structures, but not in the context of hierarchically structured attributes. To address this gap in the literature, this study will focus on comparing and addressing the limitations of CDI and ADI as indices for test construction when the attributes follow a hierarchical structure.
With most CDMs, the Q-matrix (Tatsuoka, 1983) is used to identify the skills or attributes required to answer each item correctly. Studies show that a subset of the attribute patterns will not occur when attributes have hierarchical structures (de la Torre, Hong, & Deng, 2010; Leighton, Gierl, & Hunka, 2004). The design of CDI and ADI implicitly assumes that attributes have a nonhierarchical relationship. For this reason, it is not clear that constructing a test of fixed length using the CDI method can provide optimal attribute classification rates across different attribute structures (de la Torre et al., 2010). In this study, some drawbacks of CDI and ADI are noted when attributes have hierarchical structures.
Cheng (2010) underlined the importance of ensuring that each attribute is measured by an adequate number of items. This implies that the ratio of test length to the number of attributes (RTA) needs to be considered when constructing a cognitive diagnostic test. However, CDI and ADI do not take RTA into consideration. Consequently, tests based on these indices may not measure all the attributes with the same level of accuracy.
The goal of this study is to address the shortcomings of CDI and ADI by modifying these indices to explicitly account for attribute hierarchy and RTA. Four simulation studies based on the setting of previous research were conducted to evaluate and compare the performance of the original and proposed indices.
Background
CDM
Many CDMs have been proposed in the literature. The common CDMs include deterministic input, noisy, “and” gate model (DINA; Haertel, 1989; Junker & Sijtsma, 2001); noisy input, deterministic, “and” gate model (NIDA; Junker & Sijtsma, 2001); multiple classification latent class model (MCLCM; Maris, 1999); the reparameterized unified model (RUM; Roussos et al., 2007); and the log-linear cognitive diagnosis model (LCDM; Henson, Templin, & Willse, 2009). In their original study, Henson and Douglas (2005) used the reduced version of the reparameterized unified model (rRUM) and the DINA model. For comparative purposes, this study also focuses only on the DINA model and rRUM. The following is a brief introduction on the DINA model and rRUM.
The DINA model assumes that to answer an item correctly, each attribute measured by the item must be successfully applied. The DINA model includes two different item parameters,

where
The rRUM also assumes that to answer an item correctly, each attribute measured by the item must be successfully applied albeit using a different process. The rRUM includes two different types of item parameters,

where
CDI and ADI
Henson and Douglas (2005) proposed the CDI for test construction in the context of CDMs. CDI, an alternative to Fisher information, utilizing the concept of Kullback–Leibler information (Chang & Ying, 1996), is defined as follows:

where

and
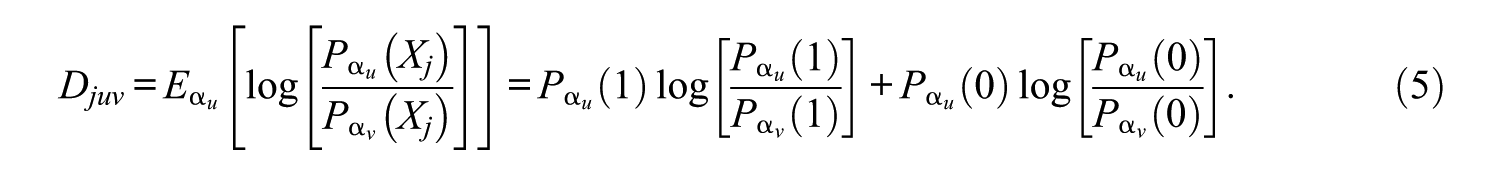
In Equation 5, α
u
and α
v
are 1 ×K attribute vectors (i.e., α
u
= [αu1, . . ., α
uK
] and α
v
= [αv1, . . ., α
vK
]),
Although the CDI measures an item’s overall discrimination power, it does not indicate an item’s discrimination power for a specific attribute. To address this limitation, Henson et al. (2008) proposed an index,

where
For Item j, djk1 is the power to discriminate masters from nonmasters on the kth attribute, whereas djk0 is the power to discriminate nonmasters from masters on the kth attribute, Ωk1 and Ωk0 are the sets of attribute pattern pairs (α
u
, α
v
) that differ only on the kth attribute, and wk1 is defined as the joint probability of attribute patterns given that the examinee has mastered the kth attribute, P(α|α
k
= 1), and wk0 is defined as the joint probability of attribute patterns given that the examinee has not mastered the kth attribute, P(α|α
k
= 0). Notice that if Item j does not measure the kth attribute, then the item does not contain any information about attribute mastery or nonmastery of the kth attribute. As with CDI
j
, ADI
j
can be added across the I items to form the test-level ADI, as in
The CDI and ADI have been evaluated separately in Henson and Douglas (2005) and Henson et al. (2008), respectively. The results of simulation studies show that CDI-based tests outperform randomly constructed tests. Specifically, the former provides higher attribute and attribute pattern CCRs compared with the latter. A strong relationship between ADI and CCRs has also been observed.
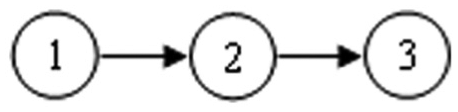
As currently defined, CDI and ADI have a few important limitations. One limitation of the indices is that both indices assume that the attributes have no hierarchical structure. However, in some domains, some hierarchies between attributes may exist (Leighton et al., 2004). The following example shows that if attributes have a linear hierarchy, then CDI and ADI may perform poorly under some conditions. Suppose there are three attributes A1, A2, and A3 (labeled 1, 2, and 3) with a linear hierarchy as shown in Figure 1. The hierarchy means that A1 is a prerequisite to A2, which in turn is a prerequisite to A3.
An example of linear hierarchy.
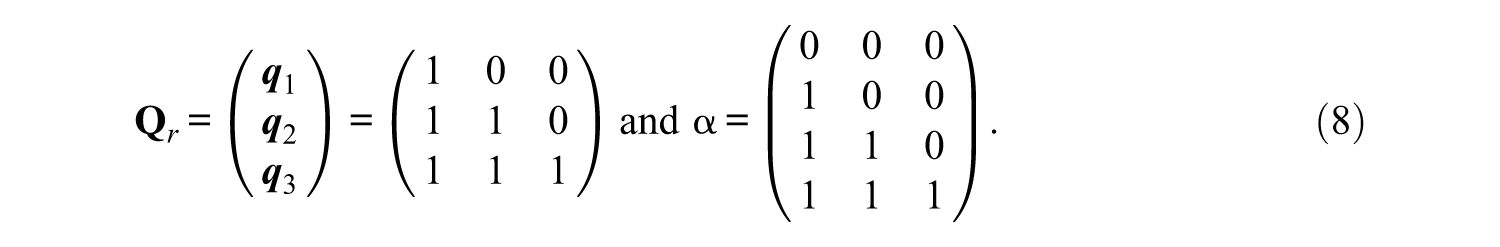
The set of potential items is described by the incidence matrix

For some CDMs (e.g., DINA model), the set of potential items can be reduced when the attributes are related hierarchically. For the example above, the binary representation of Item 2 is (010) indicating the item probes Attribute 2. However, the hierarchy indicates that Attribute 2 requires Attribute 1 as its prerequisite. Thus, Item 2 must be represented by (110). For this reason, Item 2 can be removed. The removal of items in this manner produces a reduced Q-matrix
For illustration purposes, assume sj = gj = .05 for all items.
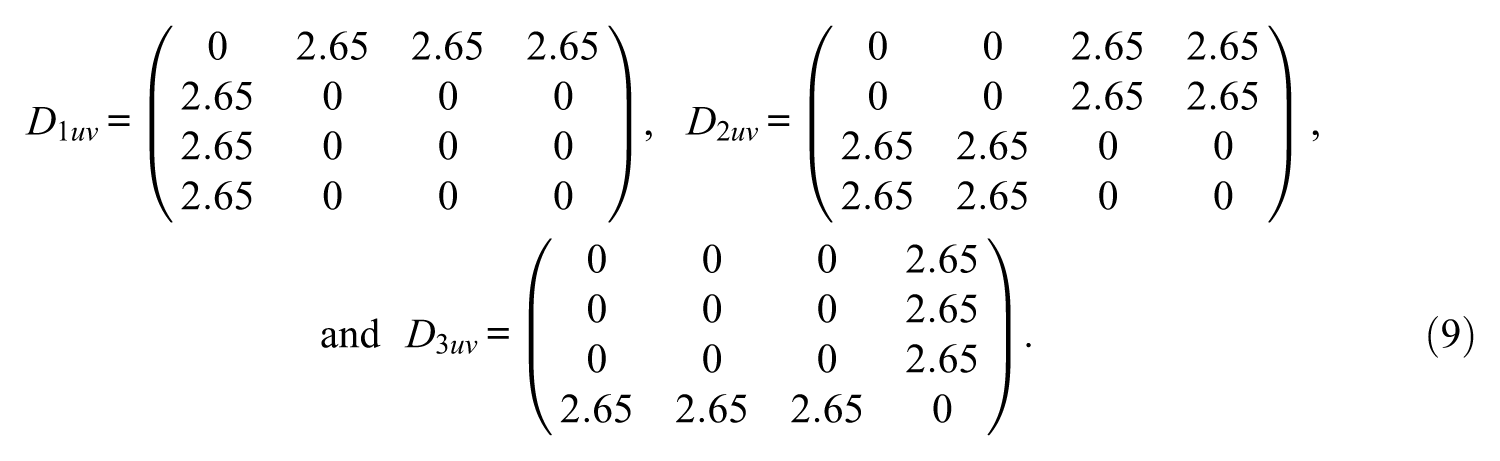
The CDIs of
Another shortcoming of CDI and ADI is that if discriminations of the items are similar, CDI and ADI tend to select single-attribute items regardless of test length. A previous study (Pai, Kuo, & Chen, 2012) shows that when I = 10 and K = 5, the accuracy of a test with both one- and two-attribute items is better than that of a test with one-attribute items only.
Although Henson and Douglas (2005) also employed item constraints and attribute constraints for test construction, no general rules and explanation about the setting of these constraints are stated in their study. The goal of this article is to address these two shortcomings.
Modified CDI and Modified ADI
In this section, two more comprehensive and general indices, the modified cognitive diagnostic index (MCDI) and the modified attribute-level discrimination index (MADI), that consider RTA and attribute hierarchy are proposed. The MCDI and MADI are defined as follows:

where
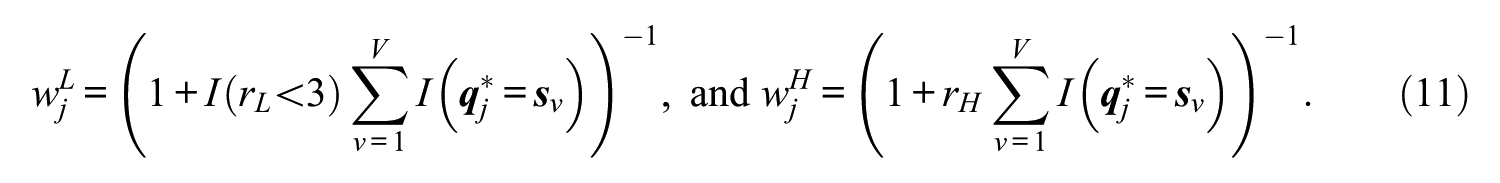
In these equations,
Let the RTA be rL= I/K.Kuo, Wu, and Shih (2012) and Liu (2013) indicated that each attribute in the test must be measured at least 3 times to attain better correct attribute classification. When test length is sufficiently long to let each attribute be measured at least 3 times, then
Attribute hierarchy is another important factor that affects test construction. Depending on the attribute hierarchy, a reachability matrix

as a measure of the hierarchical relationship between the attribute. This index is
Given in Figure 2 is a flowchart of how the MCDI is used in the test construction process. To construct a test using MCDI, the item with the highest CDI was chose first. After which, the MCDIs of the remaining items in the pool are (re)calculated. Of the remaining items, the item with the highest MCDI was chosen. The process of recalculating the MCDI and adding an item to the test was continued until the target test length has been reached.
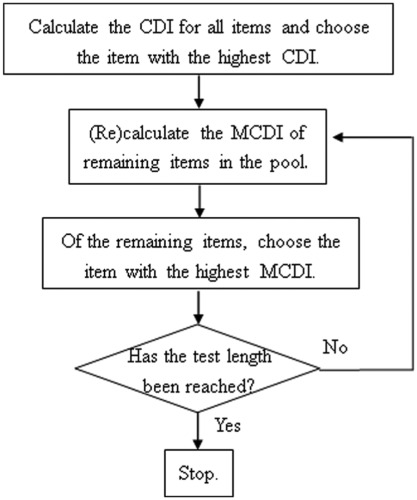
A flowchart of the test construction algorithm based on MCDI.
A flowchart for updating the MCDI of Item j is given in Figure 3. Weights are applied to CDI to derive the MCDI depending on the q-vector of Item j and the length of the test relative to the number of attributes. The same steps can be followed when using MADI in place of MCDI.
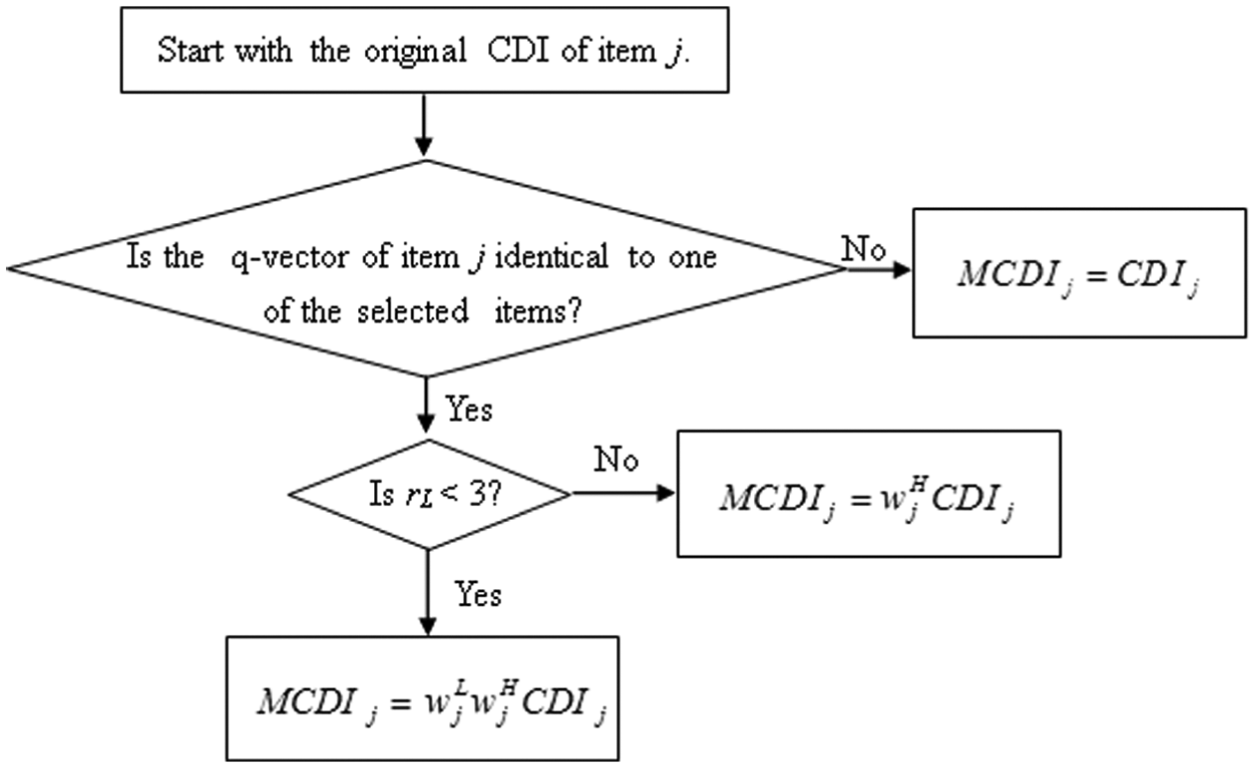
A flowchart on how MCDI of item j is recalculated.
Simulation Studies
Four simulation studies were carried out to examine how MCDI and MADI perform under various conditions. In addition, the performance of the proposed indices was also compared against that of CDI and ADI.
Design
In this section, six attribute hierarchies H0, H1, . . ., H5 were considered to examine how the proposed indices perform when attributes exhibit different hierarchies (refer to Figure 4 for the six hierarchies used in this study).
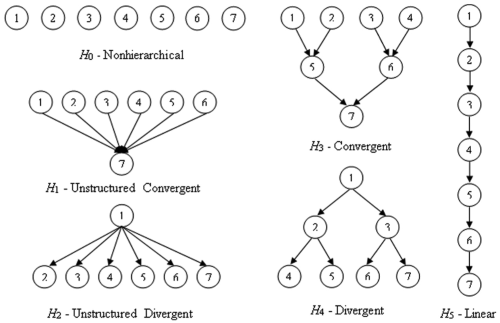
Attribute hierarchies in the simulation studies.
For this study, the number of attributes was fixed to K = 7. The reduced Q-matrix described above was used with the DINA model; in contrast, the full Q-matrix (i.e., all possible q-vectors) was used in the rRUM. The linear hierarchy was used (H5) to illustrate how the items banks were constructed in the DINA model. If the attributes have a nonhierarchical relationship (i.e., H0), the number potential item types (i.e., items with unique attribute specifications) is equal to 2
K
− 1, which is 127 when K = 7. However, as mentioned earlier, the number of attribute specifications can be reduced when the attributes are related in a hierarchy. If the attribute hierarchy follows H5, the resulting reduced Q-matrix
Studies 1 and 3 involved fixed item parameters, whereas Studies 2 and 4 involved randomly generated item parameters. For each item type, 30 items were generated resulting in the following item bank sizes: 3,810 (H0); 1,920 (H1 and H2); 750 (H3 and H4); and 210 (H5) in the DINA model. Only one item bank size (3,810) was used in rRUM. To minimize the impact of the Monte Carlo error, 100 item banks were constructed for each study. However, due to the nature of the item parameters, only in Studies 2 and 4 were the 100 item banks different from each other.
To generate the item responses, two of the studies (1 and 2) used the DINA model and the other two studies (3 and 4) used the rRUM. For Study 1, the slip and the guessing parameters in the DINA model were set to be sj = gj = .05; for Study 2, the slip and guessing parameters were randomly generated from the uniform distribution, U(.05, .4); for Study 3, the item parameters were set to
In each study, tests of length I from an item bank of size J were constructed based on different indices, and test lengths I = 10, 20, and 30 were used. Items were selected sequentially from the item bank across different attribute hierarchies and CDMs until I items were selected. For all algorithms, items with the largest CDI, ADI, MCDI, and MADI were selected first; for the proposed method, MCDI and MADI of the items left in the bank were recalculated as the test construction progressed.
In the simulation studies, the total number of examinees was set to be 16,640. To achieve this, responses of 130 (H0), 256 (H1 and H2), 640 (H3 and H4), and 2,080 (H5) for each permissible attribute pattern were generated. In these studies, the item parameters were assumed to be known, therefore, not estimated. Examinee classification was based on expected a posteriori (EAP). Finally, based on estimated attribute patterns, the attribute correct classification rates (ACCR) and the attribute pattern correct classification rates (PCCR) were computed and compared. This process from item response generation to computing the CCR was replicated 100 times.
The design of the current simulation studies is summarized in Table 1.
Simulation Design.
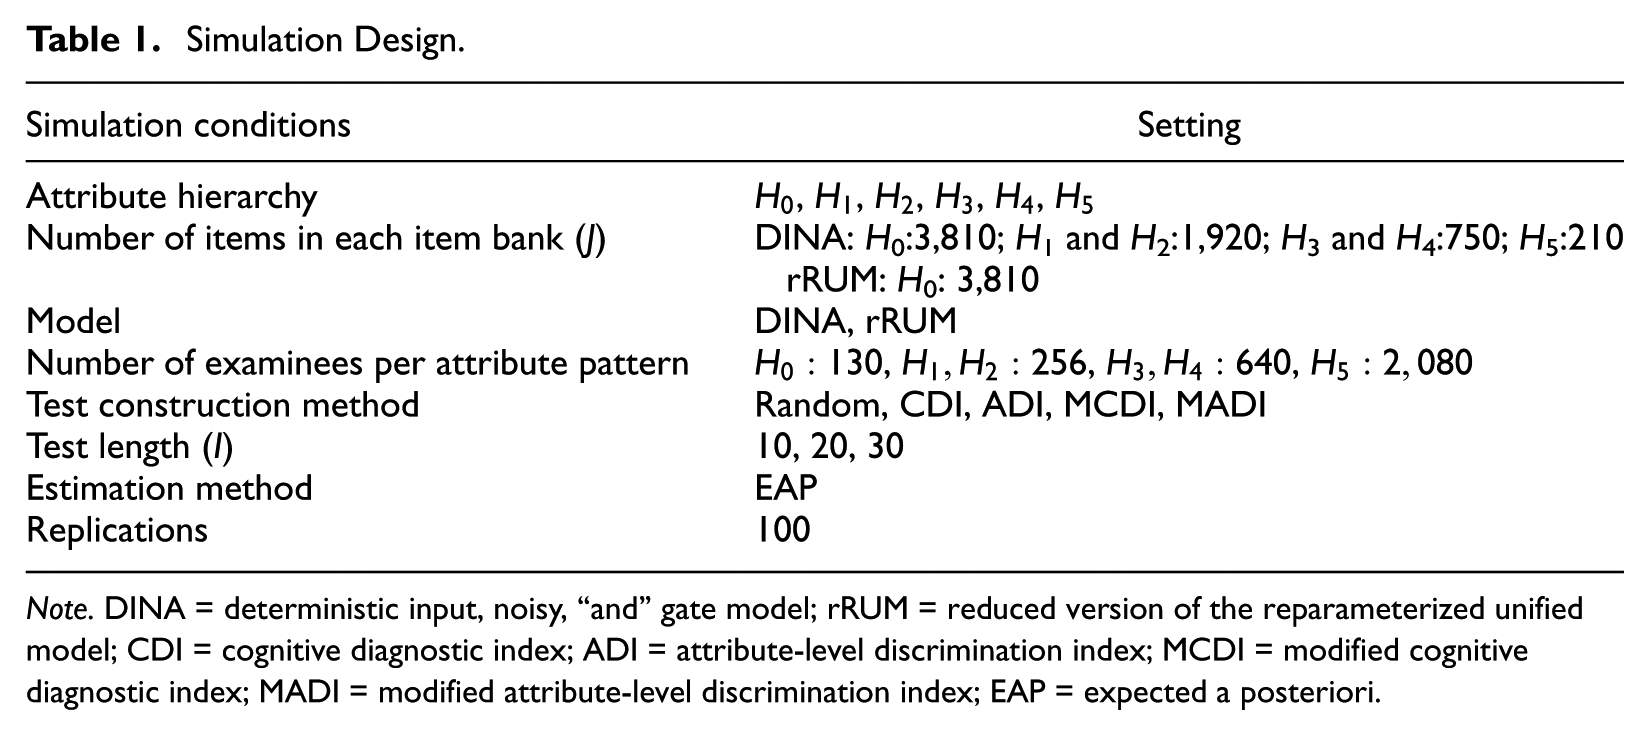
Note. DINA = deterministic input, noisy, “and” gate model; rRUM = reduced version of the reparameterized unified model; CDI = cognitive diagnostic index; ADI = attribute-level discrimination index; MCDI = modified cognitive diagnostic index; MADI = modified attribute-level discrimination index; EAP = expected a posteriori.
Results
Test Construction Based on the DINA Model
The results of the test construction based on the DINA model are summarized in Figures 5 (Study 1) and 6 (Study 2). Figures 5a, 5c, and 5e show the ACCR when test lengths are equal to 10, 20, and 30, respectively; Figures 5b, 5d, and 5f show the PCCR when test lengths are equal to 10, 20, and 30, respectively.
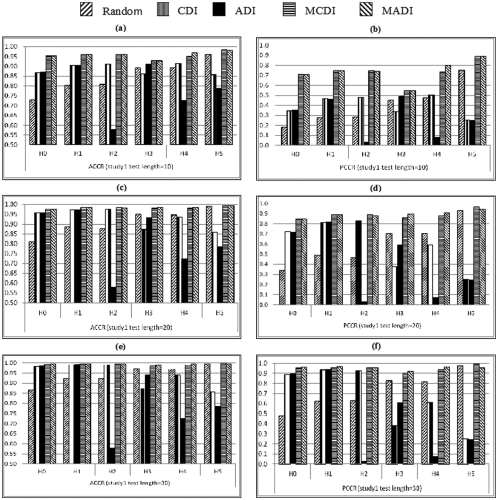
ACCR and PCCR based on the DINA Model in Study 1.
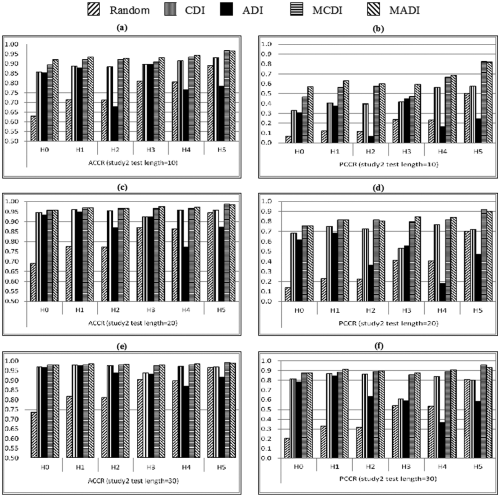
ACCR and PCCR based on the DINA Model in Study 2.
Overall, in Study 1, MCDI and MADI outperformed Random, CDI, and ADI with respect to ACCR and PCCR. When RTA was small, MCDI and MADI substantially outperformed Random, CDI, and ADI. For example, when test length was equal to 10 (RTA < 3) and H0 was true, the ACCR of CDI, ADI, MCDI, and MADI were .87, .87, .95, and .95, respectively; the PCCR of CDI, ADI, MCDI, and MADI are .34, .35, .71, and .71.
When the attributes had hierarchical structures (H1-H5), CDI and ADI performed poorly, except for the 30-item case and H1 was true. In addition, the results of ADI were very unstable. In all conditions, MCDI and MADI performed well—when I = 20 or 30, the ACCR of MCDI and MADI were both higher than .98; when I = 10, the ACCR of MCDI and MADI were all higher than .93. However, it should be noted that the performance of the random method was sometimes better than CDI and ADI when the attributes have hierarchical structures.
The results of Study 2 were similar to those of Study 1. MCDI and MADI outperformed the original indices and random method. When attributes had a nonhierarchical relationship (i.e., H0), ADI performed poorly in all situations. With shorter tests, MCDI and MADI performed better than CDI, and the gaps between these methods were more obvious. When the attributes were hierarchically structured, the ACCR and PCCR of ADI were unstable and can be worse than those of other indices. The results of CDI were more stable and better than those of ADI, but still worse than those of MCDI and MADI.
Clearly, the result based on the DINA model showed that the proposed indices had substantial improvement when RTA was small or attributes had a hierarchical relationship. As test length decreased or the number of layers in the attribute hierarchy increased, the limitations of the original indices became more evident. In most situations, MADI was a little better than MCDI, except for some cases, and when H2 and H5 were true.
Test Construction Based on the rRUM
The results for the two rRUM studies were very similar. Due to space limitation, only the results for Study 4 (see Figure 7) will be discussed. The results in their entirety can be requested from the first author. Figures 7a, 7c, and 7e show the ACCR when I = 10, 20, and 30, respectively; Figures 7b, 7d, and 7f show PCCR when I = 10, 20, and 30, respectively.
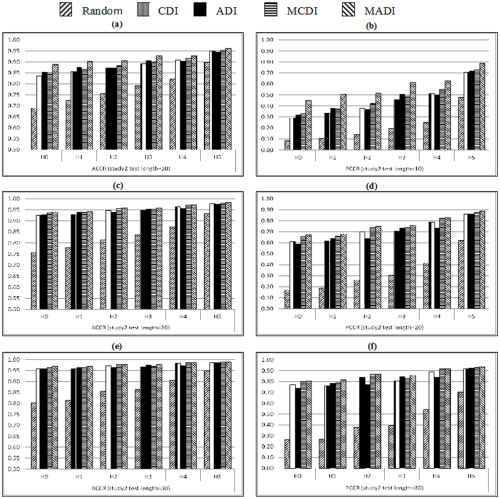
ACCR and PCCR based on the rRUM in Study 4.
The performances of original indices and proposed indices were close when attributes have a linear hierarchical relationship, and test length was equal to 20 or 30. MADI was better than the other indices in all situations. When the attributes were hierarchically structured, the results of ADI were relatively unstable and unsatisfactory, whereas MCDI and MADI had the best performances in most situations.
As with the DINA model, the results based on the rRUM showed that the proposed indices had substantial improvement over the original indices when RTA is small or the attributes had a hierarchical relationship. Regardless of the situation, MCDI and MADI always had better or similar results compared with the other indices. It should be noted that test length should not be too short if good performances were to be expected of all indices.
The Usage of k-Attribute Items
In Tables 2 and 3, two attribute structures, H0 and H5, and the DINA model with sj = gj = .05 were used to illustrate the relationship between the usage of k-attribute items and attribute classification accuracy across different methods of test construction. A k-attribute item is an item that requires k attributes to be answered correctly.
Number of Times k-Attribute Items Are Used Under H0 and DINA Model With sj = gj = .05.
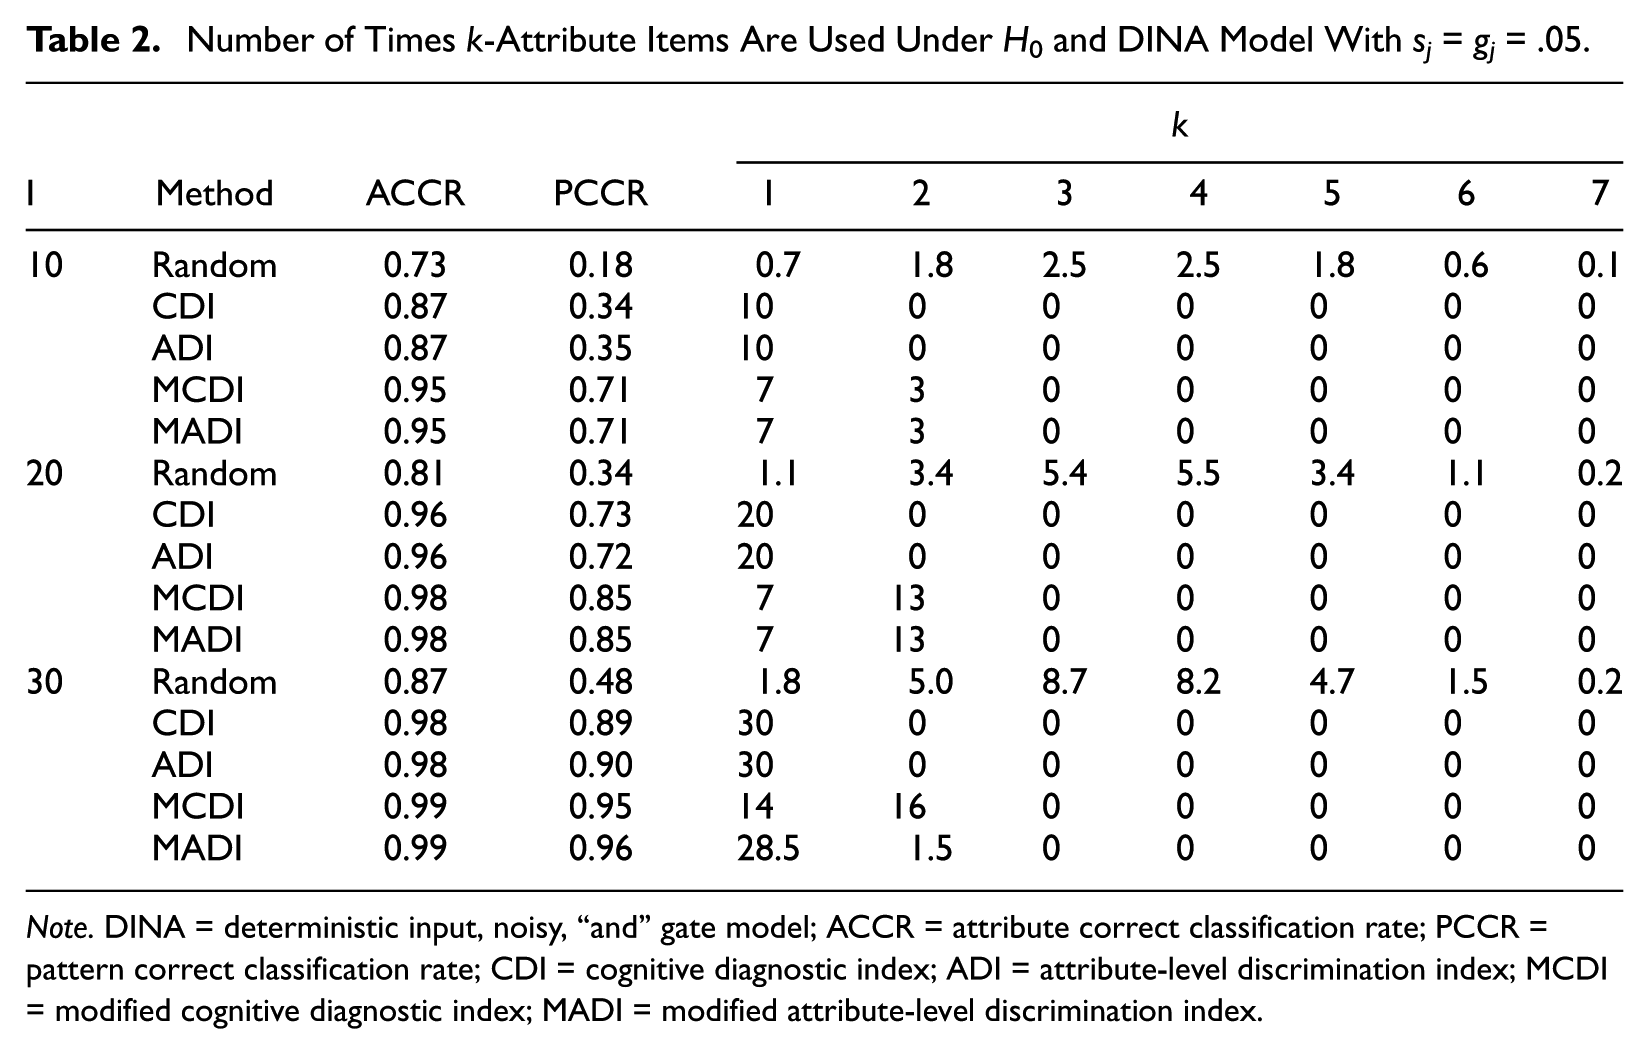
Note. DINA = deterministic input, noisy, “and” gate model; ACCR = attribute correct classification rate; PCCR = pattern correct classification rate; CDI = cognitive diagnostic index; ADI = attribute-level discrimination index; MCDI = modified cognitive diagnostic index; MADI = modified attribute-level discrimination index.
Number of Times k-Attribute Items Are Used Under H5 and DINA Model With sj = gj = .05.
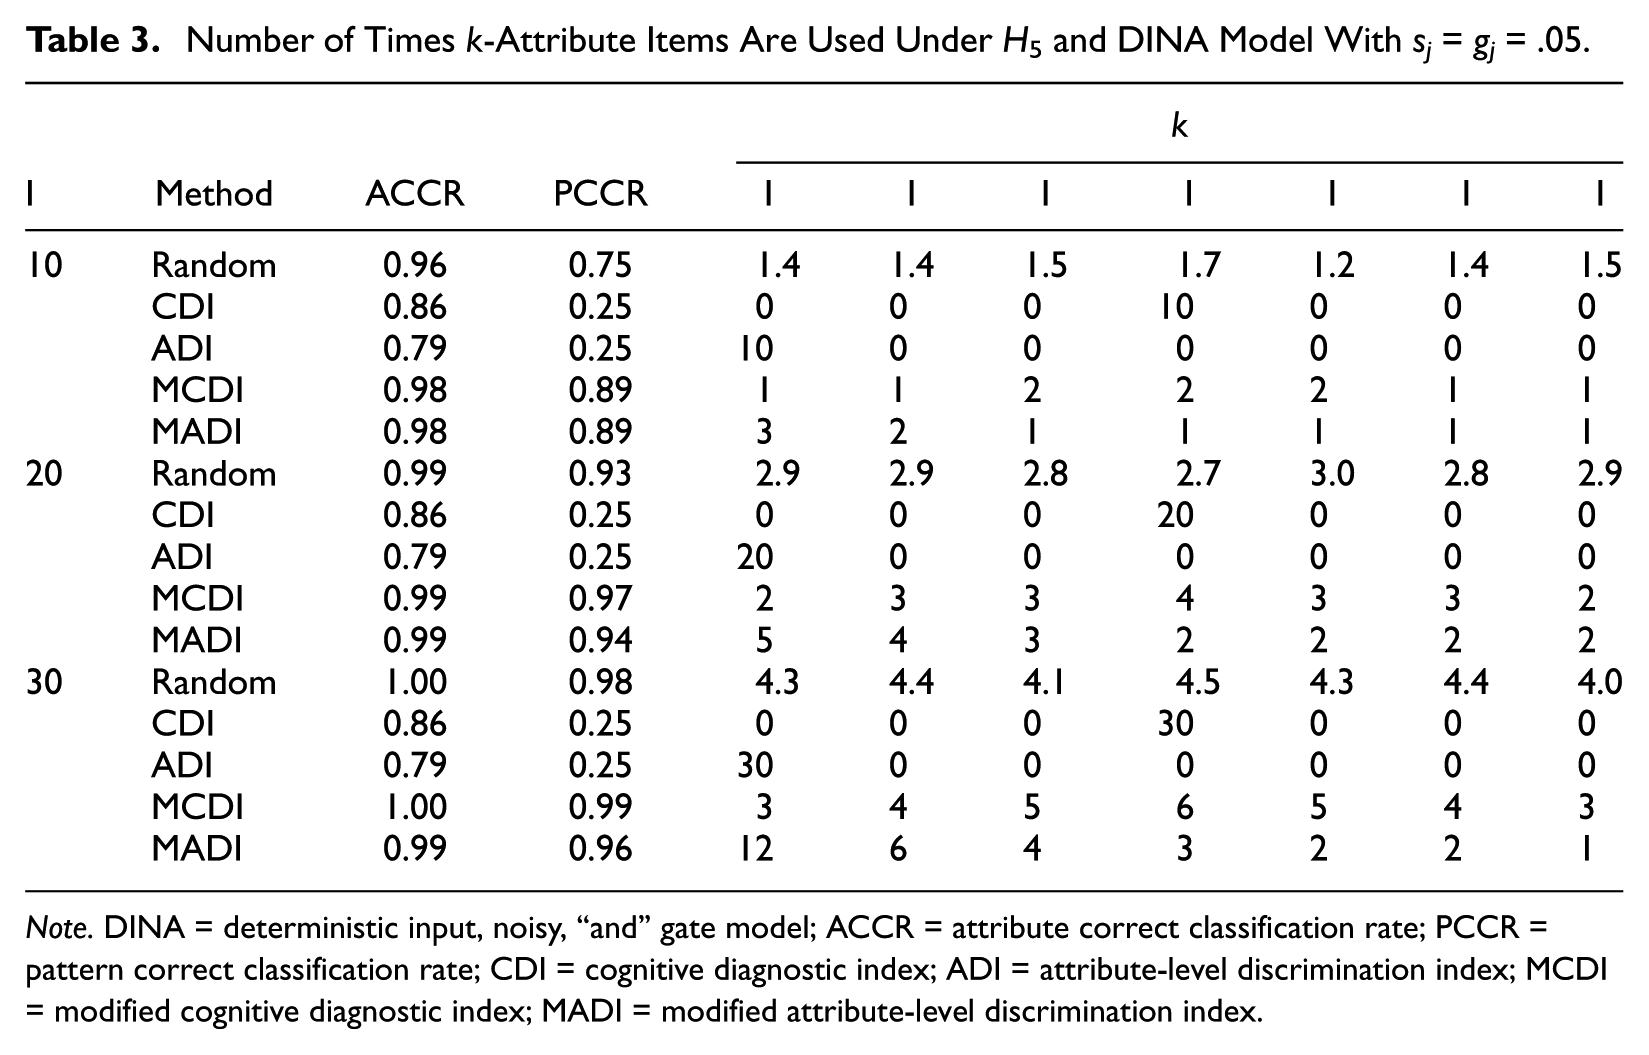
Note. DINA = deterministic input, noisy, “and” gate model; ACCR = attribute correct classification rate; PCCR = pattern correct classification rate; CDI = cognitive diagnostic index; ADI = attribute-level discrimination index; MCDI = modified cognitive diagnostic index; MADI = modified attribute-level discrimination index.
Table 2 shows that, when the attributes had a nonhierarchical structure, CDI and ADI exclusively used one-attribute items, whereas MCDI and MADI used one- and two-attribute items. This table clearly shows that tests with one-attribute items can lead to poorer performances particularly when I was smaller. Although one-attribute items individually can better discriminate between the examinee attribute patterns when the attributes have a nonhierarchical relationship, these items collectively cannot measure the attributes with sufficient number of times when RTA was small leading to relatively poorer attribute classification accuracy. It should be noted that Random, which used all but the seven-attribute items, provided the worst results. Table 3 shows that, when the attributes were linearly structured, CDI and ADI exclusively used four- and one-attribute items, respectively, whereas Random, MCDI, and MADI used all the item types, albeit with different distributions. The table shows that using a single item type for this particular attribute structure resulted in dramatically poorer performances. In addition, the distribution of item type usage can affect the attribute classification—poor results were associated with a more even use of the item types.
Discussion
Cognitively diagnostic test combined tests with CDMs can better inform instruction and learning. Previously, CDI and ADI were proposed for the test construction in the CDM context. This article proposed new modified indices, namely, MCDI and MADI, that account for RTA and attribute hierarchies. Results indicate that MCDI and MADI are more effective than the original CDI and ADI in constructing tests based on the DINA model and rRUM, particularly when RTA is less than 3 or attributes have hierarchies. Specifically, MCDI and MADI can yield considerably higher correct attribute classification rates.
The current work focuses on MCDI- and MADI-based procedures for test construction. However, as noted earlier, other test construction procedures for cognitive diagnosis exist. In the future, it would be instructive to examine how the MCDI and MADI procedures compare with GA and BP. Of particular interest would be the computational feasibility of the GA when the errors to be minimized are defined at the attribute pattern level, not at the individual attribute level. Finkelman et al. (2010) noted that, in situations where GA is not feasible, the original CDI can be used to minimize the average attribute-level error rate. It is not clear whether this statement remains true when the attributes follow a hierarchical structure, or when CDI is replaced by ADI, MCDI, and MADI. Additional work is needed to better understand the properties of GA, BP, and these indices when they are used to construct tests that measure hierarchically structured attributes.
Although the modified indices allow each attribute to be measured adequate number of times, they still have poor performance if test length is very short (i.e., RTA < 1). In addition, for the proposed indices to work properly, attribute hierarchies have to be correctly identified. Follow-up studies are needed to investigate the ideal test lengths to achieve specific levels of attribute classification accuracy, and the consequences of using incorrect assumed attribute hierarchies.
For greater generality, future studies can also be carried out on constructing tests using MCDI or MADI with other CDMs such as G-DINA model (de la Torre, 2011), Higher-order-DINA model (de la Torre & Douglas, 2004), NIDA (Junker & Sijtsma, 2001), and GDM (von Davier, 2008). In addition, different strategies might be involved in solving a problem, and these strategies might require different attributes (de la Torre & Douglas, 2008). Therefore, test construction based on multiple-strategy CDM should also be considered.
Footnotes
Acknowledgements
The authors would like to thank the editor and the anonymous reviewers for insightful comments and valuable suggestions.
Declaration of Conflicting Interests
The author(s) declared no potential conflicts of interest with respect to the research, authorship, and/or publication of this article.
Funding
The author(s) disclosed receipt of the following financial support for the research, authorship, and/or publication of this article: This research was supported by Ministry of Science and Technology, R.O.C. 102-2511-S-142-008-MY3.