
Abstract
This study provides a comprehensive evaluation of the effects of differential item functioning (DIF) on proficiency classification. Using Monte Carlo simulation, item- and test-level DIF magnitudes were varied systematically to investigate their impact on proficiency classification at multiple decision points. Findings from this study clearly show that the presence of DIF affects proficiency classification not by lowering the overall correct classification rates but by affecting classification error rates differently for reference and focal group members. The study also reveals that multiple items with low levels of DIF can be particularly problematic. They can do similar damage to proficiency classification as high-level DIF items with the same cumulative magnitudes but are much harder to detect with current DIF and differential bundle functioning (DBF) techniques. Finally, how DIF affects proficiency classification errors at multiple cut scores is fully described and discussed.
Differential item functioning (DIF) is a popular and effective way to study item bias. It is defined as a difference in the probability of answering an item correctly for examinees of the same ability but from different groups (Zumbo, 1999). The presence of DIF in test items has been well documented in educational research, and a myriad of techniques has been developed to detect DIF (Clauser & Mazor, 1998). While these methods have been shown to be highly effective in a variety of testing conditions (Narayanan & Swaminathan, 1994), less attention has been paid to the practical implications of DIF. This study utilizes Monte Carlo simulation to examine the impact of DIF on one such test use: proficiency classification.
Under the current paradigm of standards-based education, standard setting has become an indispensable component of high-stakes testing. Standard setting defines cut scores that are capable of classifying individuals into meaningful proficiency categories. These categories become yardsticks that schools and districts rely on to determine whether students are keeping up with their educational goals. They also ease the process of reporting test results to stakeholders and the general public. In proficiency classification, high classification accuracy is essential (Ercikan & Julian, 2002). As the presence of DIF may confound such accuracy, it deserves to be systematically examined.
Measurement bias, such as DIF, indicates that members of some groups are measured differently than others. Specifically, bias occurs when a group of examinees is disadvantaged on a test or item due to characteristics that are irrelevant to the trait being assessed (Zumbo, 1999). Measurement error, however, focuses on the difference between true and estimated abilities. That is, high measurement error is characterized by latent trait estimates that are far their target values. When the goal of the test is to classify examinees, the accuracy of such classification decisions is of most importance, rather than the accuracy of individual latent trait estimates. It is hypothesized that increases in measurement bias will lead to increases in measurement error, as bias is a form of systematic measurement error. What is not clear is whether this increase in error is large enough to affect the uses of test scores. This study aims to examine the effects of measurement bias on one such use: proficiency classification.
Classification Accuracy
Proficiency classification plays a very important role in educational and psychological measurement. In licensure or certification testing, it is mandatory to make precise pass/fail decisions to ensure that certified examinees are capable of performing the necessary tasks for society. In the case of large-scale standardized educational testing, proficiency categories (e.g., below basic, basic, proficient, and advanced) must accurately represent the achievement levels of students, so that their progress can be tracked. Without loss of generality, dichotomous classification decisions will be used in the following illustration of classification accuracy and error. Overall, four types of classifications can be made, as shown in Table 1.
Classification Decisions.
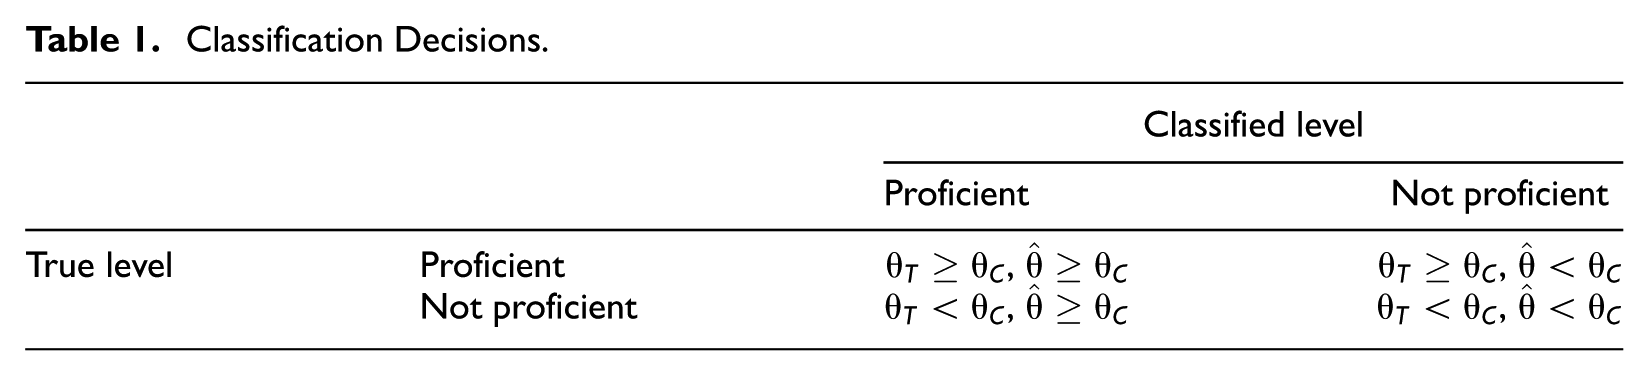
In this table,
DIF/DBF Detection Techniques
Popular methods to detect DIF include logistic regression (Swaminathan & Rogers, 1990), the Mantel-Haenszel procedure (Mantel & Haenszel, 1959), and Simultaneous Item Bias (SIBTEST; Shealy & Stout, 1993). This study utilizes mainly the logistic regression method, under which DIF is detected by comparing the likelihood from two nested models with and without the group effect (Zumbo, 1999). Previous research has shown that logistic regression is at least as effective as other DIF detection methods, such as the Mantel-Haenszel procedure (Holland & Thayer, 1988) in most situations (Clauser & Mazor, 1998; Swaminathan & Rogers, 1990). Other notable advantages of using logistic regression for DIF detection are the ability to detect nonuniform DIF, easy application to polytomous items, and the ability to control for multiple criterion variables (Zumbo, 1999). However, as with other DIF methods, very low DIF magnitudes (e.g., difference in difficulty parameters of less than 0.3) can still be challenging to detect (Clauser, Mazor, & Hambleton, 1993; Swaminathan & Rogers, 1990).
While DIF focuses on test bias at the item level, differential bundle functioning (DBF) examines bias across a set of items (Douglas, Roussos, & Stout, 1996). DBF analyses typically focus on the presence of multidimensionality in the data. That is, a set of items is hypothesized to measure a secondary ability on which two groups of examinees differ; thus, examinees from different groups will still differ in their responses to the bundle of items even after controlling for the primary ability. The most popular method for DBF detection is the SIBTEST (Shealy & Stout, 1993), which divides the test into a studied and matching subtest. The studied subtest consists of the items thought to measure both the primary and secondary abilities, while the matching subtest contains items measuring only the primary ability and is used to match examinees from the reference and focal groups. SIBTEST was utilized in this study as it is the preferred method for DBF detection in practice (Banks, 2013).
Research Questions
The overall goal of this study was to examine how item- and test-level DIF affects proficiency classification. Item-level DIF magnitude is defined as the difference in item difficulty between the reference and focal groups, and test-level DIF is the sum of all item-level DIF within a test. Specifically, the following research questions will be addressed:
To study the above questions, a Monte Carlo simulation study was carefully designed. DIF magnitude was varied in fine increments, so that the sensitivity of the DIF and DBF detection techniques and the impact of DIF on classification accuracy could be investigated simultaneously. In addition, to simulate the testing conditions with more than two proficiency categories, three cut scores were used and, more importantly, the test was designed in such a way that the amount of measurement error associated with each cut score was well controlled.
Method
Examinee and Test Characteristics
Test length was fixed at 40 items. This moderate test length is typical in educational testing and allows for the study of a relatively large range of DIF magnitudes at the test level. Sample size was fixed at 1,000 examinees, large enough to obtain accurate ability estimates under the Rasch model and adequate power for the DIF detection methods. Ability was assumed to follow the standard normal distribution with no impact between the two groups. The reference and focal groups were simulated to be equal in size, as previous research has shown that group size does not affect ability estimation when DIF is present without impact (Cappaert, 2014).
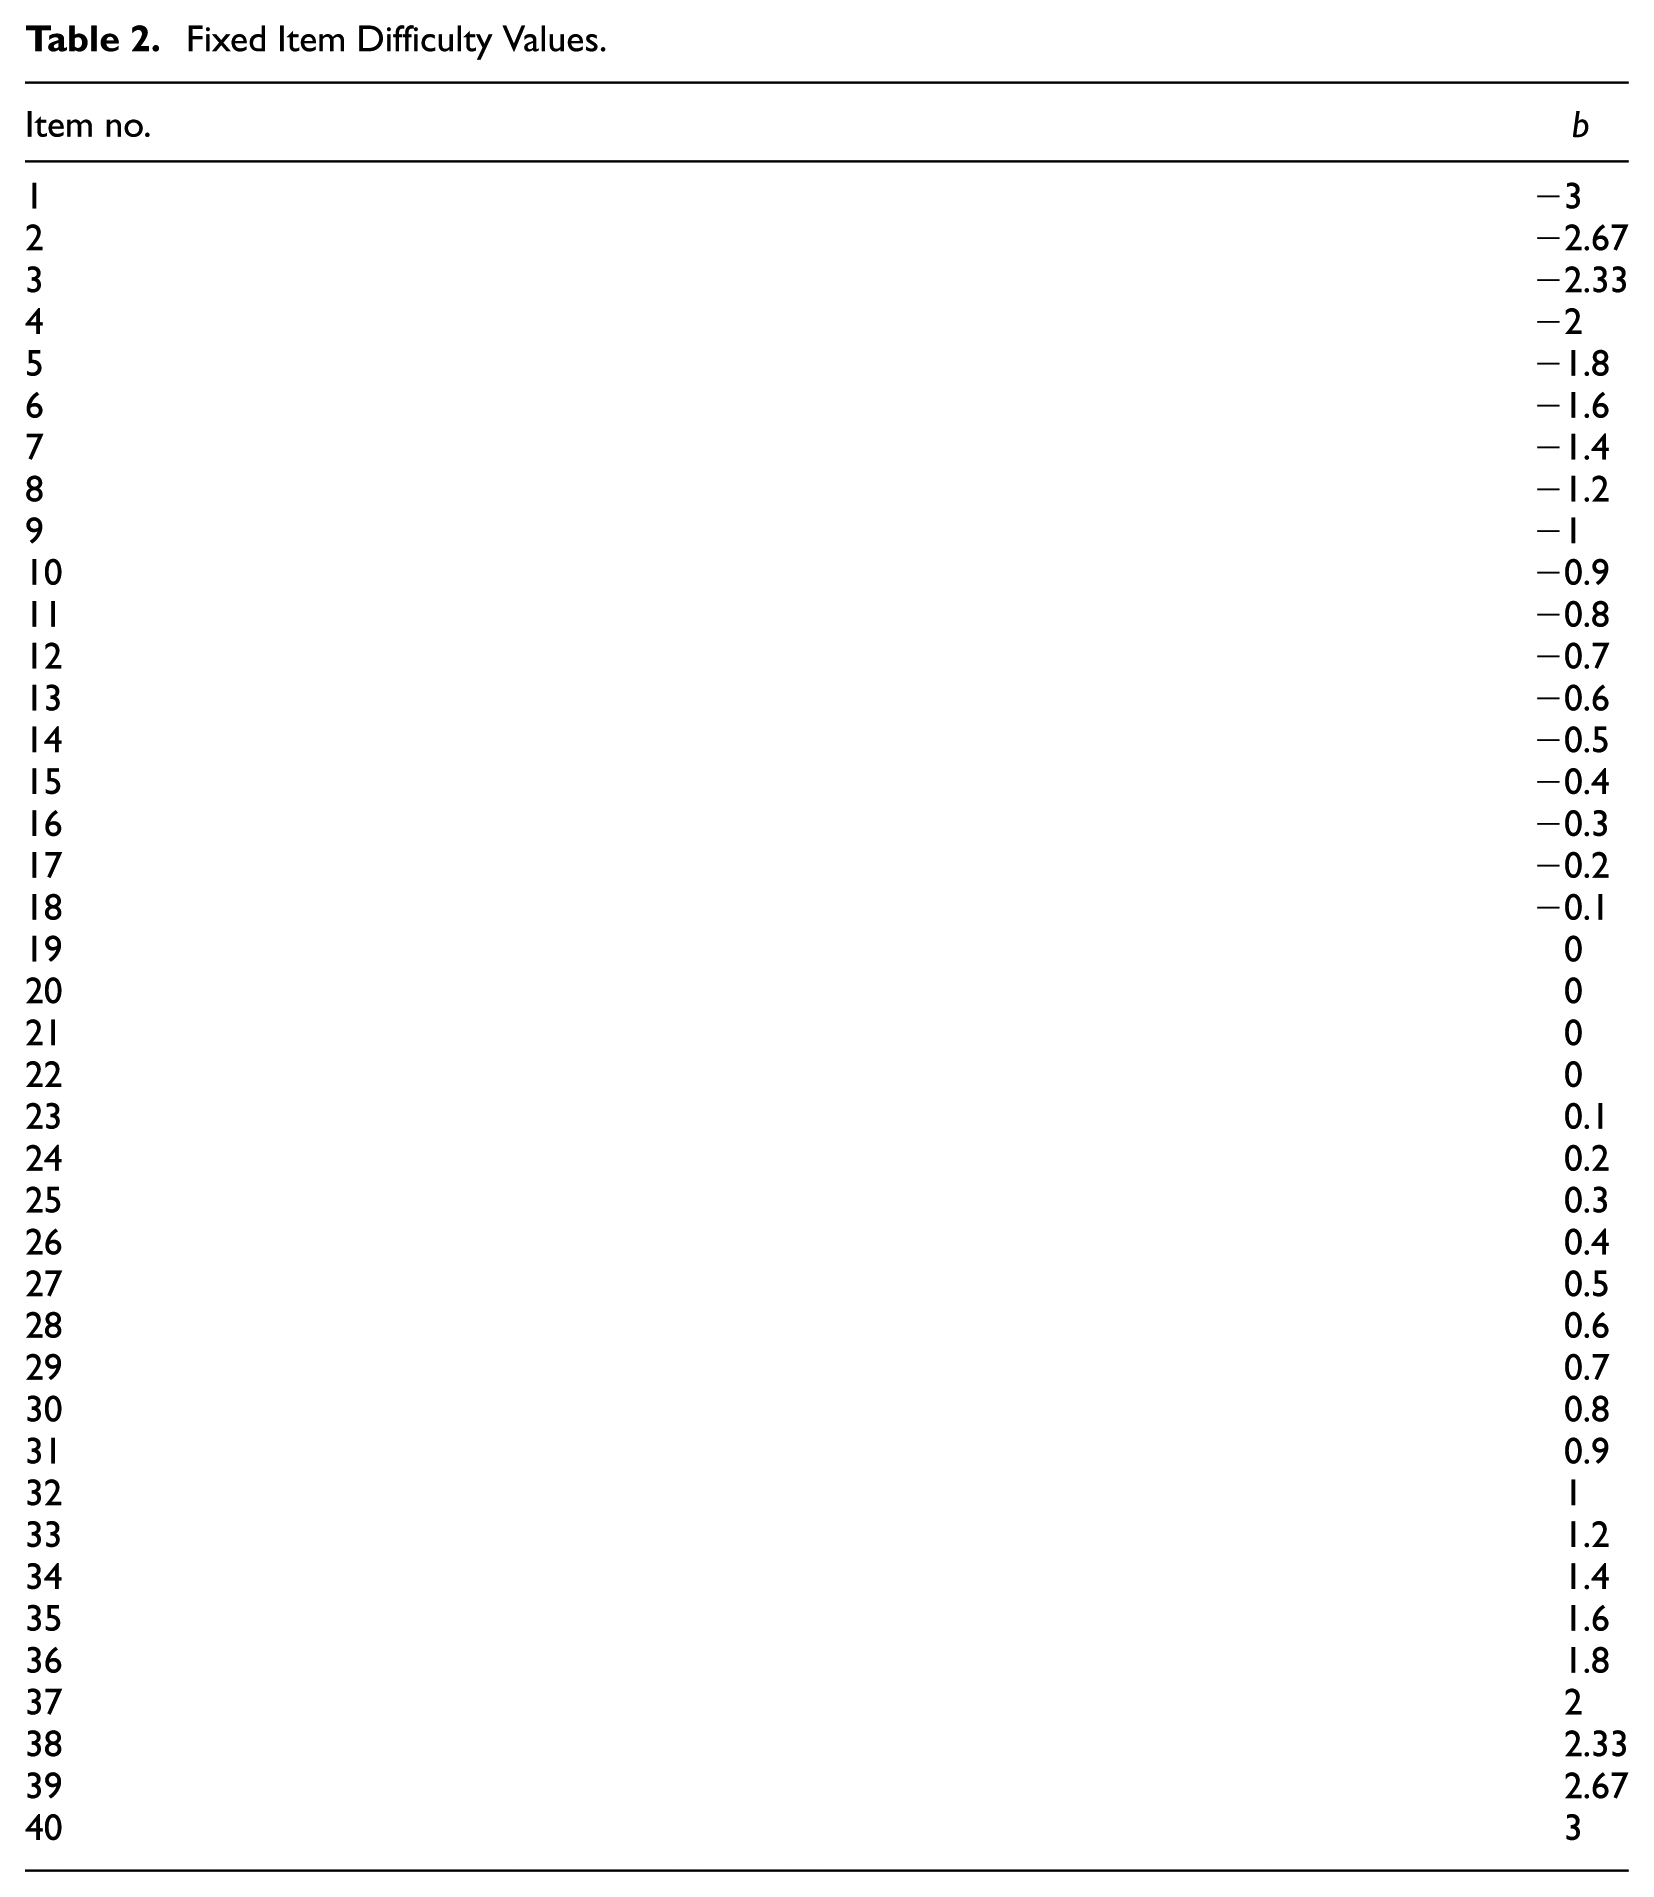
Item difficulty values were fixed in this study, as shown in Table 2. These values were selected for two reasons: First, fixing the b values makes the amount of error at each cut score known, thus it can be studied systematically. With samples drawn from a standard normal distribution, the standard error of
Fixed Item Difficulty Values.
Item Response Generation
Item responses were generated using the Rasch model, as shown in Equation 1.
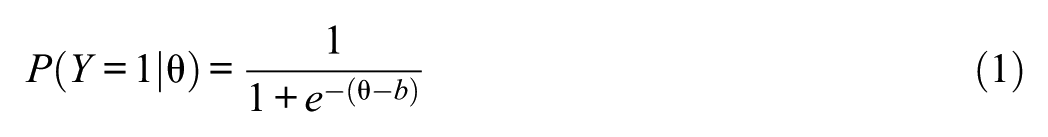
In this model, the probability of a correct response is predicted from the “true” examinee ability (
The magnitude of DIF was varied at both the item and test levels, as shown in Table 3. At the test level, DIF was examined from very low (0.2) to very high (2.0) in increments of 0.2. A condition with no DIF items was also included as a control. Item-level DIF was investigated at three levels: low (0.2), medium (0.4), and high (0.8). One major advantage of this design is that conditions with equal amounts of DIF at the test level but varying amounts at the item level can be directly compared. For instance, Row 4 in the table represents three item-level DIF conditions, all with equal test-level DIF of 0.8. Each condition was replicated 500 times to obtain stable results. The same items, equally spaced throughout the test, were selected to display DIF across all replications of a given condition. These items were chosen, so that there would be no relationship between DIF and item difficulty. For example, in conditions with four DIF items, Items 5, 15, 25, and 35 were chosen to display DIF. When only one DIF item was simulated, it was of middle difficulty (Item 20). Thus, when several DIF items were present, DIF affected examinees of all ability levels.
Magnitude of Simulated DIF.
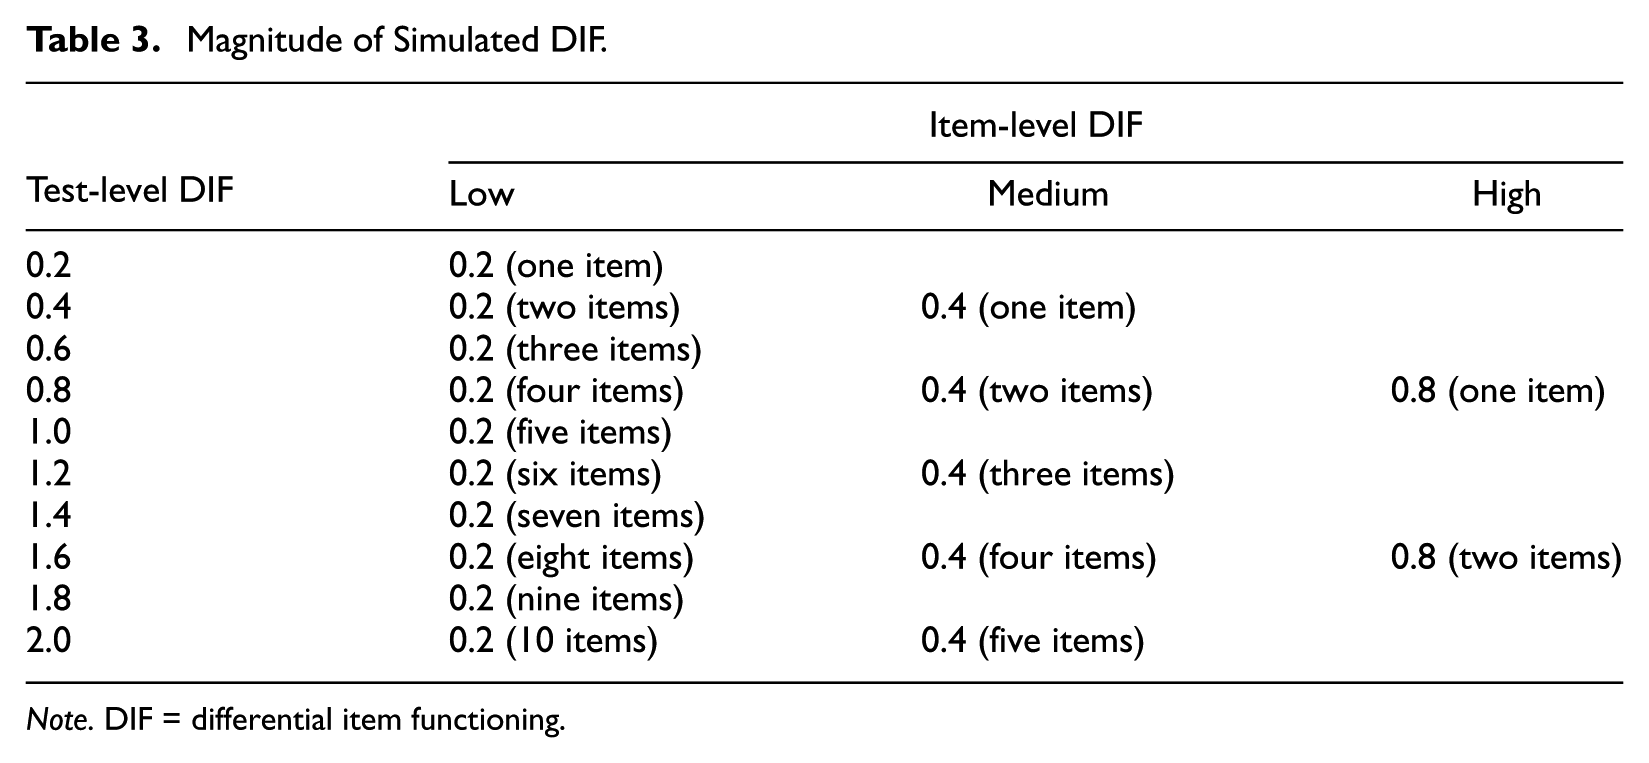
Note. DIF = differential item functioning.
DIF Detection and Proficiency Classification
Both maximum-likelihood (ML) estimation and expected a priori (EAP) estimation were used to obtain examinee ability estimates. EAP estimates were obtained using IRTPRO (Cai, Thissen, & du Toit, 2011), while ML estimates were computed in SAS using the Rasch model conditional ML estimation formulas in Hambleton and Swaminathan (1985) and the estimated item parameters from the IRTPRO calibration. Ability was used as the control variable in two logistic regression models: one with ability and group as predictors, and a reduced model with only ability as the predictor. The difference between −2 times the log likelihood of the two models was calculated and compared with a
Classification accuracy, as specified in Table 1, was computed in two ways: first by all examinees, then by group to study whether DIF affects the reference and focal groups differently. This was done for both ML and EAP estimates. To make the comparisons across the cut scores more meaningful, the rates were also calculated using only examinees whose true ability levels fell within ±0.5 of the cut score.
Results
Results are presented in the following order: First, ML estimation results are given, followed by EAP estimation results. Within each estimation method, classification accuracy and errors are examined first for the whole sample, then by group across test-level DIF conditions. Finally, classification errors are examined with DIF and DBF detection rates.
ML Estimation
Across all testing conditions, when all examinees were included, classification accuracy was 89%, 92%, and 98% at the cut scores of 0, 1, and 2, respectively. Note that classification accuracy was higher at higher cut scores, which, by design, were associated with larger standard errors of ability estimates. One possible reason for this inconsistency is that compared with the cut score at the mean of the ability distribution (i.e., 0), fewer examinees were near the higher cut scores (i.e., 1 and 2), making them easier to classify. When classification accuracy was examined only for examinees with
Classification error rates across test-level DIF conditions and cut scores, based on examinees near the cut score, are shown in Table 4. There were slight differences in classification errors across levels of DIF. Specifically, at the cut scores of 0 and 1, increasing DIF resulted in a slight increase in false positives. At the cut score of 2, however, false positives actually went down with increasing DIF. The positive and negative error rates differed considerably across cut scores. Namely, at higher cut scores, there were more false positives than false negatives. The ratio between the two error rates increased from about 1:1 for the cut score of 0 to 1:1.6 for the cut score of 1 and to 1:3.4 for the cut score of 2. It appears that ability for examinees around higher cut scores tended to be overestimated, resulting in more false-positive classification errors.
ML Error Rates Across Test-Level DIF and Cut Scores for Examinees Within
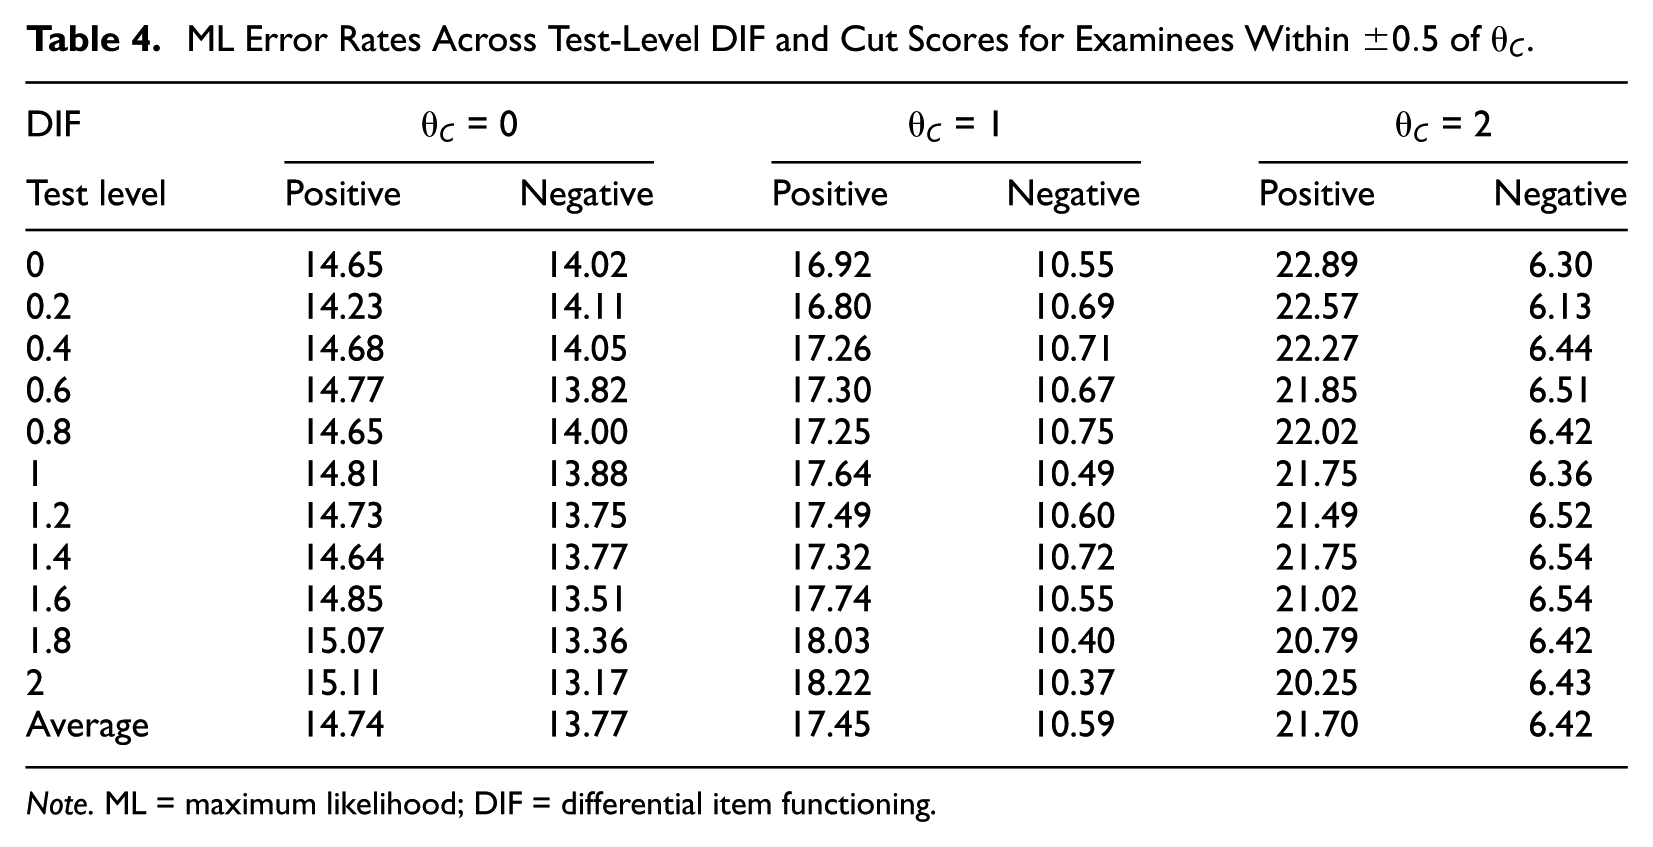
Note. ML = maximum likelihood; DIF = differential item functioning.
To further understand the effects of DIF on proficiency classification, positive and negative error rates were examined separately for the focal and reference groups. Figure 1 illustrates the differential effects of test-level DIF on classification errors for the two groups at the cut score of 0.
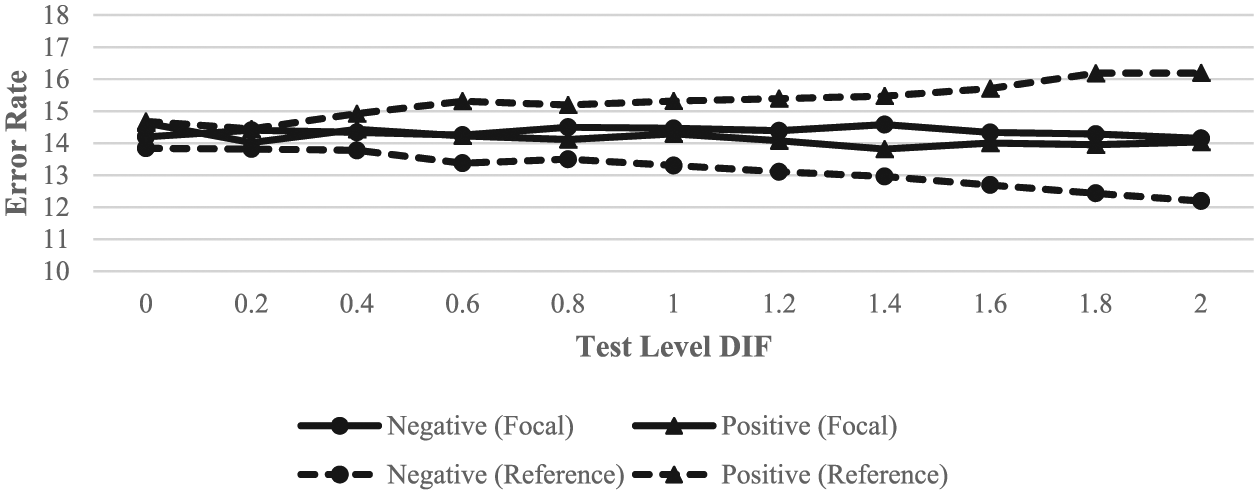
ML error rates across groups and test-level DIF for examinees within
A number of interesting trends emerge from Figure 1: First, while all the error rates were similar for the no DIF condition, the rates for each type of error from both groups tended to trend either upward or downward as the test-level DIF increased. For the focal group, the positive error rate went down very slightly, whereas the negative error rate increased slightly. The opposite was true for the reference group. Interestingly, the effects of DIF were much larger for the reference group; the divergence between the positive and negative rates tended to widen with increasing DIF magnitude. Under all DIF conditions, the rank order of the error rates remained unchanged: reference group false positives > focal group false negatives > focal group false positives > reference group false negatives.
ML error rates separated by group at the cut score of 1 are shown in Figure 2. Note that the scale of the y-axis in Figure 2 is different than that in Figure 1 to accommodate the larger range in error rates. Clearly, there was a larger difference between the positive and negative error rates than was observed at the cut score of 0. There were more positive than negative errors, and the rank order of the error rates reversed for the focal group. The effects of DIF on error rates were similar to those seen in Figure 1 for both groups.
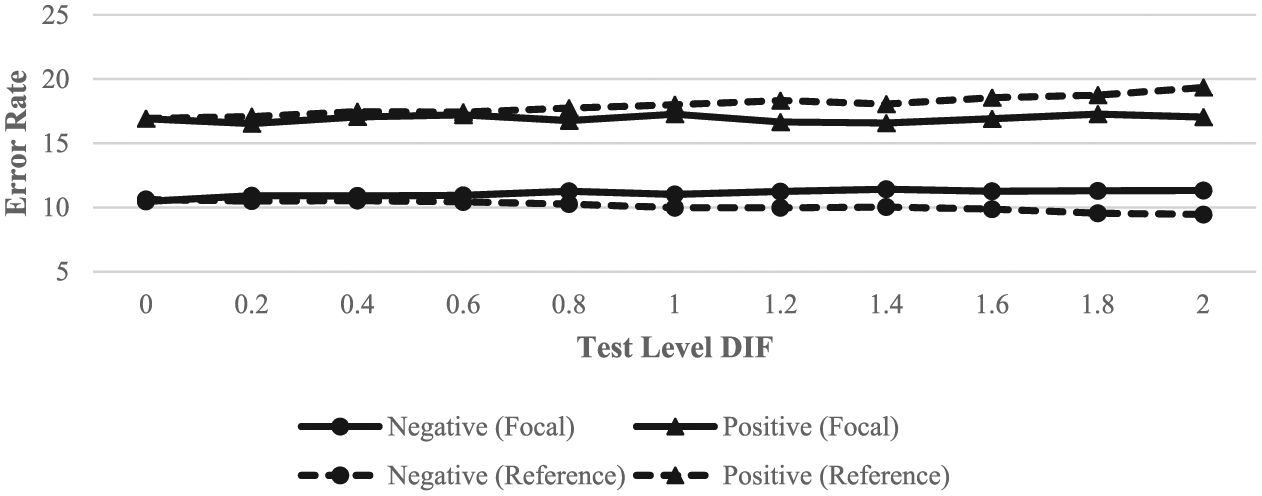
ML error rates across groups and test-level DIF for examinees within
Figure 3 shows the results for the cut score of 2. Here, the difference between positive and negative error rates widened from Figure 2, while the differences between the two groups shrank further to almost nonexistence. What is striking in Figure 3 is the vast difference between the positive and negative error rates. In addition, the effects of DIF appeared to be smaller for the reference group but larger for the focal group. The decrease in false-positive errors across test-level DIF conditions was considerably larger for the focal group at the cut score of 2 than at the cut scores of 0 and 1.
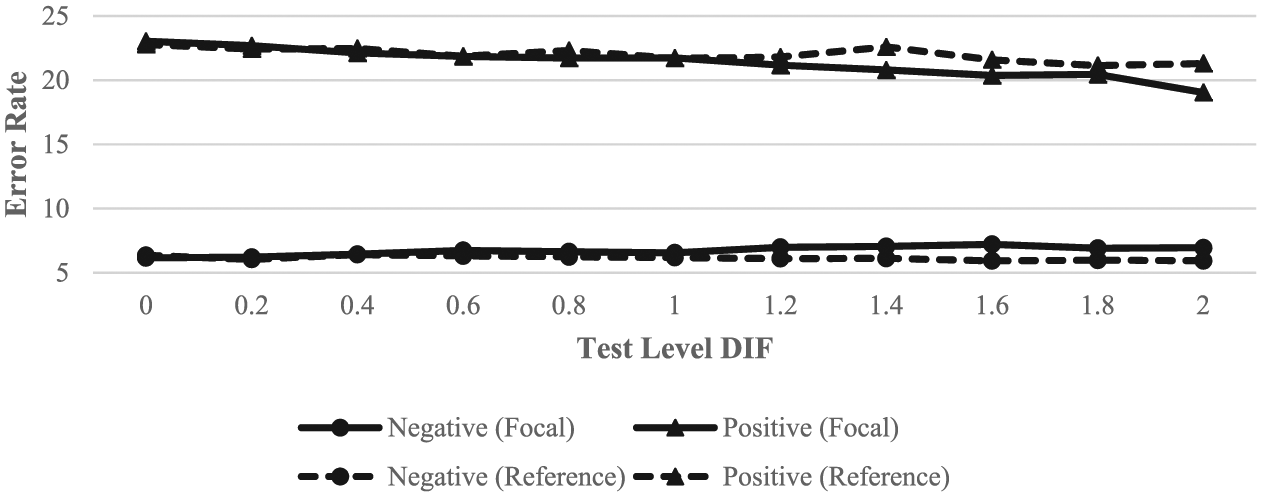
ML error rates across groups and test-level DIF for examinees within
The intriguing patterns in Figures 1 to 3 deserve further investigation. One plausible explanation is that the presence of DIF results in underestimation of ability for the focal group but overestimation for the reference group. As DIF items were simulated to be harder for focal group members, it is not surprising that their ability would be slightly underestimated; hence, more negative errors would result from increasing DIF magnitude. When calibrated together with responses from the focal group, correct responses to the DIF items from reference group members may look more impressive due to the increased item difficulties. Consequently, reference group ability can be overestimated, resulting in more positive than negative errors. Finally, high-ability examinees appear to be overestimated, regardless of group membership, as illustrated by the almost overlapping lines of the two groups in Figure 3. This is likely the result of the test being too easy for these examinees. For the focal group, the presence of DIF slightly cancels out this overestimation, resulting in decreasing false positives with increasing DIF.
To validate the above postulation about over and underestimation of abilities, bias of the ability estimates was computed separately for the two groups, across DIF conditions, using only examinees with abilities near each cut score. These results are shown in Table 5.
ML Ability Estimation Bias Across Groups for Examinees Within
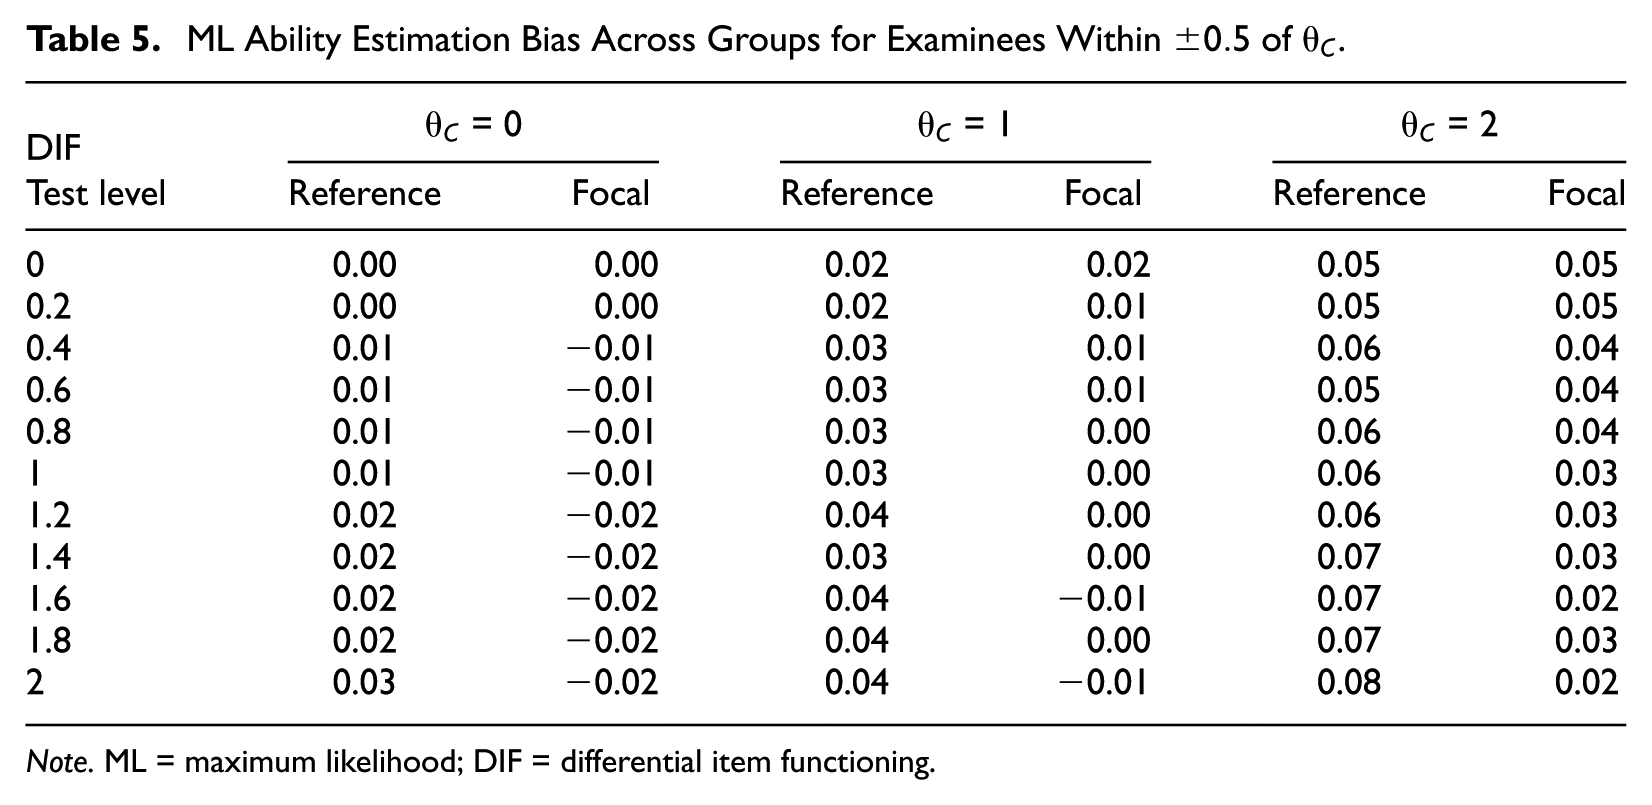
Note. ML = maximum likelihood; DIF = differential item functioning.
Table 5 shows that test-level DIF has an impact on ability estimation, and this impact differs by group and ability level. For examinees near the cut score of 0, bias is positive for the reference group but negative for the focal group when DIF is present. Near the cut scores of 1 and 2, bias is mostly positive, or ability is overestimated for both groups. However, the magnitude of this bias increases with higher DIF magnitude for the reference group, leading to larger increases in false positives. For the focal group, the magnitude of positive bias decreases with increasing DIF, hence the downward trend in positive errors for this group. Although there is a clear trend in bias across DIF conditions for the two groups, the bias is still relatively small. To further examine how estimation changes across DIF conditions, the proportion of examinees overestimated is shown in Table 6.
Proportion of Examinees Within
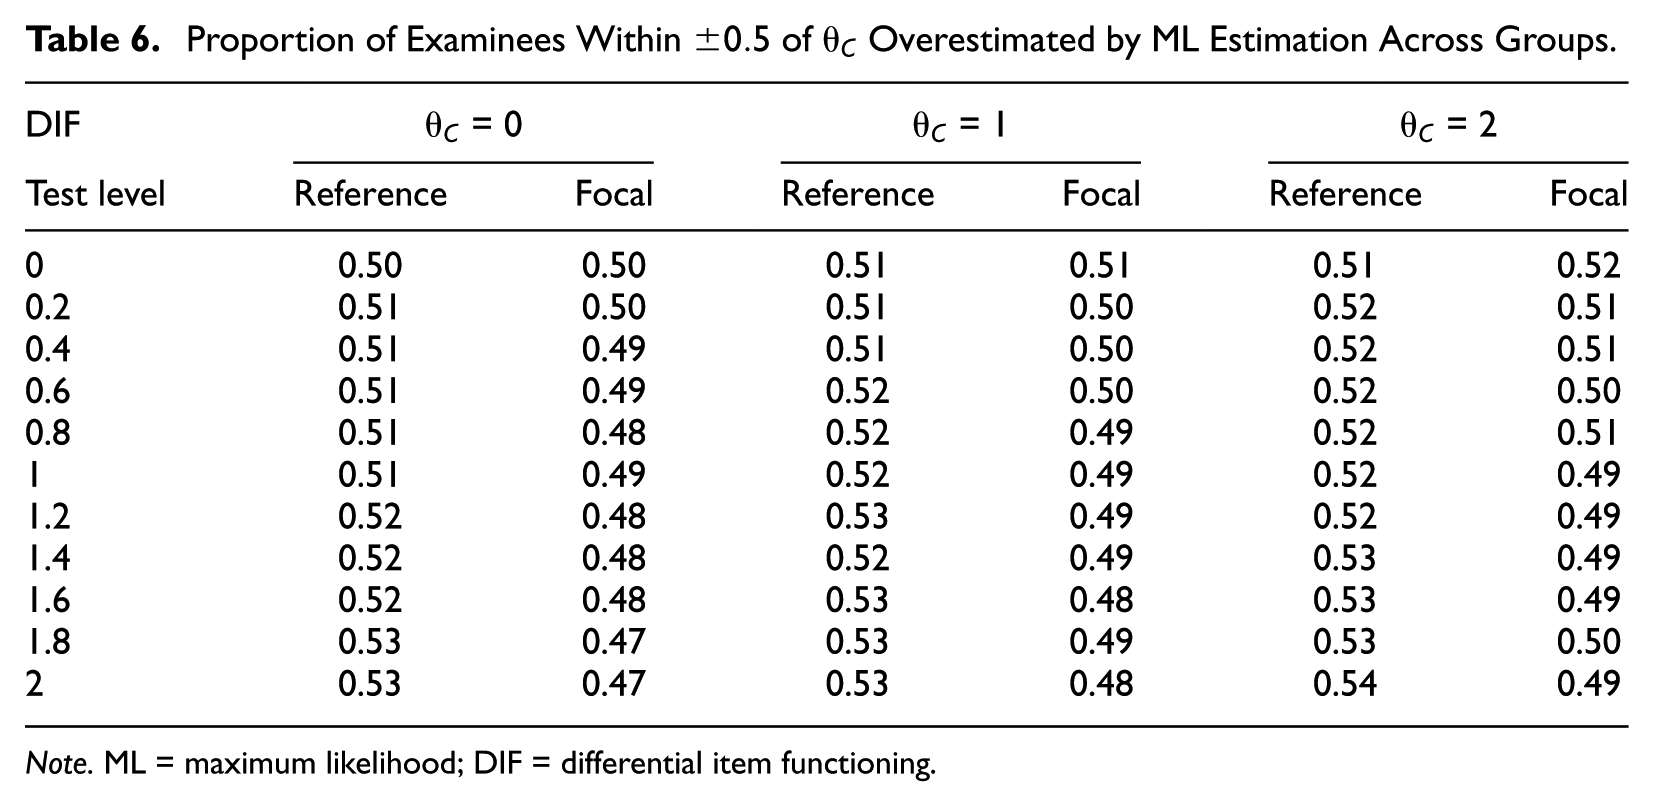
Note. ML = maximum likelihood; DIF = differential item functioning.
It is clear from Table 6 that, as test-level DIF increases, the proportion of examinees with overestimated abilities increases for the reference group and decreases for the focal group at all three cut scores. This, along with the bias results in Table 5, can explain the differential effects of DIF on classification errors for the reference and focal groups. Proficiency classification errors are based not on the size of the measurement error but on whether the error moves the examinee above or below the cut score. Thus, while ML estimation bias was fairly small, clearly a higher proportion of reference group examinees were overestimated when DIF was present, while focal group examinees were often underestimated.
Next, classification errors were investigated across item-level DIF conditions, controlling for test-level DIF. Figure 4a and 4b give the results for test-level DIF of 0.8 and 1.6 at the cut score of 0. These two levels were chosen as they included all three item-level DIF conditions. The effect of item-level DIF on classification errors did not differ across cut scores.
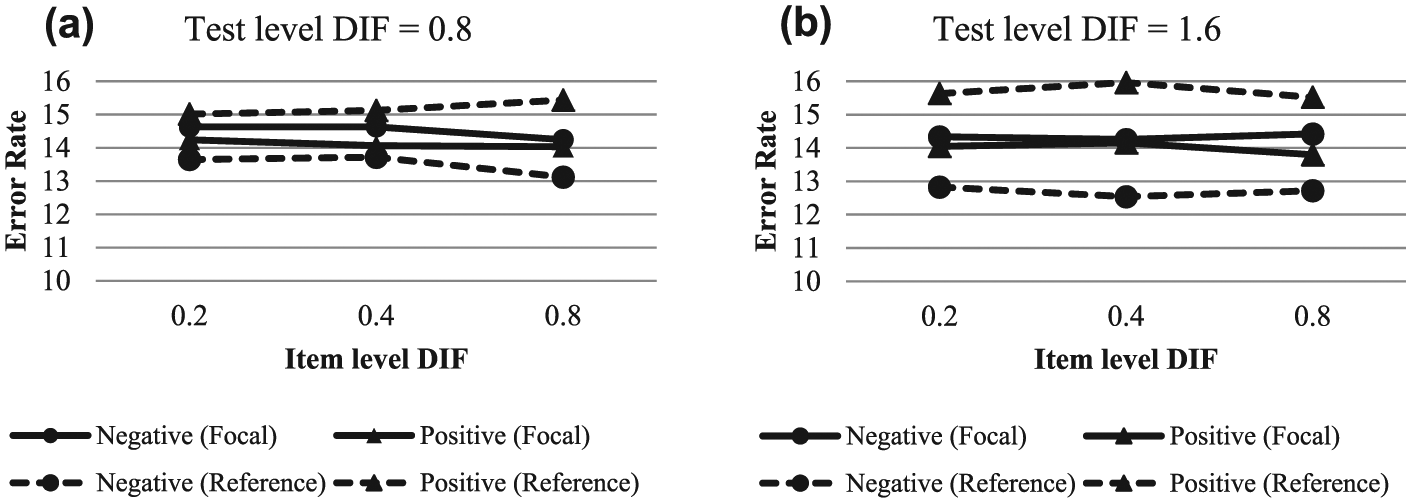
ML error and DIF detection rates across levels of item-level DIF for
Figure 4 shows that, in conditions with equal test-level DIF, group-specific error rates were quite consistent across levels of item-level DIF. Thus, it appears that it is the test-level DIF and not item-level DIF that affects classification errors. The power to detect DIF via logistic regression, however, differed markedly across item-level DIF. Specifically, the DIF detection rates were 0.2, 0.7, and 1.0 for low, medium, and high item-level DIF, respectively, when the test-level DIF was 0.8. When the test-level DIF was 1.6, these rates were 0.2, 0.6, and 1.0, respectively. The low detection rate for low item-level DIF is troublesome; while several low-level DIF items may cause the same amount of damage to proficiency classification as the high item-level DIF cases, it is highly likely they will be undetected.
One may argue that several low-level DIF items may be better detected collectively than individually. To test this, DBF analyses were conducted to detect DIF items as a bundle. These results are provided in Table 7. Note that at item-level DIF of 0.8, SIBTEST was able to detect DIF 100% of the time. To save space, these rates were not included in the table.
Power of DBF Analyses for Low and Medium Item-Level DIF Bundles.
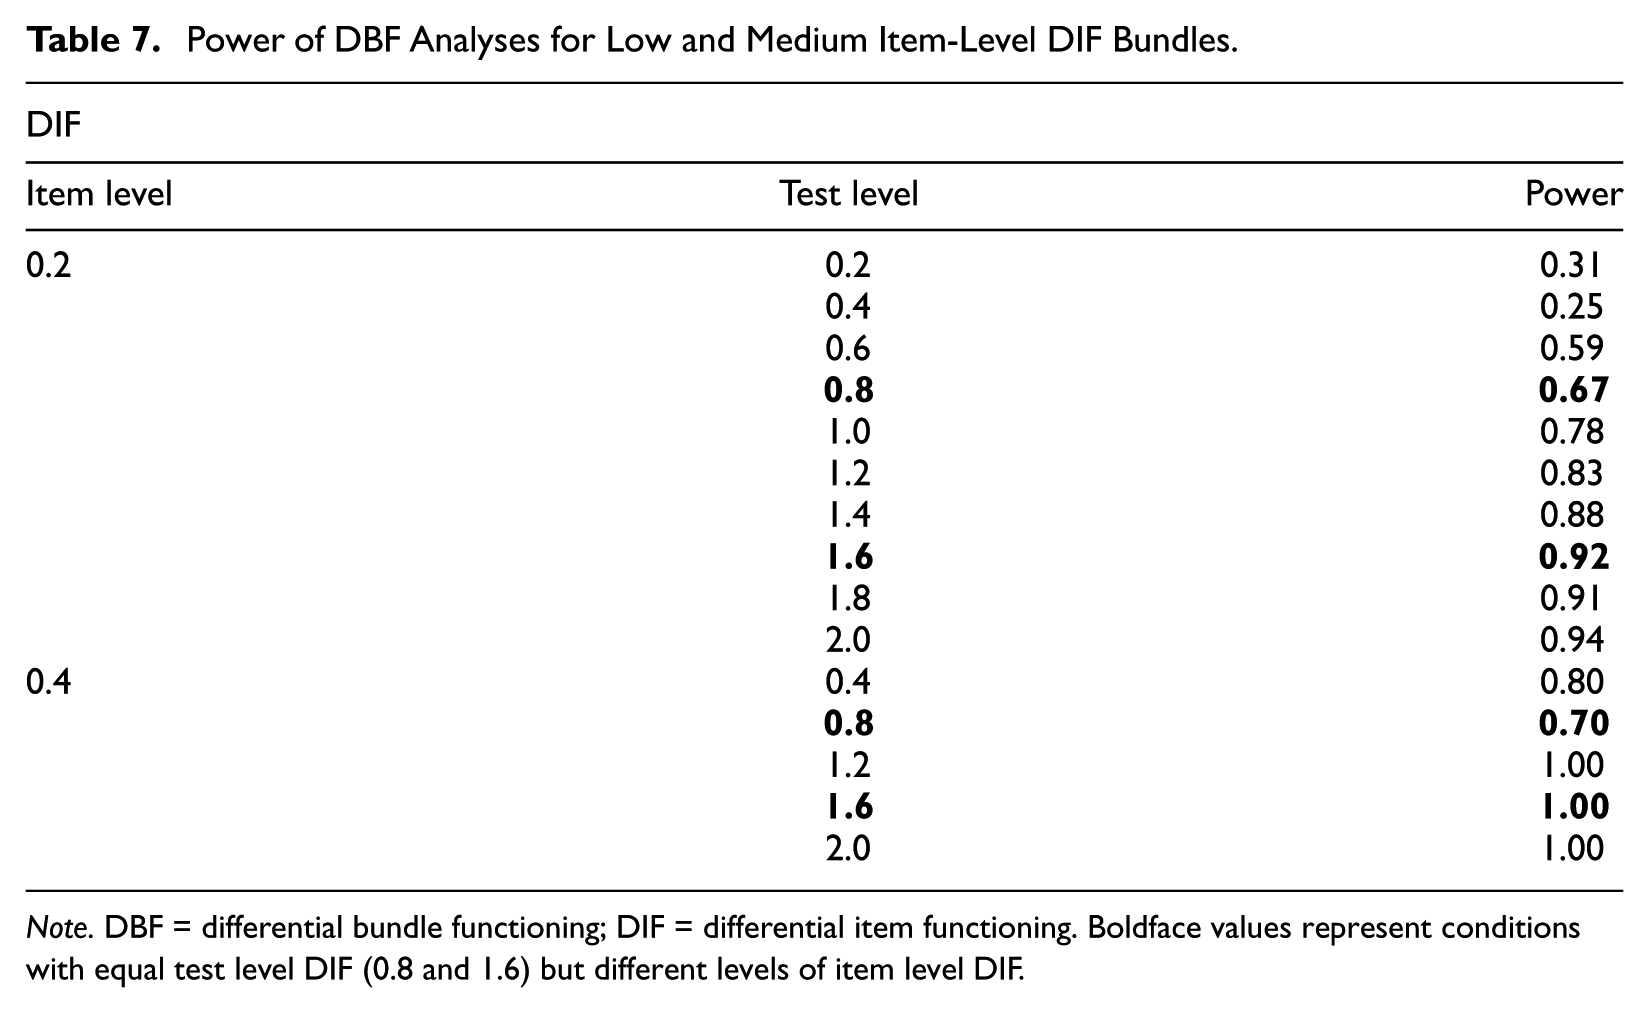
Note. DBF = differential bundle functioning; DIF = differential item functioning. Boldface values represent conditions with equal test level DIF (0.8 and 1.6) but different levels of item level DIF.
The DBF analyses show that bundles with equal levels of test-level DIF were detected much more frequently when item-level DIF was higher. For example, when test-level DIF was 0.8, power was 0.67, 0.70, and 1.0 for low, medium, and high item-level DIF magnitudes, respectively. However, while the power to detect bundles of low-level DIF items is higher than that found for detecting single items, this power is still not high enough (i.e., less than 0.8), unless test-level DIF reaches 1.2. Combining these findings with those from Figure 4, it is clear that testing conditions with low item-level DIF can present problems for proficiency classification. Neither DIF nor DBF techniques can detect these items with much consistency, but they do as much harm as higher item-level DIF magnitudes of the same cumulative size. An interesting observation is that SIBTEST had higher power than logistic regression for detecting a single low-level DIF item. This is likely attributable to the fact that SIBTEST does not include the studied item in the matching variable while logistic regression, as utilized in this study, does.
EAP Estimation
Results differed slightly when EAP estimation was used. Classification accuracy rates for examinees within
EAP Error Rates Across Test-Level DIF and Cut Scores for Examinees Within
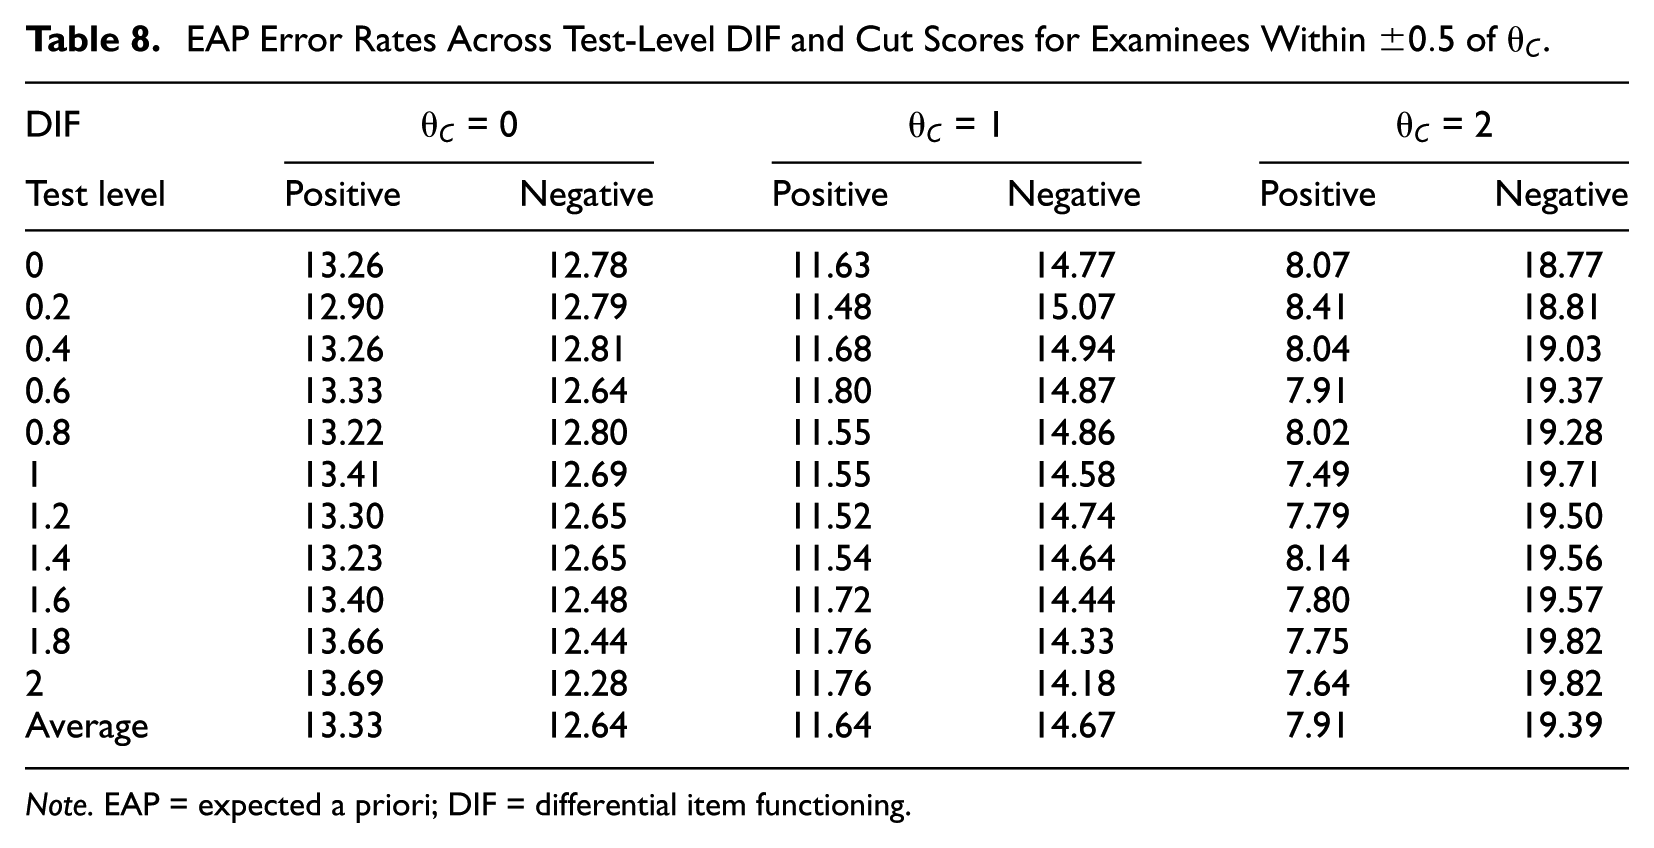
Note. EAP = expected a priori; DIF = differential item functioning.
As with ML estimation, the proportion of each type of error differed across cut scores. However, for EAP estimation, more negative errors and fewer positive errors were made at higher cut scores. This trend should not be surprising. For examinees further from the mean ability, EAP estimates will be pulled toward the prior mean of 0, resulting in estimates that are lower than their true values. This in turn causes more negative and fewer positive errors. At cut scores of 0 and 1, false-positive errors slightly increased with increasing DIF, while negative errors decreased. At the cut score of 2, the opposite trend was true, with higher false-negative rates at higher DIF levels. These effects, however, were quite small and inconsistent.
Figure 5 illustrates the differential effects of test-level DIF on classification errors for the two groups at the cut score of 0.
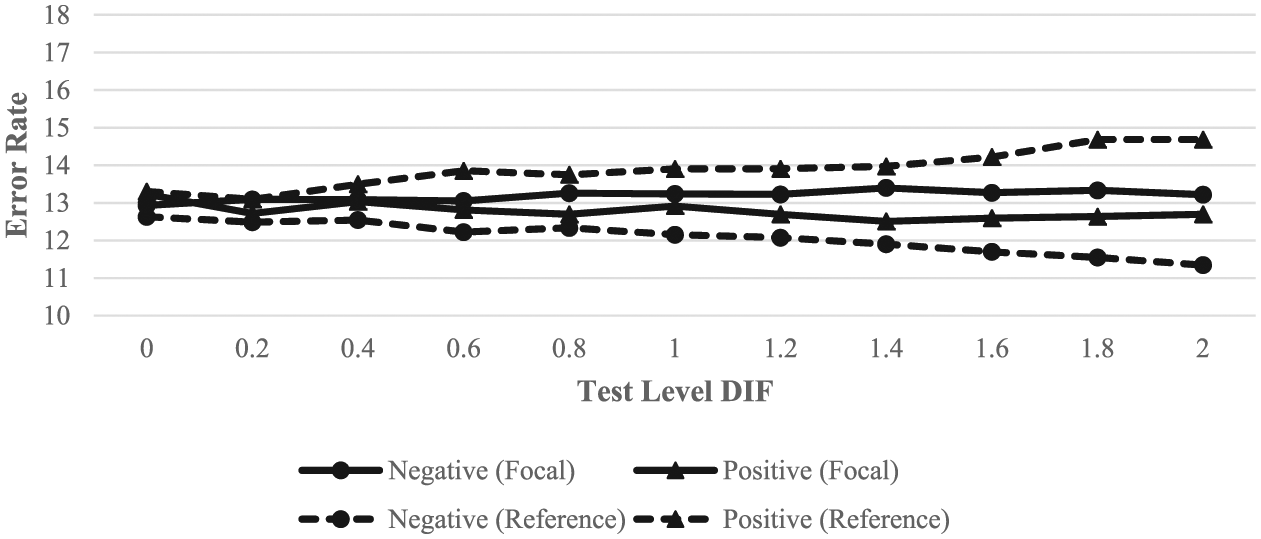
EAP error rates across groups and test-level DIF for examinees within
Figure 5 shows that, in general, EAP estimation resulted in similar effects of DIF on classification errors, compared with ML estimation. False positives increased for the reference group but decreased for the focal group, whereas false negatives decreased for the reference group but increased for the focal group with increasing test-level DIF. Once again, the effects appeared to be larger for the reference group; however, the difference between groups was not as large as for ML estimation. When DIF was present, the rank order of the classification error rates was the same as for ML estimation.
Group-specific error rates for EAP estimation at cut scores of 1 and 2 are shown in Figures 6 and 7, respectively. Note that the scale of the y-axis in these figures differs from that of Figure 5. The general trends in these two figures resemble those in Figures 2 and 3. One major difference is the reverse order of the positive and negative errors. In other words, while more positive errors were observed for ML, more negative errors were seen for EAP estimation.
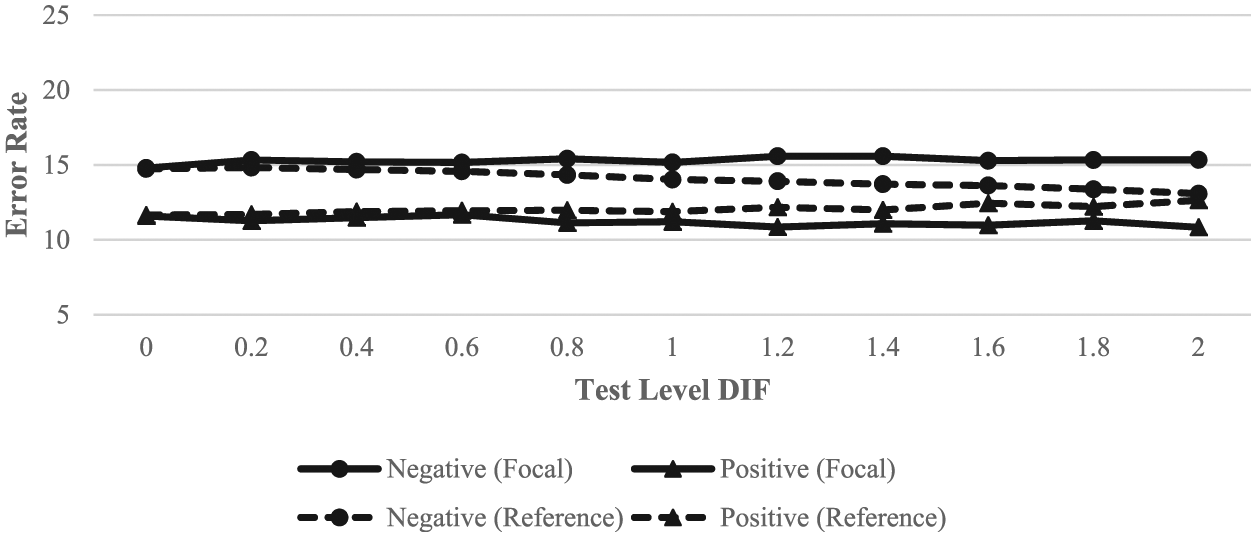
EAP error rates across groups and test-level DIF for examinees within
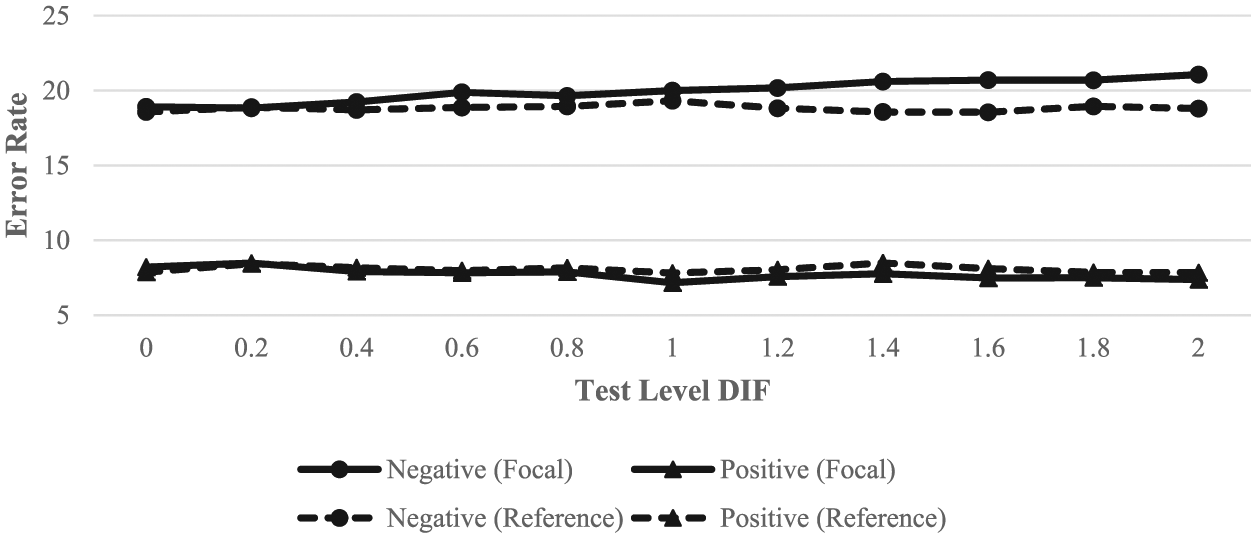
EAP error rates across groups and test-level DIF for examinees within
One possible explanation for the effects shown in Figures 5 to 7 is that the presence of DIF once again results in underestimation and overestimation of focal and reference group examinees, respectively. Only under EAP, examinees near higher cut scores are more likely to be underestimated. Thus, the underestimation of focal group members is amplified at higher cut scores, resulting in more false negatives. For the reference group, underestimation at higher cut scores cancels out the overestimation that results from DIF, resulting in a negligible change in classification errors across DIF conditions. To examine this hypothesis more closely, bias of the EAP ability estimates, separated by group, was computed across DIF conditions for examinees near each cut score. These results are shown in Table 9.
EAP Ability Estimation Bias Across Groups for Examinees Within
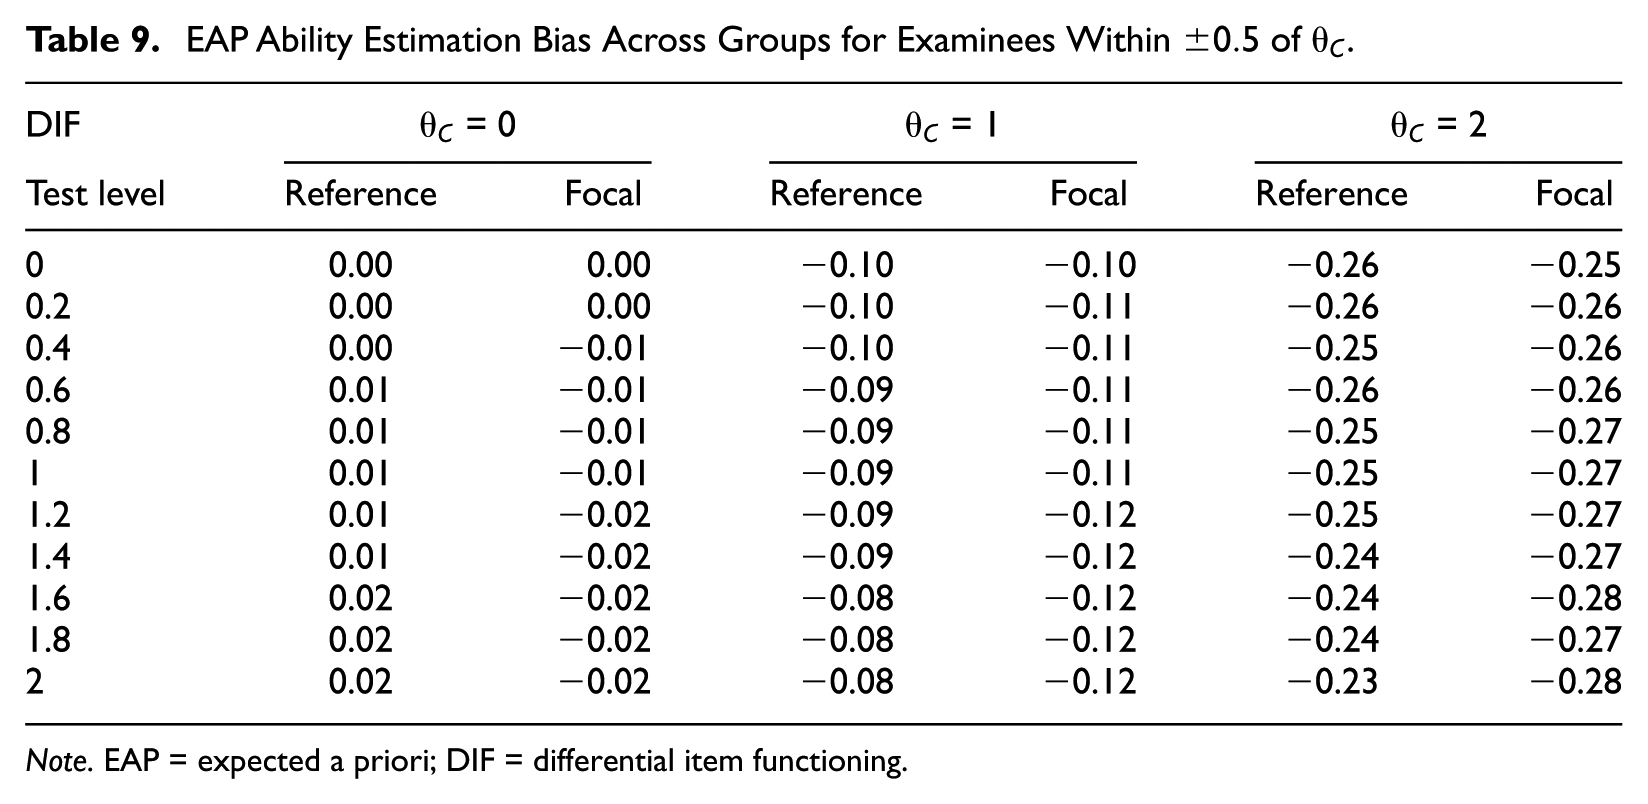
Note. EAP = expected a priori; DIF = differential item functioning.
The results in Table 9 appear to support the explanation for the interaction between cut score and test-level DIF. At the cut score of 0, reference group ability is positively biased while focal group ability is negatively biased when DIF is present. At higher cut scores, ability is consistently underestimated for both groups. The magnitude of this negative bias, however, decreases for the reference group and increases for the focal group across test-level DIF. Thus, the effect of DIF on focal group classification errors—more false negatives—is amplified at higher cut scores, whereas the effect on the reference group—more false positives—is suppressed.
Figure 8a and 8b show the classification error rates by group across item-level DIF conditions with equal test-level DIF for EAP estimation. Once again, rates are shown for examinees within
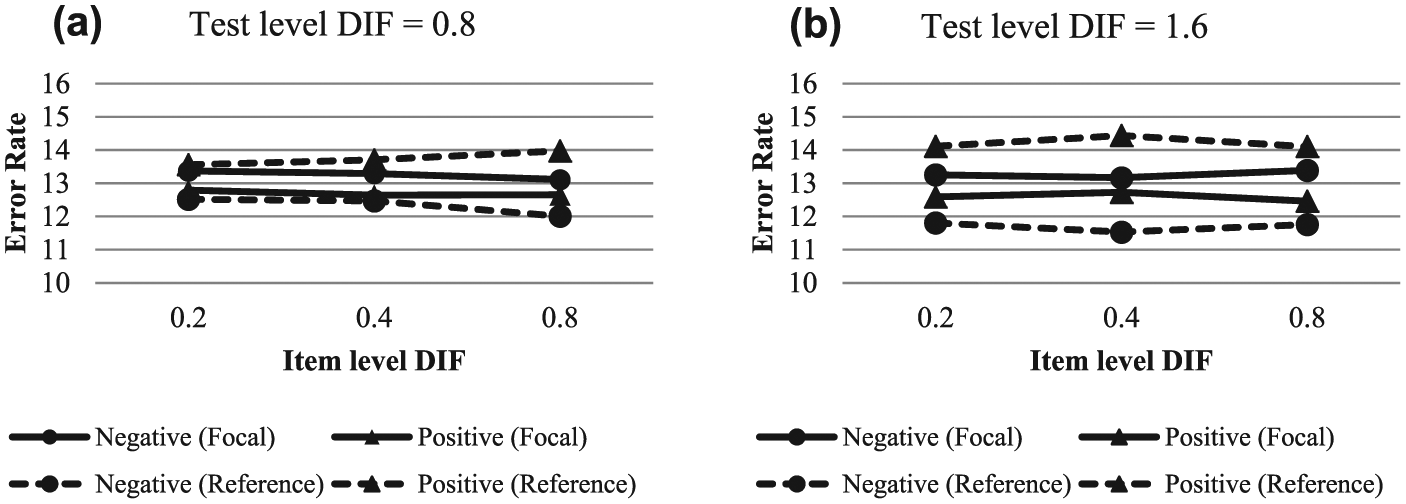
EAP error and DIF detection rates across levels of item-level DIF with
As with ML estimation, classification error rates were similar at equal test levels of DIF, regardless of the item-level DIF, while DIF detection rates were much lower for conditions with low item-level DIF. DIF detection rates with the EAP estimate as the control variable were the same as those listed for ML estimation. Thus, although low item-level DIF may cause just as much damage to proficiency classification as high item-level DIF, low item-level DIF is much more likely to go undetected. As SIBTEST computes its own ability estimates, the results from Table 7 represent the DBF detection results for this study, and no further DBF analyses are listed for EAP estimation.
Discussion
This study presents clear evidence that the presence of DIF influences proficiency classification. While the effect on overall classification accuracy may be small, test-level DIF has differential implications for the reference and focal groups. Specifically, when DIF is present, reference group members are more likely to be incorrectly classified as passing than failing, whereas focal group members are more likely to be incorrectly classified as failing than passing. This finding may be expected, as DIF is against the focal group; however, under both ML and EAP estimations, the effect of DIF on classification errors is larger for the reference group. Upon further investigation, it is found that the pattern of classification errors is closely associated with the patterns of bias in ability estimation and the percentage of examinees overestimated.
The effects on classification errors differ slightly depending on the ability estimation method. Specifically, at higher cut scores, EAP estimation results in more false-negative errors, as ability estimates are pulled toward the prior mean. For the design used in this study, the test may have been too easy for examinees of higher ability levels; thus, ML estimation resulted in overestimation of ability and more false-positive errors at higher cut scores. Finally, the between-group difference in the effects of DIF is larger when ML estimation is used; that is, the effect of DIF is smaller for the focal group but larger for the reference group under ML estimation.
The examination of item-level DIF in this study revealed potential shortcomings in the current DIF and DBF detection techniques. Logistic regression was only able to detect low-level DIF items approximately 20% of the time, regardless of ability estimation method, and SIBTEST could detect DBF consistently only when bundles had a large cumulative effect (e.g., larger than 1.2 in this study). While low-level DIF items may not be concerning on their own, the cumulative effect from a number of them is about the same as that from one or two high-magnitude DIF items. This was true under both ML and EAP estimations. Therefore, both DIF and DBF detection methods need to be further improved to ensure accuracy of proficiency classification under those testing conditions.
There are several limitations of this study: First, classification tests are highly contextual by nature and dependent on the purpose of testing. This study aimed to simulate typical contexts in which classification tests are used. By no means are the examined testing conditions exhaustive. For one, only 3 cut points were investigated, and no impact (true ability difference between focal and reference groups) was studied. Also, item difficulty values were spread throughout the ability distribution, rather than aimed directly at the cut score, as is often done in certification testing. The results, particularly for the higher cut scores where standard error of ability estimates was high, should be interpreted with these issues in mind.
The simulation of DIF may not be representative of what occurs in real tests. Because low-level DIF items often go undetected by DIF analyses, their frequency in practice is unknown. Also, DIF was simulated as an increase in the difficulty parameter for the focal group, whereas some researchers, particularly in DBF studies, have conceptualized bias as the presence of a secondary ability (Shealy & Stout, 1993). Finally, DIF was simulated to always favor the reference group in this study. However, in practice, some DIF items may favor the focal while most favor the reference group (Kulick & Hu, 1989).
This study suggests the urgent need to develop methods to detect very low levels of DIF and DBF. This could mean improvements to current techniques or the development of entirely new ones. Findings from this study can be enhanced, or changed, by studies using item parameters and cut scores from actual classification tests. In addition, effect size measures that evaluate the adverse impact of DIF at the test level (e.g., Nye & Drasgow, 2011; Stark, Chernyshenko, & Drasgow, 2004) should be considered in future studies. Finally, how other forms of DIF, such as nonuniform DIF, in multidimensional items, or DIF combined with impact, may affect proficiency classification can also be a valuable addition to this line of research.
Footnotes
Declaration of Conflicting Interests
The author(s) declared no potential conflicts of interest with respect to the research, authorship, and/or publication of this article.
Funding
The author(s) received no financial support for the research, authorship, and/or publication of this article.