






Abstract
Multidimensional forced choice (MFC) test formats are commonly used as an alternative to traditional rating scale formats to reduce aberrant responding, especially faking in high-stakes settings. However, MFC remains susceptible to random responding, particularly in low-stakes settings where respondents may be insufficiently motivated and in high-stakes settings where some assessments may be viewed as less consequential. To ensure the validity of inferences drawn from MFC data, effective methods for detecting random responding are needed. This research contributes to the MFC literature on aberrant responding detection by evaluating the effectiveness of the item response theory (IRT)-based person fit statistic l z for detecting random responding in multi-unidimensional pairwise preference (MUPP)-based MFC tests, using optimal appropriateness measurement (OAM) as a theoretical benchmark. Two simulation studies were conducted. Study 1 compared l z with OAM, and Study 2 examined l z in a broader simulation design. Results showed that (1) higher proportions of randomly answered items, longer tests, and the use of empirical critical values were associated with greater detection power for l z , (2) the proportion of aberrant respondents did not affect l z performance, and (3) OAM outperformed l z only when the random responding model was correctly specified, a condition that can be realized in simulation but may not hold in applied testing contexts. Overall, the findings support the use of l z with empirical critical values as a practical method for detecting random responding in MUPP-based MFC tests.
Keywords
Introduction
Noncognitive constructs such as personality are commonly assessed in organizational research and practice because of their criterion-related validities in predicting critical outcomes in the workplace (e.g., Barrick & Mount, 1991) and the reduced adverse impact when including them in selection processes (Ployhart & Holtz, 2008). They are often assessed using Likert-type measures where respondents are presented with a set of single statements and are asked to indicate their level of agreement by choosing response options such as strongly disagree, disagree, agree, or strongly agree. However, aberrant responding has long been a concern with Likert-type measures. Common types of aberrant responding include faking, random responding, patterned responding, and rapid responding. Faking occurs when respondents intentionally distort their responses to present themselves in a favorable (faking good) or unfavorable (faking bad) light. Random responding occurs when respondents select response options arbitrarily regardless of item content. Patterned responding involves choosing response options in a systematic way across items, such as alternating between agree and disagree or agree and strongly agree on consecutive items. Rapid responding occurs when respondents answer items too quickly without carefully processing the content. In high-stakes contexts such as job applications where applicants are motivated to present themselves favorably, faking is likely to occur, particularly on transparent Likert-type items (e.g., “I am a reliable worker”). In low-stakes situations such as research studies where inaccurate responses carry little consequence, participants may engage in random, patterned, or rapid responding, especially when measures are lengthy or participants lack motivation. Aberrant responding affects measurement accuracy because observed scores no longer reflect respondents’ true trait levels. This poses a threat to the construct validity of a measure and consequently the appropriateness of any inferences we draw from its scores. In high-stakes selection contexts, such inferences typically involve the rank order of respondents, which can lead to incorrect selection decisions that may turn out to be costly. In low-stakes research contexts, inferences may include inaccurate conclusions about theoretical or empirical relationships between constructs.
Over the past two decades, multidimensional forced choice (MFC) test formats have emerged as a viable alternative to Likert-type measures to prevent aberrant responding. In MFC tests, respondents are presented with items consisting of two or more statements and are instructed to pick the statement in each item that best represents them (PICK), select one statement that most represents them and another that least represents them (MOLE), or rank the statements from most to least represent them (RANK). An example MFC triplet item using the RANK response instruction is shown below:
Rank the statements from most like you (1) to least like you (3). • I get along well with others. • I set high personal standards. • I like new challenges.
Within MFC items, statements are often matched on social desirability and extremity. By forcing respondents to choose or rank between similarly appealing statements within items, faking becomes more difficult. Although MFC test formats have been shown to be more resistant to faking (Cao & Drasgow, 2019; Wetzel et al., 2020), they are not immune to other types of aberrant responding. Similar to Likert-type measures, in low-stakes situations where respondents are not fully motivated to respond accurately or in high-stakes settings where respondents must complete multiple assessments and may view some as less consequential, they may select statements randomly.
A variety of methods have been developed to detect aberrant responding in Likert-type measures, with outlier analyses and consistency indices among the most commonly used approaches (e.g., Arthur et al., 2021; Meade & Craig, 2012). Outlier analyses flag individual response patterns that differ substantially from the distribution of normal responses, whereas consistency indices assess the internal consistency of responses across items within each respondent based on the expectation that items measuring the same construct should be positively correlated. Unlike normal responses that reflect the underlying construct being measured, aberrant responding produces response patterns that differ from normal responses and reduces internal consistency, making outlier analyses and consistency indices effective for detection. Common examples of these approaches include the Mahalanobis distance and the even-odd index. However, these methods are less suitable for MFC measures due to the comparative and multidimensional nature of MFC test formats. Because MFC response data are typically analyzed using item response theory (IRT) models to derive normative scores that allow comparisons and rankings across respondents, detection methods developed within the IRT framework are especially appropriate. This research therefore focuses on IRT-based methods.
Within the framework of IRT, various appropriateness measurement indices, now referred to as person fit statistics, have been developed to detect aberrant responding. These methods examine the consistency between each respondent’s item responses and the responses expected by a chosen IRT model and they are sensitive to deviations from expected response probabilities. One such approach is optimal appropriateness measurement (OAM; Levine & Drasgow, 1988), which uses the likelihood ratio test to classify a response pattern as normal or aberrant based on the IRT model chosen for parameter estimation and a hypothesized model for aberrant responding. The likelihood ratio test has a well-established foundation in statistical hypothesis testing (Drasgow et al., 1987; Levine & Drasgow, 1984; Neyman & Pearson, 1933). Under the Neyman-Pearson lemma, it is the most powerful test for distinguishing between two simple hypotheses when the competing models are correctly specified. In the context of person fit analysis, OAM operationalizes this principle by directly contrasting the likelihood of responses under a “normal” responding model and an “aberrant” responding model. However, the theoretical power of OAM only materializes when both the normal and aberrant responding models are correctly specified. This may limit its practical use because the type(s) of aberrant responding that respondents engage in while completing tests is rarely known a priori, and it may differ across respondents and points within a single testing session. Nevertheless, when there is a strong basis for specifying the selected models, OAM has been used to address applied questions in large-scale testing programs, such as detecting unusual response patterns in Scholastic Aptitude Test (SAT) data (Drasgow et al., 1985), exploring the effects of unmotivated responding on the dimensionality of the Certified Public Accountants (CPA) Exam (Stark et al., 2005a, 2005b), and predicting soldier attrition using the U.S. Army’s Assessment of Individual Motivation (AIM; Stark et al., 2011; White & Young, 1998).
An alternative approach is the l
z
statistic (Drasgow et al., 1985), a standardized likelihood based on a “normal” responding model. l
z
is among the most commonly used person fit statistics and has demonstrated effectiveness in detecting various types of aberrant responding (e.g., Conijn et al., 2014, 2016; Drasgow et al., 1987; Felt et al., 2017; Nering, 1997). Although widely used, only a limited number of studies have investigated l
z
in MFC contexts (Kim & Moses, 2018; Lee et al., 2024). This research extends that literature by examining the efficacy of l
z
relative to OAM in MFC tests, with a focus on random responding. OAM achieves optimal detection power for aberrant responding when both the normal and aberrant responding models are correctly specified, a condition that can be realized in simulation. Comparing l
z
to OAM in simulation studies therefore allows us to assess how closely l
z
approaches optimal detection performance in MFC tests. Thus, the purpose of this comparison is not to promote OAM as an operational tool but to use it as a theoretical benchmark for assessing the effectiveness of l
z
in detecting random responding. To compare the two methods across diverse conditions, we manipulated the proportion of items answered randomly, test composition, critical value type, nominal alpha level, and the aberrant responding model used in OAM. The Multi-Unidimensional Pairwise Preference model (MUPP; Stark et al., 2005a, 2005b) was used to characterize the MFC response process, and the dichotomous version of the Generalized Graded Unfolding Model (GGUM; Roberts et al., 2000) was used to characterize the response process for single statements composing MFC items. The MUPP and GGUM IRT models, as well as the implementation of OAM and
The MUPP Model
MFC tests consist of pairs of statements (s and t) and respondents are asked to choose the statement in each pair that is more like themselves. The preference decision is operationalized as agreeing with one statement and disagreeing with the other, with these agree/disagree probabilities depending on respondents’ trait levels and the statement parameters estimated using an appropriate unidimensional IRT model. Suppose X is the item response such that X = 1 indicates that the respondent prefers statement s to statement t and X = 0 indicates otherwise, then the corresponding preferential choice probability,

The GGUM
The GGUM is an ideal point IRT model that assumes the probability of agreeing with a statement is a function of the distance between a respondent’s latent trait level and the statement’s location on the trait continuum. The closer a statement is to a respondent’s latent trait level, the more likely the statement is to be endorsed. Although the GGUM is often used with rating scales that have an ordered polytomous response format, a simplified version for dichotomous (agree/disagree) responses is most commonly used with the MUPP. The probability of agreeing with a statement, (Z = 1), is

OAM
In OAM, both normal and aberrant responding models must be specified. The conditional likelihoods of a response pattern for the two models denoted as





The calculated likelihood ratio is compared with a critical value. If it is larger than the critical value, the respondent is identified as an aberrant respondent.
The l z Statistic
The l
z
statistic is a standardized version of the l
0
index (Levine & Rubin, 1979). To obtain l
z
, the loglikelihood of a response pattern



Finally, the l
z
statistic is then obtained by standardizing l
0
:

The calculated l z statistic is compared with a critical value. If it is less than the critical value, the respondent is identified as an aberrant respondent.
Study 1
Simulation Study Design
Five factors were manipulated: (1) proportion of items answered randomly (20%, 50%, 100%), (2) test composition (6D-48I, 12D-96I [D = dimensions; I = items]), (3) l z critical value type (theoretical, empirical), (4) nominal alpha level (.01, .05), and (5) aberrant responding model used in OAM (OAM_unknown, in which all items were modeled as answered aberrantly, OAM_known, in which only the simulated aberrant items were modeled as answered aberrantly). This yielded 48 conditions. Sample size was fixed at 800 and the proportion of aberrant respondents was fixed at 20%. The 20% and 50% random responding conditions were included to reflect realistic scenarios, whereas the 100% condition was included as a boundary case to benchmark the upper limit of detection performance of l z and OAM. Similarly, the OAM_known condition was included as an ideal scenario to examine the maximum detection performance of OAM under optimal conditions. The proportion of aberrant respondents was fixed because it was expected to have no effect on the performance of l z and OAM. Trait scores were estimated independently for each respondent using only that respondent’s response data, and statement parameters were pre-estimated from single statement normal response data and treated as fixed when calculating OAM and l z (Stark et al., 2016). Therefore, the proportion of aberrant respondents affected neither trait score estimation nor statement parameter estimation used in the calculation of l z and OAM in this study. Due to the long runtime required to calculate OAM, ranging from 4 to 11 hours, 20 replications per condition were performed.
Test Specification
Test Specifications for the 6D-48I MUPP Test
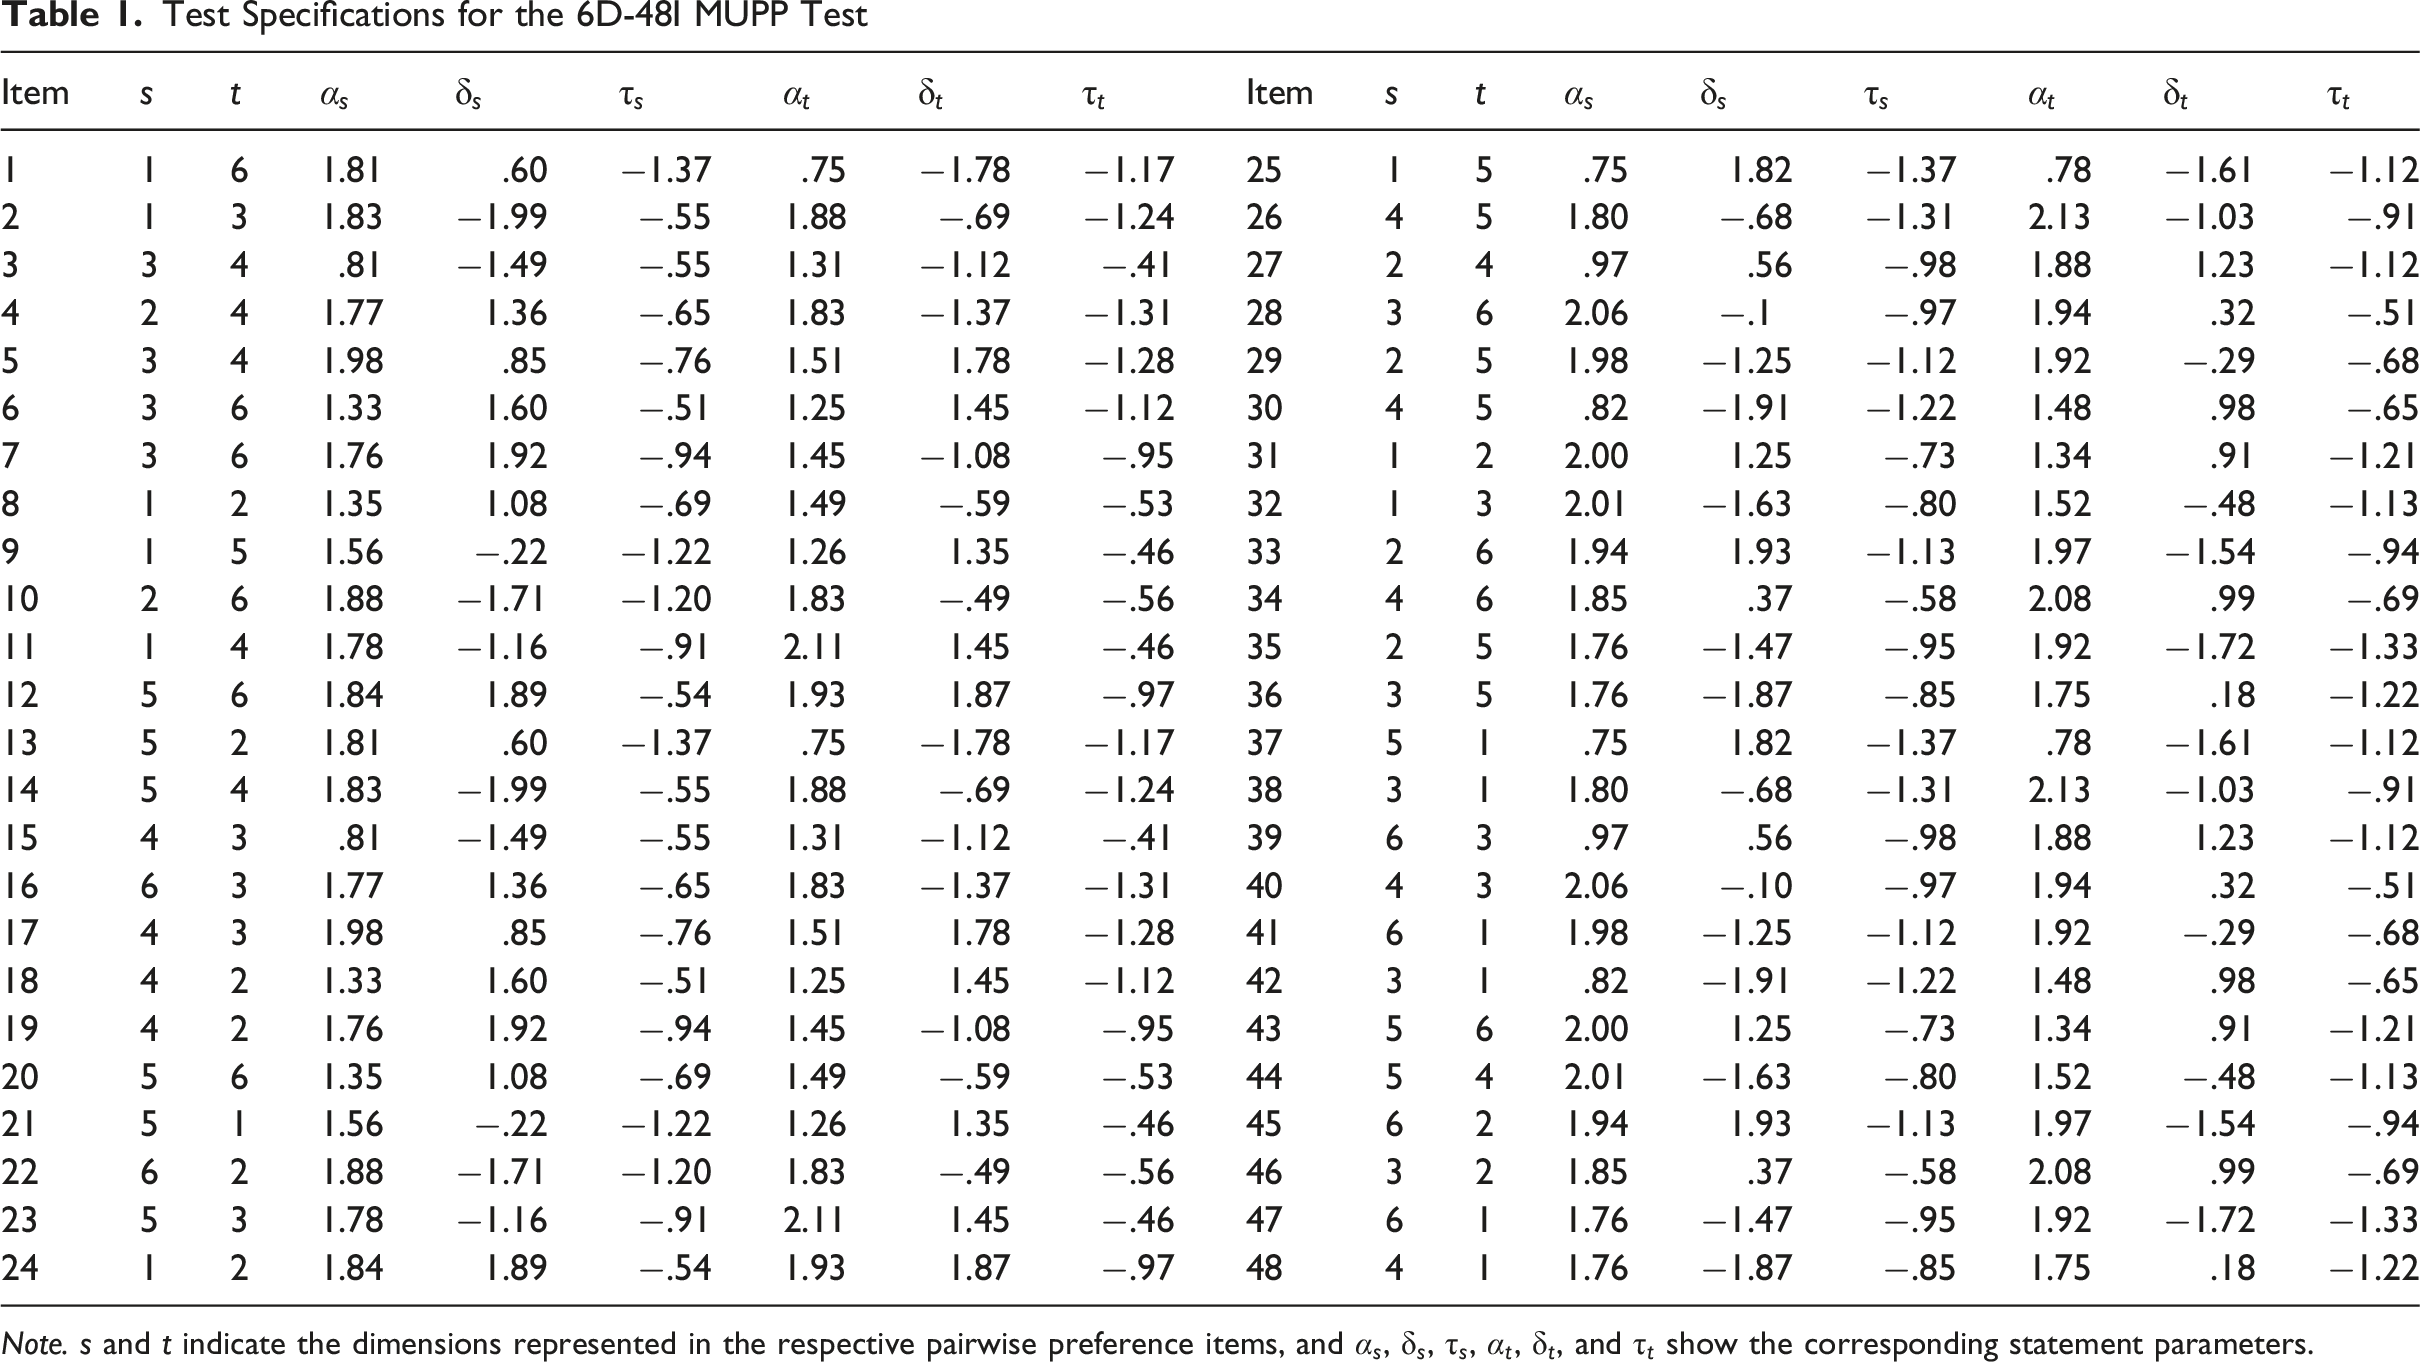
Note. s and t indicate the dimensions represented in the respective pairwise preference items, and
Test Specifications for the 12D-96I MUPP Test
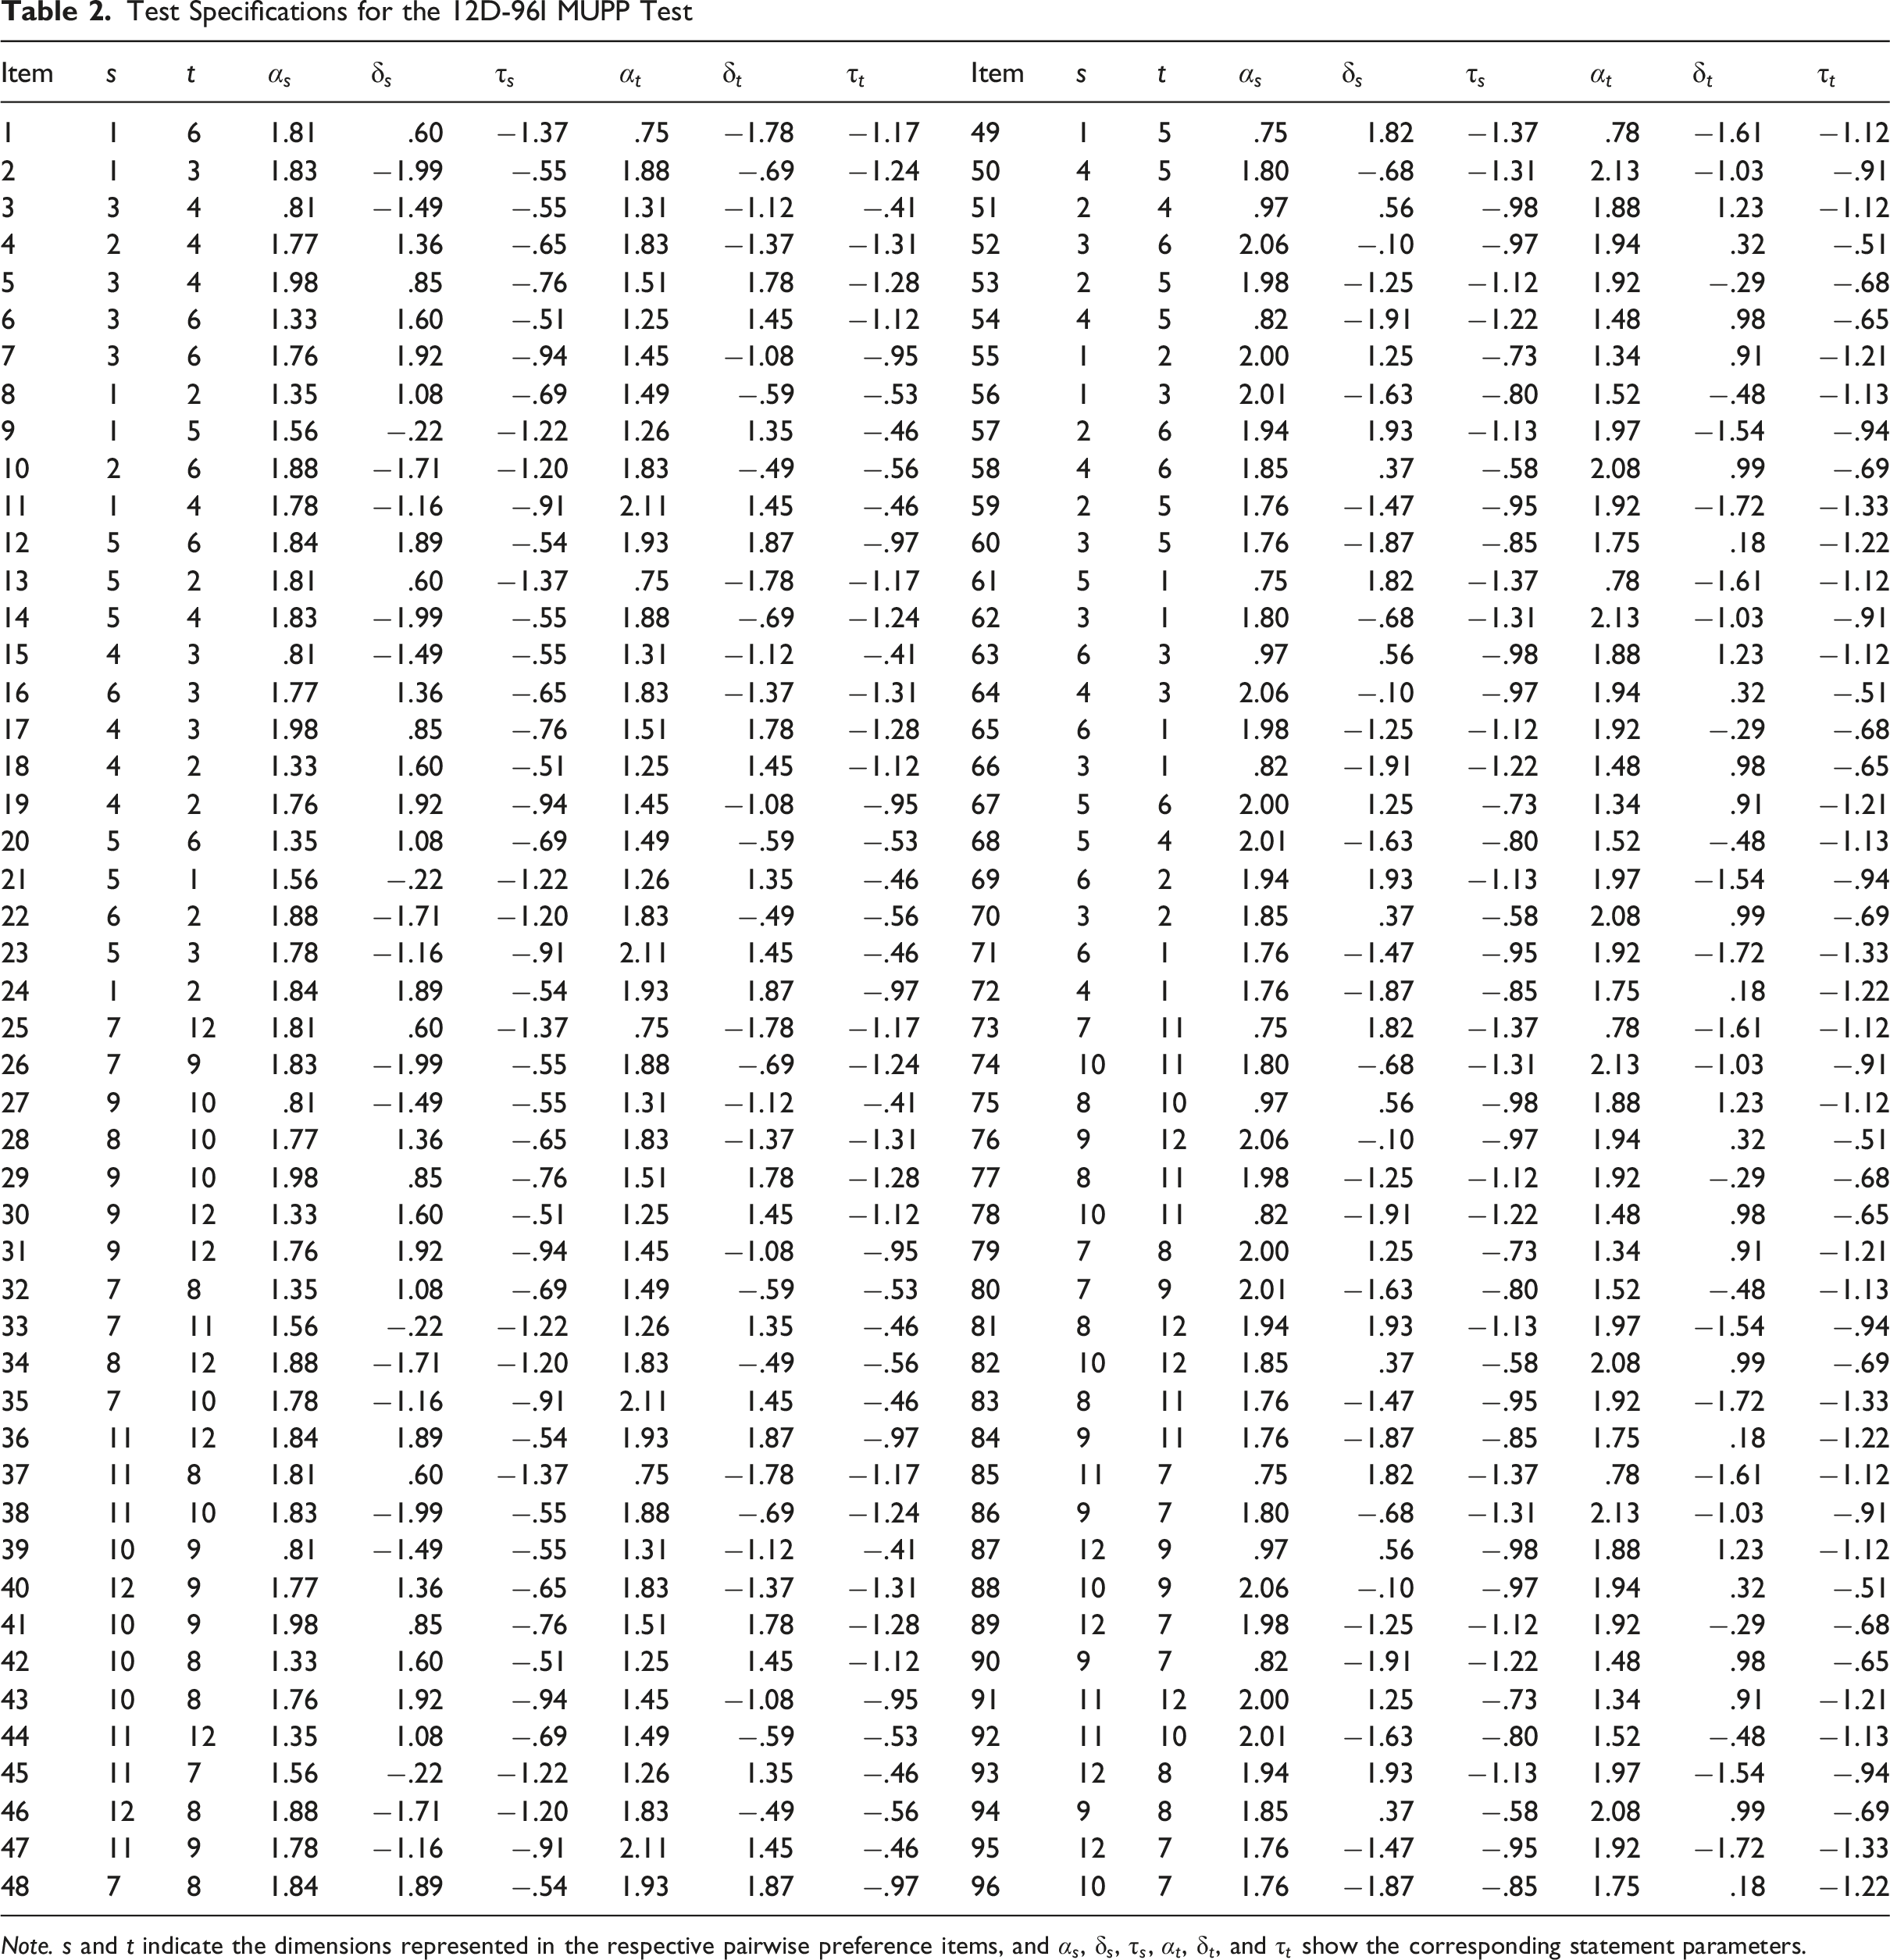
Note. s and t indicate the dimensions represented in the respective pairwise preference items, and
Normal Response Data Generation
On each replication, person parameters (
Statement Parameter Estimation
Statement parameters were pre-estimated from single statement (i.e., rating scale) response data (N = 800) and treated as “fixed.” Specifically, dichotomous single statement response data were generated based on the GGUM. The GGUM probability was computed using the corresponding true single statement parameters and person parameters. After the GGUM probabilities were obtained for all statements and respondents, single statement response data were generated from the binomial distribution with the GGUM probabilities. The generated response data for the statements representing each dimension were then calibrated, one dimension at a time, using the GGUM MCMC program (Joo et al., 2017).
Random Response Data Generation
On each replication, 20% of respondents were randomly selected as aberrant respondents. For these respondents, aberrant response data were generated by replacing their normal responses with random responses on the final portion of the test, corresponding to the designated proportion of randomly answered items. For example, in conditions where 50% of items were designated to be answered randomly, the last 50% of each aberrant respondent’s item responses were replaced with random responses, while the remaining responses were identical to the originally generated normal response data. Each random item response was generated from the binomial distribution with a probability of .50.
OAM and l z Implementation
OAM was implemented using the R packages rstan (Stan Development Team, 2023) and bridgesampling (Gronau et al., 2017). Specifically, both the normal and aberrant responding models were fit to each respondent’s data using the stan function in rstan, with pre-estimated statement parameters held fixed. The default sampling algorithm, Hamiltonian Monte Carlo (HMC), and the default standard normal prior were used for scoring. The resulting stanfit objects were then passed to the bridge_sampler function in bridgesampling to calculate marginal likelihoods, as in Equations (3.1)–(3.4). The bf function from bridgesampling was used to compute the likelihood ratio for OAM, as in Equation (3.5). A respondent was flagged as aberrant if their likelihood ratio exceeded the critical value. Person parameter estimates from the normal responding model stanfit object were used to calculate l z for each respondent, as in Equations (4.1)–(4.4). A respondent was flagged as aberrant if their l z value fell below the critical value.
Critical Values
Critical values for l z and OAM
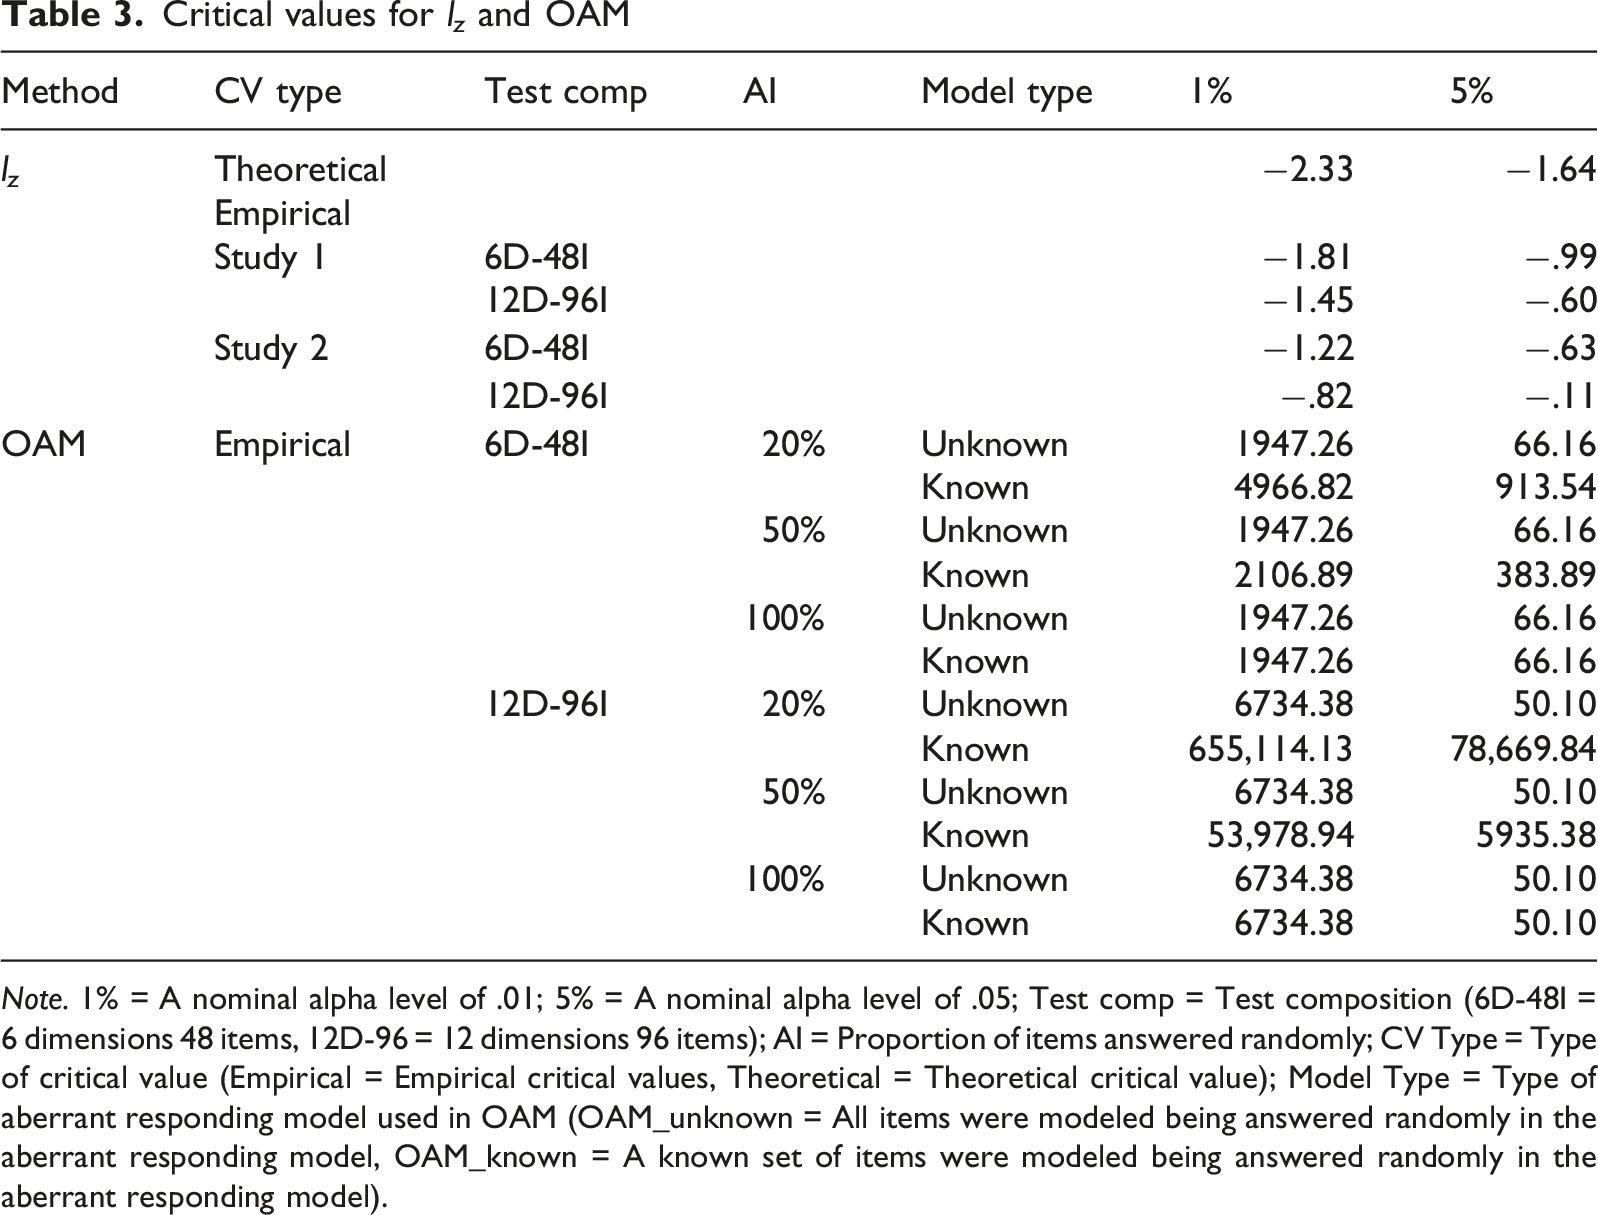
Note. 1% = A nominal alpha level of .01; 5% = A nominal alpha level of .05; Test comp = Test composition (6D-48I = 6 dimensions 48 items, 12D-96 = 12 dimensions 96 items); AI = Proportion of items answered randomly; CV Type = Type of critical value (Empirical = Empirical critical values, Theoretical = Theoretical critical value); Model Type = Type of aberrant responding model used in OAM (OAM_unknown = All items were modeled being answered randomly in the aberrant responding model, OAM_known = A known set of items were modeled being answered randomly in the aberrant responding model).
Analyses
Type I error was computed as the proportion of normal respondents incorrectly flagged as aberrant. Power was computed as the proportion of aberrant respondents correctly identified as such.
Study 1 Results
Study 1: Power and Type I Error Rates of l z and OAM to Detect Random Responding_1%
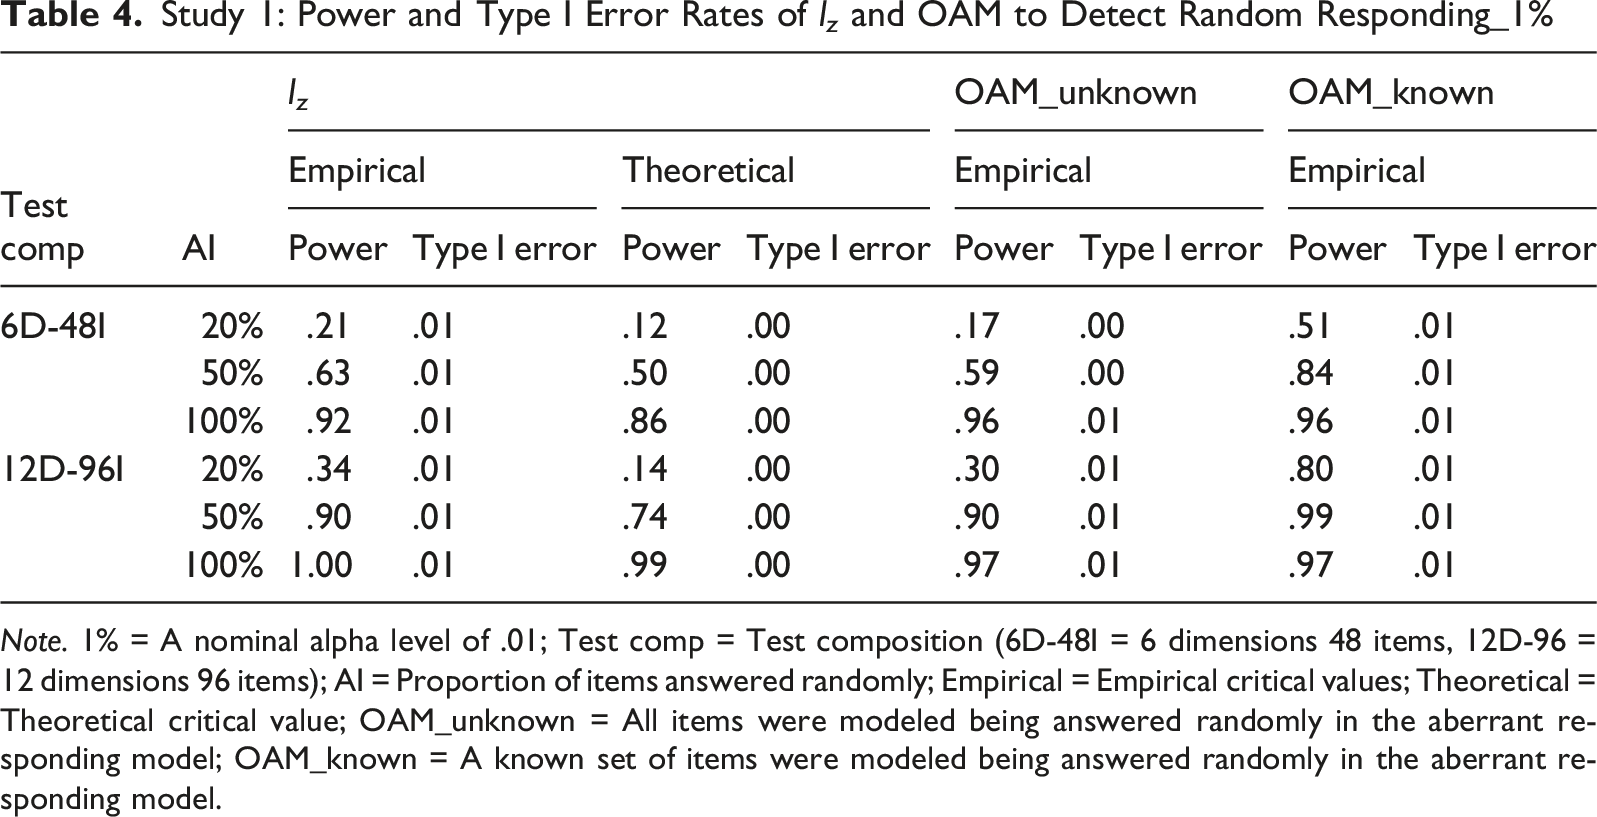
Note. 1% = A nominal alpha level of .01; Test comp = Test composition (6D-48I = 6 dimensions 48 items, 12D-96 = 12 dimensions 96 items); AI = Proportion of items answered randomly; Empirical = Empirical critical values; Theoretical = Theoretical critical value; OAM_unknown = All items were modeled being answered randomly in the aberrant responding model; OAM_known = A known set of items were modeled being answered randomly in the aberrant responding model.
lz vs. OAM
Comparing l z with OAM further clarified the conditions under which l z was most effective. OAM_known represents a theoretical upper-bound benchmark because it assumes that both the proportion and exact items answered randomly are known a priori, a condition unlikely to be met in practice. When OAM was correctly specified in this way, it showed higher power than l z , especially when random responding was difficult to detect. For example, in the 6D-48I condition with only 20% of items answered randomly, power was .21 for l z with empirical critical values and .51 for OAM_known. However, as the proportion of randomly answered items and test length increased, the difference between OAM_known and l z became smaller. For example, in the 12D-96I condition with 100% of items answered randomly, power was 1.00 for l z with empirical critical values and .97 for OAM_known. Thus, l z approached the theoretical maximum detection power when random responding was easier to detect, such as in the 100% random responding and longer test conditions.
OAM_unknown provides a more realistic benchmark because all items were modeled as random regardless of the true proportion of randomly answered items. This reflects the more practical reality that the items answered randomly are not known a priori. The results showed that the performance of l z relative to OAM_unknown depended on the critical value type, the proportion of items answered randomly, and test length. In the 100% random responding conditions, both l z and OAM_unknown were highly effective, exhibiting high power and low Type I error. In the 50% random responding conditions, l z with empirical critical values and OAM_unknown were comparably effective, although power declined sharply for the shorter 6D-48I tests. In the 20% random responding conditions, both l z and OAM_unknown had lower power, but l z with empirical critical values performed better than OAM_unknown. These findings suggest that l z may be more effective than OAM when the aberrant responding model specified in OAM does not match the true random responding pattern, particularly when random responding is relatively difficult to detect, such as in the 20% random responding and shorter test conditions.
Study 1: Power and Type I Error Rates of l z and OAM to Detect Random Responding_5%
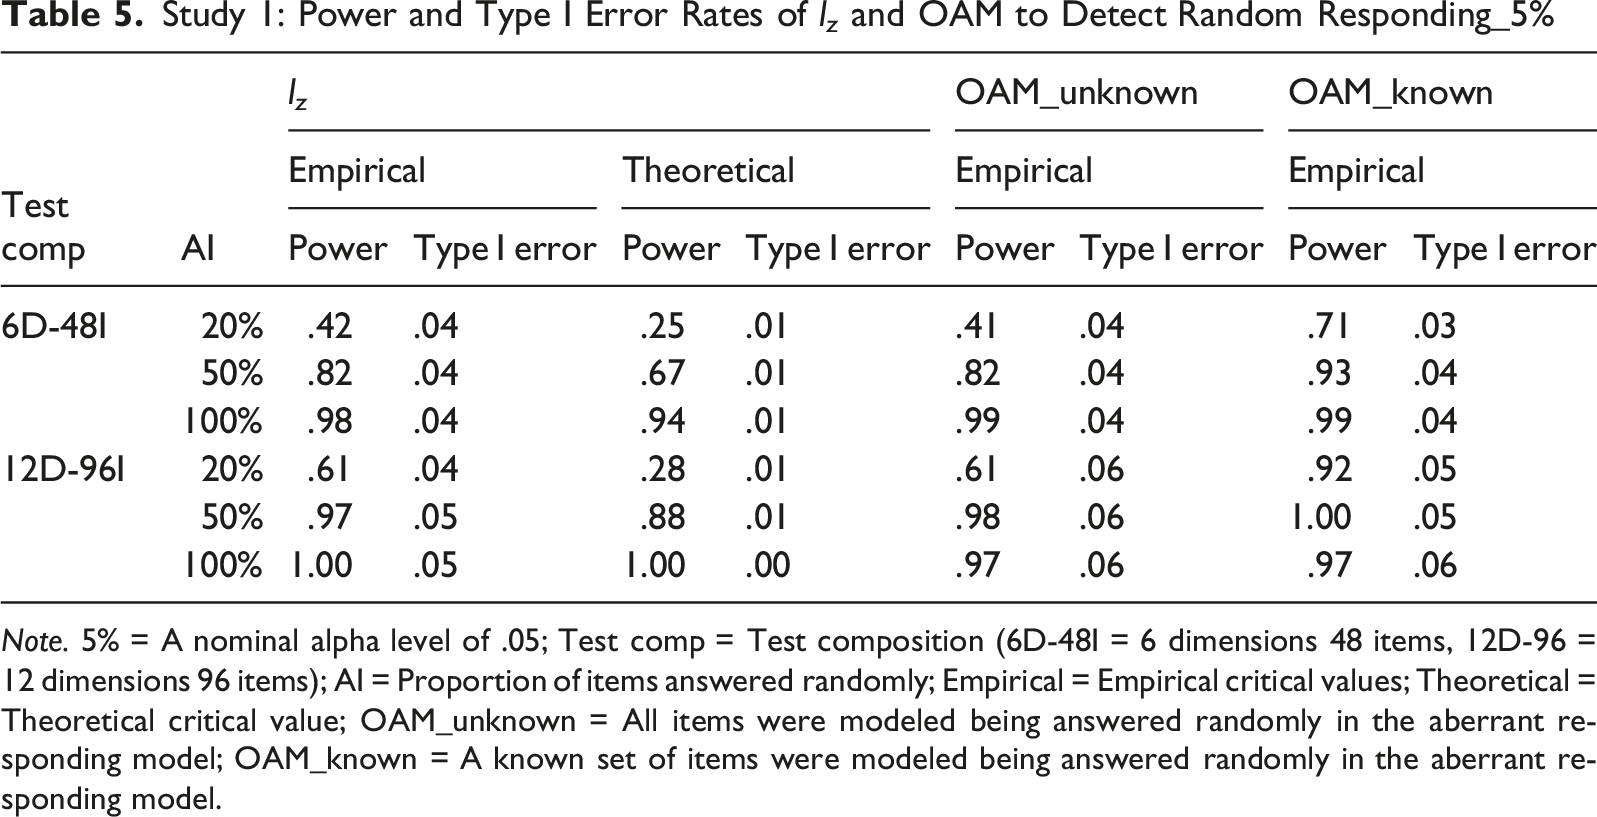
Note. 5% = A nominal alpha level of .05; Test comp = Test composition (6D-48I = 6 dimensions 48 items, 12D-96 = 12 dimensions 96 items); AI = Proportion of items answered randomly; Empirical = Empirical critical values; Theoretical = Theoretical critical value; OAM_unknown = All items were modeled being answered randomly in the aberrant responding model; OAM_known = A known set of items were modeled being answered randomly in the aberrant responding model.
Study 1 provided initial evidence regarding the performance of l z and OAM in detecting random responding in MFC tests. However, several aspects of the simulation design should be noted. First, because the implementation of OAM relies on HMC estimation and is therefore computationally intensive, only 20 replications were performed per condition. Although the observed power and Type I error rates showed little variation across replications, with standard deviations ranging from 0 to .05 for power and from 0 to .02 for Type I error, a larger number of replications is needed to better establish the generalizability of the findings. Second, l z was calculated using pre-estimated statement parameters from single statement response data rather than the true statement parameters commonly used in simulation studies (e.g., Nering, 1995; Reise, 1995; Snijders, 2001). This approach reflects common practice in large-scale MUPP applications in which statement parameters are first estimated from single statement response data and then treated as fixed during scoring. This two-step approach has been supported by prior work showing high correlations between trait scores estimated using pre-estimated statement parameters and those estimated directly from MFC response data (Stark et al., 2005a, 2005b; Tu et al., 2023a). However, it introduces statement parameter estimation error that may affect the performance of l z . Third, the proportion of aberrant respondents was fixed at 20%. Although this factor was not expected to affect the performance of l z in Study 1 because it influences neither the scoring of individual response patterns nor the pre-estimated statement parameters, this needs to be empirically demonstrated. Study 2 was therefore designed to address these aspects by increasing the number of replications, using true statement parameters, and varying the proportion of aberrant respondents.
Study 2
Simulation Study Design
Five factors were manipulated: (1) proportion of items answered randomly (20%, 50%, 100%), (2) test composition (6D-48I, 12D-96I [D = dimensions; I = items]), (3) l z critical value type (theoretical, empirical), (4) nominal alpha level (.01, .05), and (5) proportion of aberrant respondents (20%, 50%), yielding 48 conditions. Sample size was fixed at 1600 and 100 replications were performed per condition.
Simulation Procedures
The test specifications, normal response data generation, random response data generation, critical values, and analyses followed Study 1, with four differences. First, the simulated sample size was 1600 rather than 800. Second, true statement parameters were used directly for trait estimation and l z calculation instead of estimating statement parameters from single statement response data. Third, the proportion of aberrant respondents varied across conditions (20%, 50%) rather than being fixed at 20%. Fourth, empirical critical values were derived from a normal response dataset of N = 1600 rather than 800.
lz Implementation
Person parameters were estimated using maximum a posteriori (MAP) estimation, and l z was then computed for each respondent following Equations (4.1)–(4.3). In Study 1, HMC was used because OAM requires marginal likelihoods, which were computed using the R package bridgesampling with fitted objects from rstan, whose default estimation method is HMC. In Study 2, MAP was used instead because it is substantially faster, which was necessary given the expanded design of 48 conditions and 100 replications per condition. Given the computational demands of OAM, which relies on HMC estimation, OAM was excluded from Study 2.
Study 2 Results
Study 2: Power and Type I Error Rates of l z to Detect Random Responding_1%
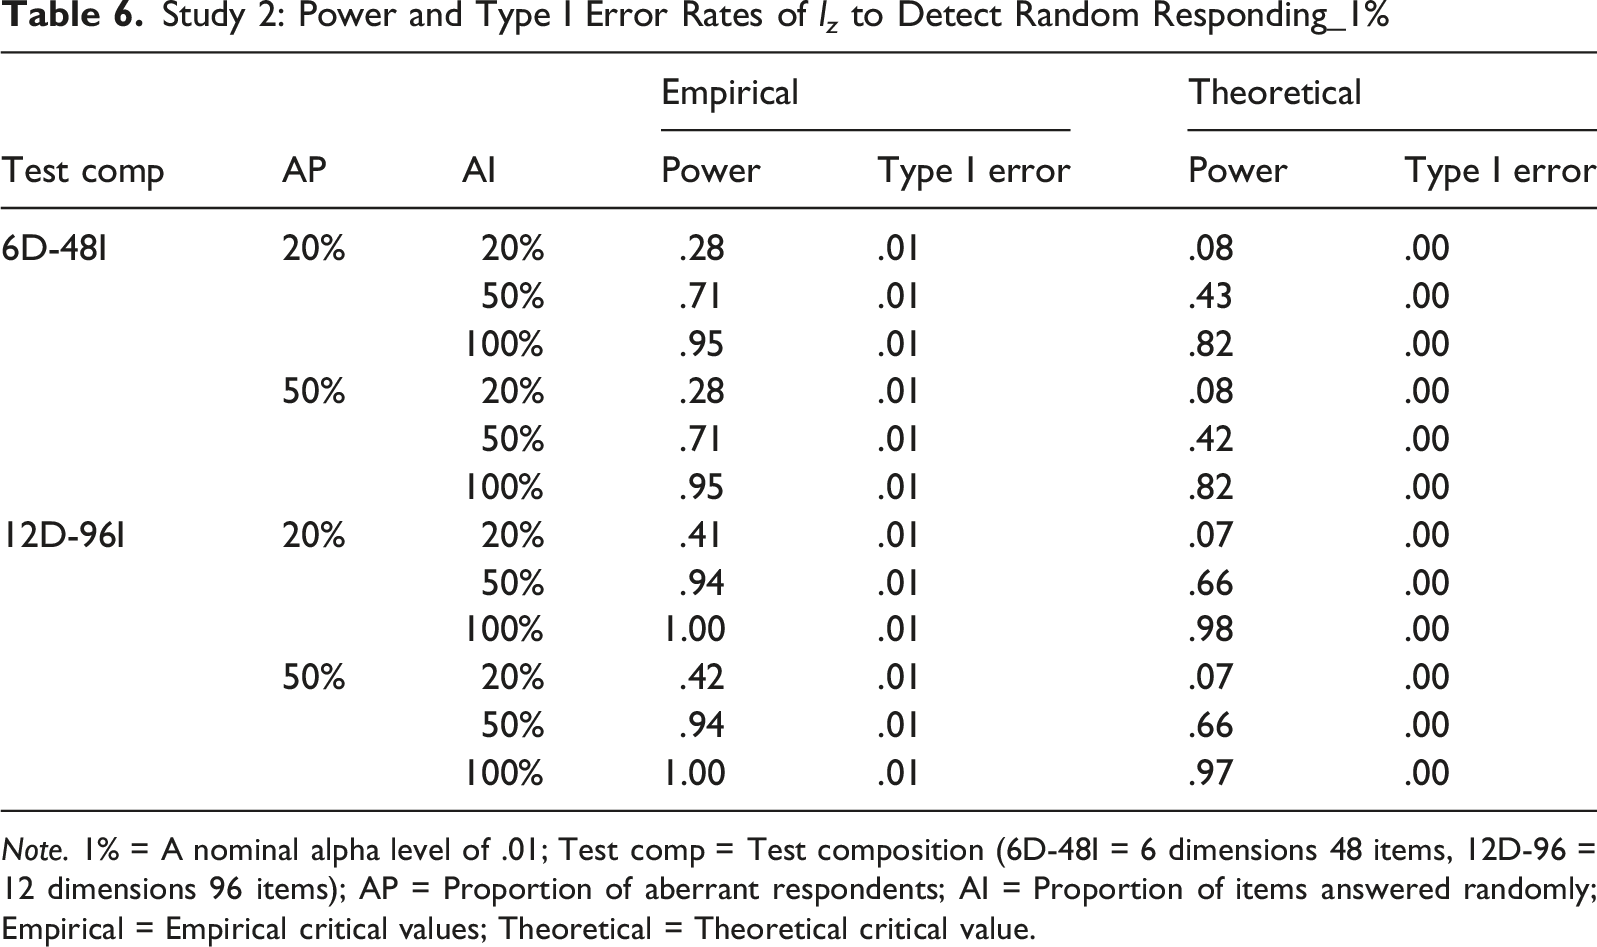
Note. 1% = A nominal alpha level of .01; Test comp = Test composition (6D-48I = 6 dimensions 48 items, 12D-96 = 12 dimensions 96 items); AP = Proportion of aberrant respondents; AI = Proportion of items answered randomly; Empirical = Empirical critical values; Theoretical = Theoretical critical value.
Study 2: Power and Type I Error Rates of l z to Detect Random Responding_5%
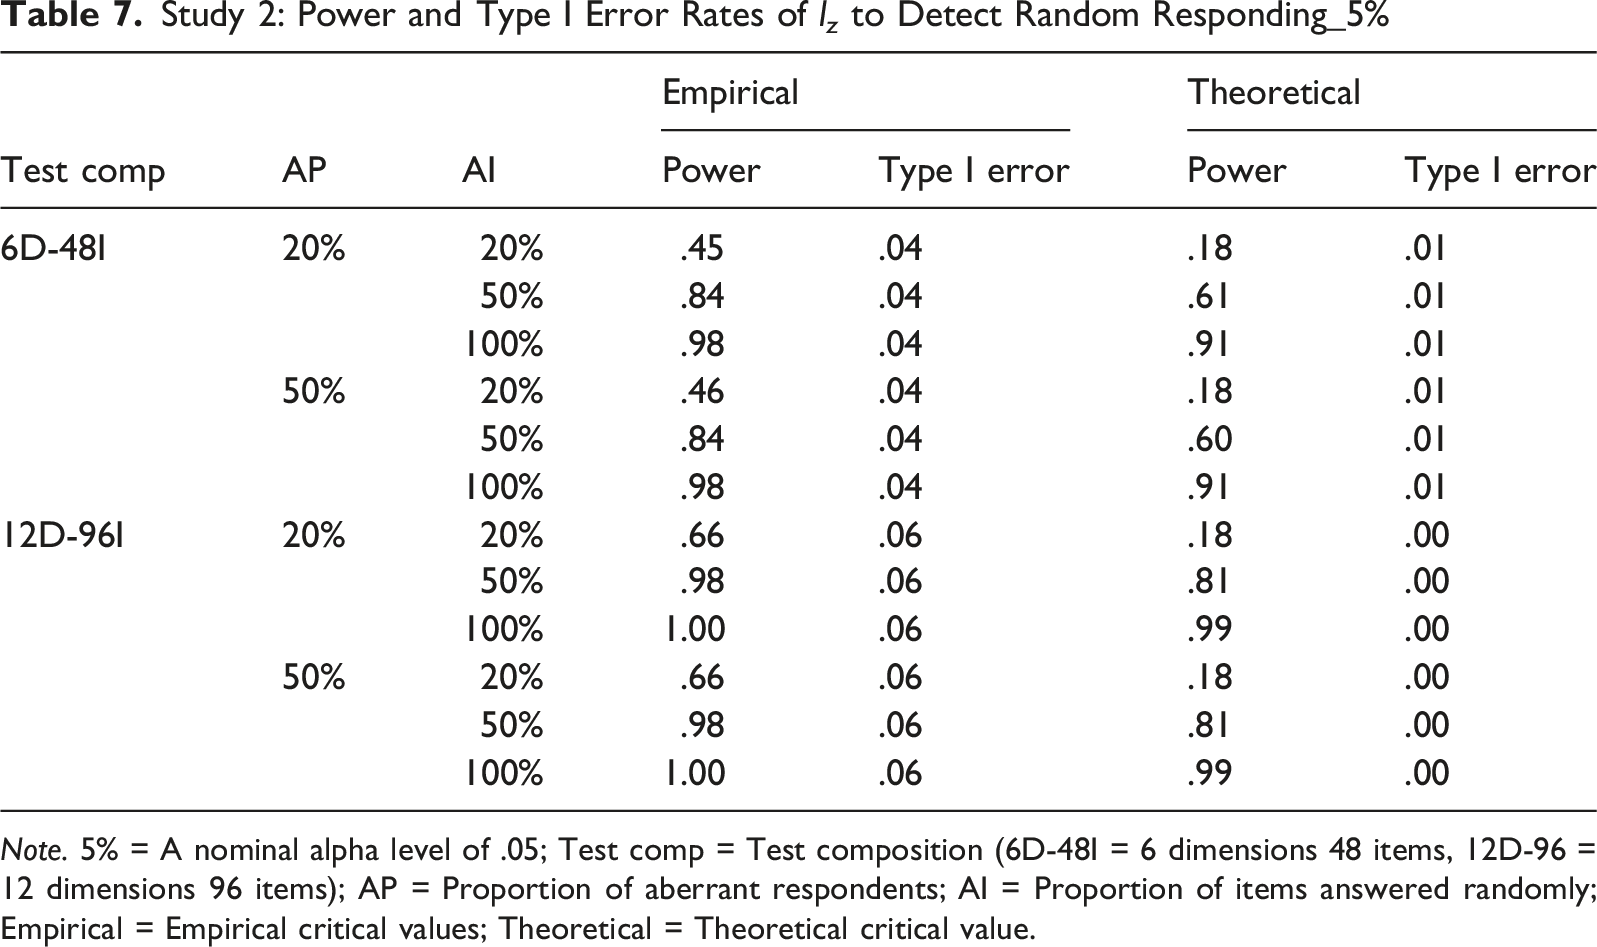
Note. 5% = A nominal alpha level of .05; Test comp = Test composition (6D-48I = 6 dimensions 48 items, 12D-96 = 12 dimensions 96 items); AP = Proportion of aberrant respondents; AI = Proportion of items answered randomly; Empirical = Empirical critical values; Theoretical = Theoretical critical value.
Discussion
MFC test formats are widely used in high-stakes settings to reduce faking. However, MFC remains susceptible to random responding, particularly in low-stakes settings where respondents may be insufficiently motivated and in high-stakes settings where some assessments may be viewed as less consequential. To support the development and application of MFC tests, effective methods for detecting random responding in MFC are needed to ensure that inferences drawn from MFC data are valid. This research contributes to the MFC literature on aberrant responding detection by evaluating the effectiveness of the IRT-based person fit statistic l z in detecting random responding and comparing its performance to OAM, a theoretically optimal method for detecting aberrant responding.
Two simulation studies were conducted to examine the efficacy of l z for detecting random responding in MFC tests. Based on the results, three practical implications for the use of l z can be drawn. First, l z can be effective for detecting random responding, particularly when empirical rather than theoretical critical values are used, which is consistent with findings from previous research (Drasgow et al., 1985; Lee et al., 2014, 2024; Molenaar & Hoijtink, 1990; Nering, 1997). This improvement is attributed to the use of estimated rather than true person parameters in calculating l z , which causes the empirical distribution of l z to deviate from the standard normal distribution. Consequently, when theoretical critical values based on the standard normal distribution were applied, both power and Type I error rates were reduced. Because true person parameters are unknown in practice and must be estimated from observed response data, empirical critical values are recommended for detecting random responding in MFC tests. Second, shorter tests were associated with lower power for l z . Researchers and practitioners using short tests should therefore interpret respondents not flagged by l z cautiously, as a non-flagged response pattern does not necessarily indicate the absence of random responding. Third, the proportion of aberrant respondents had essentially no effect on the power or Type I error rate of l z . The prevalence of aberrant respondents is therefore not a concern when applying l z .
The comparison between OAM and l z provides additional information about the practical utility of l z for detecting random responding in MFC tests. OAM_known served as a theoretical benchmark because OAM achieves maximum detection power when the normal responding model fits the data and the aberrant responding model is correctly specified. Relative to this benchmark, l z with empirical critical values approached “optimal” detection under favorable conditions, specifically when the proportion of randomly answered items was higher and the test was longer. When the aberrant responding model was incorrectly specified, as in OAM_unknown, l z with empirical critical values performed as well as or better than OAM. In practice, it is nearly impossible to know the exact type of aberrant responding respondents engage in, the proportion of items answered aberrantly, or which specific items are affected, making it unlikely that OAM will reach its theoretical maximum power in operational settings. In addition, implementing OAM involves marginal likelihood estimation, which can be computationally intensive and technically demanding. Therefore, although l z may not always reach the theoretical maximum detection power, its use with empirical critical values is a practical approach for detecting random responding in applied MFC testing because of its simplicity, efficiency, and robustness.
Building on this recommendation, when implementing l z in MFC tests to detect random responding in practice, researchers and practitioners should first score the MFC response data for each respondent. The l z statistic can then be calculated for each respondent using the estimated trait scores and the pre-estimated statement parameters based on Equations (4.1)–(4.3). The resulting l z value is compared to a critical value, and respondents with l z values smaller than the selected critical value may be flagged. Although researchers and practitioners may choose between theoretical and empirical critical values, the findings of the present study support the use of empirical critical values. To obtain empirical critical values, MFC response data can be simulated under a normal responding model for a large sample (e.g., 800 to 1600 respondents), and l z can be calculated for each simulated respondent. The critical value is then determined by identifying the values at the 1st and 5th percentiles, depending on the acceptable false positive rate.
Several limitations should be noted. First, this research focused only on random responding. Although MFC formats reduce faking compared to rating scales, they do not fully prevent it. Therefore, effective methods for detecting faking in MFC may also be necessary. Lee et al. (2014) examined the effectiveness of l z for detecting faking and found it to be ineffective. However, in their simulation, faking response data were simulated by simply increasing respondents’ trait levels, which may have made it difficult for l z to distinguish between respondents who were faking and those who genuinely had high trait levels. Future research should explore alternative ways of modeling and simulating faking response data and further investigate the effectiveness of l z and OAM in detecting faking. For example, instead of simulating only the outcome of faking, which is trait score inflation, future studies could simulate the process of faking by considering the social desirability of each statement within MFC items. Second, this research evaluated l z and compared its performance with OAM, providing a useful starting point for evaluating random responding detection in MFC tests. However, given the comparative and multidimensional nature of MFC tests, whether other person fit statistics evaluated in the unidimensional IRT literature (Karabatsos, 2003) can be extended to the MFC context, and how their performance would compare with l z in detecting random responding remain open questions. A systematic comparison of l z with other person fit statistics in MFC tests is therefore an important direction for future research. Third, although the observed power of l z in this research was comparable to findings from previous research (e.g., Kim & Moses, 2018; Lee et al., 2024), it was relatively low in some conditions. In particular, when the proportion of items answered randomly was small and the test was short, the power of l z was well below the theoretical maximum detection power achieved by OAM. One potential reason is that l z is sensitive to person parameter estimation error (Meijer & Tendeiro, 2012). In this research, person parameters were estimated from simulated aberrant response data when calculating l z , which reflects operational testing practice in which person parameters must be estimated from observed response data that may contain aberrant responding. However, estimating person parameters from response data that may contain aberrant responding introduces estimation error, which can negatively affect the performance of l z (Kim & Moses, 2018; Nering, 1997). Future research should examine whether improving the accuracy of person parameter estimation, such as by using informative priors or incorporating collateral information (de La Torre & Patz, 2005; Joo et al., 2026; Stark et al., 2005b; Tu et al., 2023a, 2025; Wang & Wu, 2016), can increase the effectiveness of l z for detecting random responding. Finally, we note that in the 12D test under the 20% randomly answered items condition, the distribution of randomly answered items across dimensions was uneven, as indicated by the test specification in Table 2. Although this does not affect the present simulation results because the detection indices were computed for each respondent across all dimensions, it raises questions about more realistic testing settings in which some dimensions may show higher rates of aberrant responding than others. Future research should systematically examine how dimension-specific patterns of aberrant responding affect the estimation and interpretation of construct dimensions in MFC measures.
Footnotes

Ethical Considerations
There are no human participants in this article and informed consent is not required.
Funding
The authors received no financial support for the research, authorship, and/or publication of this article.
Declaration of conflicting interests
The authors declared no potential conflicts of interest with respect to the research, authorship, and/or publication of this article.