
Abstract
The International Atomic Energy Agency sets standards for the decontamination of radioactive materials adhering to the body surface at Operational Intervention Level 4. Contamination is determined using instruments designed to measure surface contamination, such as the Geiger–Müller counter tube survey metre (GM survey metre). This study was performed to evaluate the validity of using GM survey metres to inspect the surface contamination of evacuees during a nuclear disaster. We measured the resolving time (RT) of GM survey metres and examined the relationship between the corrected count rate and surface contamination density. The RTs of all objects were longer than the Japanese Industrial Standards standard value of 250 μs. Our study suggests that the RT should be maintained at <2000 µs to avoid overestimation during contamination inspection. Close attention is required to maintain the RT within this time, and GM survey metres with long RTs should be excluded from inspections to maintain the adequacy of contamination estimation.
Keywords
INTRODUCTION
The International Atomic Energy Agency sets standards for the decontamination of radioactive materials adhering to the body surface at Operational Interventional Level 4 (IAEA, 2011). This agency has established 40,000 cpm for beta rays as the standard value for Operational Interventional Level 4 in the acute phase of a nuclear disaster in Japan. This value corresponds to a surface contamination density of approximately 120 Bq cm−2. The choice of this standard was influenced by the relatively short half-life of beta-emitting isotopes (8.0207 days). Contamination is determined using instruments designed for surface contamination measurement, such as the Geiger–Müller counter tube survey metre (GM survey metre). In the 2011 Fukushima Daiichi nuclear power plant accident, GM survey metres were used to inspect evacuees for radioactive contamination (Hasegawa et al., 2016).
The resolving time (RT) refers to the time from the incidence of radiation into the GM counter to the measurement of the next radiation event. Immediately after a Geiger discharge, the electric field decreases below the critical point because of the positive space charge. If the next ionisation event occurs under these conditions, no gas amplification takes place, and the next pulse is not observed. Therefore, the GM counter is silent during this time, and any radiation interactions that occurred in the tube during this time will be lost (Usman et al., 2018).. A certain finite pulse wavenumber is required to record the second pulse, and the elapsed time required for the second discharge to grow to exceed this wavenumber is called the RT of the device. Fig. 1 shows the pulses of negative polarity normally observed from the detector.
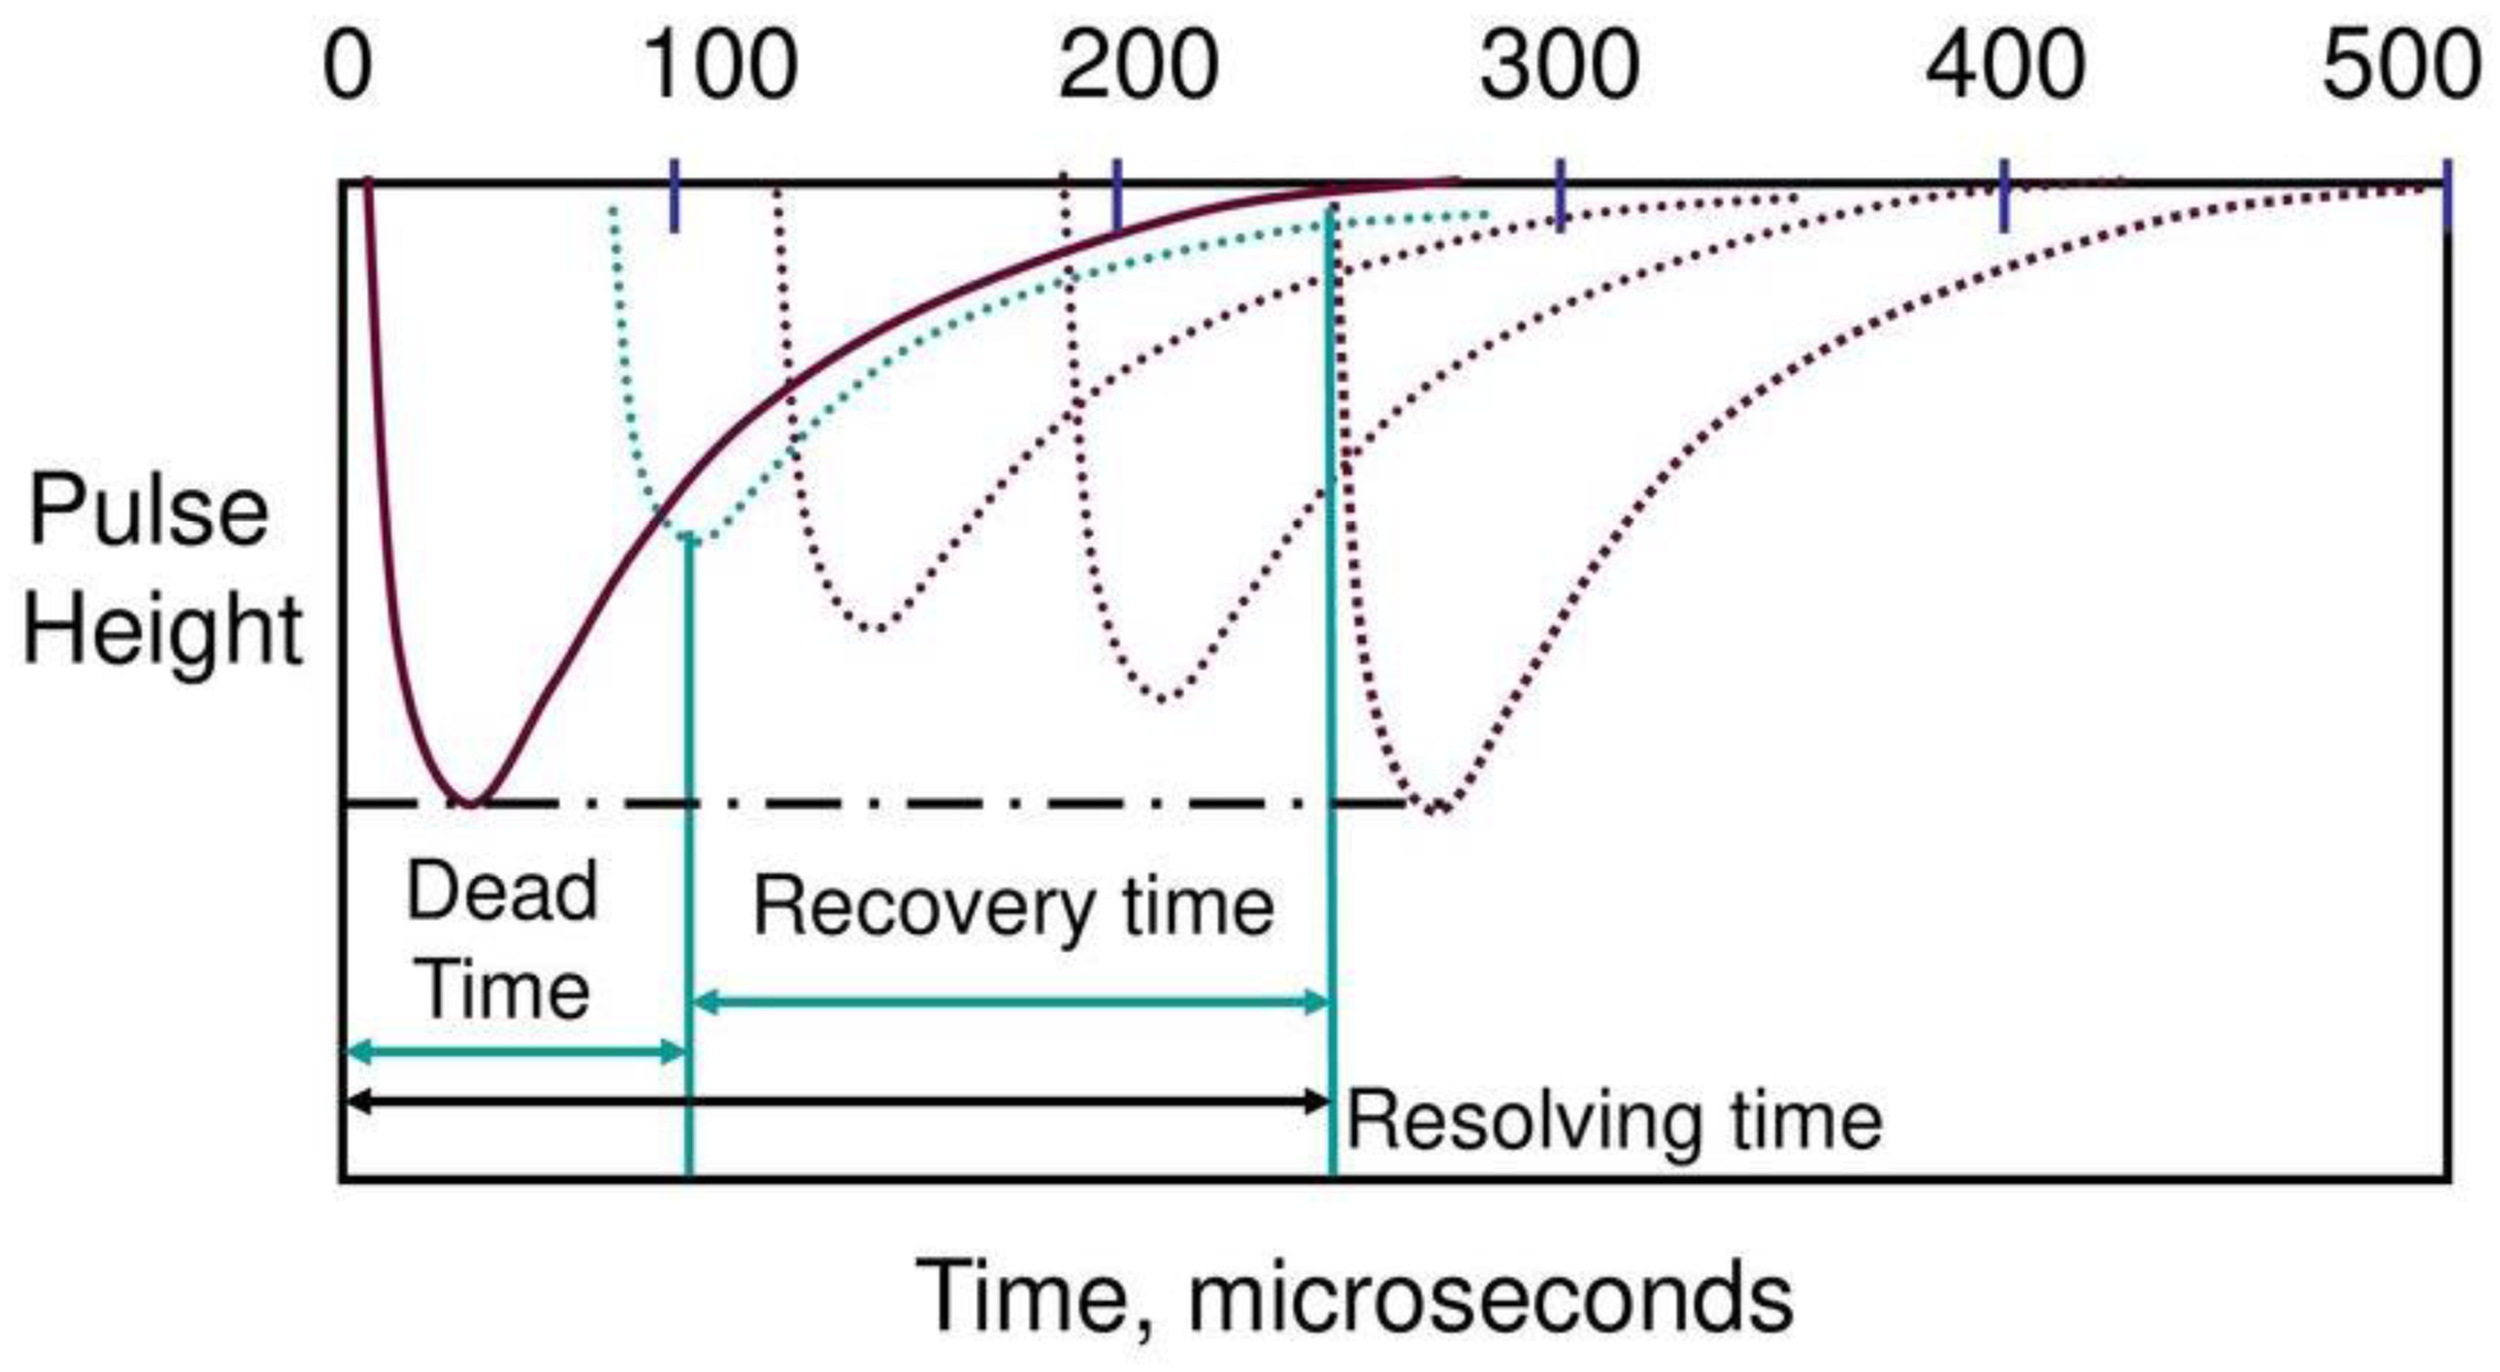
Resolving time of Geiger-Müller counter tube.
This study was performed to evaluate the validity of using GM survey metres to inspect evacuees for surface contamination during a nuclear disaster. Therefore, we measured the RT of GM survey metres and examined the relationship between the corrected count rate and surface contamination density.
Fifteen GM survey metres were examined (TGS-146, 5 units; TGS-136, 8 units; and TCS-1146, 2 units; Nippon RieTec Co., Ltd, Tokyo, Japan). The RT was measured by the two-source method using two 90Sr half-moon sealed radiation sources with radioactivity of 5 kBq each. The count rates of the two 90Sr sources measured independently were designated n1 and n2, respectively, and the count rate of the two 90Sr sources measured simultaneously was n12. In addition, the defined background value was designated nb. RT was calculated using Eq. (1) (IEC, 2002):

A total of 0.5 mL of 131I was placed in a circular plastic container with an inner diameter of 2.5 cm and a depth of 1 cm. The count rates were then measured at 995, 498, and 249 Bq mL−1 of 131I with known radioactivity levels. The measured RT was taken to correct for counting down and was converted to the surface contamination density. The source efficiency was assumed to be 0.5. The value given to each GM survey metre at the time of calibration was used to assess instrument efficiency. The area of the container was approximately 4.9 cm2; this was smaller than the window area of each GM survey metre, which was approximately 19.6 cm2. Therefore, the counting rate was corrected using the similarity ratio. Measurements were performed three times for each GM survey metre, and the average value was taken as the counting rate of the GM survey metre. Statistical analysis was performed using Spearman's rank correlation coefficient for the obtained count rate after correction and the calculated surface contamination density, and p < 0.05 was considered statistically significant. This research did not involve humans, and the tests were conducted in a radiation-controlled area, taking radiation exposure and contamination into consideration. Fig. 2 shows the layout of this experiment. A piece of plastic wrap was placed between the GM survey metre and 131I to prevent the spread of contamination.
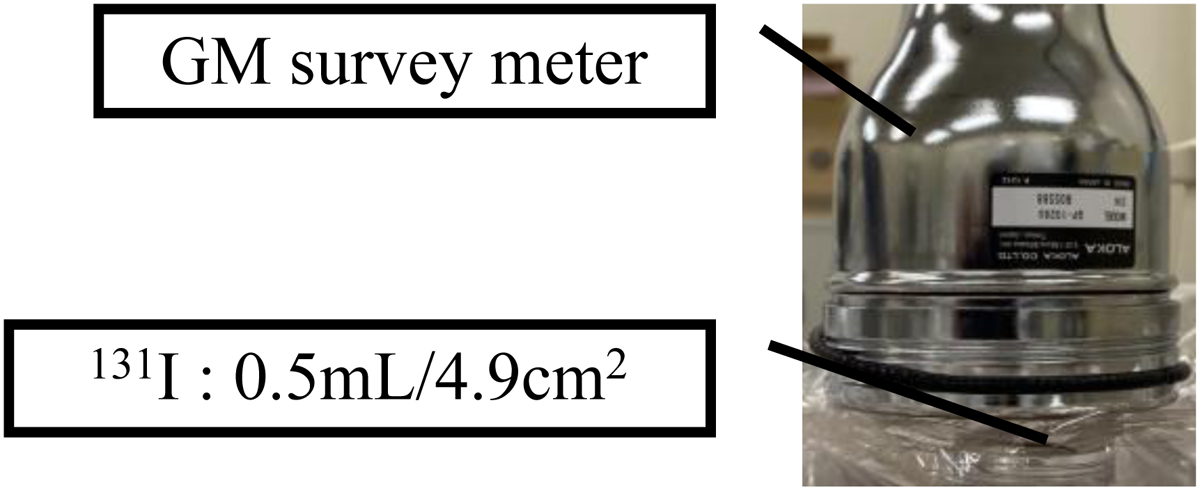
Layout of experiment.
Two of the 15 GM survey metres showed outlier surface contamination densities at radioactive levels of 995, 495, and 249 Bq mL−1. The RTs of the two instruments were 1964 and 2193 µs, respectively. Excluding the above outliers strengthened the positive correlation, and Spearman's rank correlation coefficient was p < 0.001 at 249 Bq mL−1 after excluding outliers. This indicated that the correlation between the number of counts rate and the surface contamination density would increase if inappropriate values could be excluded.
Fig. 3 shows the relationship between the GM survey metre, RT, and the coefficient of determination (R2).
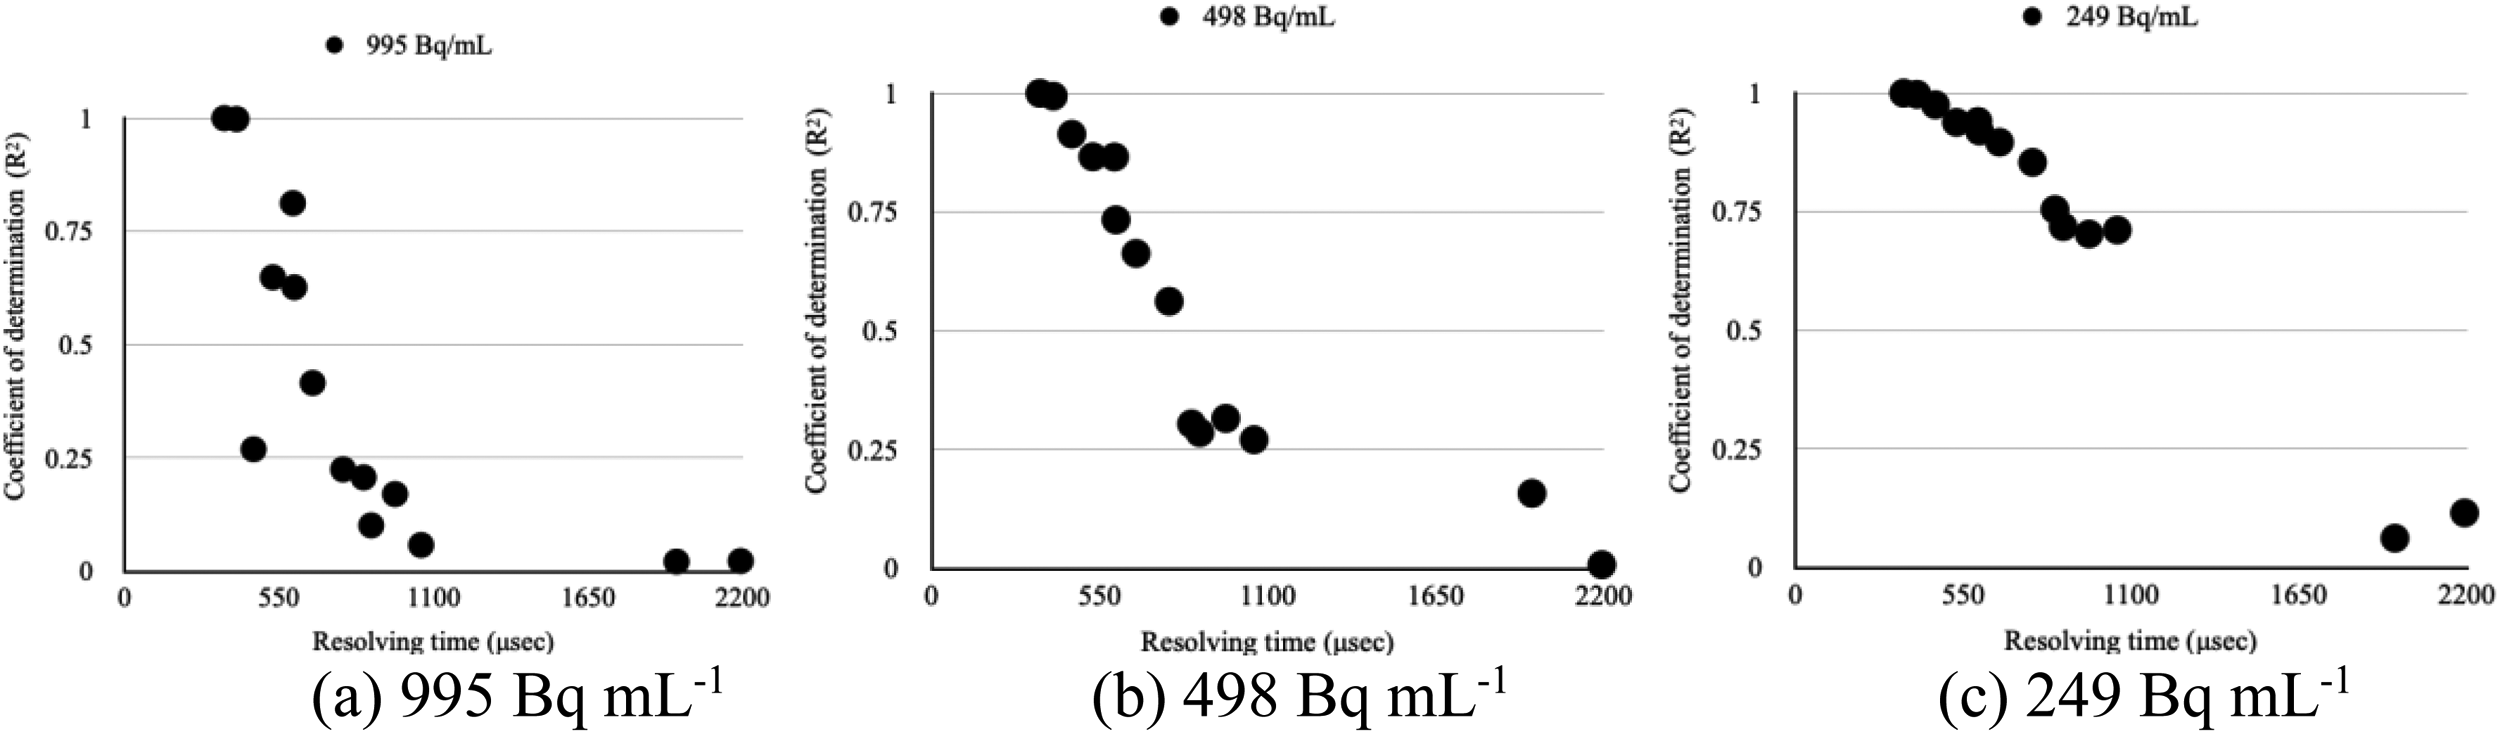
Relationship between Geiger–Müller survey meter, resolving time, and coefficient of determination.
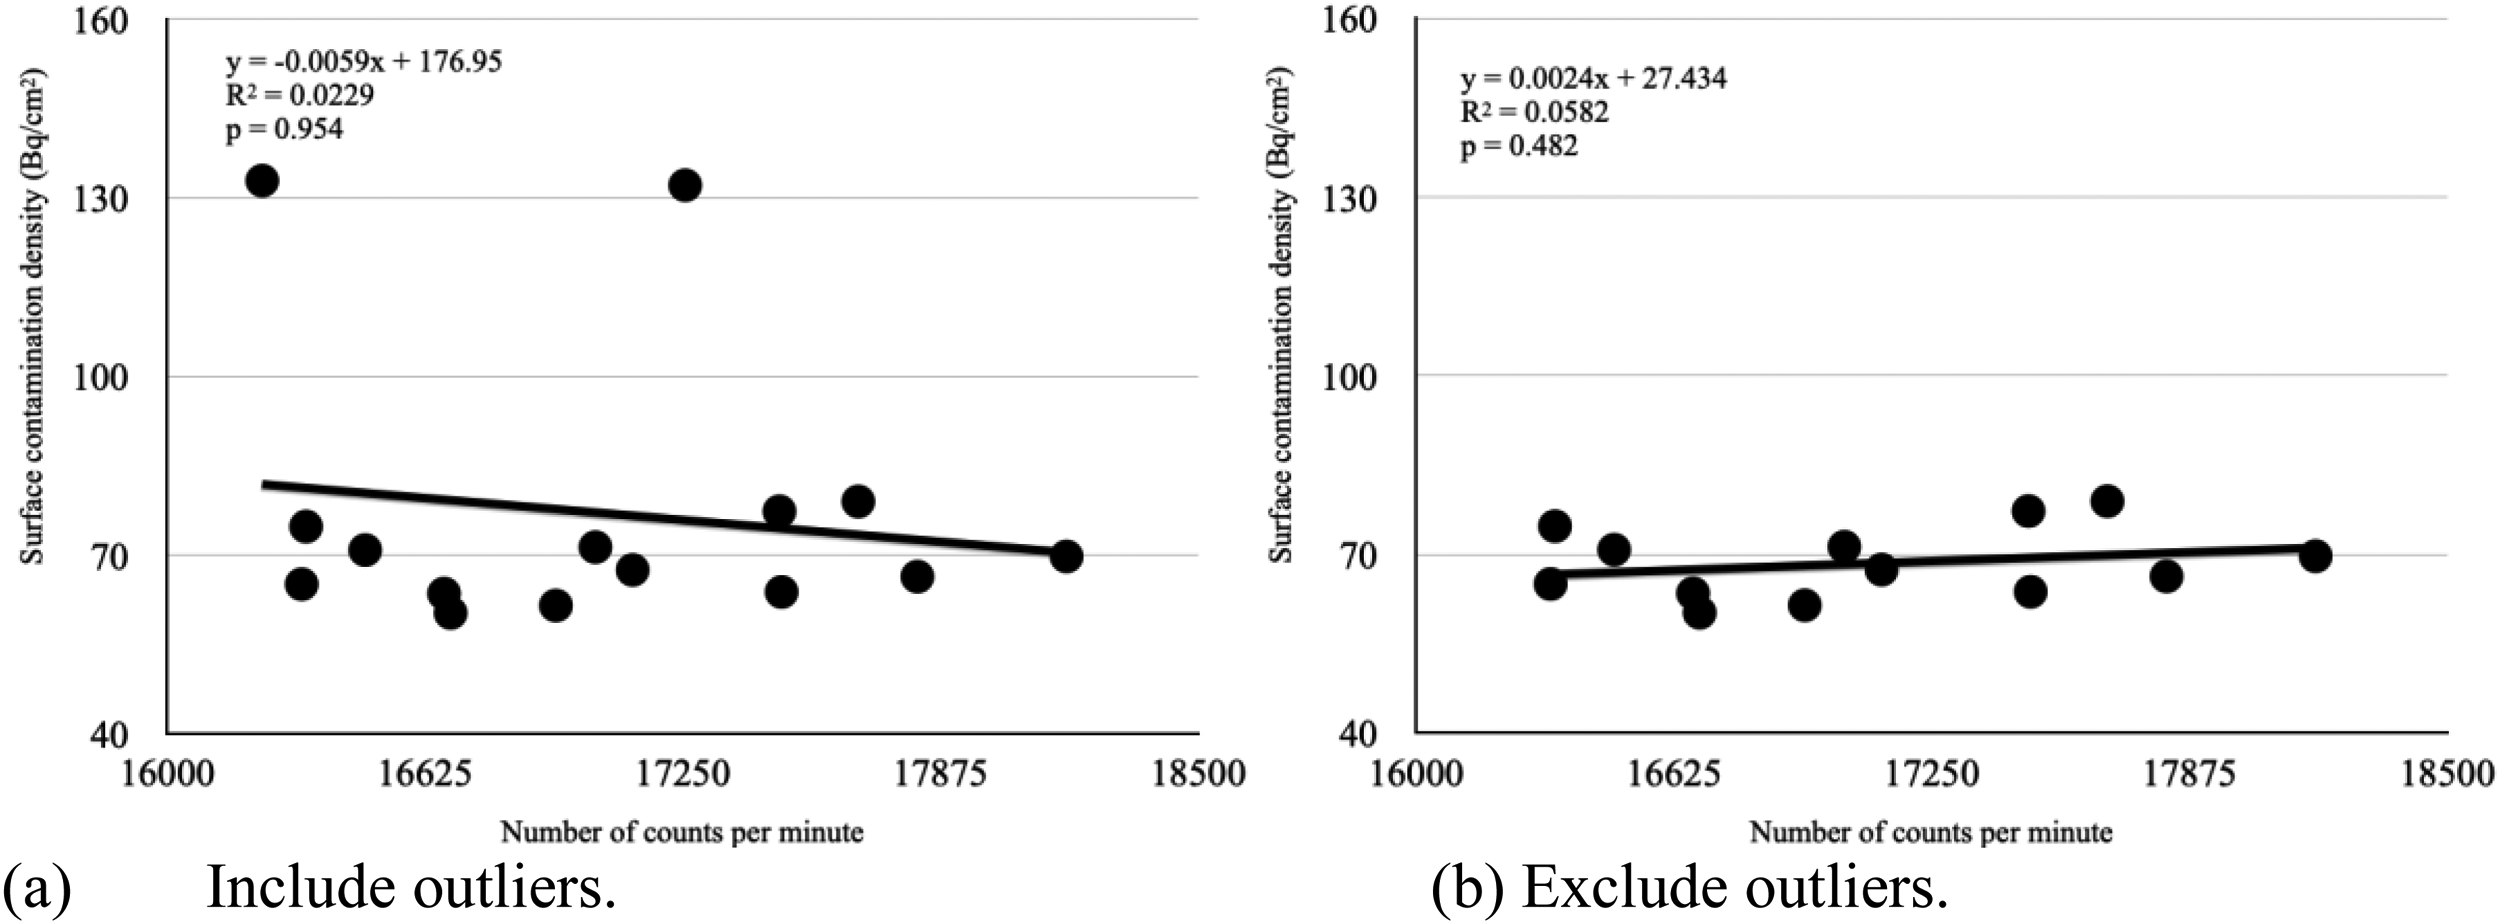
At 995 Bq mL−1, Fig. 4(a) shows the relationship between the measured count rate and true contamination density when outliers were included, and Fig. 4(b) shows this relationship when outliers were removed. The p-value was 0.954 when outliers were included but 0.482 when outliers were removed, changing the correlation from negative to positive.
Relationship between measured counting rate and true contamination density before and after extraction of two outliers at 995 Bq/mL.
At 498 Bq mL−1, Fig. 5(a) shows the relationship between the measured count rate and true contamination density when outliers were included, and Fig. 5(b) shows this relationship when outliers were removed. The p-value was 0.232 when outliers were included and 0.061 when they were removed.
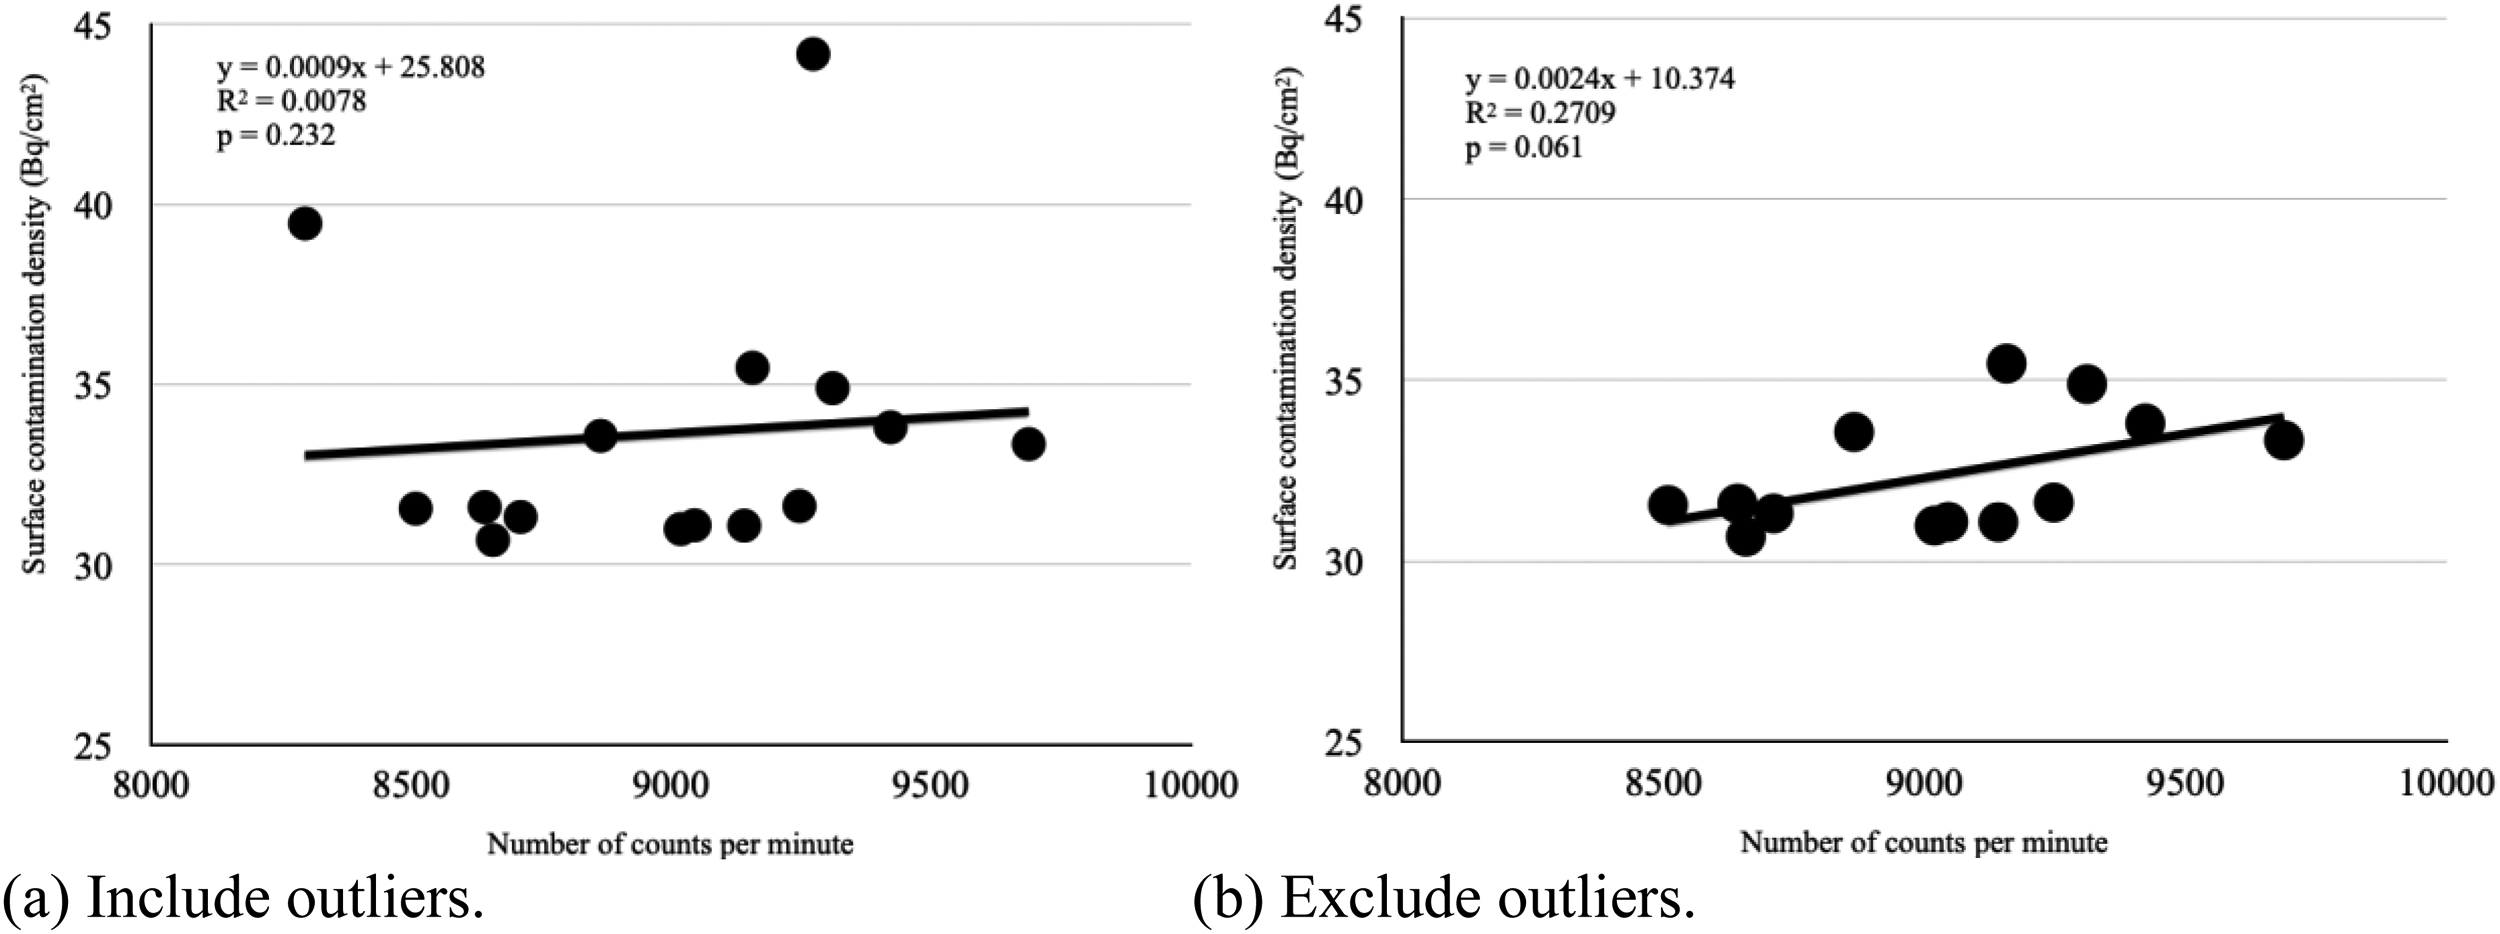
Relationship between measured counting rate and true contamination density before and after extraction of two outliers at 498 Bq/mL.
At 249 Bq mL−1, Fig. 6(a) shows the relationship between the measured count rate and true contamination density when outliers were included, and Fig. 6(b) shows this relationship when outliers were removed. The p-value was 0.157 when outliers were included and <0.001 when they were removed (a significant difference).
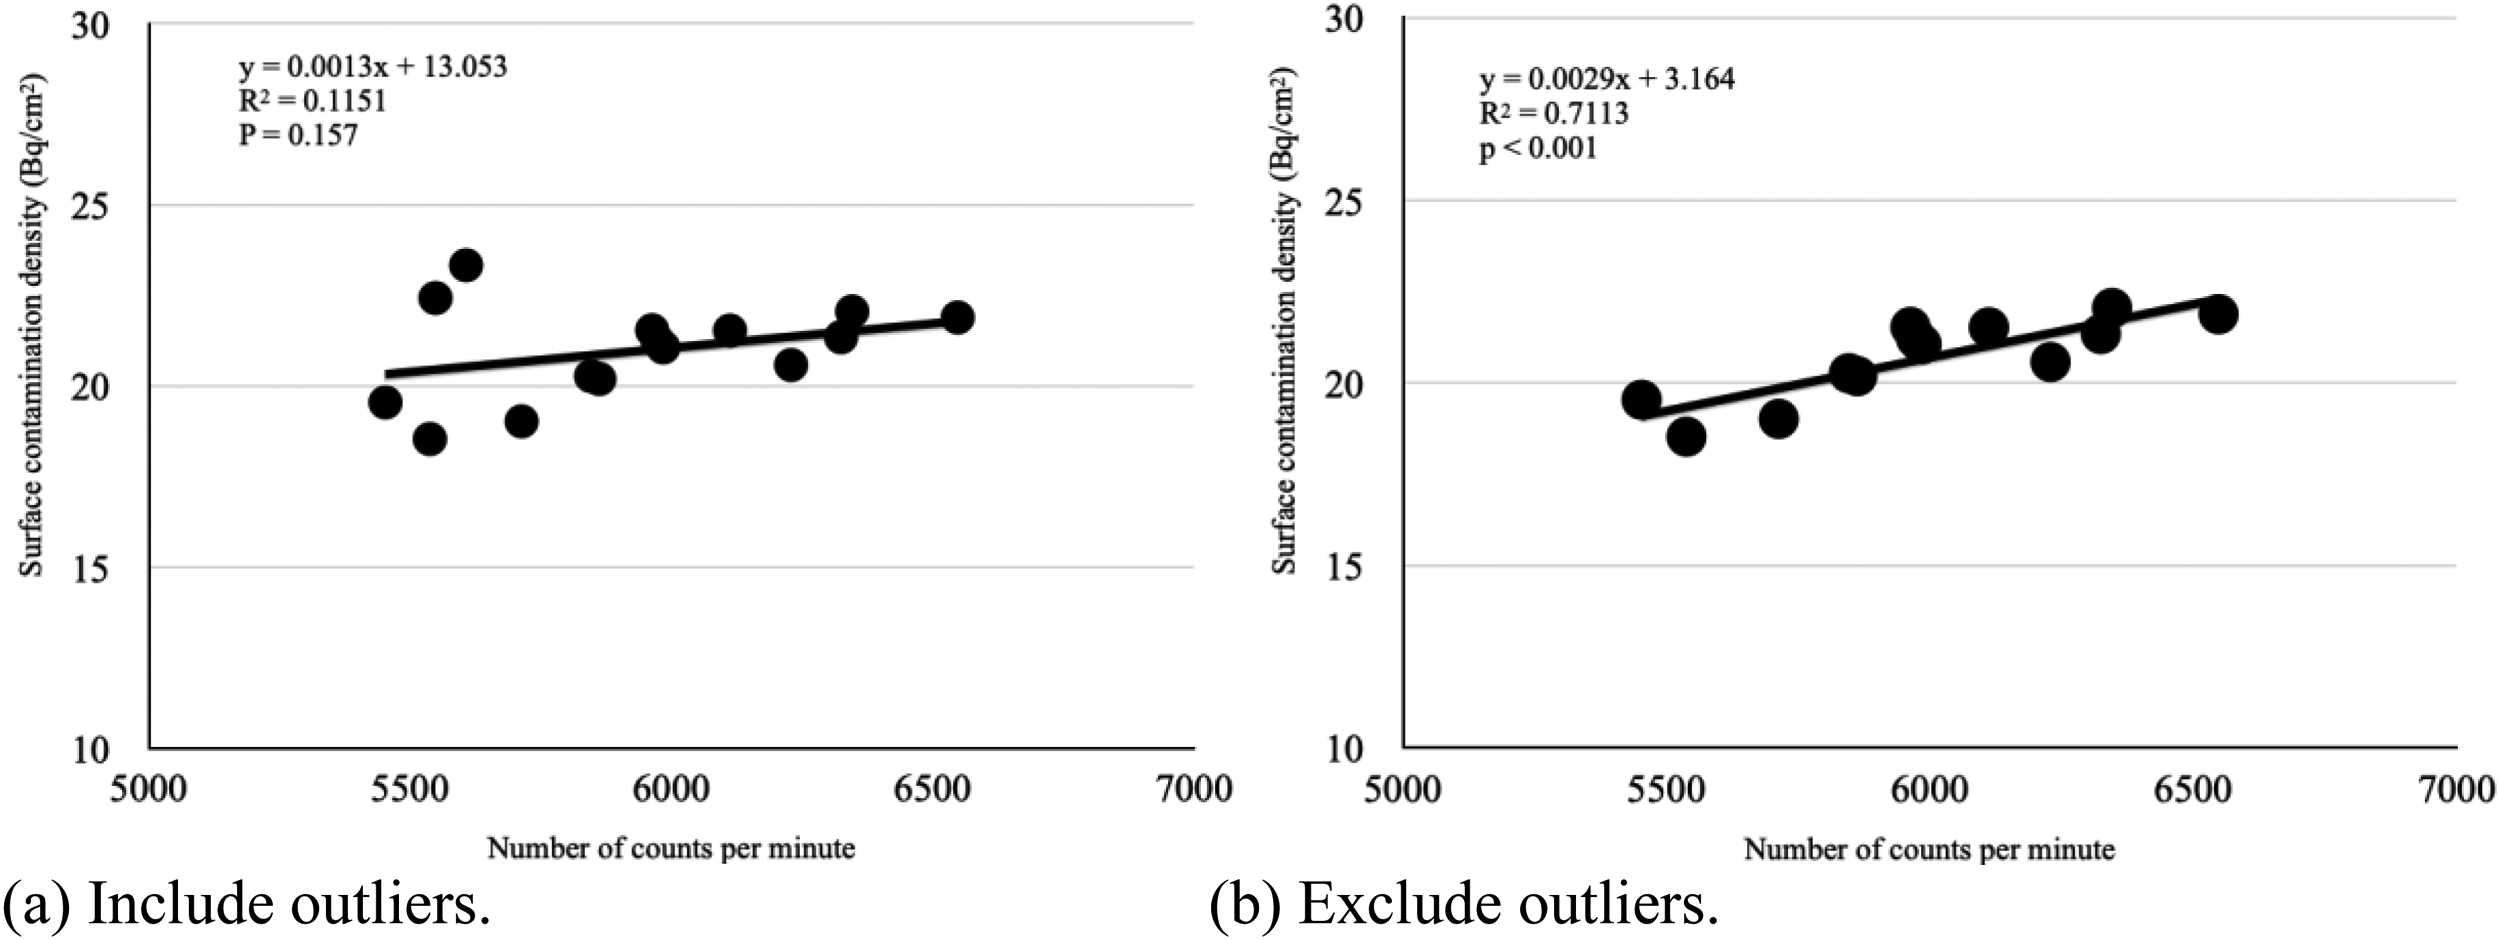
Relationship between measured counting rate and true contamination density before and after extraction of two outliers at 249 Bq/mL.
Japanese Industrial Standards Z4329:2004, which incorporates modified technical contents based on International Electrotechnical Commission 60325 (IEC, 2002), states that the RT should be less than the manufacturer's nominal value. The GM survey metres used in this study had an RT of 250 μs as a manufacturer's nominal value. The RT of GM survey metres in this study could not clear the Japanese Industrial Standards value. GM survey metres that measure RT are not widely used because of the lack of 90Sr sources compatible with the two-source method and various problems related to radiation source management. For this reason, inspection and calibration of the RT are not regularly performed. This is one reason why the GM survey metre in this study could not maintain an RT of ≤250 μs. Our study suggests that avoidance of GM survey metres with inappropriate RTs can improve the quality of the surface contamination inspection.
Our data show that GM survey metres with relatively shorter RTs are required for high-density contamination. We considered that taking the RT into account and converting it to the surface contamination density can discriminate GM survey metres that are unable to accurately measure the contamination level. When R2 is assumed to be 0.5, the correlation coefficient (r) is approximately 0.7. Because of the strong correlation when the r is ≥0.7, we observed the RT of GM survey metres with R2 of <0.5 from Fig. 3. Our data showed that a qualitative contamination test can be performed using a GM survey metre with an RT of <2000 μs at low contamination densities from Fig. 3. Furthermore, for highly contaminated areas, the RT should ideally be ≤700 μs. Quantitative contamination testing can be performed using a GM survey metre with an RT of <600 μs at high contamination densities. For sites with low contamination density, an RT of ≤1000 µs is desirable. Table 1 summarized the RT values for each surface contamination density. Considering the above, the RT obtained from this research was useful in identifying a realistically acceptable GM survey metre for actual contamination inspections during evacuation. Limitations of this study include the performance of measurements using only one manufacturer's GM survey metre and the lack of evaluation when other companies’ GM survey metres were also included.
Resolving times for qualitative and quantitative evaluations of surface contamination density.
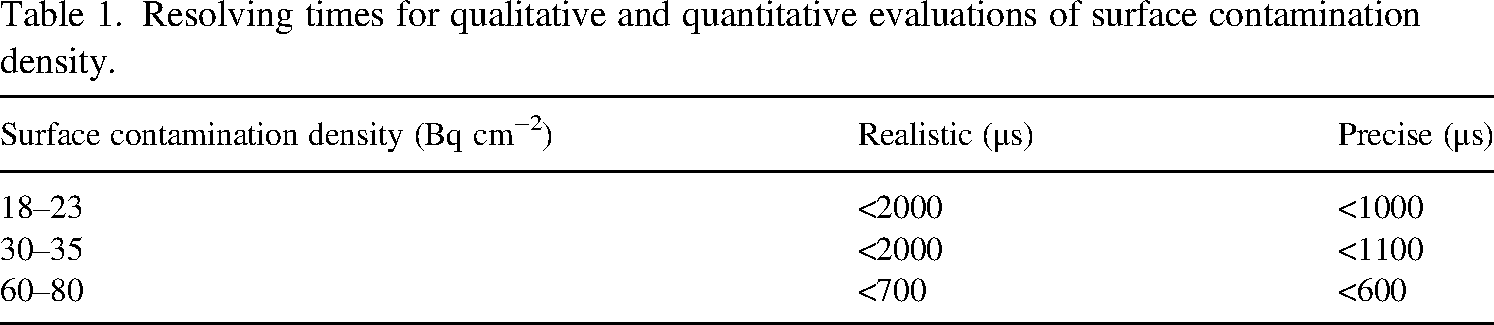
Resolving times for qualitative and quantitative evaluations of surface contamination density.
The correlation between the count rate and surface contamination density would improve if GM survey metres with inappropriate RTs could be excluded. To ensure more accurate and practical contamination examination, it is necessary to pay attention to the RT of the GM survey metre. Measurement of the RT of the GM survey metre is required to maintain the accuracy and practicality of contamination inspections during evacuation.
Footnotes
CONFLICTS OF INTEREST
The authors declare that they have no known competing financial interests or personal relationships that could have appeared to influence the work reported in this paper.
FUNDING
This research did not receive any specific grant from funding agencies in the public, commercial, or not-for-profit sectors.