
Abstract
We document in this study that lack of soft information as a result of longer distance between the firm and rating agency headquarters leads to higher errors in bond ratings, reflected by Type I and Type II errors for missed defaults and false warnings, respectively. Our results show that for each 100 km in terms of the distance between a firm’s and the rating agency headquarters, the likelihood of missed defaults (Type I error) increases by 4.9% and false warnings (Type II error) increases by 2.1%. In addition, our analyses show that the downgrades are less timely for firms that are further away from the rating agency headquarters. The results also show that missed defaults are especially higher, and timeliness of downgrades is lower for firms with higher complexity, lower analyst following, and lower accessibility to the rating agency headquarters. Although analysts adjust their ratings lower when soft information is lacking as a result of longer distance, their adjustments do not fully compensate for the lack of soft information.
Introduction
Credit ratings play an important role in stock pricing, firm valuation, contracts, and regulations (e.g., Beaver, Shakespeare, & Soliman, 2006). The accuracy of credit ratings also affects the reputation of rating agencies (e.g., Strausz, 2005; White, 2002). Moreover, the major rating agencies (S&P, Moody’s, and Fitch) report that they use both hard and soft information in their bond rating decisions. In this study, we examine whether geographic distance, a proxy for soft information, improves the accuracy of bond ratings and enables bond analysts to predict bond defaults on a timely basis.
The role of soft information, proxied by geographic proximity, has been examined in the literature in different areas such as investments, regulatory monitoring, and accuracy of analyst forecasts. The results of these studies show that geographic proximity plays an important role in the decision-making process. Kang and Stulz (1997) and Huberman (2001) document that investors invest more in firms that are close to their home because they have better information about these firms (also see Coval & Moskowitz, 1999). These findings support the “home bias” hypothesis. Kedia and Rajgopal (2011) provide evidence on the monitoring effectiveness by the regulating agencies as a result of geographic proximity. They document that firms located in counties closer to the Securities and Exchange Commission (SEC) are associated with significantly lower misreporting deviations. Malloy (2005) emphasizes the informational advantage of geographic proximity in developing analyst forecasts and reports that geographic proximity enables analysts to achieve more accurate earnings forecasts.
The major credit rating agencies (CRAs), that is, Moody’s, Standard and Poor’s (S&P), and Fitch, have stated that they use quantitative as well as qualitative information in their bond rating decision process. 1 S&P states that the credit analysts are likely to “weigh qualitative information” more than the model-driven credit ratings, which are based solely on the evaluation of financial information (Standard & Poor’s, 2010). Fitch rating agency emphasizes that qualitative information is responsible in “roughly equal measure” for the changes in credit ratings (Fitch Ratings, 2007). Consistent with the CRAs’ statements, we hypothesize that geographic proximity, which enables the bond analysts to obtain soft information that otherwise may not be available to them, helps them to achieve more accurate ratings. Our hypothesis is supported by the arguments that the usefulness, timeliness, and quality of soft information as a result of geographic proximity will enable the bond analysts to improve the accuracy of their forecasts.
The usefulness, timeliness, and quality of soft information can be facilitated by geographic proximity through several ways. The geographic proximity can allow analysts to establish common professional, social, and cultural contacts with local firms (Uysal, Kedia, & Panchapagesan, 2008). Proximity also relaxes time and distance constraints for visiting the firm’s offices, enabling the bond analysts to have face-to-face meetings through house calls rather than relying on conference calls (e.g., Malloy, 2005). It is also well documented in the literature that soft information obtained from the face-to-face meetings is considered to be of higher quality compared with that obtained from conference calls or surveys (e.g., Alge, Wiethoff, & Klein, 2003; Baltes, Dickson, Sherman, Bauer, & LaGanke, 2002; Graetz, Boyle, Kimble, Thompson, & Garloch, 1998). Finally, Miller and Shanthikumar (2010) find that regional newspapers cover nearby firms more often and with longer articles than national newspapers. Rating analysts could develop a better understanding of local firms through better access to local news. Given that the headquarters of all CRAs covered in this study are located in New York City (NYC), 2 our hypothesis implies that the rating errors are expected to be higher for the firms that are located away from NYC compared with the firms with headquarters in NYC or close to NYC.
Second, we evaluate whether firm complexity has an impact on the positive association between rating errors and geographic distance. With regard to firm complexity, we argue that the availability of soft information becomes more useful in enhancing the rating accuracy of complex firms because it enables the bond analysts to have a better understanding of the complicated business models and intricate business operations of complex firms (e.g., Churchill & Lewis, 1983; Scherer, 1965). In other words, for complex firms that are more difficult to rate, we expect the incremental value of soft information to increase.
Third, we examine whether analysts’ coverage has an impact on the association between ratings errors and geographic distance. It is argued in the literature that firms with more analyst coverage have lower information asymmetry and higher visibility (Frankel & Li, 2004; Uysal et al., 2008). Cheng and Subramanyam (2008) argue that a higher coverage of firms by security analysts provides more effective monitoring of managerial behavior and actions, which results in lower information asymmetry. Based on this evidence, we argue that a higher coverage of firms by security analysts will reduce information asymmetry, which will in turn reduce the importance of soft information for bond ratings. However, lower analyst following will enhance the need for soft information to compensate for lower firm visibility and higher information asymmetry. These arguments lead us to hypothesize that the positive association between geographic distance and rating errors is stronger for firms with low analyst following.
We use U.S. firms that were rated by Moody’s, S&P, and Fitch from 1992 through 2010. We evaluate the rating accuracy of bonds and the timeliness of downgrades 3 prior to the default of bonds. The rating accuracy is defined in terms of missed defaults, measured by Type I error, and false warnings, measured by Type II error. Our findings show that there is a significantly positive association between the rating errors and geographic distance, indicating that the rating errors increase as distance between NYC and location of firm headquarters increases. The likelihood of missed defaults (Type I error) increases by 4.9% and the likelihood of false warnings (Type II error) increases by 2.1% for every 100 km the firm is located away from NYC. The results also show that the timeliness of downgrades improves with lower geographic distance.
With regard to firm complexity, the findings show that missed defaults are significantly higher for complex firms that have offices away from NYC, and the timeliness of downgrades is also weaker for such firms. The results of analyst coverage similarly show that the positive association of geographic distance with missed defaults is weaker for firms with higher analyst coverage, suggesting that high analyst coverage moderates the positive association between the rating errors and geographic distance. The timeliness of downgrades is also better for firms with higher analyst coverage. However, we find no incremental impact of analyst coverage or firm complexity on false warnings.
We also evaluate how the rating analysts react to firms with lower availability of soft information. Will analysts rate the bonds optimistically because that may be more beneficial to the firm and to them, especially when their contracts are tied to the credit ratings (e.g., Kraft, 2014)? Our findings show that analysts rate the bonds lower when geographic distance is greater. We interpret this finding to suggest that analysts protect themselves and their agencies against any potential risk associated with higher ratings, and thus they assign lower ratings to the firms located farther away from NYC (e.g., see Goel & Thakor, 2011, for theoretical arguments). 4 Our analyses, however, also indicate that the lower ratings given to these firms do not result in less missed defaults (Type I error) or an improvement in the timeliness of downgrades. Thus, this finding suggests that lower ratings do not fully compensate for missing soft information.
Our findings have important implications for market participants in the US$8.1 trillion U.S. corporate bond market, 5 and they make the following contributions to the literature. The findings add to the literature on the importance of soft information for evaluation of risk associated with credit ratings (e.g., Butler & Cornaggia, 2012; Kraft, 2014, 2015), and also to the existing literature that emphasizes the role of credit ratings in evaluating bond risk (Grier & Katz, 1976; Hand, Holthausen, & Leftwich, 1992; Hite & Warga, 1997). Our findings document that geographic proximity is an important determinant of credit rating accuracy. This finding supplements the existing literature on the role played by proximity in the monitoring decision process (e.g., Kedia & Rajgopal, 2011). In addition, our findings provide support to the CRAs’ views that soft information is important for rating decisions.
The article is organized as follows: Section “Introduction” includes introduction, and in Section “Hypothesis Development,” we develop the hypotheses. Data and methodologies are discussed in Section “Data and Method,” and the results are included in Section “Results.” Section “Conclusion” presents summary and conclusion.
Hypothesis Development
Association Between Rating Errors/Timeliness and Geographic Distance
It is well documented in the literature that geographic proximity plays an important role in providing soft information that helps in the decision-making process (e.g., Butler, 2008; Coval & Moskowitz, 2001; Stotz, 2011; Uysal et al., 2008). Consistent with the home bias argument, it is documented that investors invest more in firms that are closer to their home because they have better information about these firms (e.g., Coval & Moskowitz, 1999). Findings by Kedia and Rajgopal (2011) indicate that as a result of better monitoring potential of the SEC, there are lower misreporting deviations by firms located in counties closer to the SEC. Malloy (2005) reports that the security analysts achieve higher accuracy in their earnings forecasts when the firms are closer in proximity to their offices.
The existing empirical evidence thus supports the argument that geographic location provides an important input to the decision-making process. We empirically test whether the availability of soft information as proxied by geographic proximity also enables the bond analysts to make better rating decisions. 6 We hypothesize that proximity of firm location to the rating analysts’ headquarters will provide an opportunity to the rating analysts to obtain soft information that will enable them to achieve higher accuracy in their bond ratings and also provide more timely downgrades.
Soft information can be obtained in several ways. First, we argue that proximity of a firm’s headquarters to the CRA headquarters provides an opportunity to the bond rating analysts to establish professional, social, and cultural contacts that enable them to obtain soft information. Second, it is argued that geographic proximity relaxes time and distance constraints for visiting the firm’s offices, which enables the bond analysts to have face-to-face meetings and obtain information that is otherwise difficult to codify and transmit. Relaxation in time and distance constraints also makes it easier for the rating analysts to make house calls when soft information is needed instead of waiting for conference calls (e.g., Malloy, 2005). Thus, geographic proximity enables the credit rating analysts to obtain information on a timely basis. Third, it is argued that information obtained from the face-to-face meetings is generally of higher quality compared with that obtained from conference calls or surveys (e.g., Alge et al., 2003; Baltes et al., 2002; Graetz et al., 1998). The higher quality of information obtained through face-to-face meetings is more useful for the rating decisions. For example, Mehrabian (1972) reports that as much as 93% of information communicated through non-verbal channels is useful. 7 Finally, Miller and Shanthikumar (2010) find that regional newspapers cover nearby firms more often and with longer articles than national newspapers. Proximity could facilitate a better understanding of local firms through better access to local news.
We empirically test the expectation that geographic proximity enables the credit rating analysts to obtain soft information and achieve higher accuracy of their ratings and provide downgrades on a timely basis on the following hypothesis:
Impact of Firm Complexity on the Association Between Rating Errors/Timeliness and Geographic Distance
Next, we examine whether a firm’s complexity has an impact on the association between geographic proximity and credit rating accuracy 8 and timeliness of downgrades. We use product lines as a proxy for firm complexity. It is argued that firms with less product lines are less complex, have simpler business models, and their operations are generally straightforward (e.g., Bushman, Chen, Engel, & Smith, 2004). Thus, it is easier for credit analysts to analyze less complex firms. However, firms with more products develop a corporate structure that increases the firm’s complexity, which would require more coordination among product divisions. Moreover, addition of more product lines will make the firms more diverse and require more detailed analyses and comprehensive information, which will make it difficult for analysts to make decisions on bond ratings. Thus, highly complex firms will require extra effort for information collection, and availability of soft information is expected to play an important role in developing accurate credit ratings.
The above discussion suggests that as a result of firm complexity, lack of information for firms that are located far away from NYC becomes more aggravated. In other words, the need for soft information becomes more important for rating analysts to develop accurate ratings. We hypothesize that business complexity will increase the rating errors of firms that are located far away from NYC. Similarly, the timeliness of downgrades will be adversely affected for these firms. We develop the following hypothesis to test the impact of firm complexity.
Impact of Analyst Coverage on the Association Between Rating Errors/Timeliness and Geographic Distance
The extant literature on analysts’ earnings forecasts suggests that coverage of a firm by a higher number of security analysts reduces information asymmetry and enhances firm visibility (e.g., Frankel & Li, 2004; Uysal et al., 2008). The existing literature also documents that lower information asymmetry in turn has an impact on the firm’s accounting policies, such as disclosure of earnings guidance and earnings quality (Cheng & Subramanyam, 2008). Thus, the related question examined in this study is whether higher analyst following has an impact on the association between rating accuracy/timeliness of downgrades and geographic distance of firm headquarters.
Consistent with the argument that higher analyst following reduces information asymmetry, we argue that lower analyst following will enhance forecast errors when firms are located away from NYC. In other words, higher distance of firm headquarters from the rating agency office will result in even higher rating errors when there is greater information asymmetry as a result of low analyst following. This argument suggests that rating analysts will need more detailed and reliable information for achieving higher accuracy when the firm has low analyst following and is located far away from the rating agency office in NYC. We test the following hypothesis:
Data and Method
Data
We use the Mergent Fixed Investment Securities Database (FISD) to obtain both bond ratings and default information from 1992 through 2010 (different steps in the data selection process are provided in Appendix A). We focus on the ratings from the three largest rating agencies, that is, Moody’s, S&P, and Fitch. To be included in the sample, the firm must be rated by at least one of these three rating agencies. If the same firm is rated by three different agencies, we treat each rating as a separate observation. It is important to note that these ratings are predictions, and therefore they are assigned ex ante, that is, before any default takes place. There is, however, another set of ratings of DDD/DD/D, which are assigned in the event of an actual default, and we use these ratings to define bond default. We cross validate this measure of default with bankruptcies indicated on the UCLA-LoPucki Bankruptcy Research Database. We also assign numerical codes from 1 through 22 to each rating expressed in alpha code (AAA through D; details on converting alpha to numerical are provided in Appendix B).
We obtain data on quarterly financial information and on firm product lines from the Compustat database; data on market values are extracted from the Center for Research in Securities Prices (CRSP), and we use the Institutional Brokers’ Estimate System (IBES) to obtain information on the number of analysts following a firm. Several observations have been dropped from the sample because market value data are not available on CRSP or Compustat for the most recent quarter prior to the respective credit rating announcements. The final sample consists of 96,271 observations.
One commonality among the three rating agencies is that they all are headquartered in NYC. Although each rating agency has many regional U.S. offices, the corporate analysts, however, have a limited presence in the regional offices. 9 Moody’s corporate analysts are especially stationed only in NYC. 10 Because all three agencies have headquarters in NYC, we define distance from the rating agency as the distance from NYC. 11 To estimate distance between cities, we use the latitude and longitude of cities available from the U.S. Census Bureau Gazetteer and use the Haversine Formula for this purpose. 12 The unit of measure calculated from the Haversine Formula is in kilometers, which we scale by 100 for ease of exposition.
Method
Rating accuracy and timeliness
Consistent with Cheng and Neamtiu (2009), we measure the rating accuracy in terms of two rating errors, that is, the rating error for missing defaults (Type I error) and the rating error for false warnings (Type II error). 13 We use the investment grade boundary and a 2-year time horizon to define Type I and Type II errors. If a firm has a rating of investment grade or higher and it defaults within 2 years of the rating date, we consider it as a Type I error. 14 In other words, if an analyst rates the bond as investment grade and it defaults within 2 years after the rating was assigned, it is considered as a Type I error, that is, missing a default. However, if the bond is rated below the investment grade (which is considered as speculative grade and is likely to default), but the firm does not default within 2 years, it will be considered as a Type II rating error. In other words, the rating analyst is considered to have provided a false warning for default potential. We do not consider the ratings below the investment grade level because Moody’s ratings will typically factor in an “expected recovery,” 15 which reflects a predicted probability of how much principal may be ultimately paid to the bondholders in the event of default.
The timeliness of downgrades is defined by the number of days between the downgrade date and the default date for each bond issue. The event window for downgrades is limited to a 2-year period prior to default to gauge the timeliness of downgrades for possible future default. 16 For instance, if a bond is downgraded 100 days prior to default, that particular downgrade would be assigned a value of 100.
Logistic regression models to evaluate rating accuracy
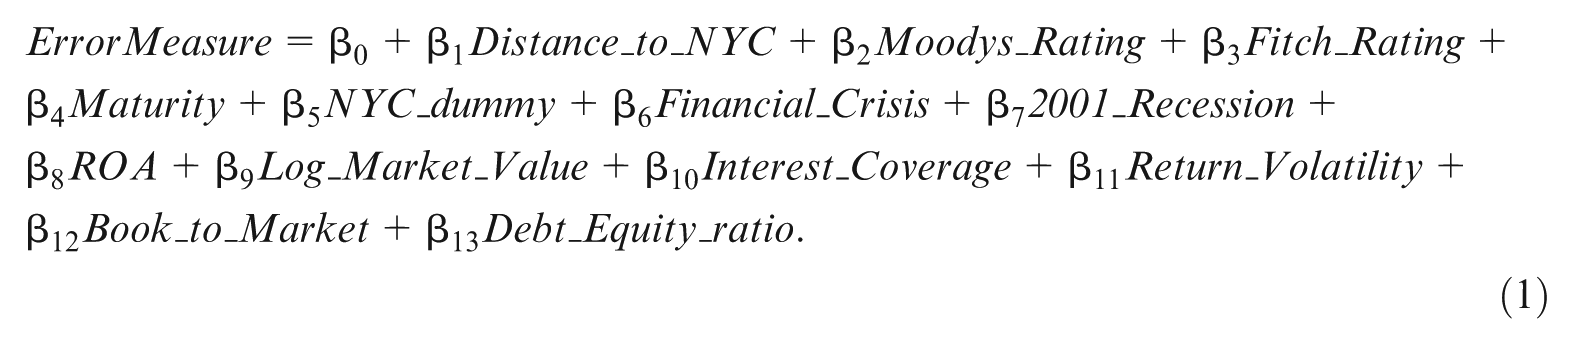
We use a logistic model to test the effect of geographic proximity on the error measures, that is, Type I and Type II errors. Because each firm may have multiple bond ratings that are tracked through time, the use of a normal logistic model will incorrectly underestimate the standard error of regressors. To correct the underestimation problem, we use a logistic regression clustered by both a firm ID (GVKEY) and time (fiscal quarter). Petersen (2009), Thompson (2011), and Cameron, Gelbach, and Miller (2011) argue that the approach that clusters along the dimensions of firm and time corrects for correlations among different firms in the same year and different years in the same firm. The logistic model clustered by GVKEY and fiscal quarter is as follows:
We provide description of variables used in the analyses in Table 1.
Variable Measurement.

Note. NYC = New York City; ROA = return on assets; LT = long term; CRSP = Center for Research in Securities Prices; RMSE = root mean square error; CAPM = capital asset pricing model.
The dependent variable “ErrorMeasure” can be a Type I or Type II error, and we conduct separate tests on these two measures. A bond that has the rating of an “investment grade” and defaults within 2 years, it is considered to be rated incorrectly and in this case, the Type I error is coded as “1,” otherwise “0.” The Type II error is coded as “1” if a bond receives a speculative grade rating and does not default within 2 years, and it is coded as “0” otherwise.
Ordinary least squares (OLS) regression model to evaluate timeliness of downgrades
We evaluate the impact of geographic location on the timeliness of downgrades by using OLS regression with Dahead as the dependent variable, defined as the number of days between the downgrade and the default date. Dahead measures the timeliness of downgrades and if the firm is downgraded several times before an eventual default, there is more than one value for downgrades, resulting in more observations. A lower Dahead value would indicate lower timeliness because bonds are downgraded closer to a default date. We use Equation 1 with the dependent variable of Dahead instead of ErrorMeasure.
Test and control variables
The test variable of distance to NYC is measured by the number of kilometers that a company’s headquarters is away from NYC. We also include dummy variables for Moody’s and Fitch ratings and also for NYC firms. To control for exogenous shocks that may have an impact on rating accuracy, we include dummy variables for the 2001 recession and the financial crisis. We also include other control variables, which may affect the timeliness and accuracy of ratings (Cheng & Neamtiu, 2009). In addition, we control for return on assets (Compustat Quarterly data68 / date44), interest coverage (Compustat Quarterly data8 / data22), debt to equity ratio (Compustat Quarterly data51 / data59), volatility of returns (lagged quarterly standard deviation of daily returns calculated from the CRSP daily stock file), and the book-to-market ratio (Compustat Quarterly data59 / (data12 × data61)). Because the degree to which a rating agency monitors a bond issue influences the accuracy of its rating, we control for the characteristics that may influence the monitoring activity and also have an impact on the error measure. We use the maturity of the bond issue and log of market value (Compustat Quarterly data12 × data61) as additional control variables.
We winsorize all variables at the 1st and 99th percentiles to mitigate the outlier effect, except for the variable of distance, variables with logarithmic values, and dummy variables.
Results
Descriptive Statistics
Descriptive Statistics are provided in Table 2. The average distance of firms from NYC is 1,322 km. 17 Type I rating errors occur for 0.8% of the entire sample, whereas Type II rating errors are 29.6% of the sample. The average number of days between downgrades and defaults during a 2-year window prior to default is 199 days.
Descriptive Statistics.
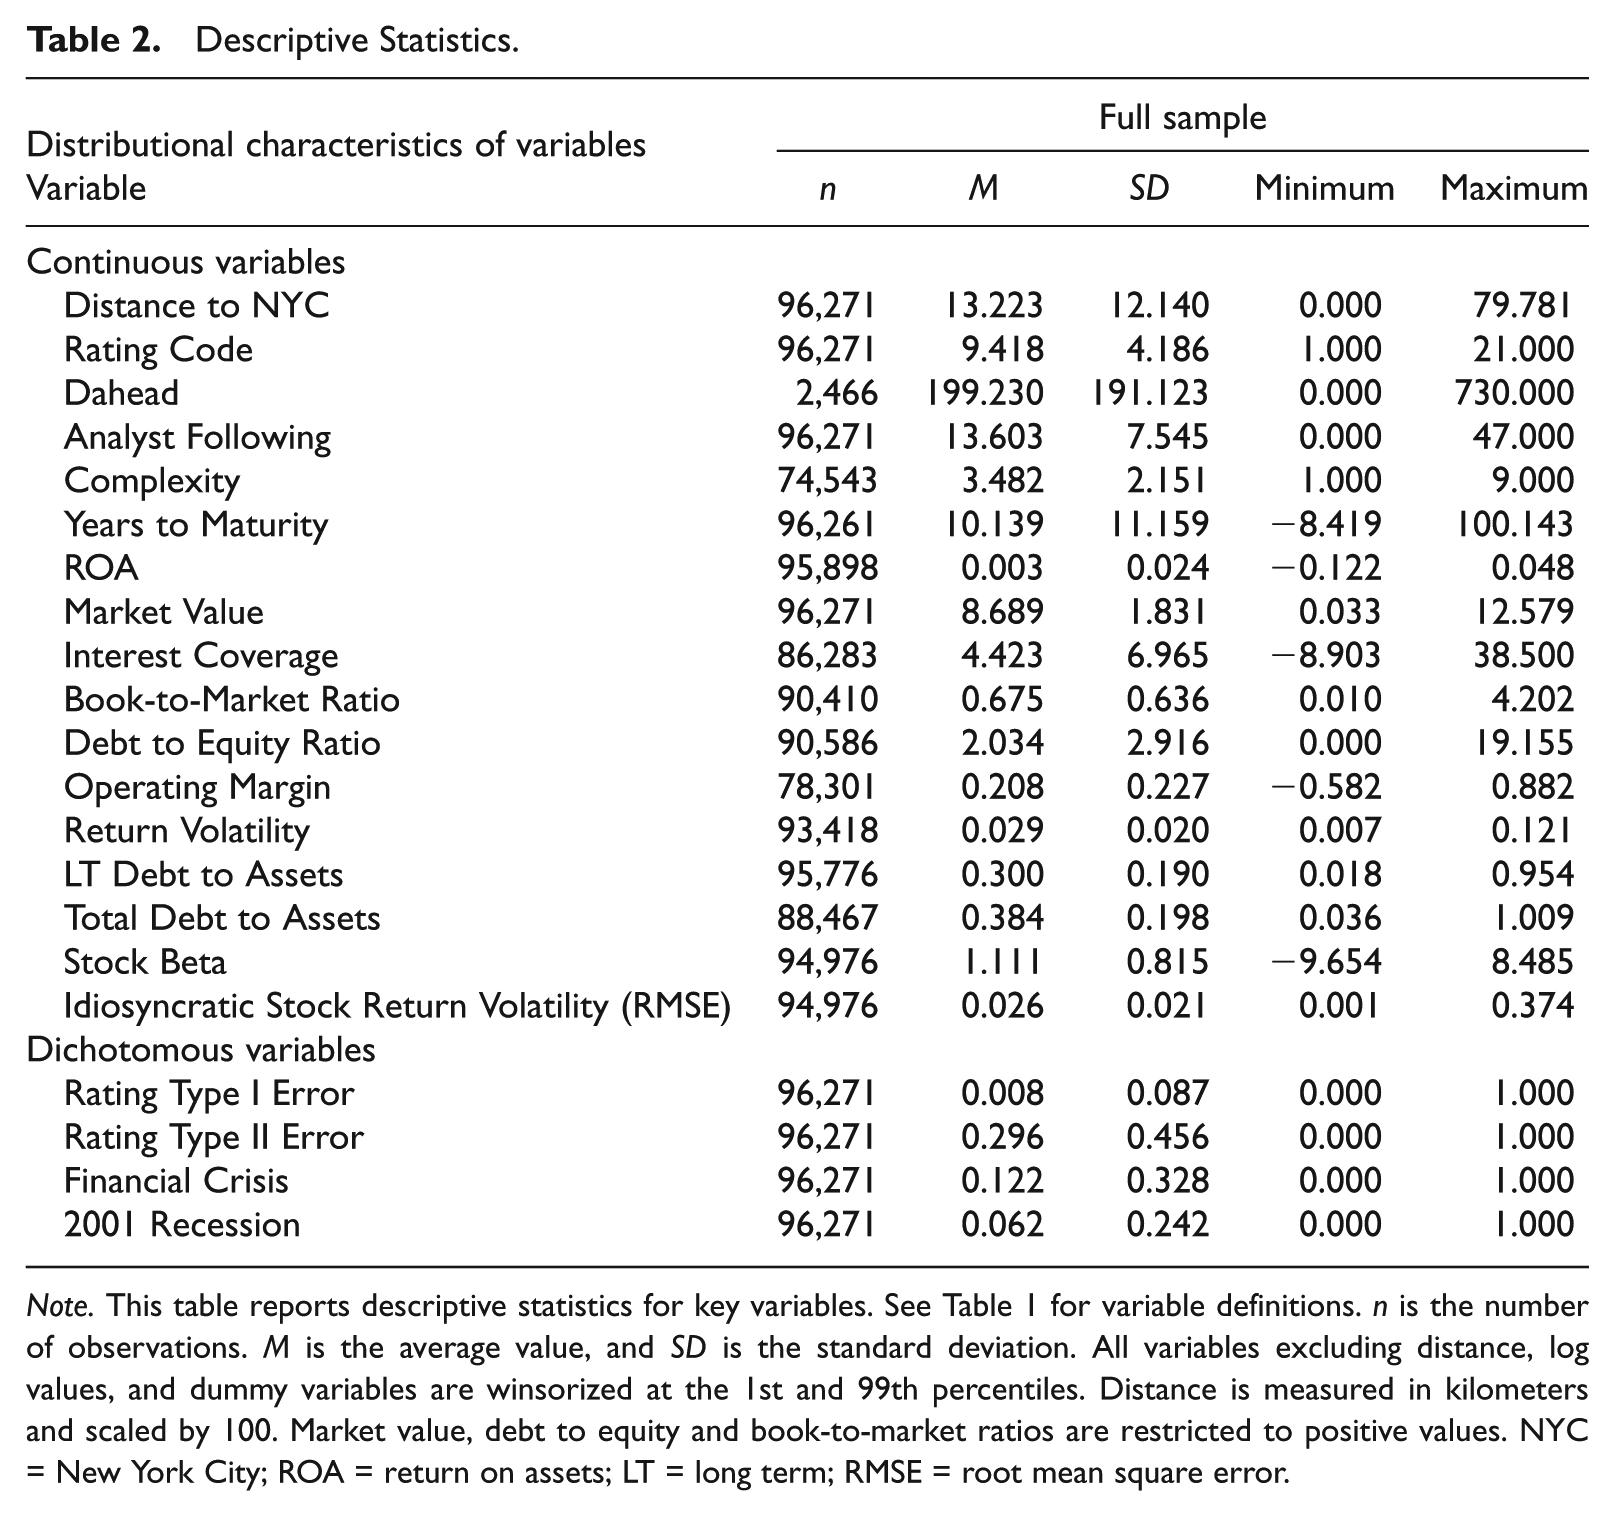
Note. This table reports descriptive statistics for key variables. See Table 1 for variable definitions. n is the number of observations. M is the average value, and SD is the standard deviation. All variables excluding distance, log values, and dummy variables are winsorized at the 1st and 99th percentiles. Distance is measured in kilometers and scaled by 100. Market value, debt to equity and book-to-market ratios are restricted to positive values. NYC = New York City; ROA = return on assets; LT = long term; RMSE = root mean square error.
Regression Results
Results on the association between distance and rating errors
Test results on missing defaults (Type I error)
We first examine the rating errors for missed defaults by conducting logistic regression tests with Type I error as the dependent variable. As mentioned earlier, if a bond rating is investment grade and the firm defaults within 2 years, the ErrorMeasure is coded as 1, otherwise 0. The results are presented in Table 3. 18
Logistic Regression Results on the Association Between Geographic Distance and Type I Rating Errors.
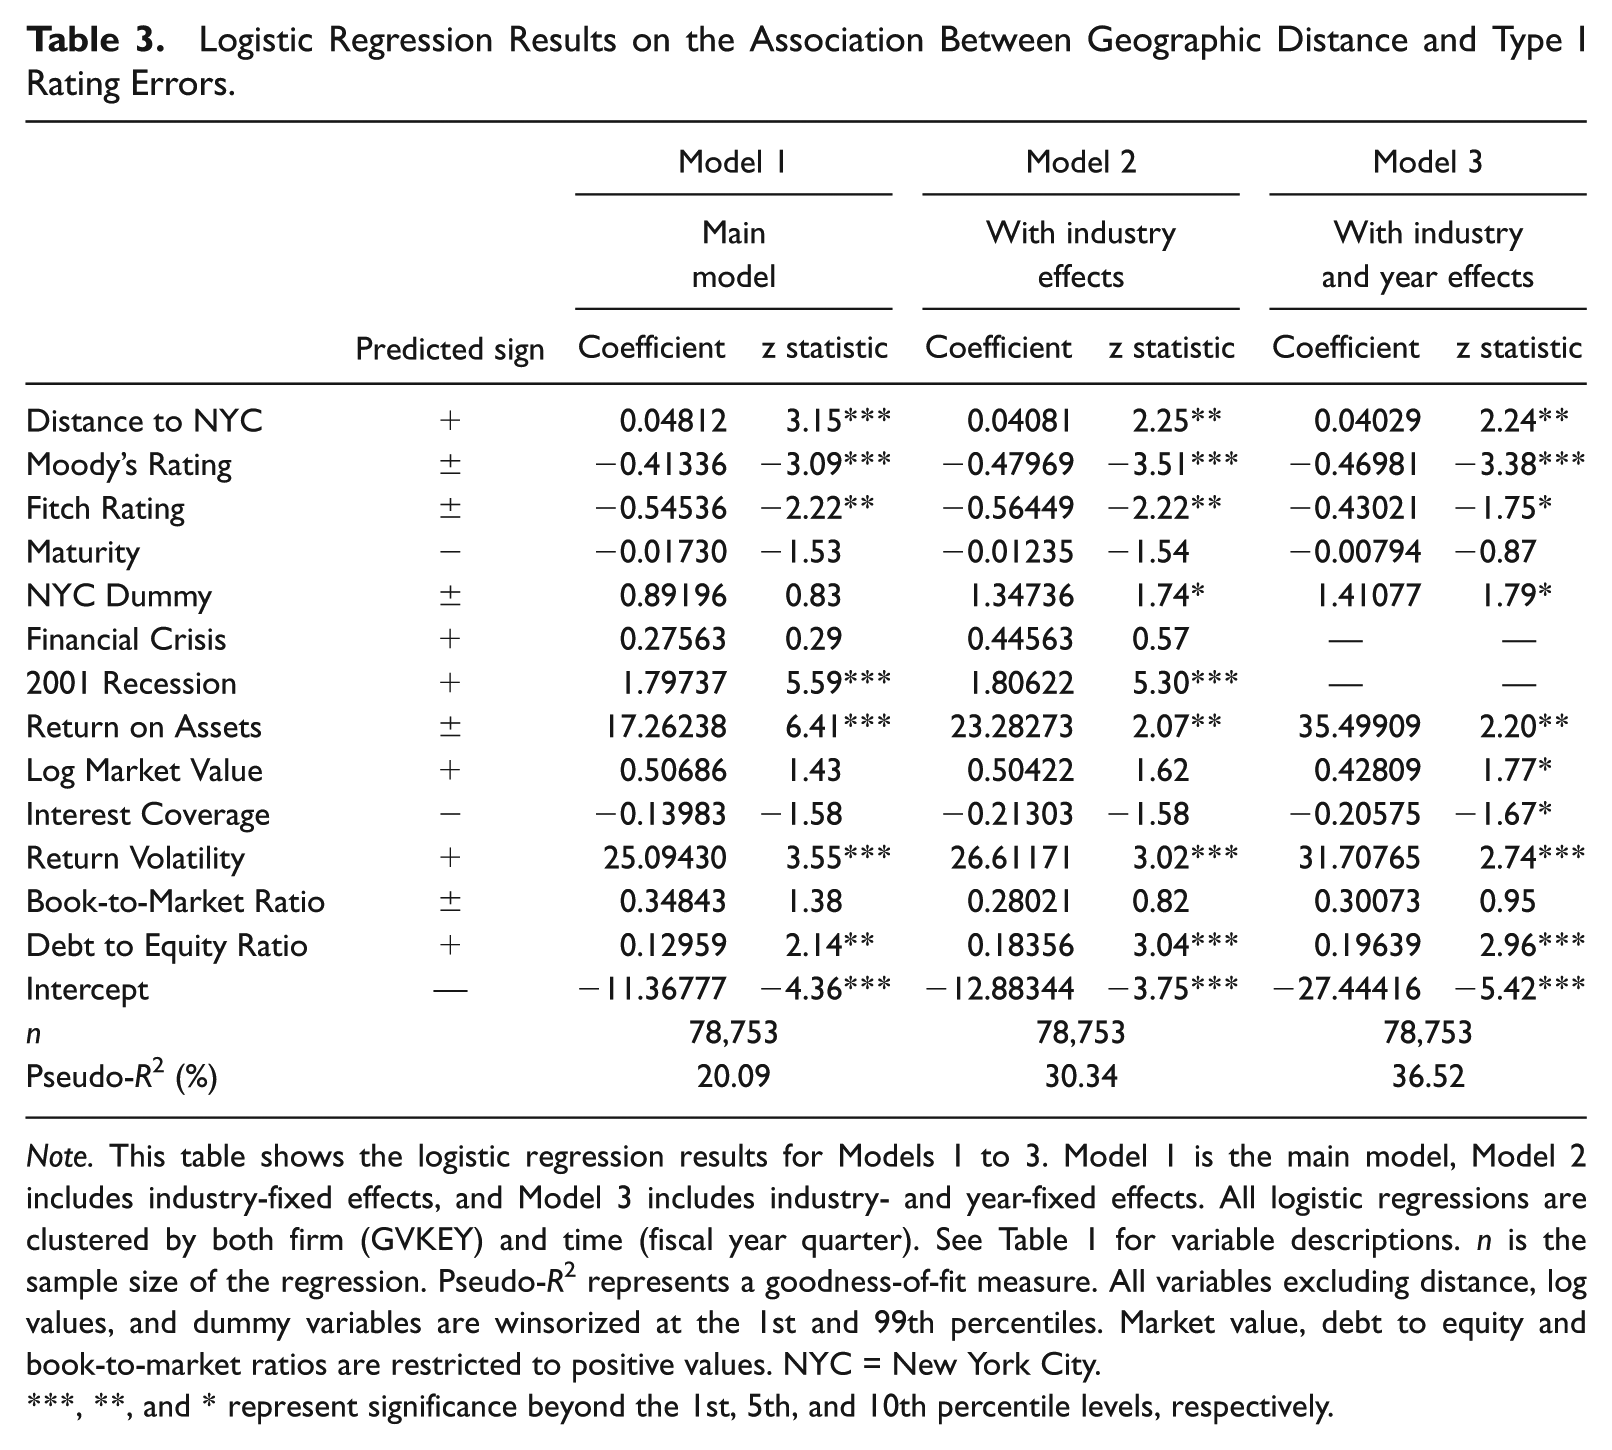
Note. This table shows the logistic regression results for Models 1 to 3. Model 1 is the main model, Model 2 includes industry-fixed effects, and Model 3 includes industry- and year-fixed effects. All logistic regressions are clustered by both firm (GVKEY) and time (fiscal year quarter). See Table 1 for variable descriptions. n is the sample size of the regression. Pseudo-R2 represents a goodness-of-fit measure. All variables excluding distance, log values, and dummy variables are winsorized at the 1st and 99th percentiles. Market value, debt to equity and book-to-market ratios are restricted to positive values. NYC = New York City.
, **, and * represent significance beyond the 1st, 5th, and 10th percentile levels, respectively.
The results for Model 1 show that the coefficient of “Distance to NYC” is positive and significant at the 1% level, indicating that as the distance between the firm headquarters and NYC increases, Type I error increases. This result suggests that the bonds rated as investment grade are more likely to default if the firm is located further away from NYC compared with the NYC firms or firms located close to NYC. More specifically, the results show that for each 100 km the firm moves away from NYC, the likelihood of Type I error increases by 4.9%. 19 The results also show that Moody’s ratings are less likely to miss defaults compared with the S&P ratings, which is indicated by the negative and significant coefficient for Moody’s. Separate F-test results (untabulated) on the coefficients show that Type I errors are significantly different between the Moody’s and S&P ratings, but there is no significant difference between the Moody’s and Fitch ratings. The results of comparatively low errors for Moody’s ratings are consistent with Livingston, Wei, and Zhou’s (2010) results, which indicate that Moody’s is more conservative relative to S&P.
Test results on false warnings (Type II error)
We conduct logistic regression with Type II error as the dependent variable to evaluate rating errors for false warnings. The rating error is coded 1 if the bond rating is speculative but the bond does not default within 2 years and 0 otherwise. The results are presented in Table 4.
Logistic Regression Results on the Association Between Geographic Distance and Type II Rating Errors.
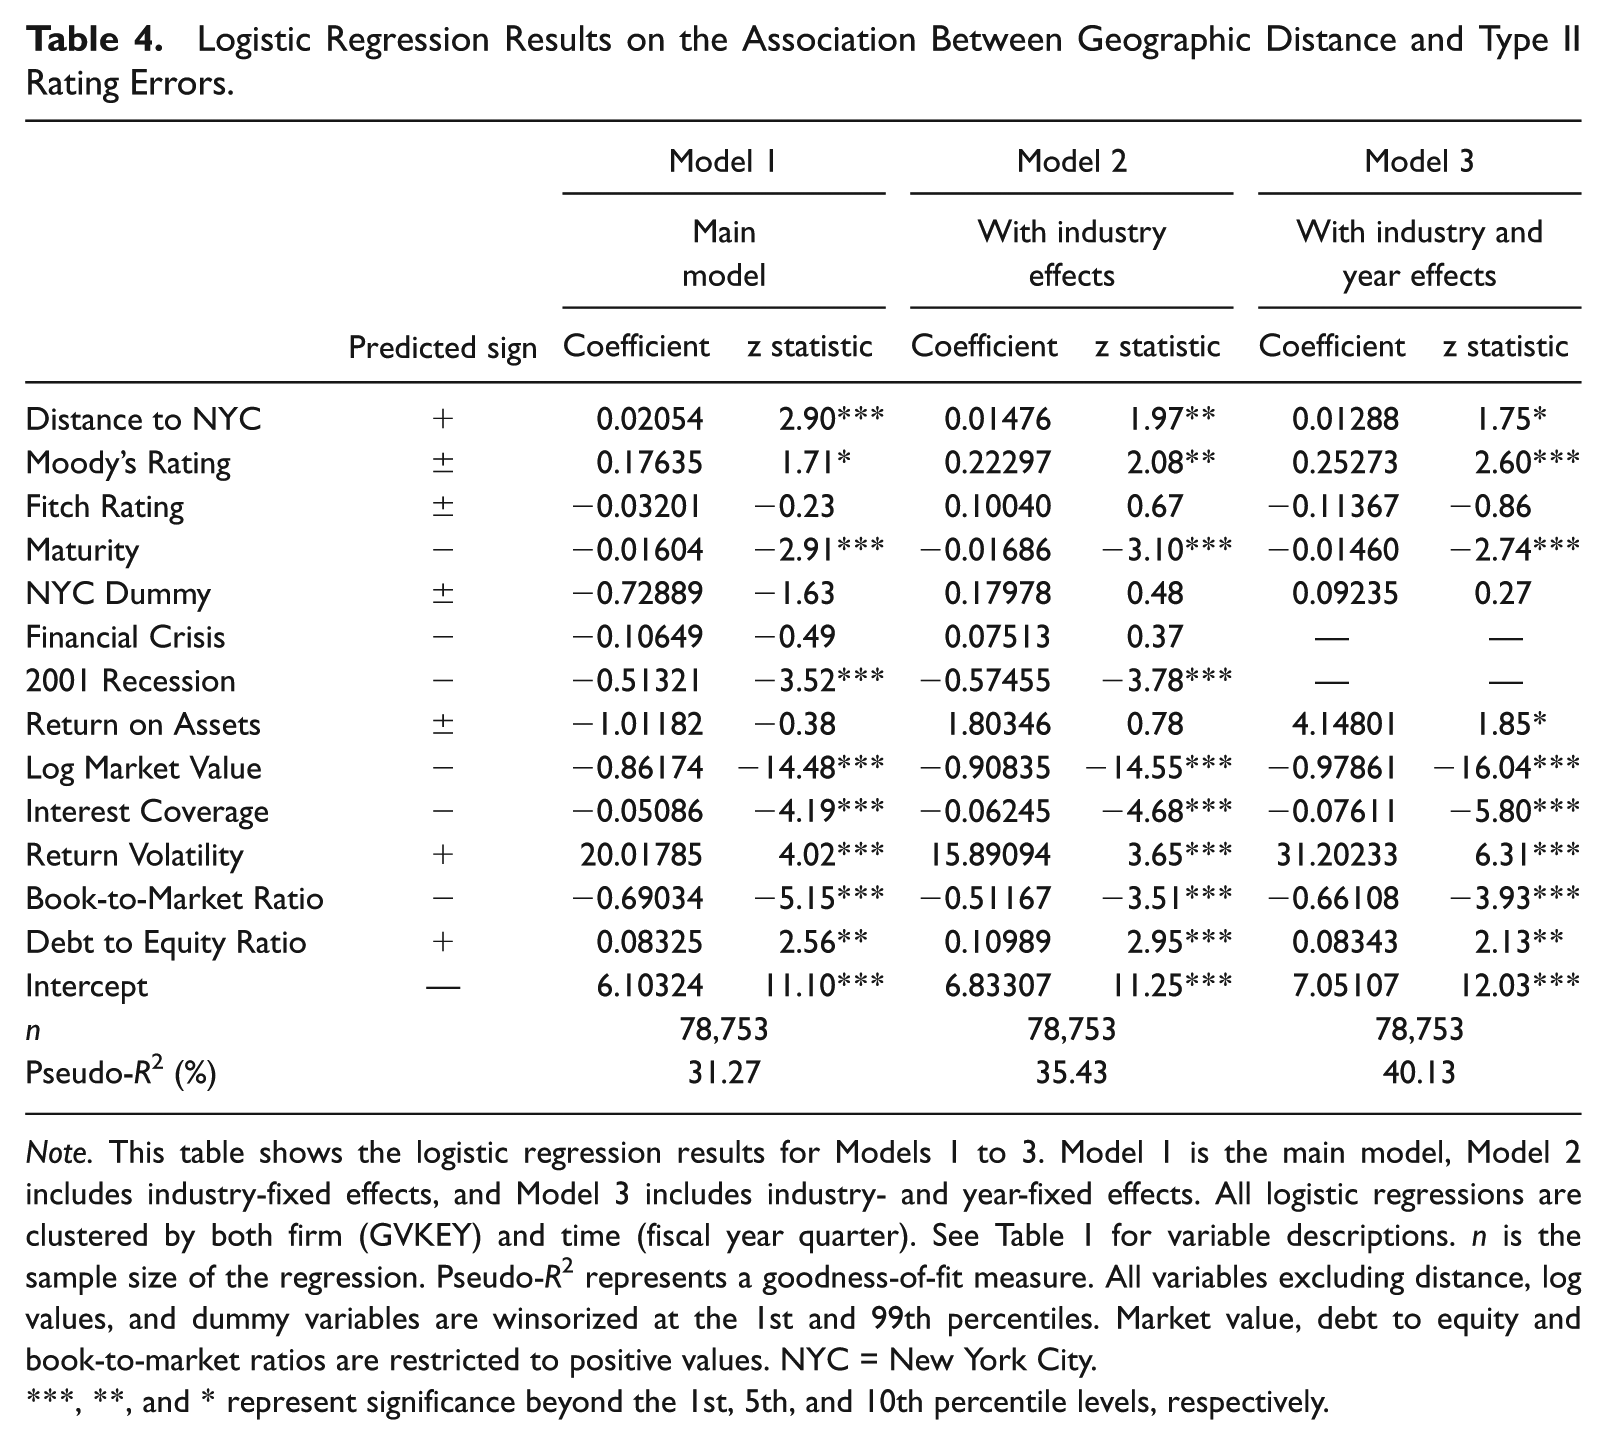
Note. This table shows the logistic regression results for Models 1 to 3. Model 1 is the main model, Model 2 includes industry-fixed effects, and Model 3 includes industry- and year-fixed effects. All logistic regressions are clustered by both firm (GVKEY) and time (fiscal year quarter). See Table 1 for variable descriptions. n is the sample size of the regression. Pseudo-R2 represents a goodness-of-fit measure. All variables excluding distance, log values, and dummy variables are winsorized at the 1st and 99th percentiles. Market value, debt to equity and book-to-market ratios are restricted to positive values. NYC = New York City.
, **, and * represent significance beyond the 1st, 5th, and 10th percentile levels, respectively.
The results for Model 1 show that the coefficient for “Distance to NYC” is positive and significant at the 1% level. This result suggests that as the distance between a firm’s headquarters and the rating agency headquarters increases, there is a higher probability of false warnings. The results specifically show that for every 100 km the firm moves away from NYC, the likelihood of false warnings increases by 2.1%. 20 This result indicates that lack of access to soft information as a result of longer distance between the headquarters of CRAs and firms leads to less accurate ratings. Thus, our results on Type I errors and Type II errors are consistent with our H1.
Test results on the timeliness of downgrades
We examine the timeliness of downgrades by conducting an OLS regression test with Dahead as the dependent variable. The results are presented in Model 1 of Table 5.
OLS Regression Results on the Association Between Geographic Distance and Timeliness of Downgrades.
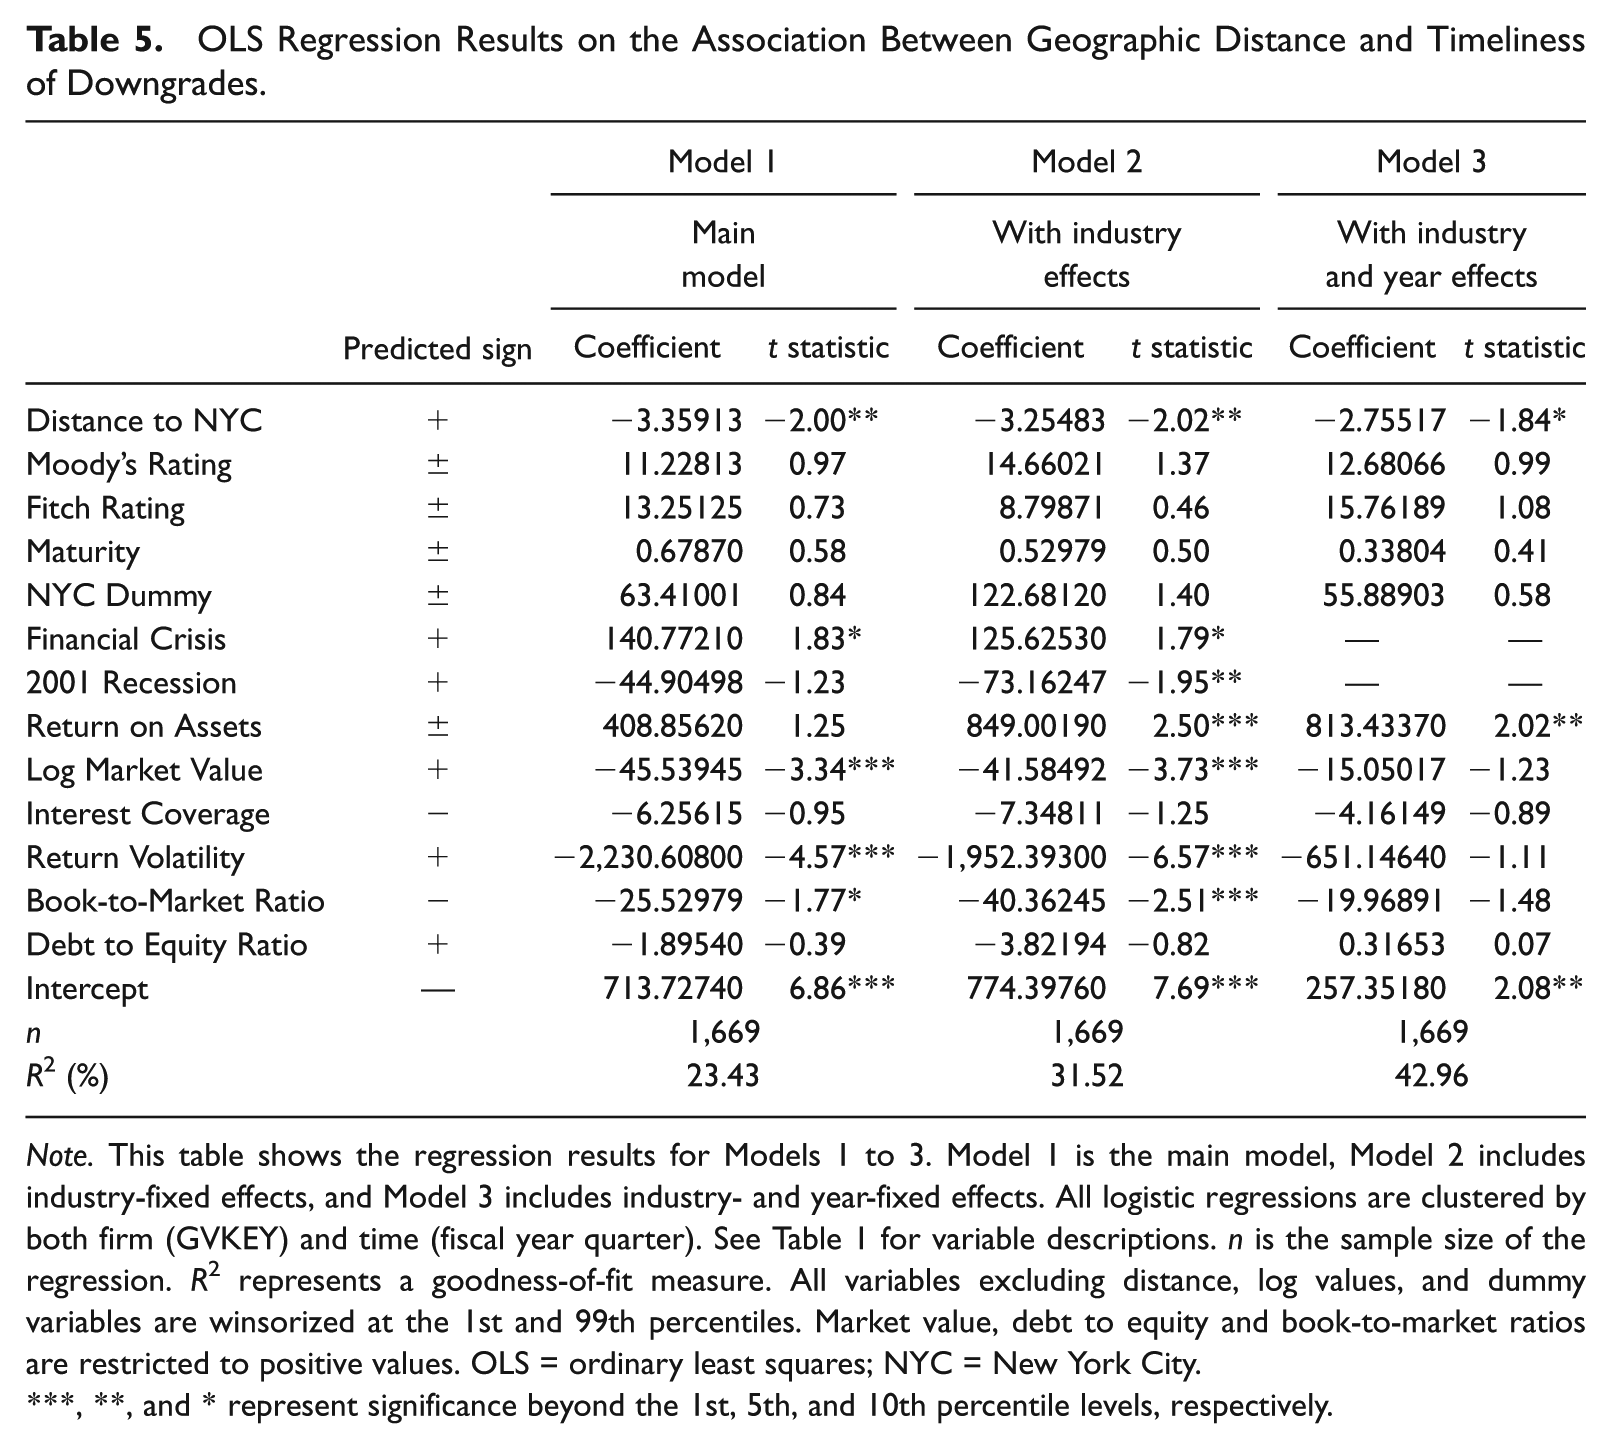
Note. This table shows the regression results for Models 1 to 3. Model 1 is the main model, Model 2 includes industry-fixed effects, and Model 3 includes industry- and year-fixed effects. All logistic regressions are clustered by both firm (GVKEY) and time (fiscal year quarter). See Table 1 for variable descriptions. n is the sample size of the regression. R2 represents a goodness-of-fit measure. All variables excluding distance, log values, and dummy variables are winsorized at the 1st and 99th percentiles. Market value, debt to equity and book-to-market ratios are restricted to positive values. OLS = ordinary least squares; NYC = New York City.
, **, and * represent significance beyond the 1st, 5th, and 10th percentile levels, respectively.
The results show that the variable of “Distance to NYC” is negative and significant at the 5% level, indicating that the downgrades for firms with longer distance from NYC occur with delay and closer to the default dates, suggesting that downgrades are less timely for the firms that are further away from the rating analysts. This result is also consistent with our H1 with regard to the timeliness of downgrades.
Discussion on control variables
Bonds with higher years to maturity are likely to command greater attention from CRAs, and this leads to more accurate ratings, which is indicated by the negative coefficient for both Type I and Type II errors. These coefficients are consistent with our expectations. The variables on recessions, return on assets, return volatility, debt to equity ratio, and book-to-market ratio are especially significant. Amato and Furfine (2004) present that the stability of credit ratings over the economic cycles may result in ratings that are relatively high during recessions and low during economic booms. Consistent with this argument, we find that Type I errors are higher during recessions, whereas Type II errors are lower. The stock return volatility and debt to equity ratio, which capture riskiness and firms which may be more difficult to rate, are positive for Type I and Type II errors.
Overall results on H1
Overall, the results show that the likelihood of missed defaults, false warnings, and less timely downgrades increases as the distance of firms from NYC increases. These results are thus consistent with our H1 that the rating errors/lower timeliness increase as the geographic distance of the firm headquarters from the rating agency headquarters increases. Consistent with the existing literature, these findings highlight the value of local information in decision making (Coval & Moskowitz, 2001; Guiso, Sapienza, & Zingales, 2004, 2008).
Impact of firm complexity on the association between rating errors and geographic distance
The impact of firm complexity on the association between distance and Type I error is examined by identifying product diversification of firms, indicated by the number of product segments mentioned in the Compustat database. We conduct this test on the total sample as well as on the high and low subsamples based on firm complexity. 21 The variable Complexity is coded as 1 (higher complexity) for firms with segments above the median of all firms, and otherwise 0. The interaction term between Complexity and Distance to NYC will indicate whether firm complexity has an incremental effect on rating errors. 22 We conduct two additional tests using alternative classification criteria for Complexity. First, we define Complexity as quartiles, where observations with the highest complexity based on the number of product segments are classified in Quartile 4 and observations with the lowest Complexity quartile are classified as Quartile 1. Second, we use Complexity as a continuous variable in the test. Because the results based on median, quartiles, and continuous variable of complexity are similar in nature, we tabulate the results based on the median number of product segments in Table 6.
Regression Results for the Interaction Effect between Complexity and Distance to NYC.
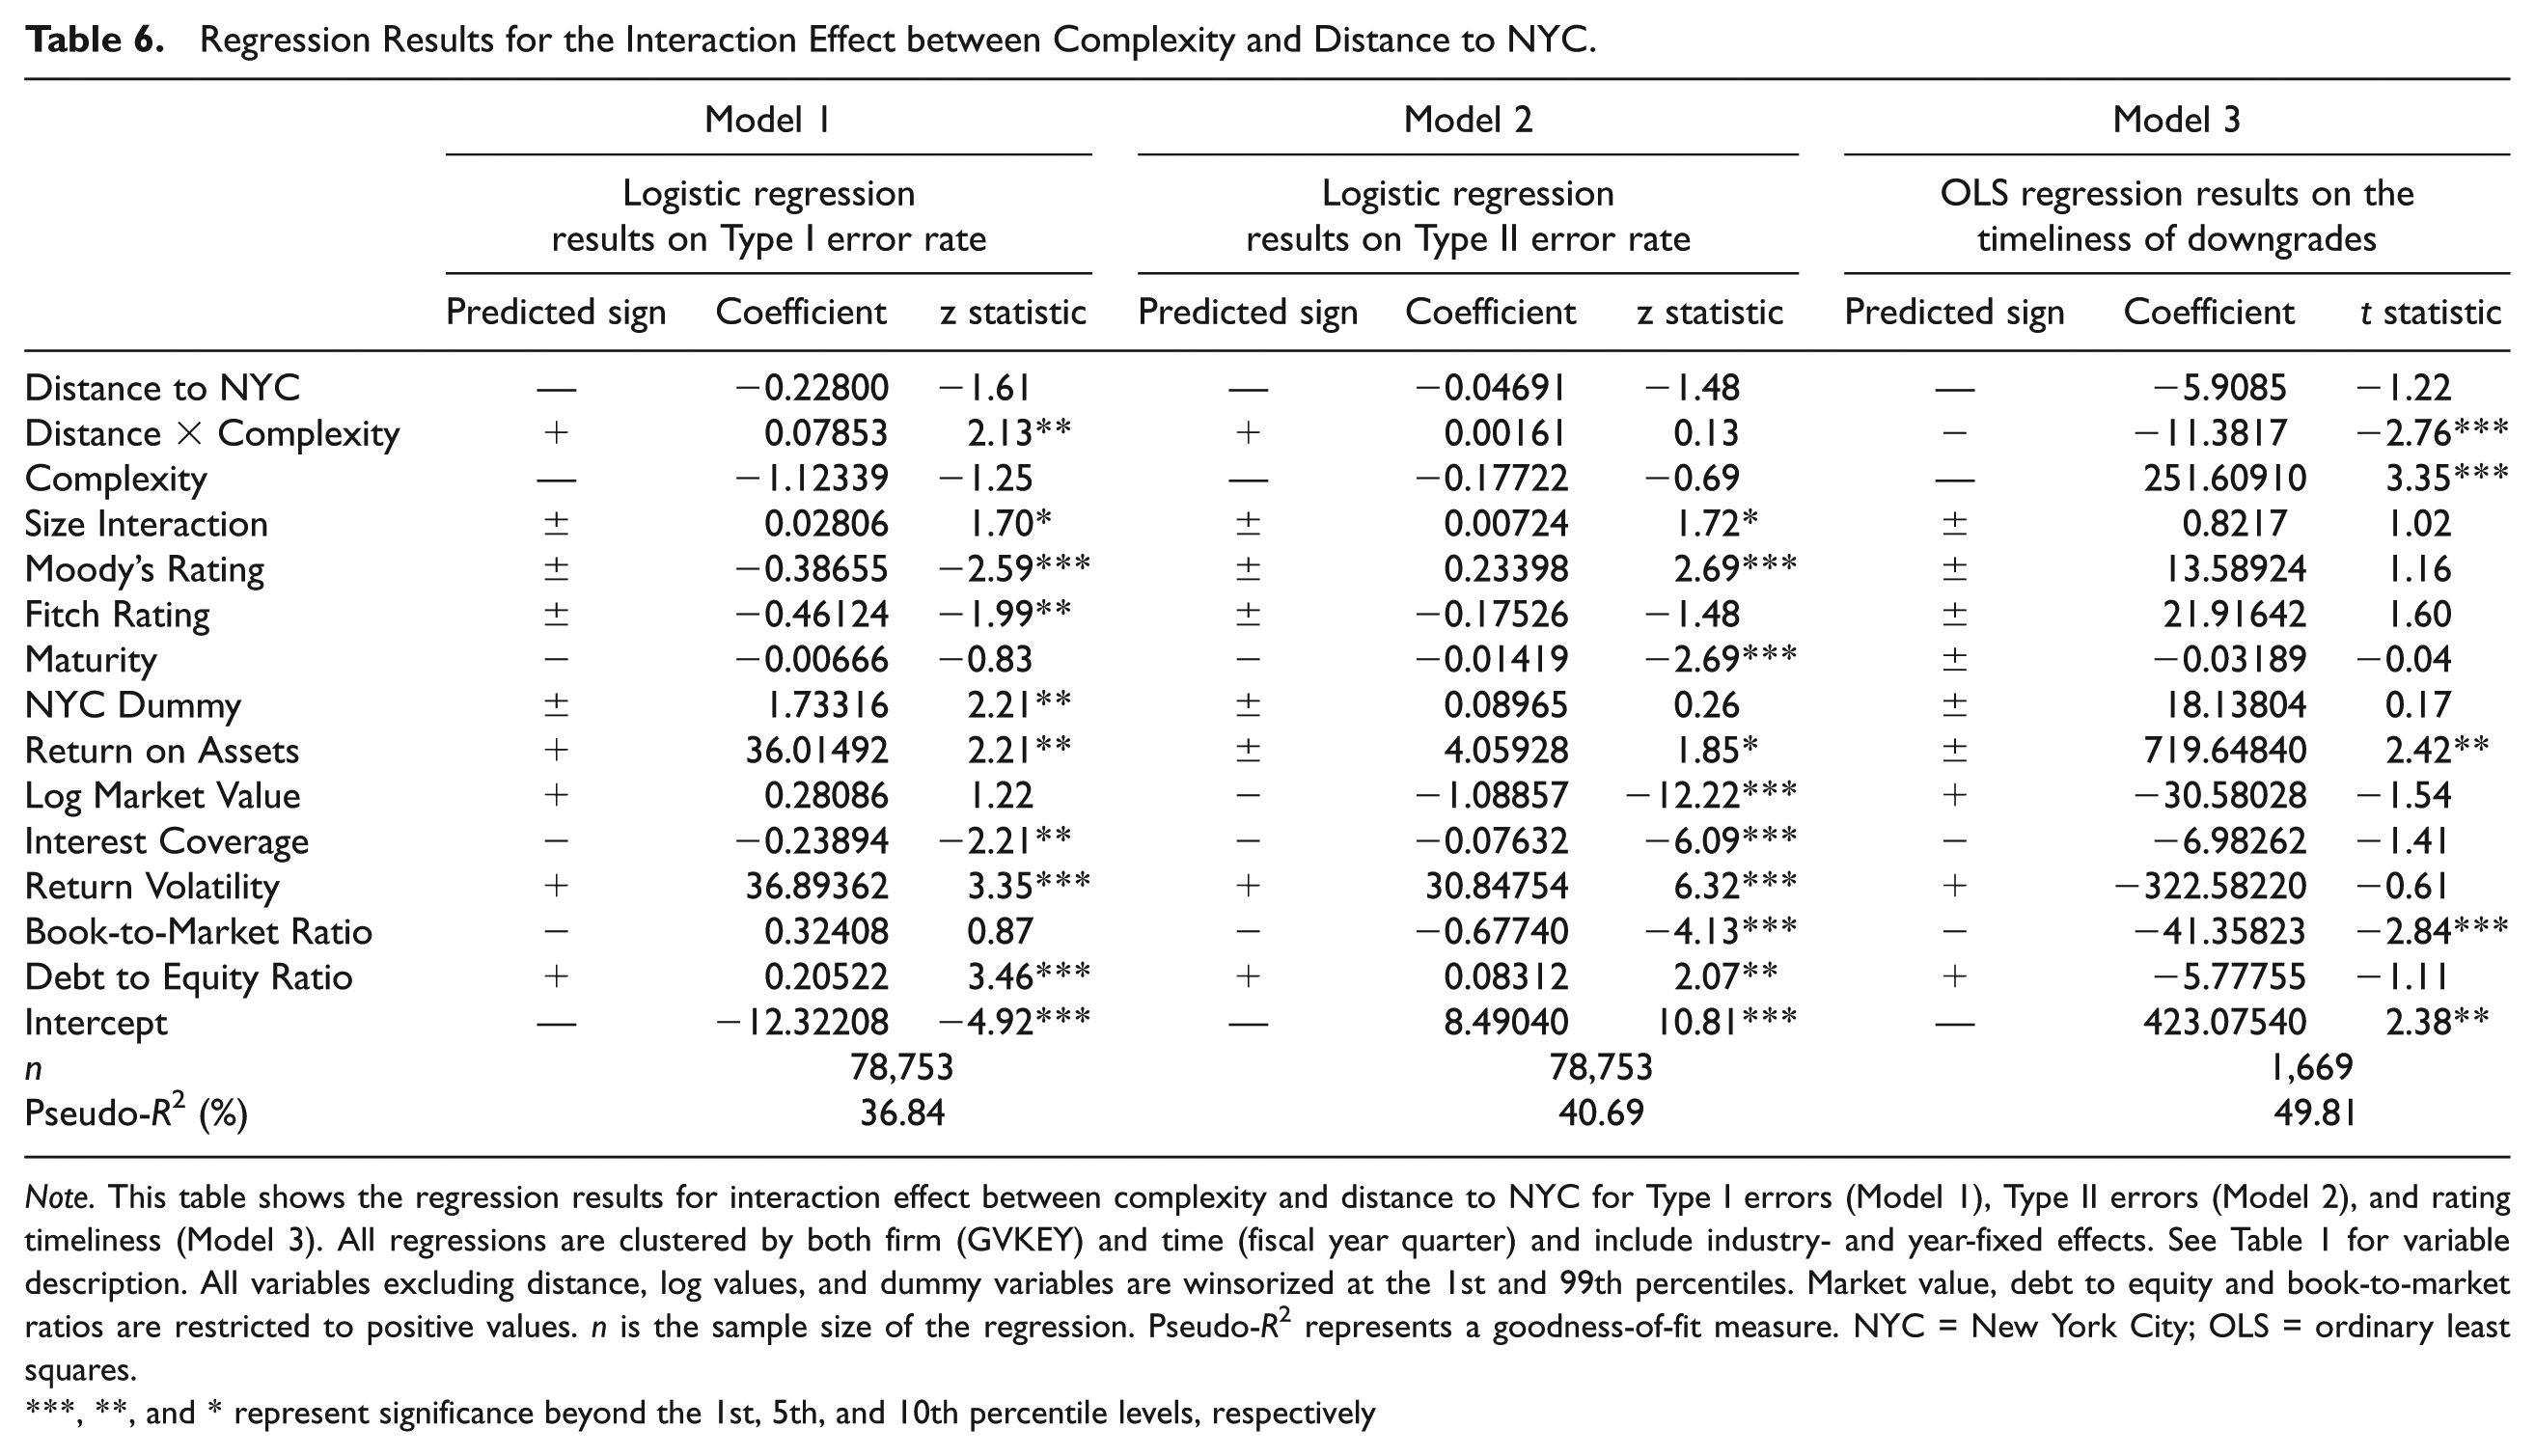
Note. This table shows the regression results for interaction effect between complexity and distance to NYC for Type I errors (Model 1), Type II errors (Model 2), and rating timeliness (Model 3). All regressions are clustered by both firm (GVKEY) and time (fiscal year quarter) and include industry- and year-fixed effects. See Table 1 for variable description. All variables excluding distance, log values, and dummy variables are winsorized at the 1st and 99th percentiles. Market value, debt to equity and book-to-market ratios are restricted to positive values. n is the sample size of the regression. Pseudo-R2 represents a goodness-of-fit measure. NYC = New York City; OLS = ordinary least squares.
, **, and * represent significance beyond the 1st, 5th, and 10th percentile levels, respectively
The results for Model 1 in Table 6 show that coefficient of the interaction term between Distance and Complexity is positive and significant, indicating that Type I error is higher for firms with higher complexity and which have headquarters away from NYC. Thus, these findings are consistent with our H2 that the positive relation between rating errors and geographic distance is stronger for the firms with higher complexity. These findings suggest that soft information is especially valuable to the credit rating analysts for complex firms located away from NYC.
The results on Type II error are presented in Model 2 (Table 6). The results show that coefficient of the interactive term is positive but insignificant. This result thus indicates that complexity does not have a significant impact on the association between false warnings and geographic proximity. We believe that these results can be partially attributed to the differences in rating levels between complex and non-complex firms. We find that the ratings for complex firms are on average relatively higher than those for non-complex firms as distance between firm headquarters and ratings agency headquarters increases. 23 Given that false warnings are defined by the ratings below the investment grade threshold which do not default within a certain time frame, this reduces the likelihood of false warnings for complex firms relative to non-complex firms. While we anticipate that complex firms are more likely to have false warnings as access to soft information decreases, this may be mitigated by higher ratings which lower the likelihood of giving false warnings.
The results on the timeliness of downgrades (Model 3, Table 6) show that the interaction term is significantly negative, indicating that analysts’ performance with regard to the timeliness of downgrades is even worse for complex firms that have headquarters away from NYC. This finding is consistent with our H2 that the negative association between downgrades and geographic distance is stronger for complex firms.
We also examine the association between firm complexity and rating errors by conducting separate tests on firms with the number of segments above and below the median of all firms. 24 Separate regression tests based on two groups may yield better comparisons than tests based on a full sample with an interaction term when coefficients of control variables vary between the groups (Gul, Fung, & Jaggi, 2009; Hardy, 1993). The results (untabulated) for Type I errors and timeliness of downgrades show that the coefficient for “Distance to NYC” is statistically significant for the group with high complexity, whereas it is insignificant for the group with low complexity. To conduct F tests to evaluate whether coefficients of “Distance to NYC” for the two groups are significantly different, we conduct regression tests based on the linear probability model (LPM). 25 The F-test results confirm that coefficient for “Distance to NYC” is statistically different for Type I errors and timeliness of downgrades.
Overall, we find evidence that supports H2 in that the value of soft information matters more for complex firms. Specifically, the likelihood of Type I errors is greater and downgrades are less timely for more complex firms. These findings are also consistent with the recent literature that examines audit fees and find that the value of soft information such as social capital increases when auditing is more complex (Jha & Chen, 2014).
Impact of analyst following on the association between rating errors and geographic distance
Similar to Section “Impact of Firm Complexity on the Association Between Rating Errors and Geographic Distance,” we test the effect of “analyst following” by including an interaction variable between “analyst following” and “Distance to NYC” in our regression model. The results are presented in Table 7.
Regression Results for the Interaction Effect Between Analyst Following and Distance to NYC.
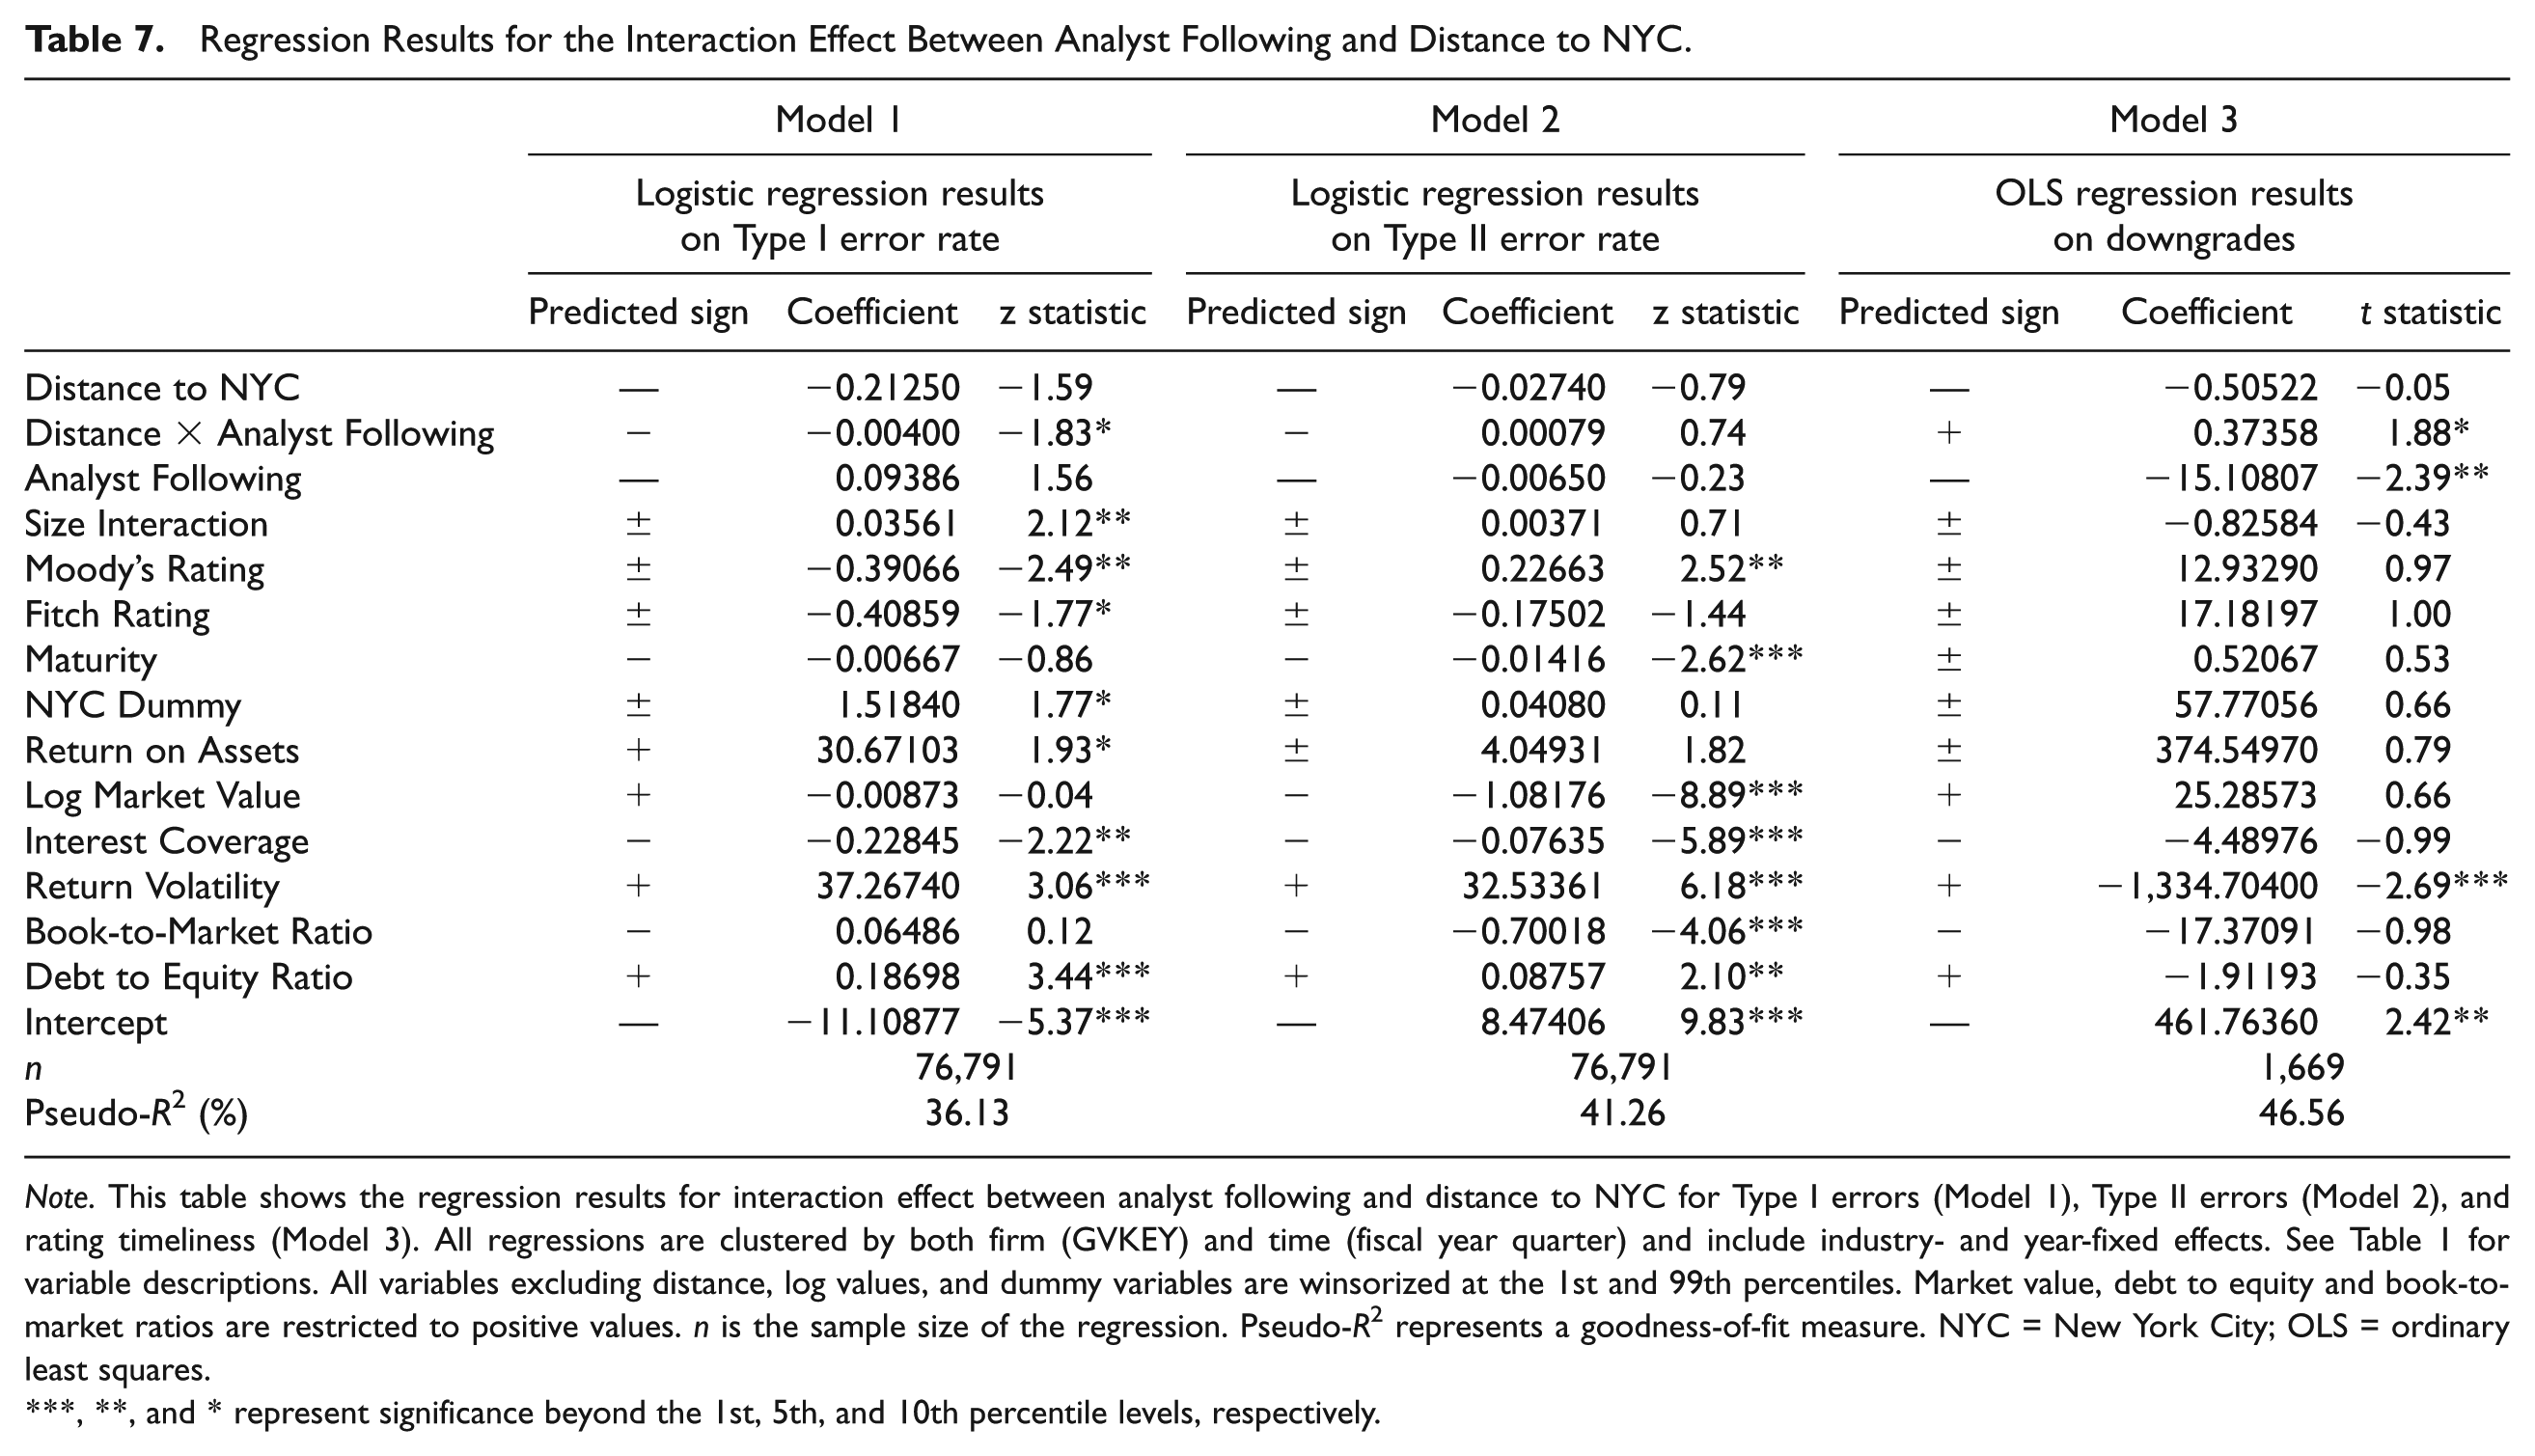
Note. This table shows the regression results for interaction effect between analyst following and distance to NYC for Type I errors (Model 1), Type II errors (Model 2), and rating timeliness (Model 3). All regressions are clustered by both firm (GVKEY) and time (fiscal year quarter) and include industry- and year-fixed effects. See Table 1 for variable descriptions. All variables excluding distance, log values, and dummy variables are winsorized at the 1st and 99th percentiles. Market value, debt to equity and book-to-market ratios are restricted to positive values. n is the sample size of the regression. Pseudo-R2 represents a goodness-of-fit measure. NYC = New York City; OLS = ordinary least squares.
, **, and * represent significance beyond the 1st, 5th, and 10th percentile levels, respectively.
The results for Model 1 on Type I error show that coefficient of the interaction term between Distance and analyst following is negative and significant at the 10% level. This result indicates that the positive association between the rating error and Distance is moderated by higher analyst following, reflecting lower information asymmetry. In other words, higher rating errors of firms with longer distance from NYC are reduced if analyst following is high. Conversely, the rating error is high for firms with longer distance from NYC and low analyst following, reflecting high information asymmetry.
Regression results on the Type II errors, that is, false warnings, are presented under Model 2 in Table 7. The results show that the coefficient of the interaction term is positive but insignificant. Similar to the explanation provided for the association between firm complexity and false warnings, we believe that these results can be partially attributed to differences in the rating levels between high and low analyst following firms. We also find that the ratings for low analyst following firms are on average relatively higher than those for the firms with high analyst as distance between firm headquarters and ratings agency headquarters increases. This reduces the likelihood of false warnings for the low analyst following firms relative to the high analyst following firms as distance to the rating agency headquarters increases.
The results on the timeliness of downgrades are presented under Model 3 in Table 7. The results show that coefficient for the interaction term is significantly positive. This finding indicates that a higher coverage by analysts that reduces information asymmetry moderates the negative association between the timeliness of downgrades and geographic proximity.
We also conduct regression tests separately on the subsamples of observations with high and low analyst following. The high and low analyst following subsamples are classified based on the median of analyst following for the total sample. 26 The results (untabulated) show that for Type I errors and timeliness of downgrades, the coefficient for “Distance to NYC” is statistically significant for the subsample with low analyst following, whereas it is insignificant for the subsample with high analyst following. Using the LPM method, we conduct F tests on the coefficients for “Distance to NYC” for the two groups, and the results show that the coefficient is significantly lower for Type I errors for firms with high analyst following, indicating that higher rating errors of firms with longer distance from NYC are moderated if analyst following is high.
In sum, we find evidence that supports H3 and that the value of soft information matters more for firms with greater information asymmetry.
Robustness Tests
We conduct several robustness tests to evaluate the validity of our findings.
Industry- and year-fixed effects
We test the robustness of our findings by including industry- and year-fixed effects in the analyses. We define industries in accordance with the Fama-French 12 industry classification. The results on the industry- and year-fixed effects are presented in Models 2 and 3 of Table 3 for Type I errors, Table 4 for Type II errors, and Table 5 for the timeliness of downgrades. The results show that coefficient of the variable “distance to NYC” remains significant even after industry- and year-fixed effects are included in the analyses.
Tests based on different time horizons for rating errors
The above analyses are based on the rating errors determined for the time horizon of 2 years. In other words, Type I errors occur when an investment grade rated bond defaults within 2 years from the time of its rating. Similarly, Type II errors occur when a speculative bond does not default within 2 years. We conduct additional analyses by defining the time horizon for rating errors with 1, 3, and 5 years as time horizons, meaning that Type I errors can occur within 1, 3, or 5 years from default, and Type II errors can occur for speculative ratings which do not default within 1, 3, or 5 years, respectively. The results (untabulated) of all tests are consistent with our main results.
Tests based on CRA regional offices
Although each rating agency has many regional U.S. offices, the corporate analysts, however, have a limited presence in the regional offices. As noted earlier, Moody’s indicates that corporate analysts are based in NYC. However, if analysts primarily based in NYC utilize regional offices, this may also facilitate the collection of soft information. We conduct additional analyses by defining the distance to a CRA as the lowest distance among their common regional offices. 27 The main results (untabulated) remain unchanged to this alternative specification.
Tests based on different measures for distance
Our main tests measure distance to NYC as a linear specification. One issue with this specification is that it assumes that the degree of access to soft information and rating errors are also a linear function of distance. It may not be true in all cases. For example, a firm that is 1,000 km away from a rating analyst may not have twice as many as rating errors as the firm that is 500 km away from the rating analyst. To address this issue, we use several different measures for distance. First, we measure distance as the natural logarithm of the raw measure. 28 Second, we use the squared root of the measure. Third, we use a dummy variable for distance, and code it as 1 if the firm’s headquarter is greater than 50 km away from NYC and 0 otherwise. The results (untabulated) of all tests show that there is no significant difference in these results compared with the results reported in the tables.
Results on the error measure for different rating agencies
The main analysis examines the effect of availability of soft information to three major CRAs. As noted earlier, Moody’s appears to be relatively more conservative, and its ratings are associated with lower Type I errors compared with S&P. We conduct tests separately for all three CRAs to examine if the results would differ for tests based on individual CRAs. 29 The results of these tests (untabulated) show that they are consistent with the results reported in the tables. The results show that there is a significantly positive association between the variable “distance to NYC” and Type I errors, but the coefficient for this variable is smaller in magnitude for the Moody’s ratings compared with the S&P ratings for Type I errors. The results (untabulated) for Type II errors and timeliness of ratings downgrades are consistent with the results reported in the tables. Thus, we do not find any systematic differences among the major CRAs in terms of their reliance on soft information.
We conduct an additional robustness test, which is based on the S&P and Fitch ratings only; Moody’s ratings are excluded because they incorporate an expected recovery into the credit ratings, which may bias the results. We define Type I and Type II errors for this test based on the rating boundary defined by triple C (Rating Code 17). Type I errors are coded as 1 and 0 otherwise for the ratings that are above triple C and default within 1 year. If the bonds are rated as Triple C or below and the bond does not default within a year, Type II error is coded as 1 and 0 otherwise. The results of these tests (untabulated) show that there is no difference between these results and the main results reported in the tables.
Additional Analysis
Accessibility of location
It can be argued that easy accessibility to the firm’s headquarters will provide special encouragement to the rating analysts to obtain soft information from the face-to-face meetings. Because all rating agencies covered in this article are located in NYC, we examine whether easy access to the firm headquarters from NYC will have an impact on the association between rating errors/downgrade timeliness and geographic distance. It is argued that if the firm’s headquarters are not easily accessible, the bond analysts will have little motivation to obtain soft information, which can be obtained from the face-to-face meetings. This situation will thus aggravate information asymmetry and make it even more difficult to achieve higher accuracy for their ratings. Thus, our argument suggests that the positive association between rating errors and geographic distance and the negative association between timely downgrades and geographic distance are expected to be stronger for the firms that have no direct access to the firm’s office from NYC.
We use direct flights from NYC to the firm headquarters as a proxy for easy accessibility. We obtain information on the fight routes to NYC from online searches, and we include three major airports in the NYC metropolitan area in determining the flights to NYC, that is, LaGuardia Airport, John F. Kennedy International Airport, and Newark Liberty International Airport. We create an indicator variable of “Non-direct,” which is coded as 1 if there are no direct flights to the location of the firm headquarters from NYC and 0 otherwise. 30 We expect the coefficient of the interaction term between the variables “Non-direct” and “Distance to NYC” to be positive for rating errors, indicating higher rating errors for lower accessibility. In addition, we expect the interaction term between the variables of timeliness and “Non-direct” to be negative, indicating less timely downgrades in relation to the default dates.
The results (untabulated) show that the interaction term is significant for Type I errors and timeliness of downgrades. There is an incremental effect of higher Type I errors and less timely downgrades for firms which are further away from CRA headquarters when there is a lack of direct flights between firm offices and NYC. In other words, firms located in cities with less ease of access to rating analysts have ratings that are more likely to be associated with missed defaults and downgrades closer to default.
Additional proxies for soft information
Our main analyses provide evidence that soft information matters more for the firms with a weaker information environment. In this section, we examine the effect of analyst forecast dispersion on the informational environment of a firm. It is argued in the literature that forecast dispersion affects the quality of information environment (e.g., Barron, Kim, Lim, & Stevens, 1998; Brown, Richardson, & Schwager, 1987; Daley, Senkow, & Vigeland, 1988). Based on this evidence, we expect that uncertainty associated with higher forecast dispersion will aggravate the association between geographic proximity and rating errors, suggesting that soft information is more important for firms with higher forecast dispersion. We evaluate the joint effect of geographic distance and forecast dispersion by including an interaction variable in the analyses. 31 Our findings (untabulated) show that the lack of access to soft information increases Type I errors and also decreases the timeliness of downgrades for firms with higher forecast dispersion. This finding suggests that availability of soft information is more important for firms with greater uncertainty, proxied by higher forecast dispersion.
Analysis separated by geographic regions
We also examine if our results are influenced by a particular geographic region. If rating errors are concentrated within a particular region, this may weaken the generalizability of our results. We identify four unique regions as defined by the U.S. census (Northeast, Midwest, West, and South) and conduct tests to evaluate the joint effect of geographic proximity and individual regions by including an interaction variable in the analyses. We find that our main results are not concentrated in one particular region, suggesting that no particular region has a special effect on the association between rating errors and geographic proximity. In other words, our main results are not driven by a particular region.
Adjustment of ratings by analysts as a result of geographic distance
In addition, we examine whether the rating analysts adjust their ratings lower to compensate for the lack of soft information as a result of distance of the client firm from their offices. To evaluate this, we conduct an ordered logit test using the ratings as a dependent variable and “distance to NYC” as the main independent variable. 32 The test results are presented in Table 8.
Regression Results on the Association Between Rating Levels and Geographic Distance.
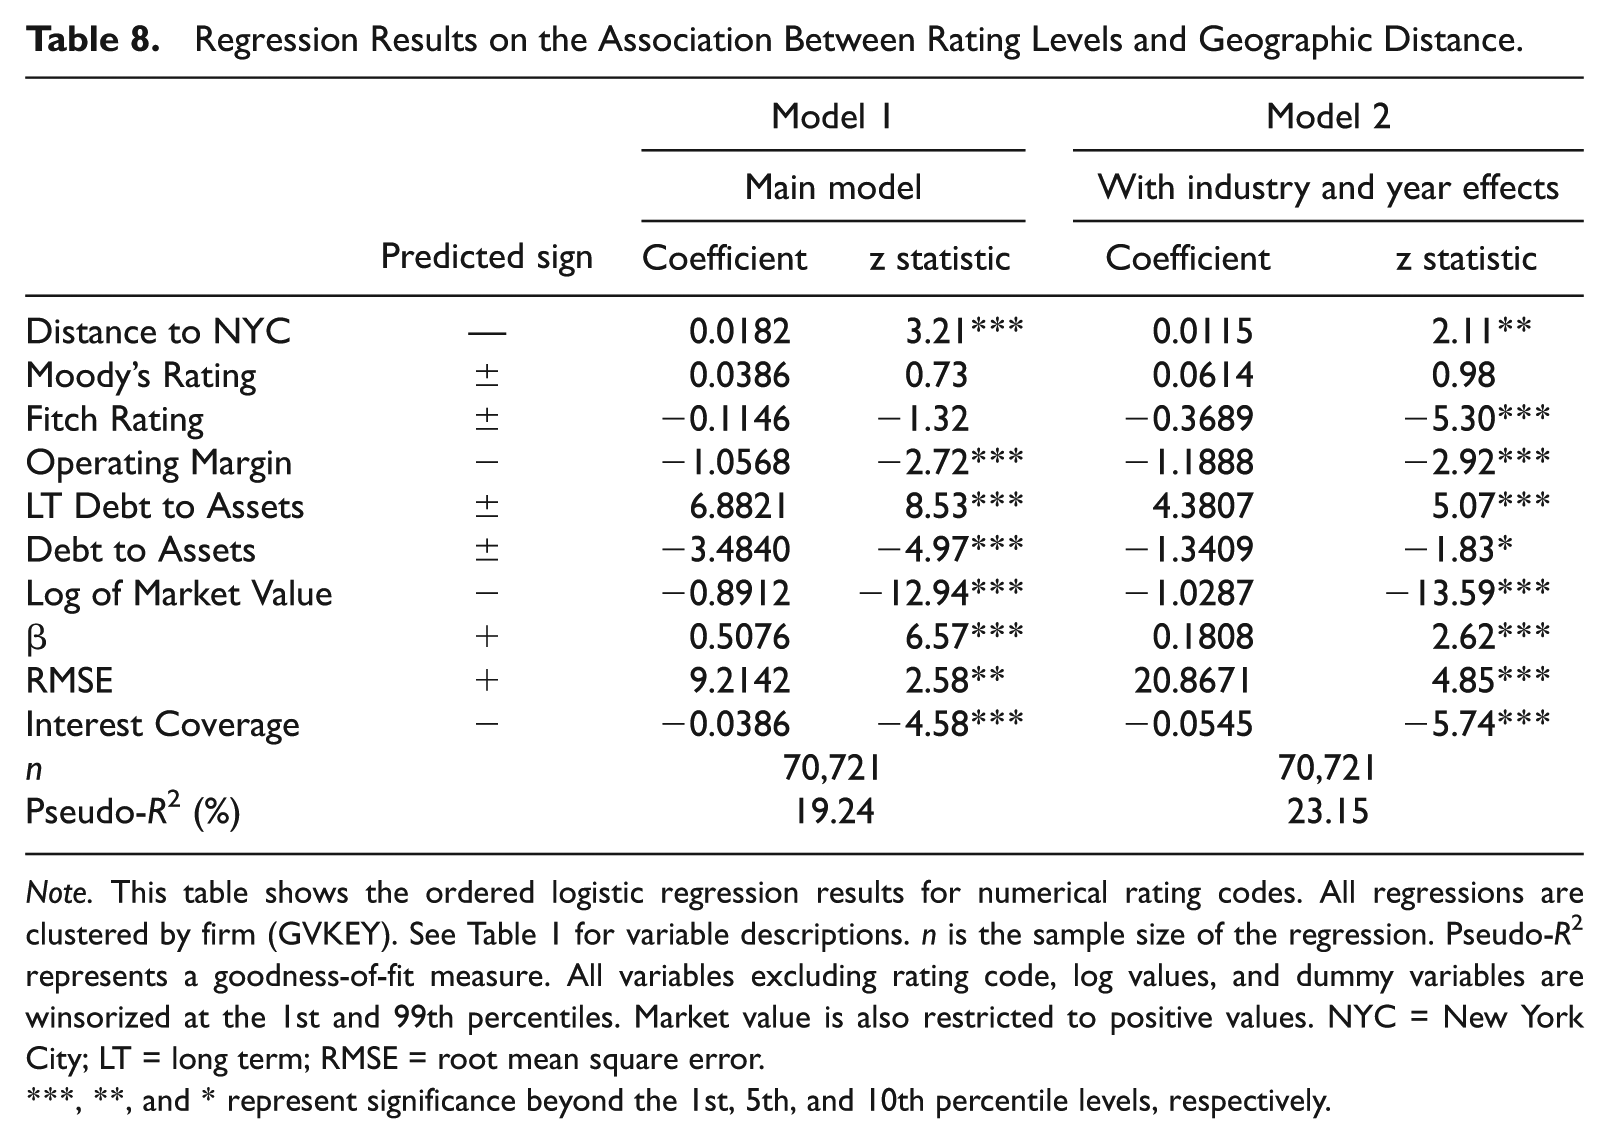
Note. This table shows the ordered logistic regression results for numerical rating codes. All regressions are clustered by firm (GVKEY). See Table 1 for variable descriptions. n is the sample size of the regression. Pseudo-R2 represents a goodness-of-fit measure. All variables excluding rating code, log values, and dummy variables are winsorized at the 1st and 99th percentiles. Market value is also restricted to positive values. NYC = New York City; LT = long term; RMSE = root mean square error.
, **, and * represent significance beyond the 1st, 5th, and 10th percentile levels, respectively.
The results for Model 1 show that coefficient of the “Distance to NYC” variable is positive and significant, indicating that the ratings are lower as the distance between firm headquarters and CRA headquarters increases. The results for Model 2 show that the coefficient does not change when industry- and year-fixed effects are included. These results thus show that the ratings are significantly lower as firms move further away from NYC. This finding thus suggests that the rating analysts recognize that they may be missing on soft information for the firms that are further away from their headquarters and they adopt a conservative approach to compensate for this lack of soft information.
Although the ratings for distant firms are lower, our results indicate that distant firms are still associated with higher missed defaults and less timely downgrades. Thus, this suggests that lower ratings do not fully compensate for missing soft information.
The effects of hard information
Our main results use distance to NYC as a proxy for soft information and find that rating errors are higher when access to soft information is lower. There is an alternative explanation for the difference in the rating errors of firms away from NYC compared with the firms located in NYC or its vicinity. It is argued that differences in the rating errors of the two groups of firms may primarily be due to the effects of hard information (e.g., De Franco, Kothari, & Verdi, 2011; Kim, Kraft, & Ryan, 2013). This argument can be interpreted from two different perspectives. First, it can be argued that inefficient processing of hard information by rating analysts may affect their rating accuracy. This explanation is considered questionable because it assumes that geographic distance negatively affects the processing of hard information. It is unlikely that adjustments to hard information by CRAs would deteriorate or change with geographic distance (e.g., Moody’s, 2006; Standard & Poor’s, 2008). 33 The processing of hard information is more likely to differ because of differences in the nature of the firm’s business (industry) rather than geographic distance.
Second, another alternative explanation is that the reliability of hard information may differ with geographic distance. Kedia and Rajgopal (2011) find that firm information is more reliable when firms are located closer to the SEC headquarters. If distance to rating agency headquarters is also associated with distance to an SEC regional office, the reliability of hard information could explain our results. We conduct a test by controlling for distance to a regional SEC office, and the results (untabulated) remain unchanged. 34
Conclusion
This article has examined the effect of geographic distance on the accuracy of corporate bond ratings. The rating errors are calculated based on the methodology suggested by Cheng and Neamtiu (2009). We use Type I rating errors for missed defaults and Type II errors for false warnings as the dependent variables in our regression tests. The results show that the location of a firm matters when it comes to the accuracy of credit ratings. As we move further away from the rating agency headquarters, that is, NYC, the rating errors are higher. More specifically, for each 100 km we move away from NYC, the likelihood of a missed default increases by 4.9%, whereas the likelihood of false warnings increases by 2.1%. These results are robust when industry- and year-fixed effects are included in the analyses. Furthermore, we find that downgrades are less timely as distance between the firm and CRA headquarters increases.
In addition, the results show that soft information is more valuable for complex firms because it can help analysts to have a better understanding of firms which may have more product lines. The results also show that analyst following, which reflects asymmetry of information, has an impact on the association between errors/less timely downgrades and geographic proximity. Soft information is considered to be more important when uncertainty is high, that is, when the firm is followed by fewer analysts. We also evaluate whether the ease of access to the firm headquarters by the rating analysts would have an impact on the rating errors. We used the proxy of direct flights to firm headquarters from NYC for evaluating the effect of easy accessibility. The results indicate that missed defaults and less timely downgrades are more likely for the firms without easy accessibility.
Although the rating analysts recognize the importance of geographic proximity and assign low ratings to the firms which have large distances from their offices, the rating errors are still high for these firms. The results thus indicate that lower ratings do not fully compensate for the lack of soft information.
Our findings thus provide evidence that geographic distance is an important determinant for rating accuracy. This information is useful to the rating analysts as well as to investors who use the bond ratings to evaluate the bond’s quality.
Footnotes
Appendix
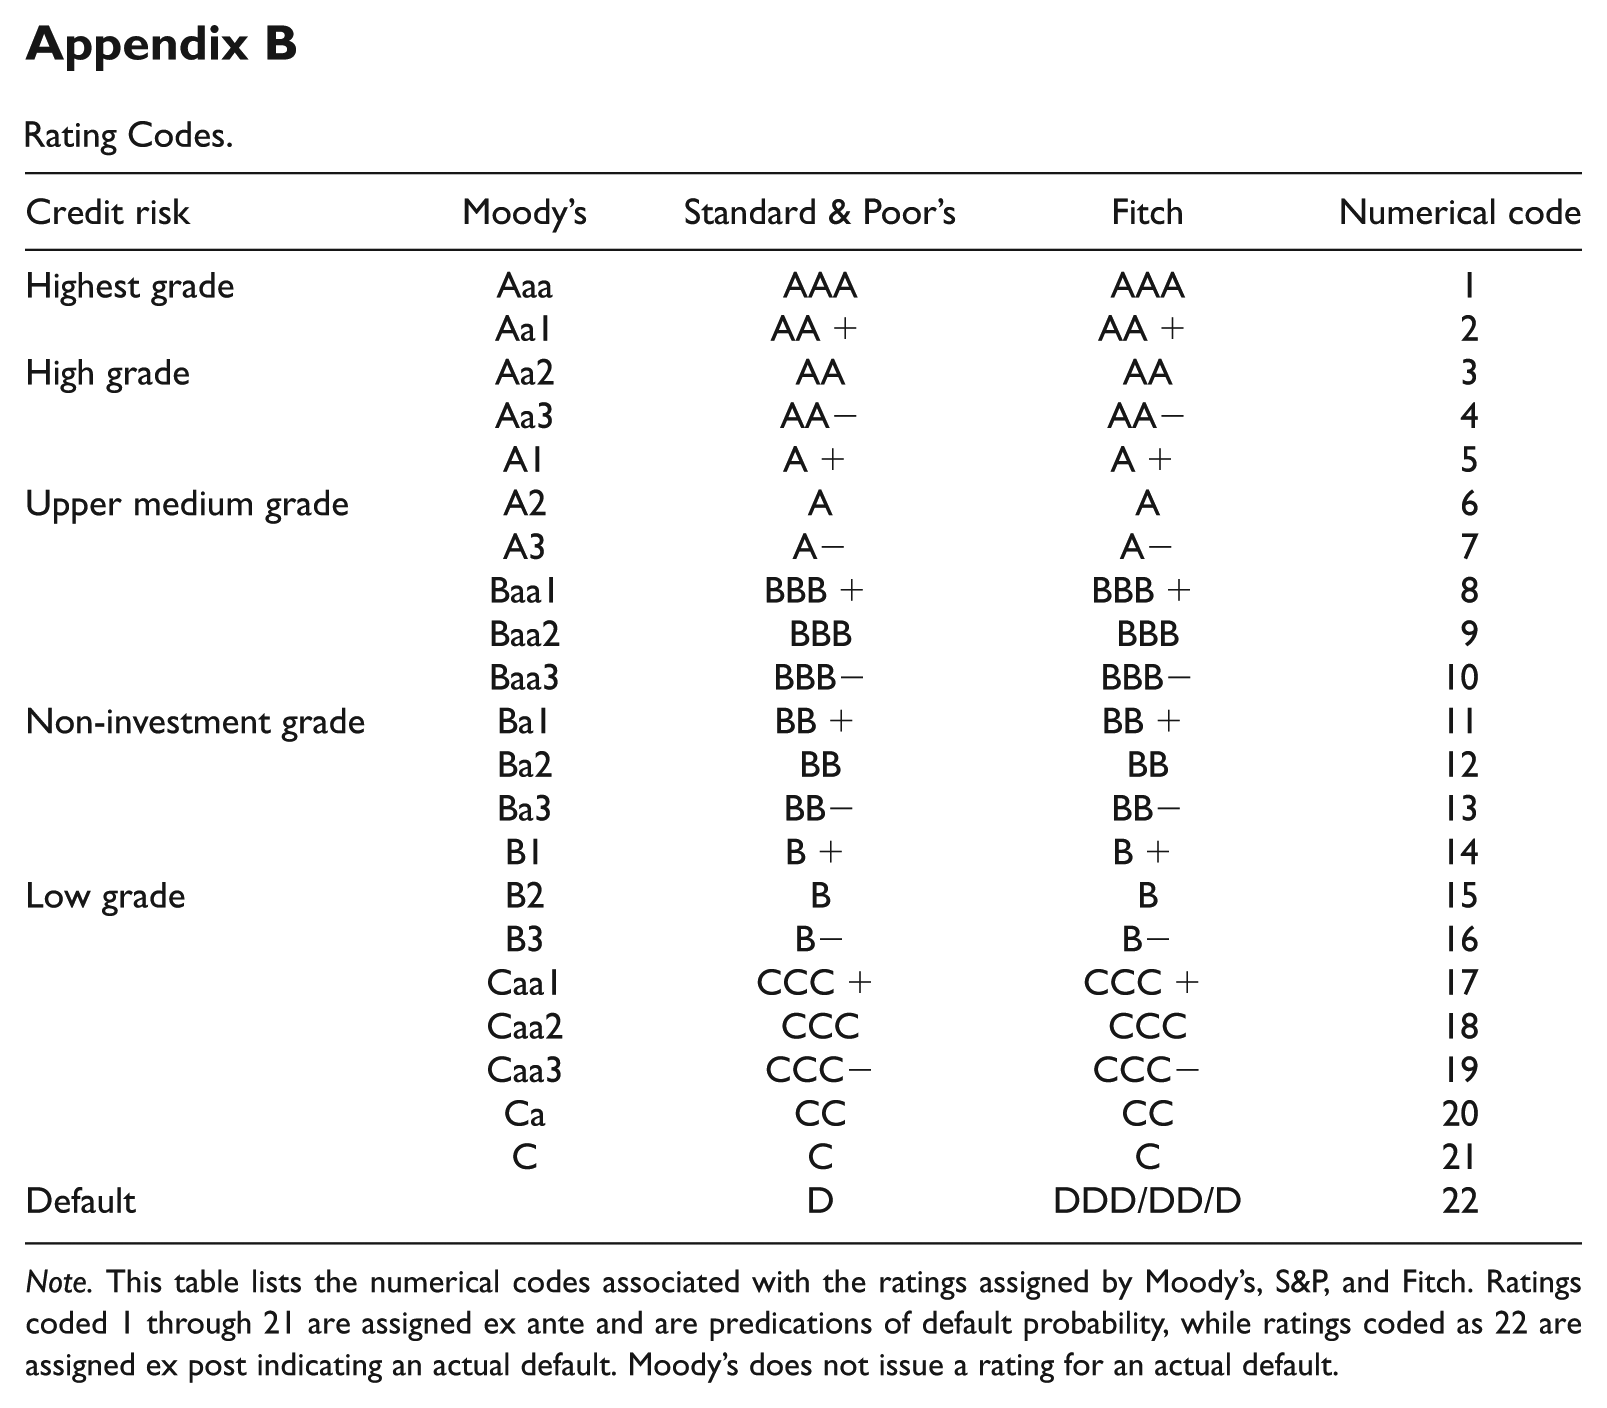
Rating Codes.
| Credit risk | Moody’s | Standard & Poor’s | Fitch | Numerical code |
|---|---|---|---|---|
| Highest grade | Aaa | AAA | AAA | 1 |
| Aa1 | AA+ | AA+ | 2 | |
| High grade | Aa2 | AA | AA | 3 |
| Aa3 | AA− | AA− | 4 | |
| A1 | A+ | A+ | 5 | |
| Upper medium grade | A2 | A | A | 6 |
| A3 | A− | A− | 7 | |
| Baa1 | BBB+ | BBB+ | 8 | |
| Baa2 | BBB | BBB | 9 | |
| Baa3 | BBB− | BBB− | 10 | |
| Non-investment grade | Ba1 | BB+ | BB+ | 11 |
| Ba2 | BB | BB | 12 | |
| Ba3 | BB− | BB− | 13 | |
| B1 | B+ | B+ | 14 | |
| Low grade | B2 | B | B | 15 |
| B3 | B− | B− | 16 | |
| Caa1 | CCC+ | CCC+ | 17 | |
| Caa2 | CCC | CCC | 18 | |
| Caa3 | CCC− | CCC− | 19 | |
| Ca | CC | CC | 20 | |
| C | C | C | 21 | |
| Default | D | DDD/DD/D | 22 |
Note. This table lists the numerical codes associated with the ratings assigned by Moody’s, S&P, and Fitch. Ratings coded 1 through 21 are assigned ex ante and are predications of default probability, while ratings coded as 22 are assigned ex post indicating an actual default. Moody’s does not issue a rating for an actual default.
Acknowledgements
We are grateful to Bharat Sarath and Valentin Dimitrov for their valuable comments and suggestions. We also thank the participants at the Rutgers Research Seminar and the 2013 American Accounting Association Northeast Conference for their thoughtful comments.
Declaration of Conflicting Interests
The author(s) declared no potential conflicts of interest with respect to the research, authorship, and/or publication of this article.
Funding
The author(s) received no financial support for the research, authorship, and/or publication of this article.