
Abstract
We examine the (un)intended consequences of a mandatory dividend payout regulation for firms’ financial reporting choices using a natural experiment in China. Beginning in October 2008, China required firms desiring to raise new equity capital to maintain a cumulative dividend payout ratio of at least 30% over the past 3 years. We find that firms with a cumulative payout ratio from the prior year very close to but slightly lower than the mandated dividend threshold report lower discretionary accruals but do not increase dividends. In addition, this pattern is more pronounced in firms with greater cash flow deficits, firms with faster sales growth, and firms located in regions with lower bank development. We also find that the negative discretionary accruals are concentrated in firms with return on equity well in excess of another regulatory benchmark. In contrast, the only firms that increase dividends in response to the regulation are firms with a positive cumulative payout ratio far below the mandated threshold. Because dividend payout regulations have been suggested as a possible solution to agency problems, our results provide important policy feedback about the effectiveness of such regulations.
Introduction
We examine the effect of a mandatory dividend payout policy on firms’ financial reporting choices using a natural experiment which occurred when a dividend payout regulation took effect in October 2008 in China (hereinafter, the mandatory dividend payout reform). On October 9, 2008, the China Securities Regulatory Commission (CSRC) issued a new regulation about dividends for firms planning future seasoned equity offerings. This new regulation required that firms maintain a cumulative dividend payment of at least 30% of average distributable net income over the past 3 years to be able to issue new shares to the equity market. The purpose of this policy reform was to encourage stable dividend payments for listed companies to attract long-term investors seeking steady dividend returns. 1
Our investigation is motivated in part by La Porta, Lopez-de-Silanes, Shleifer, and Vishny (1998, 2000). In these articles, they argue that a mandatory dividend payout requirement may be a legal substitute when other minority shareholder protections are weak. 2 In this study, we utilize the policy change in China to examine the effect of a mandated dividend payout regulation on firms’ financial reporting practices and cash dividend distributions. Because the dividend payout ratio involves cash dividends in the numerator and earnings in the denominator, firms may be incentivized to influence their payout ratios through earnings management that lowers the denominator. Thus, we test whether a change in the mandated dividend payout leads to a change in the firm’s accrual reporting choices. By identifying firms that are affected by this mandatory dividend reform, we adopt a difference-in-differences research design and examine how firms adjust their discretionary accrual choices in response to the mandatory dividend payout regulation.
There is tension in this setting for the following reasons: On one hand, this dividend policy is specifically targeted at firms that intend to issue equity. Firms that do not meet the requirement must increase their dividend payout ratios to be eligible to issue seasoned equity. This provides incentives to report negative discretionary accruals to lower earnings and increase dividend payout ratios. On the other hand, firms intending to make future equity offerings also have incentives to report strong fundamentals to attract potential investors. Previous studies show that seasoned equity issuers tend to use high discretionary accruals prior to their equity issuance (Cheng, Wang, & Wei, 2015; Teoh, Welch, & Wong, 1998). In addition, income-decreasing earnings management may be costly to the firm or management for other reasons (e.g., contracting, compensation). Hence, the affected sample firms face potentially conflicting incentives, and consequently the direction and magnitude of the discretionary accruals that affected sample firms’ report is an empirical question.
In our tests, we use data from all firms listed on the Shanghai and Shenzhen stock exchanges from 2005 through 2012. We identify firm-years as “affected firm-years” if the cumulative payout ratio is greater than 0 but smaller than 30% over the 3 years prior to that firm-year. We employ a difference-in-differences design to control for general trends or changes in the economic environment unrelated to the passage of the mandatory dividend payout reform. We use the discretionary accruals from a modified Dechow and Dichev (2002) model to capture firms’ earnings management behavior. We find that affected firms, on average, decrease their discretionary accruals by about 0.7% of total assets. This decrease is both economically and statistically significant. In addition, this decrease is primarily observed in firms with cumulative payout ratios between 20% and 30%, suggesting that firms very close to but slightly lower than the mandated dividend payout threshold are more likely to decrease their discretionary accruals to meet the mandated dividend payout requirement.
We perform several cross-sectional tests, and find that this earnings management is more pronounced in firms with larger cash flow deficits, firms with faster sales growth, and firms located in provinces with less developed banking infrastructure. These findings suggest that firms with constrained financial resources, greater growth opportunities, and firms located in less developed banking markets have stronger incentives to engage in earnings management after the mandatory dividend payout reform because these firms are more likely to need to raise new equity financing, and therefore have a greater need to meet the dividend payout threshold. In addition, we consider the effect of another country-specific regulation. During our sample period, China issued another regulation requiring firms that wish to issue new share rights to existing shareholders to maintain a return on equity (ROE) of at least 6% over the past 3 years. We find that negative abnormal accruals are concentrated in firms with ROE above this threshold but with dividend payouts below the regulated threshold.
We next examine actual dividend payments to evaluate the real consequences of this dividend payout reform on firms’ dividend policies. We employ two earnings-free measures to quantify the cash dividend returned to shareholders—cash dividends per share and dividend yield (which scales cash dividends by price). We find that firms with cumulative payout ratios far below the mandated requirement (i.e., firms with cumulative payout ratios above 0 but lower than 20%) before the reform significantly increase their dividends per share and dividend yield. In contrast, firms with cumulative payout ratios between 20% and 30% do not increase their dividends per share or dividend yield. This finding suggests that some firms with cumulative payout ratios close to but slightly lower than the mandated threshold circumvent the mandatory dividend payout regulation by earnings management (rather than by increasing cash payments to investors). Ultimately, we conclude that China’s dividend payout regulation results in some intended consequences (i.e., increasing cash dividends) but for only a subset of firms. This regulation has the unintended consequence of affecting some firms’ discretionary accruals (i.e., firms can achieve the required dividend payout ratio by managing the denominator).
Our research contributes to the accounting and finance literature in several ways. The most important contribution is that our findings shed light on whether mandatory dividend payout regulations are an effective “legal substitute” when investor protection is weak, as suggested by La Porta et al. (2000). We show that the adoption of mandatory dividend payout reform is at best partially effective. Because the mandatory dividend payout policy specifies that a certain percentage of net distributable earnings should be paid out in cash to investors, firm managers can exert their discretion on both the denominator (earnings) and the numerator (cash dividend payments). If firms increase the numerator, that is, start to pay more cash dividends back to investors, then this mandatory reform may be effective in promoting increased dividends. We find this effect for firms with dividend payout ratios that are above 0 but well below the regulatory threshold (i.e., between 0% and 20%). However, we find that some firms with cumulative payout ratios close to the mandated threshold (i.e., between 20% and 30%) engage in earnings management (i.e., decrease the denominator) without necessarily increasing the actual cash dividend payments (i.e., increase the numerator). This finding provides important feedback to both academics and regulators who advocate regulatory interventions such as mandated dividend distributions as a mechanism to curb agency problems. One implication of our results is that using a regulatory benchmark based on dividend payout provides managerial discretion to circumvent the regulation, as predicted by La Porta et al. (2000).
We document one important but unintended consequence of the mandatory dividend reform in China. We show that requiring firms with external equity financing needs to pay a mandated percentage of earnings as cash dividends provides unintended incentives for some firms to engage in downward earnings management rather than change cash dividends. Whether the overall effect of this earnings management diminishes financial reporting quality depends on whether this earnings management mitigates the incentives for upward earnings management around seasoned equity offerings that can dominate financial reporting incentives in the absence of the dividend payout regulation. While several previous studies examine earnings management around other salient benchmarks (e.g., Burgstahler & Dichev, 1997; Burgstahler & Eames, 2006; Degeorge, Patel, & Zeckhauser, 1999), our setting differs from these previous studies because of the potentially conflicting incentives created by wanting to exceed a mandated dividend payout ratio to issue new equity. Hence, one cannot assume that the benchmark beating incentives from other salient benchmarks will necessarily guide behavior in our setting.
Finally, research investigating the relation between dividend policy and financial reporting choices is difficult primarily because firm or managerial characteristics jointly determine both dividend payout policy and financial reporting policy. By using a difference-in-differences research design that takes advantage of the mandatory dividend payout reform in China, we are able to mitigate this endogeneity problem. In this regard, our findings complement Hail, Tahoun, and Wang (2014) by showing that to comply with the revised government regulation, firms can make choices about the dividend payout policy that have an unintended consequence, in that they shape financial reporting choices.
The remainder of the article is organized as follows: The section “Institutional Background and Development of Hypotheses” describes the institutional background and develops our hypotheses. The section “Sample Selection and Research Design” outlines sample selection and the research design. The section “Empirical Results” presents the main empirical results and the final section concludes.
Institutional Background and Development of Hypotheses
In recent years, Chinese authorities have promulgated a series of policies to encourage dividend returns to investors in publicly listed firms, to strengthen corporate governance, and to provide more protection to minority shareholders. On March 28, 2001, the CSRC issued a regulation targeting firms with an intention to issue new shares. This regulation required that firms not making dividend payments over the last 3 years disclose their reasons for withholding dividends in their annual reports. The CSRC also called on investment banks to pay more attention to dividend policy in their due diligence related to seasoned equity offerings. On December 7, 2004, the CSRC issued another regulation prohibiting firms without dividend payments over the last 3 years from issuing new shares, convertible bonds or rights offerings to public investors. On May 6, 2006, the CSRC issued another regulation mandating a minimum payout ratio of 20% over the past 3 years for firms planning future seasoned equity offerings. The dividends required to meet these two requirements could be either cash dividends or stock dividends. Finally, on October 9, 2008, the CSRC increased the minimum payout ratio from 20% to 30% and for the first time, specified that this payout to investors must be in the form of cash rather than stock. 3
In this article, we examine the CSRC’s October 9, 2008 regulation for two reasons: First of all, unlike its predecessors, the 2008 regulation is the first regulation that specifies the form that dividends must take. Second, unlike the 2006 regulation, the 2008 regulation is not affected by other contemporaneous regulatory changes that make isolating the effects of the dividend regulation difficult per se. 4
Our primary interest is in the group of firms that are affected by this mandatory dividend requirement. The mandatory dividend payout policy requires that firms pay a cumulative dividend of at least 30% of average distributable net income over the past 3 years before they can issue new shares to the equity market. This requirement specifically focuses on the cumulative payout ratio, where the numerator is the sum of the actual cash dividend payments during the prior 3 years and the denominator is rolling-average 3-year distributable net income. As such, firms with external equity financing needs that do not qualify for this requirement must either increase their cash dividends or reduce their reported earnings or both. Consequently, the benefits of reporting downward managed earnings become greater after the reform. This is because lower earnings result in a higher rolling 3-year cumulative dividend payout ratio, making the firm more likely to be qualified to issue new equity without being required to increase cash dividends. Hence, we expect firms near the 30% cumulative dividend payout threshold to engage in more downward earnings management after this requirement is initiated. As mentioned previously, there is tension surrounding this prediction because those firms that need to issue equity face conflicting incentives to manage earnings upward to influence the price of the issuance. This leads to our first hypothesis, which is stated in the alternative form:
We also conduct tests that examine cross-sectional variation in earnings management undertaken in response to the dividend payout regulation. These cross-sectional tests are based on the assumption that there is some cost to downward earnings management in response to the regulation, and that only firms that need to issue equity and therefore need to meet the dividend payout threshold will receive sufficient benefits to incur those costs. Following Frank and Goyal (2003) and Naranjo, Saavedra, and Verdi (2015), we employ a measure of cash flow deficit to capture the financing needs of our sample firms. All else equal, we predict that firms affected by the dividend payout regulation with larger cash flow deficits will engage in more earnings management because it is more important for those firms to meet the payout threshold to issue additional equity financing and more difficult for those firms to meet the payout threshold by increasing cash dividends. For similar reasons, we also use sales growth as an alternative measure of sample firms’ need for additional financing. We expect that firms with more rapid sales growth will be more sensitive to the dividend payout regulation because they need more financing to fund their growth. Myers (1977) theorizes that high growth firms prefer equity financing to debt financing. As such, growth firms are more likely to want to access the equity market in the future. Because these firms are also likely to want to avoid paying dividends so that internally generated funds can be used to fund growth, we predict that sample firms affected by the dividend payout regulation with more rapid sales growth will engage in more earnings management to meet the dividend payout threshold. In addition, high growth firms may have accumulated positive accruals over the past few years (Lee, Li, & Yue, 2006). When the dividend reform became effective, high growth firms were more able to reverse their accumulated positive accruals to facilitate downward earnings management to decrease the payout ratio denominator. This leads to our second and third hypotheses, which are stated again in the alternative form:
Our next cross-sectional test examines the role of the development of the banking sector in our sample firms’ home province on their earnings management incentives. We examine local bank development as a potential moderating variable for earnings management in our setting because local banks could be substitutes for equity issuance. To the extent that firms in provinces with a well-developed banking sector can access financing through bank loans, the required dividend payout threshold is less important. In contrast, new financing through bank loans is less available for firms located in provinces with less developed banks. Thus, these firms are more likely to need to qualify for the regulated dividend payout threshold, so that they can access the equity market. Therefore, we expect that firms located in provinces with less developed bank markets will engage in more earnings management than firms located in provinces with more developed bank markets. This leads to our fourth hypothesis, which is stated again in the alternative form:
Our final cross-sectional test examines the role of the level of ROE in the discretionary accruals choices of our sample firms. This cross-sectional test is motivated by the existence of another regulatory benchmark that exists for sample firms during our sample period. As mentioned previously, in 2006, the CSRC added a regulation requiring that firms desiring to issue additional share rights to existing shareholders maintain a minimum ROE of 6% over the past 3 years. If sample firms wish to maintain the flexibility to raise additional equity capital either through a seasoned equity offering to new shareholders or by issuing share rights to existing shareholders, then they would have two earnings-related benchmarks to consider. If sample firms wish to maintain this minimum ROE threshold and also try to meet the minimum dividend payout threshold of 30%, then we expect firms with a ROE of well above 6% over the past 3 years to be more willing to report lower discretionary accruals to meet the dividend payout threshold because doing so would not cause their ROE to decline below the 6% threshold. This leads to our fifth hypothesis, which is stated in the alternative form:
We expect that firms with ROE over the past 3 years well above 6% will engage in more earnings management. Therefore, our empirical tests separately examine firms close to or below versus firms above the ROE threshold.
Finally, we also examine the effect of the dividend regulation on actual dividend payments. We do not hypothesize about the effects of the policy on actual cash dividends because it is unclear ex ante how firms will respond to the regulation. We predict that earnings management to influence the denominator of the payout ratio will occur for at least some sample firms. Moreover, it is possible that some sample firms will use earnings management rather than an increase in dividends to meet the mandated dividend payout threshold. However, it is also possible that some sample firms will respond by increasing cash dividends (i.e., the numerator of the payout ratio). As a result, we investigate how the regulation affects actual dividends to expand our assessment of the economic consequences of the policy reform.
Sample Selection and Research Design
Our sample selection begins with all firms listed on the Shanghai and Shenzhen stock exchanges from 2005 through 2012. 5 We obtain firm-level fundamental variables from China Stock Market and Accounting Research (CSMAR). Following the earnings management literature, we remove all firms in the financial and utilities industries because financial reporting in these industries is very different from that in other industries. Because we need to calculate the rolling-average dividend payout ratio over the past 3 years, we require that sample firms have at least 3 consecutive years of financial data. To form a meaningful measure of the average payout ratio over the past 3 years, we exclude firm-years where the average earnings over the past 3 years is negative. After requiring that the necessary data be available for all test variables, our final sample comprised 4,808 firm-year observations, from 2005 through 2011. 6
We strictly follow the text of the dividend reform and define the rolling 3-year average payout ratio as cumulative dividends as a fraction of average distributable net income over the past 3 years. We identify a firm as an affected firm if the rolling 3-year cumulative payout ratio is below 30%. 7 In addition, to differentiate between firms that did not pay cash dividends over the 3-year cumulative period and firms that paid some cash dividends but did not qualify for the mandated 30% threshold, we separate the affected firms into two groups represented by Nonpayer and Payout(0, 30). Specifically, Nonpayer takes a value 1 if the firm did not pay any cash dividends over the past 3 years and 0 otherwise. Payout(0, 30) takes a value 1 if the firm’s 3-year rolling cumulative payout ratio is greater than 0 but less than 30%, and 0 otherwise. Post takes a value 1 for observations that are in the year 2009 or later. 8 We have 4 years in the pre-reform period and 3 years in the post-reform period. 9 This design is similar to the one utilized by Duchin, Ozbas, and Sensoy (2010). The baseline test is specified as follows:
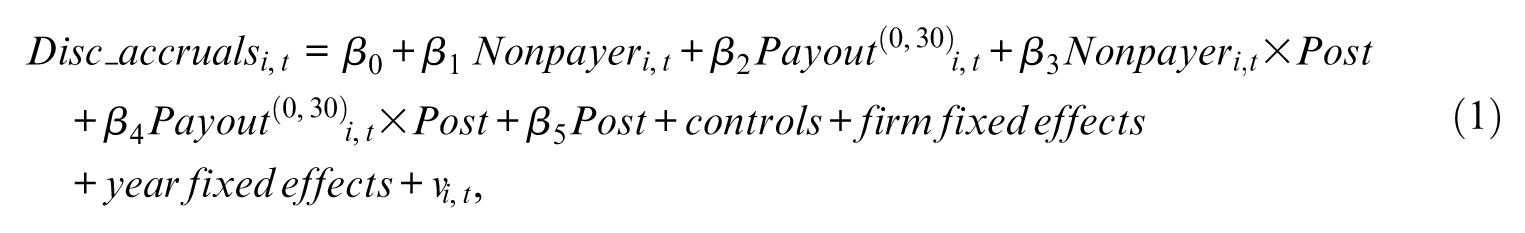
where the dependent variable Disc_accruals is signed discretionary accruals, estimated as the residual from the following modified Dechow and Dichev (2002) regression from McNichols (2002):
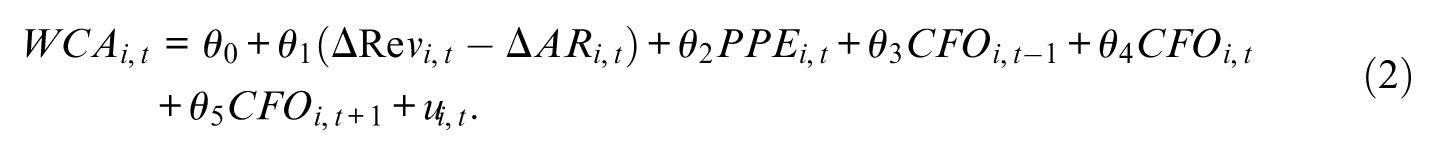
This model relies on the assumption that any accruals that are not related to the explanatory variables are subject to managerial discretion and are more likely to be manipulated. Specifically, we use WCA (working capital accruals, calculated as the difference between income before extraordinary items and cash flow from operations plus depreciation and amortization expense, scaled by lagged total assets) as the dependent variable. ΔRev−ΔAR (cash sales growth, calculated as the difference between sales growth and accounts receivable growth, scaled by lagged total assets), PPE (net property, plant and equipment, scaled by lagged total assets) and lagged, contemporaneous and lead CFO (cash flow from operations, scaled by lagged total assets) are the explanatory variables used to estimate nondiscretionary accruals. We estimate this equation by industry-year. 10 We use all firms with available data, including those reporting losses, when estimating Equation 2.
In Equation 1, we are interested in the coefficient on the interaction term between Post and Payout(0, 30), that is, β4. A negative coefficient indicates that firms that are affected by the dividend reform report lower abnormal accruals after the reform, and a positive coefficient indicates the opposite. If affected firms are trying to lower the denominator of the cumulative payout ratio, then β4 is expected to be negative. Alternatively, if firms are more concerned about investor perceptions of firm performance when they desire to raise equity capital, then there should be no or even positive earnings management accompanied by an increase in cash dividends. We do not make a prediction for β3, the coefficient on the interaction between Nonpayer and Post, as earnings management would only benefit a nondividend paying firm that decided to begin making cash dividend payments. We examine the behavior of these firms, however, in case the regulation prompts them to begin making cash dividend payments and to engage in downward earnings management.
To explore the possibility that firms with 3-year rolling cumulative payout ratios below 30% behave differentially, we divide the affected firms into two groups. We assign firms with a 3-year rolling cumulative payout ratio above 0 but below 20% to Payout(0,20), and we assign firms with 3-year rolling cumulative payout ratio greater than or equal to 20% but below 30% to Payout[20,30). We then decompose Payout(0,30) in Equation 1 into Payout(0, 20) and Payout[20,30), and reestimate the following equation:
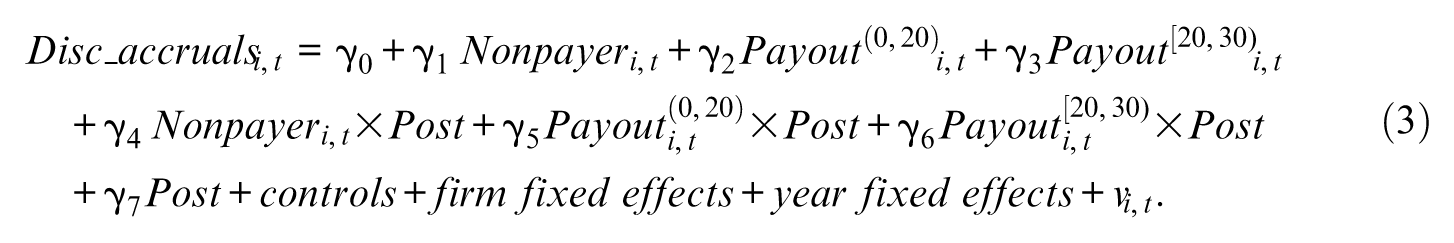
The coefficients of interest are the coefficients on the interactions between affected firms and the Post indicator, namely γ5 and γ6. In Equations 1 and 3, we include variables to control for other firm characteristics that determine firms’ accruals choices. We draw our control variables from Barton and Simko (2002), and Francis, LaFond, Olsson, and Schipper (2005). Specifically, we include Size (firm size, calculated as the natural logarithm of total assets), Leverage (the leverage ratio, calculated as the sum of long-term debt and the current portion of long-term debt, scaled by total assets), ROA (return on assets, calculated as income before extraordinary items scaled by total assets), BTM (book-to-market ratio, calculated as shareholders’ equity scaled by the end of fiscal-year price times total shares outstanding), Std(CFO) (standard deviation of cash flows, calculated as the standard deviation of cash flows from operations over a 3-year rolling window), Std(Sales) (standard deviation of sales, calculated as the standard deviation of sales over a 3-year rolling window), Cycle (operating cycle, the natural logarithm of the length of the operating cycle, calculated as the natural logarithm of the sum of days in accounts receivable and days in inventory), lagged NOA (lagged net operating assets, calculated as the sum of shareholders’ equity and interest-bearing debt, minus cash assets, scaled by sales), Big10 (a Big 10 auditor indicator variable set to 1 if the firm is audited by one of the largest 10 audit firms measured using audit fees, and 0 otherwise), Execholding (executive ownership, calculated as the shares owned by executives divided by total shares outstanding), and SOE (a state-owned enterprise indicator variable set to 1 if the ultimate owner is a government unit, and 0 otherwise). 11 We include firm fixed effects in estimating Equations 1 and 3 to ensure that our affected firm variables do not capture stable firm characteristics associated with discretionary accruals. We also include year fixed effects to ensure that our post-reform variable does not simply capture a time trend. We winsorize all continuous variables at the 1st and 99th percentiles to avoid the influence of outliers. We cluster standard errors by firm.
Empirical Results
Descriptive Statistics
We start our analysis by discussing the summary statistics presented in Table 1, Panel A. In total, we have 4,808 firm-year observations from 2005 through 2011. The sample mean of discretionary accruals is 0.003, consistent with its measurement as the residual from the modified Dechow and Dichev (2002) model. Our key independent variables are Nonpayer, Payout(0,30), Payout(0,20) and Payout[20,30). On average, 25.8% of sample firm-years do not pay cash dividends over the past 3-year rolling period, and 10.6% of firm-years have cumulative cash dividend payout ratios greater than 0 but below the mandated 30% requirement. When we assign firms that paid some cash dividends but have cumulative cash dividend payout ratios below 30% (i.e., firms identified by Payout(0,30)) to two subgroups, we find that 5.3% of firm-years have cumulative cash dividend payout ratios greater than 0 but below 20%, and another 5.3% of firm-years have cumulative cash dividend payout ratios in the [20%, 30%) interval.
Summary Statistics.
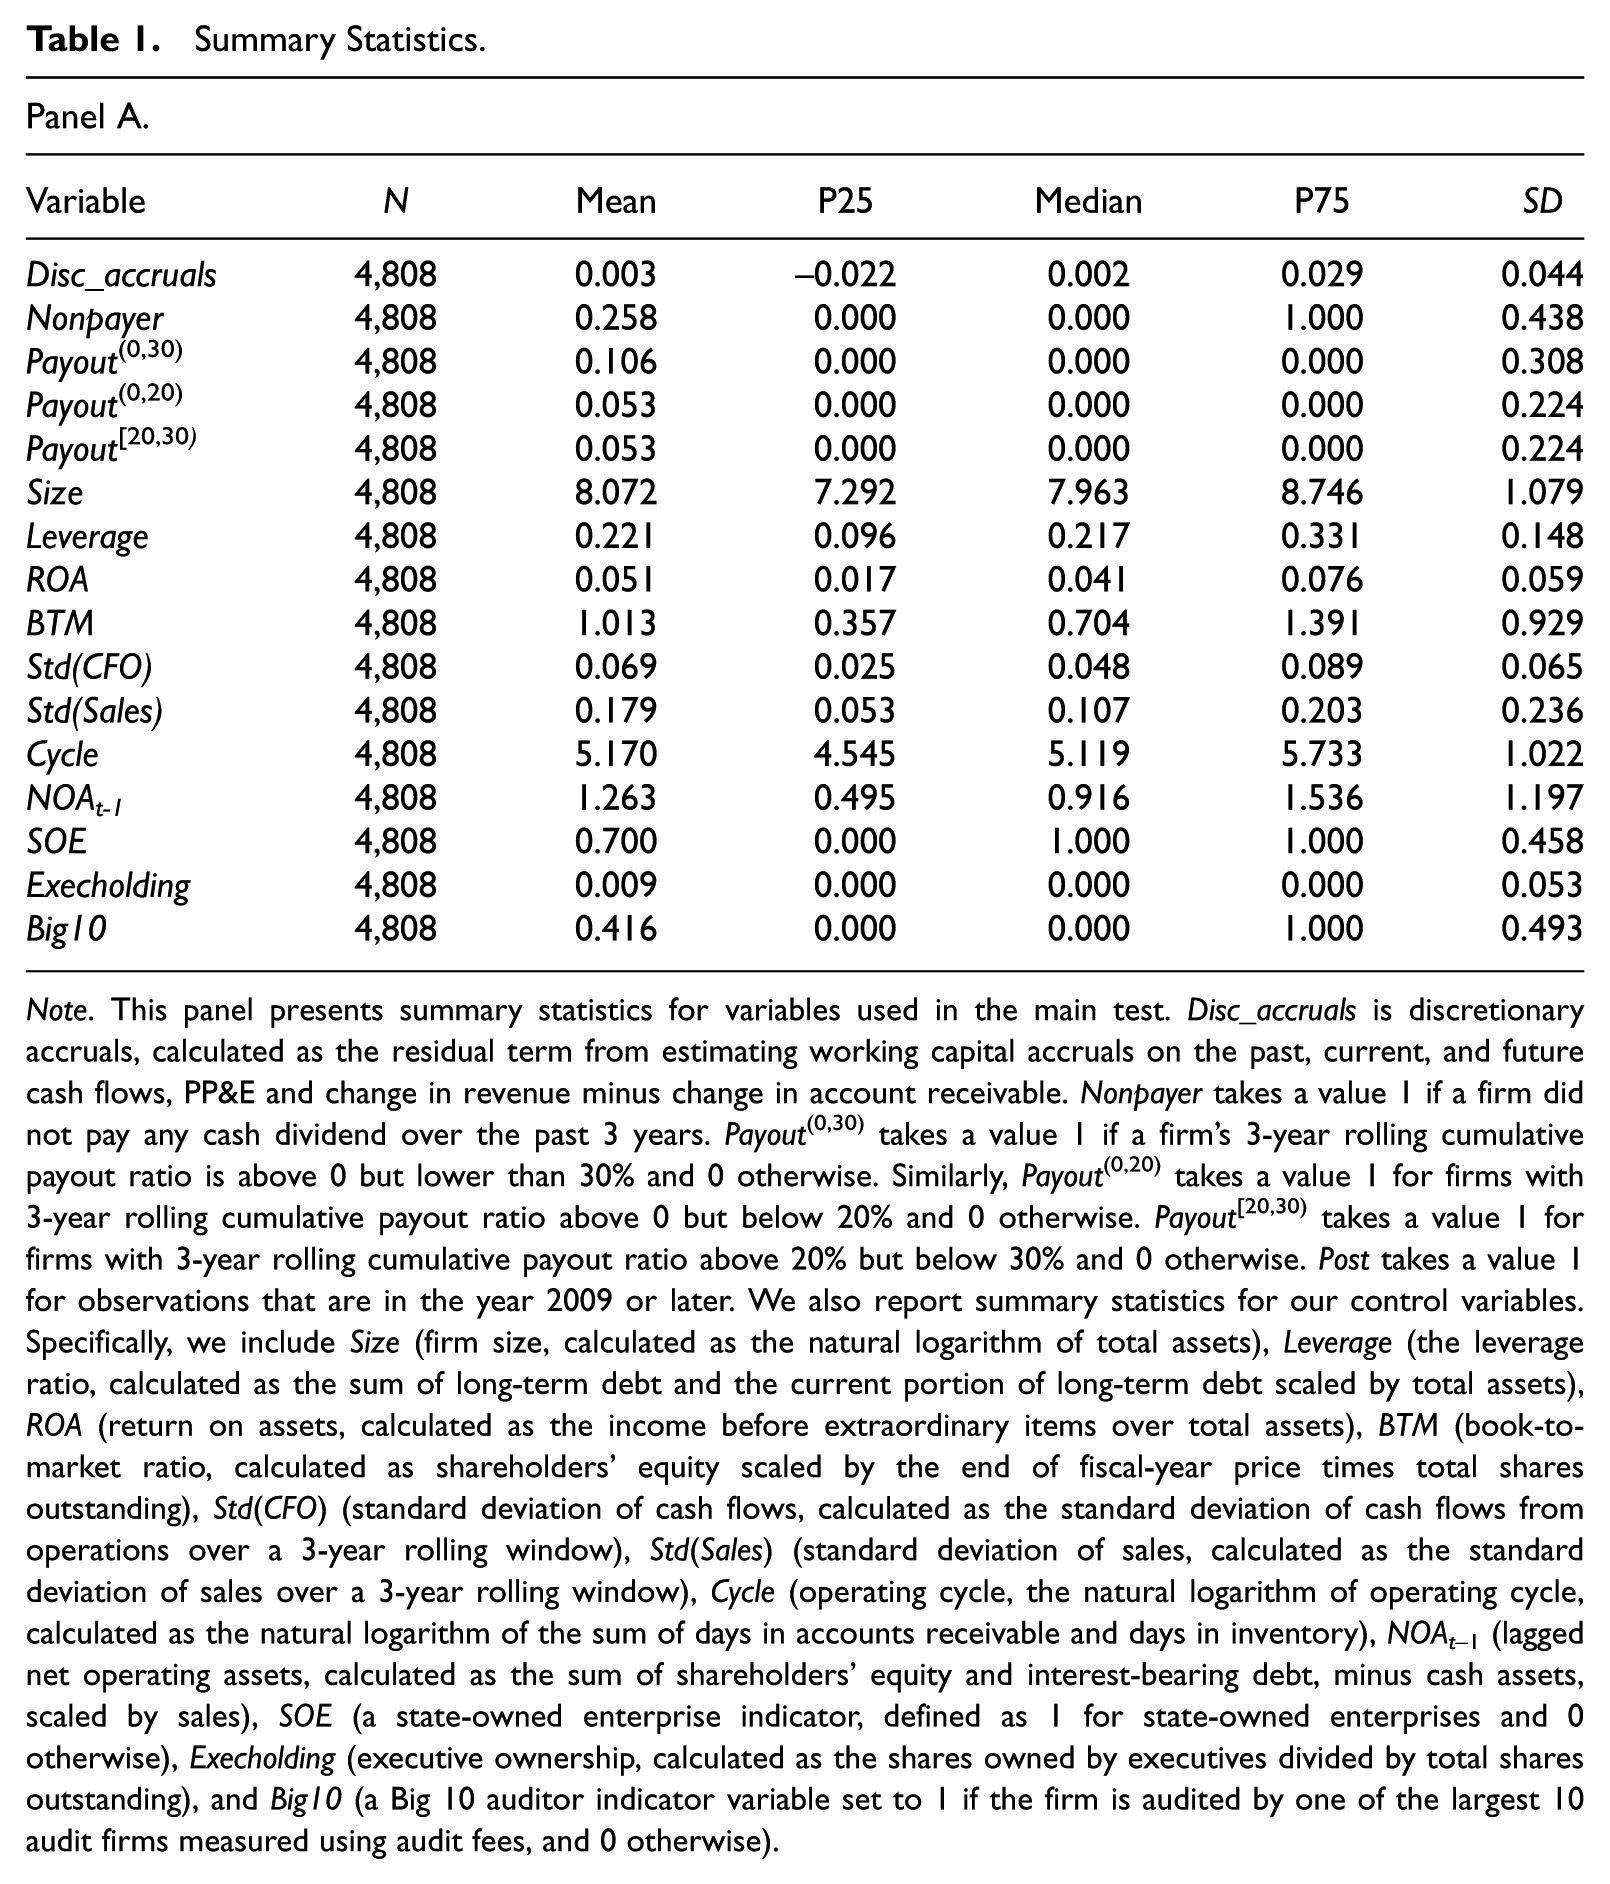
Note. This panel presents summary statistics for variables used in the main test. Disc_accruals is discretionary accruals, calculated as the residual term from estimating working capital accruals on the past, current, and future cash flows, PP&E and change in revenue minus change in account receivable. Nonpayer takes a value 1 if a firm did not pay any cash dividend over the past 3 years. Payout(0,30) takes a value 1 if a firm’s 3-year rolling cumulative payout ratio is above 0 but lower than 30% and 0 otherwise. Similarly, Payout(0,20) takes a value 1 for firms with 3-year rolling cumulative payout ratio above 0 but below 20% and 0 otherwise. Payout[20,30) takes a value 1 for firms with 3-year rolling cumulative payout ratio above 20% but below 30% and 0 otherwise. Post takes a value 1 for observations that are in the year 2009 or later. We also report summary statistics for our control variables. Specifically, we include Size (firm size, calculated as the natural logarithm of total assets), Leverage (the leverage ratio, calculated as the sum of long-term debt and the current portion of long-term debt scaled by total assets), ROA (return on assets, calculated as the income before extraordinary items over total assets), BTM (book-to-market ratio, calculated as shareholders’ equity scaled by the end of fiscal-year price times total shares outstanding), Std(CFO) (standard deviation of cash flows, calculated as the standard deviation of cash flows from operations over a 3-year rolling window), Std(Sales) (standard deviation of sales, calculated as the standard deviation of sales over a 3-year rolling window), Cycle (operating cycle, the natural logarithm of operating cycle, calculated as the natural logarithm of the sum of days in accounts receivable and days in inventory), NOAt−1 (lagged net operating assets, calculated as the sum of shareholders’ equity and interest-bearing debt, minus cash assets, scaled by sales), SOE (a state-owned enterprise indicator, defined as 1 for state-owned enterprises and 0 otherwise), Execholding (executive ownership, calculated as the shares owned by executives divided by total shares outstanding), and Big10 (a Big 10 auditor indicator variable set to 1 if the firm is audited by one of the largest 10 audit firms measured using audit fees, and 0 otherwise).
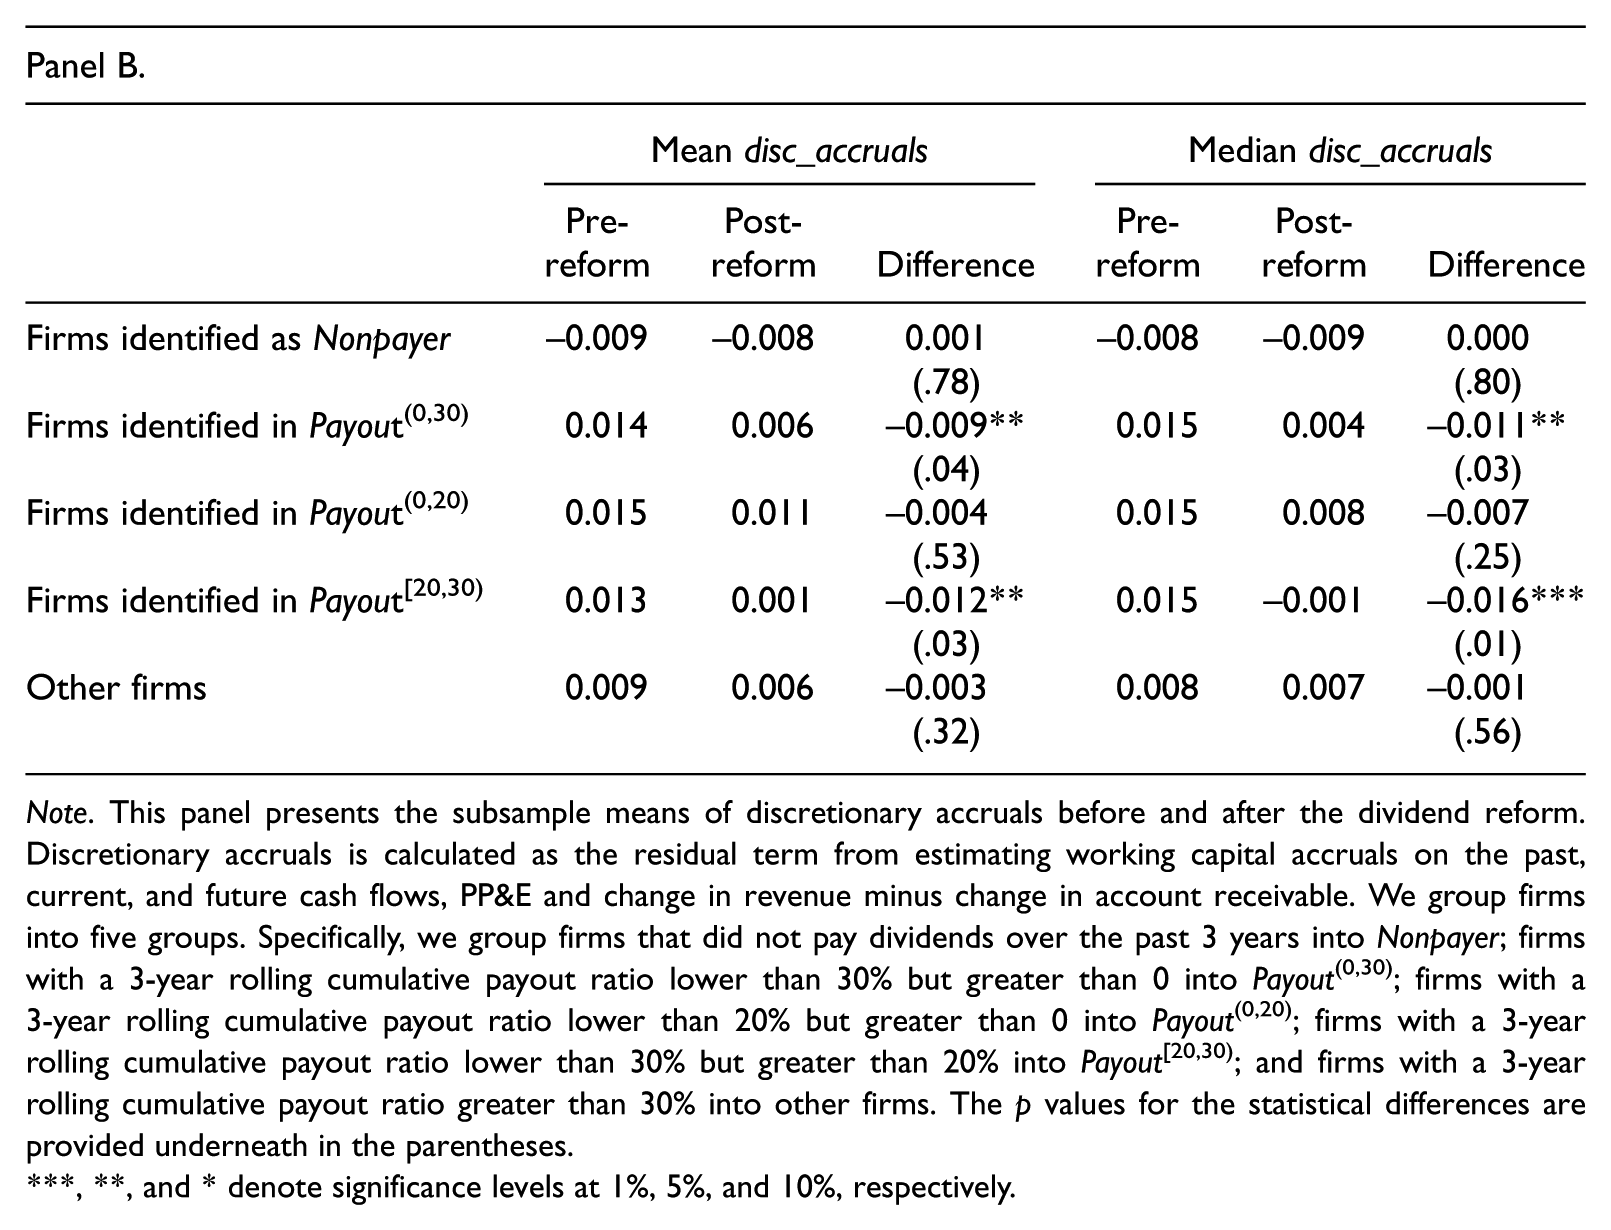
Note. This panel presents the subsample means of discretionary accruals before and after the dividend reform. Discretionary accruals is calculated as the residual term from estimating working capital accruals on the past, current, and future cash flows, PP&E and change in revenue minus change in account receivable. We group firms into five groups. Specifically, we group firms that did not pay dividends over the past 3 years into Nonpayer; firms with a 3-year rolling cumulative payout ratio lower than 30% but greater than 0 into Payout(0,30); firms with a 3-year rolling cumulative payout ratio lower than 20% but greater than 0 into Payout(0,20); firms with a 3-year rolling cumulative payout ratio lower than 30% but greater than 20% into Payout[20,30); and firms with a 3-year rolling cumulative payout ratio greater than 30% into other firms. The p values for the statistical differences are provided underneath in the parentheses.
, **, and * denote significance levels at 1%, 5%, and 10%, respectively.
In Table 1, Panel B, we present subsample means of discretionary accruals. The dependent variable Disc_accruals is estimated as the residual term from Equation 2. Among firms that did not pay dividends over the past 3 years, average discretionary accruals before and after the reform are −0.009 and −0.008, respectively. The difference in these discretionary accruals is not statistically significant. More importantly, among firms with a 3-year rolling cumulative payout ratio lower than 30% but greater than 0, the average discretionary accruals before and after the reform are 0.014 and 0.006, respectively. Firms in this group decreased their discretionary accruals after the reform. This reduction is statistically significant at the 5% level. When we further partition firms in this group, we find that this reduction in discretionary accruals is mainly driven by firms with 3-year rolling cumulative payout ratios greater than 20%. Firms in Payout[20,30) have average discretionary accruals of 0.013 before the reform but decrease their discretionary accruals by 0.012, so that after the reform, discretionary accruals are 0.001 for this group. This reduction is economically large and statistically significant at the 5% level. Median discretionary accruals exhibit a similar pattern. Control firms (represented by “Other firms” in Panel B) do not exhibit a statistically significant change in discretionary accruals between the pre- and post periods.
We also plot histograms of cumulative dividend payout ratios before and after the reform. The histograms are presented in Figure 1, and only nonzero cumulative payout ratios are presented. We first plot the distributions before and after the reform separately and then overlay the two distributions together. The figure shows what one might expect to see in response to the establishment of the 30% dividend payout threshold. Specifically, there is a noticeable shift in the distribution of dividend payout ratios to the band just above 0.3. There is also a noticeable shift in the distribution to the bands that are closest to the 0.3 through 0.4 band. The graph also reveals that this increase in cumulative payout ratios around the 0.3 threshold comes from firms that had cumulative payout ratios below 0.3 prior to the regulation and from firms that had payout ratios above 0.3 prior to the regulation.
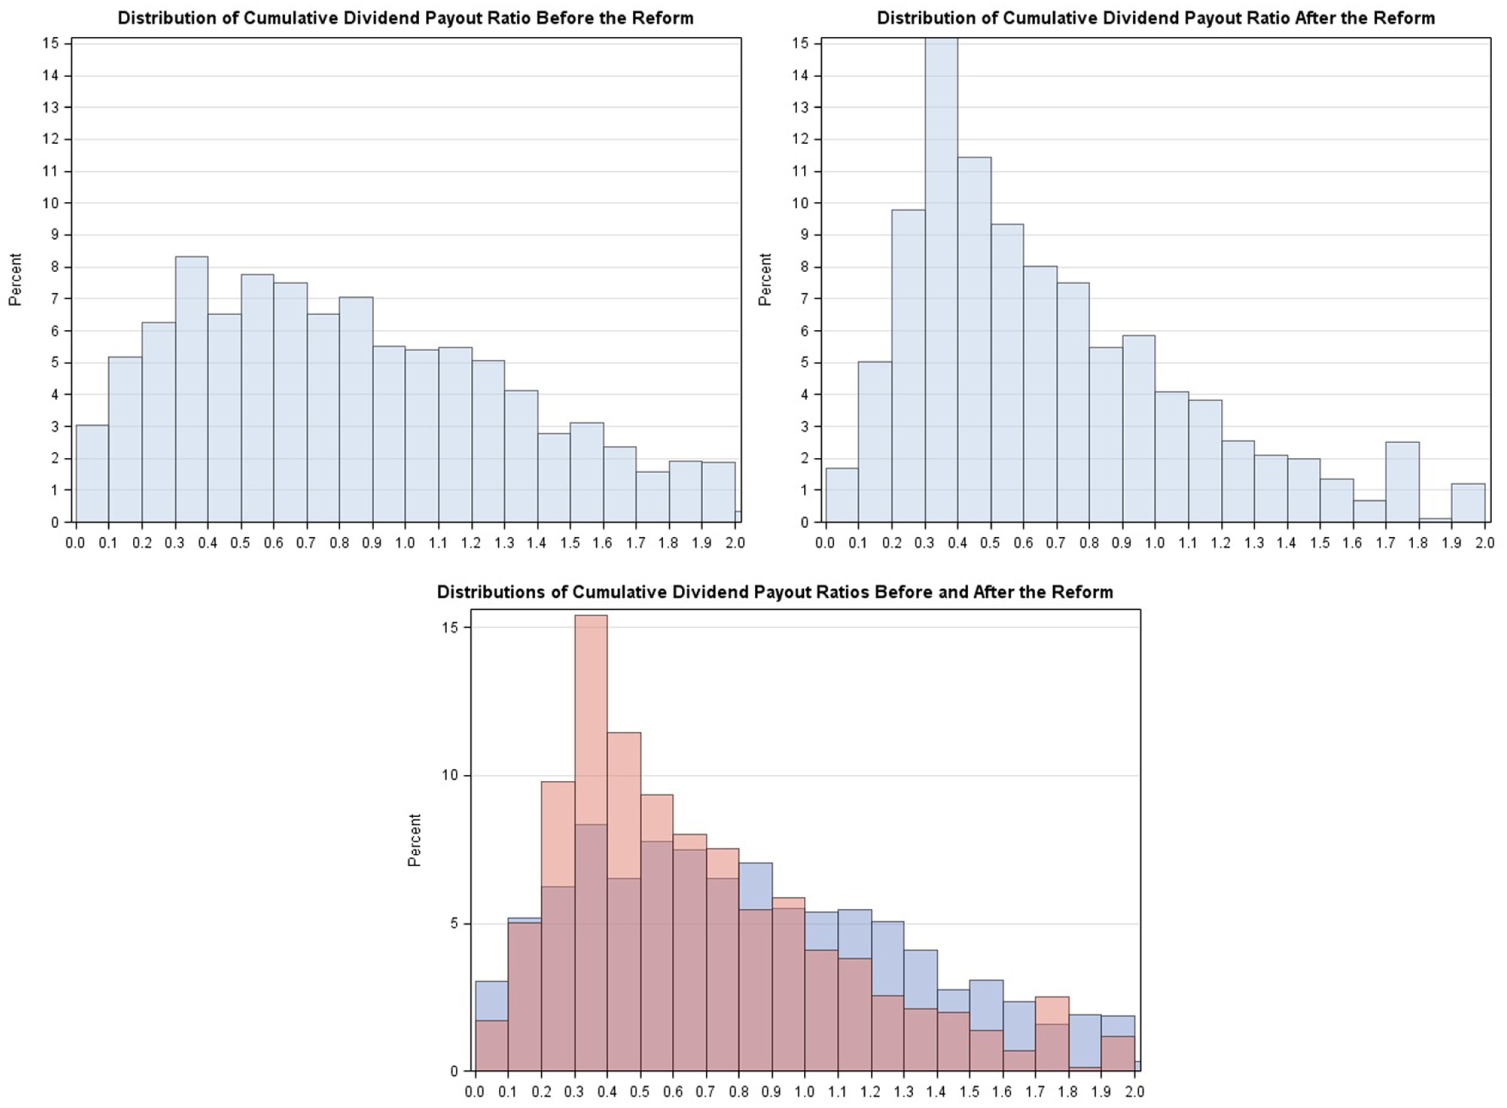
The distributions of cumulative dividend payout ratios before and after the reform.
Main Results
Table 2 presents the main results from estimating Equations 1 and 3. Specifically, we regress discretionary accruals on the Post indicator variable, indicator variables that identify affected firms as well as their interactions. We are primarily interested in the coefficients on the interaction terms. In column 1, we test the affected firms captured by the Payout(0, 30) indicator variable. The coefficient on Nonpayer is −0.00194 and is not statistically significant at conventional levels. The coefficient on Post×Nonpayer is close to 0 and is not statistically different from 0 at conventional levels, suggesting that the discretionary accruals for firms that did not pay any cash dividends over the past 3 years do not change after the dividend reform. In contrast, the coefficient on Post×Payout(0,30) is negative (β = −.00676) and is statistically significant at the 10% level, indicating that firms with rolling 3-year cumulative cash dividend payout ratios greater than 0 but below the required threshold of 30% report lower discretionary accruals after the dividend reform. This suggests that firms close to the 30% cumulative dividend payout threshold attempt to meet or move closer to this threshold by lowering the denominator of the payout ratio. The coefficient on Post is negative and statistically significant at the 1% level. This, coupled with the insignificant coefficient on the Post × Nonpayer interaction, indicates that firms that did not pay dividends and firms with cumulative dividend payout that exceeded the 30% threshold report lower discretionary accruals in the post period. This shift is probably due to the effects of the financial crisis rather than the dividend payout reform, and highlights the importance of using a difference-in-differences research design in this setting.
Main Results.
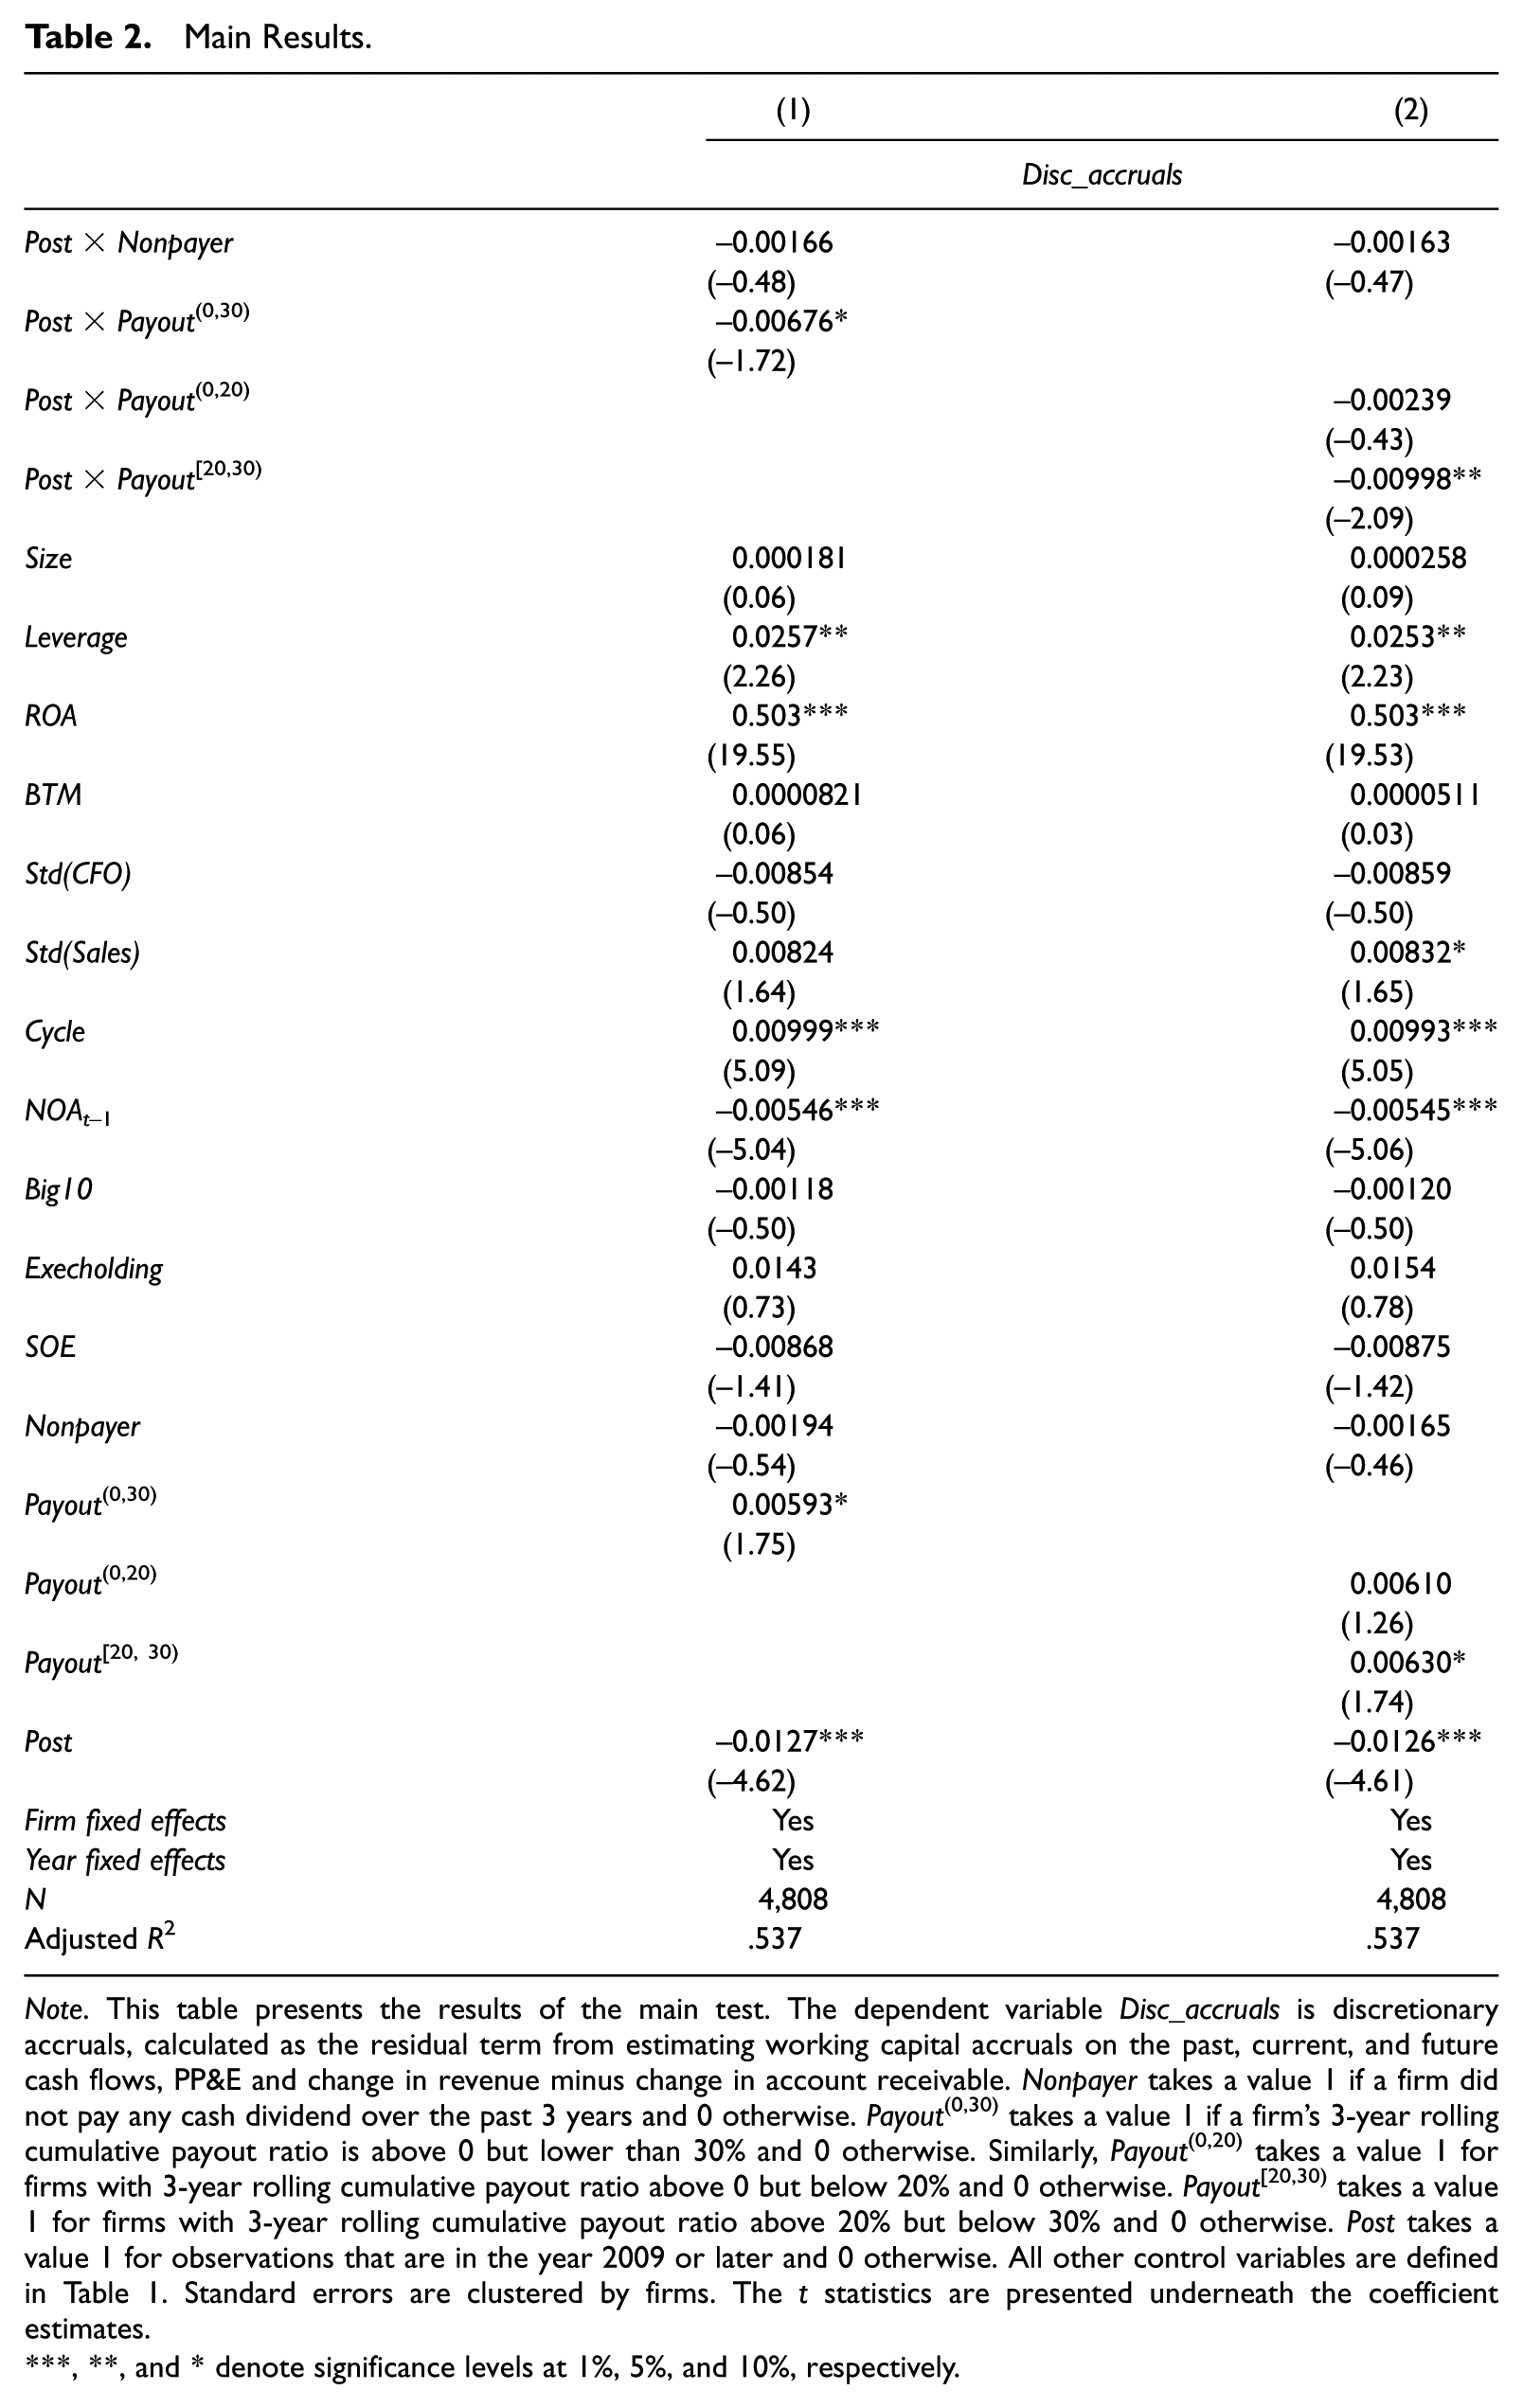
Note. This table presents the results of the main test. The dependent variable Disc_accruals is discretionary accruals, calculated as the residual term from estimating working capital accruals on the past, current, and future cash flows, PP&E and change in revenue minus change in account receivable. Nonpayer takes a value 1 if a firm did not pay any cash dividend over the past 3 years and 0 otherwise. Payout(0,30) takes a value 1 if a firm’s 3-year rolling cumulative payout ratio is above 0 but lower than 30% and 0 otherwise. Similarly, Payout(0,20) takes a value 1 for firms with 3-year rolling cumulative payout ratio above 0 but below 20% and 0 otherwise. Payout[20,30) takes a value 1 for firms with 3-year rolling cumulative payout ratio above 20% but below 30% and 0 otherwise. Post takes a value 1 for observations that are in the year 2009 or later and 0 otherwise. All other control variables are defined in Table 1. Standard errors are clustered by firms. The t statistics are presented underneath the coefficient estimates.
, **, and * denote significance levels at 1%, 5%, and 10%, respectively.
In column 2, we decompose Payout(0,30) into Payout(0,20) and Payout[20,30) to allow for different reactions for firms with cumulative payout ratios in the (0, 20%) versus [20%, 30%) ranges. The coefficient on Post×Payout[20,30) is −0.00998 and is statistically different from 0 at the 5% level. In contrast, the coefficient on Post×Payout(0,20) is −0.00239 and is statistically indistinguishable from 0 at conventional levels. Only the subset of firms with cumulative dividend payout ratios close to but slightly lower than the required 30% threshold engage in earnings management by decreasing their discretionary accruals after the dividend payout regulation.
The coefficients on the control variables in columns 1 and 2 are largely consistent with previous literature with the expected signs. In particular, the coefficient on ROA is positive, suggesting that more profitable firms report higher accruals. The coefficient on Cycle is positive, consistent with firms with longer operating cycles reporting higher accruals (Francis, LaFond, Schipper, & Olsson, 2005). The coefficient on lagged net operating assets NOAt−1 is negative, consistent with the findings of Barton and Simko (2002) that firms with an inflated balance sheet are less likely to use income-increasing earnings management. Firms with higher leverage report higher accruals, and state-owned enterprises report marginally lower accruals. Coefficients on other control variables are generally not significant at conventional levels. Overall, Equations 1 and 2 yield adjusted R2s of around 54%. To summarize, these findings suggest that firms close to the required dividend payout threshold lower their discretionary accruals to qualify for the dividend payout requirement. Because results in column 2 indicate that the downward earnings management we observe is concentrated in firms with payout ratios between 20% and 30%, we next perform cross-sectional tests using the specification in Equation 3.
Analyses of Cross-Sectional Variation
The effect of cash flow deficits
In Table 3, we follow Frank and Goyal (2003) and Naranjo et al. (2015), and use a measure of cash flow deficit to partition firms. Cash flow deficit is calculated as the sum of dividend payments and capital expenditures minus operating cash flow after interest and taxes, scaled by lagged total assets. 12 Note that this variable increases as the firms’ cash flow deficit becomes larger, and is negative for firms with adequate cash flow to fund their dividends, capital expenditures, and working capital. Specifically, we assign firms to the high cash flow deficit partition if their cash flow deficit measure is above the sample median, and assign firms to the low cash flow deficit partition otherwise. As shown in Table 3, we have 2,402 and 2,406 firm-year observations in the low cash flow deficit and high cash flow deficit partition, respectively.
The Moderating Effect of the Level of Cash Flow Deficit.
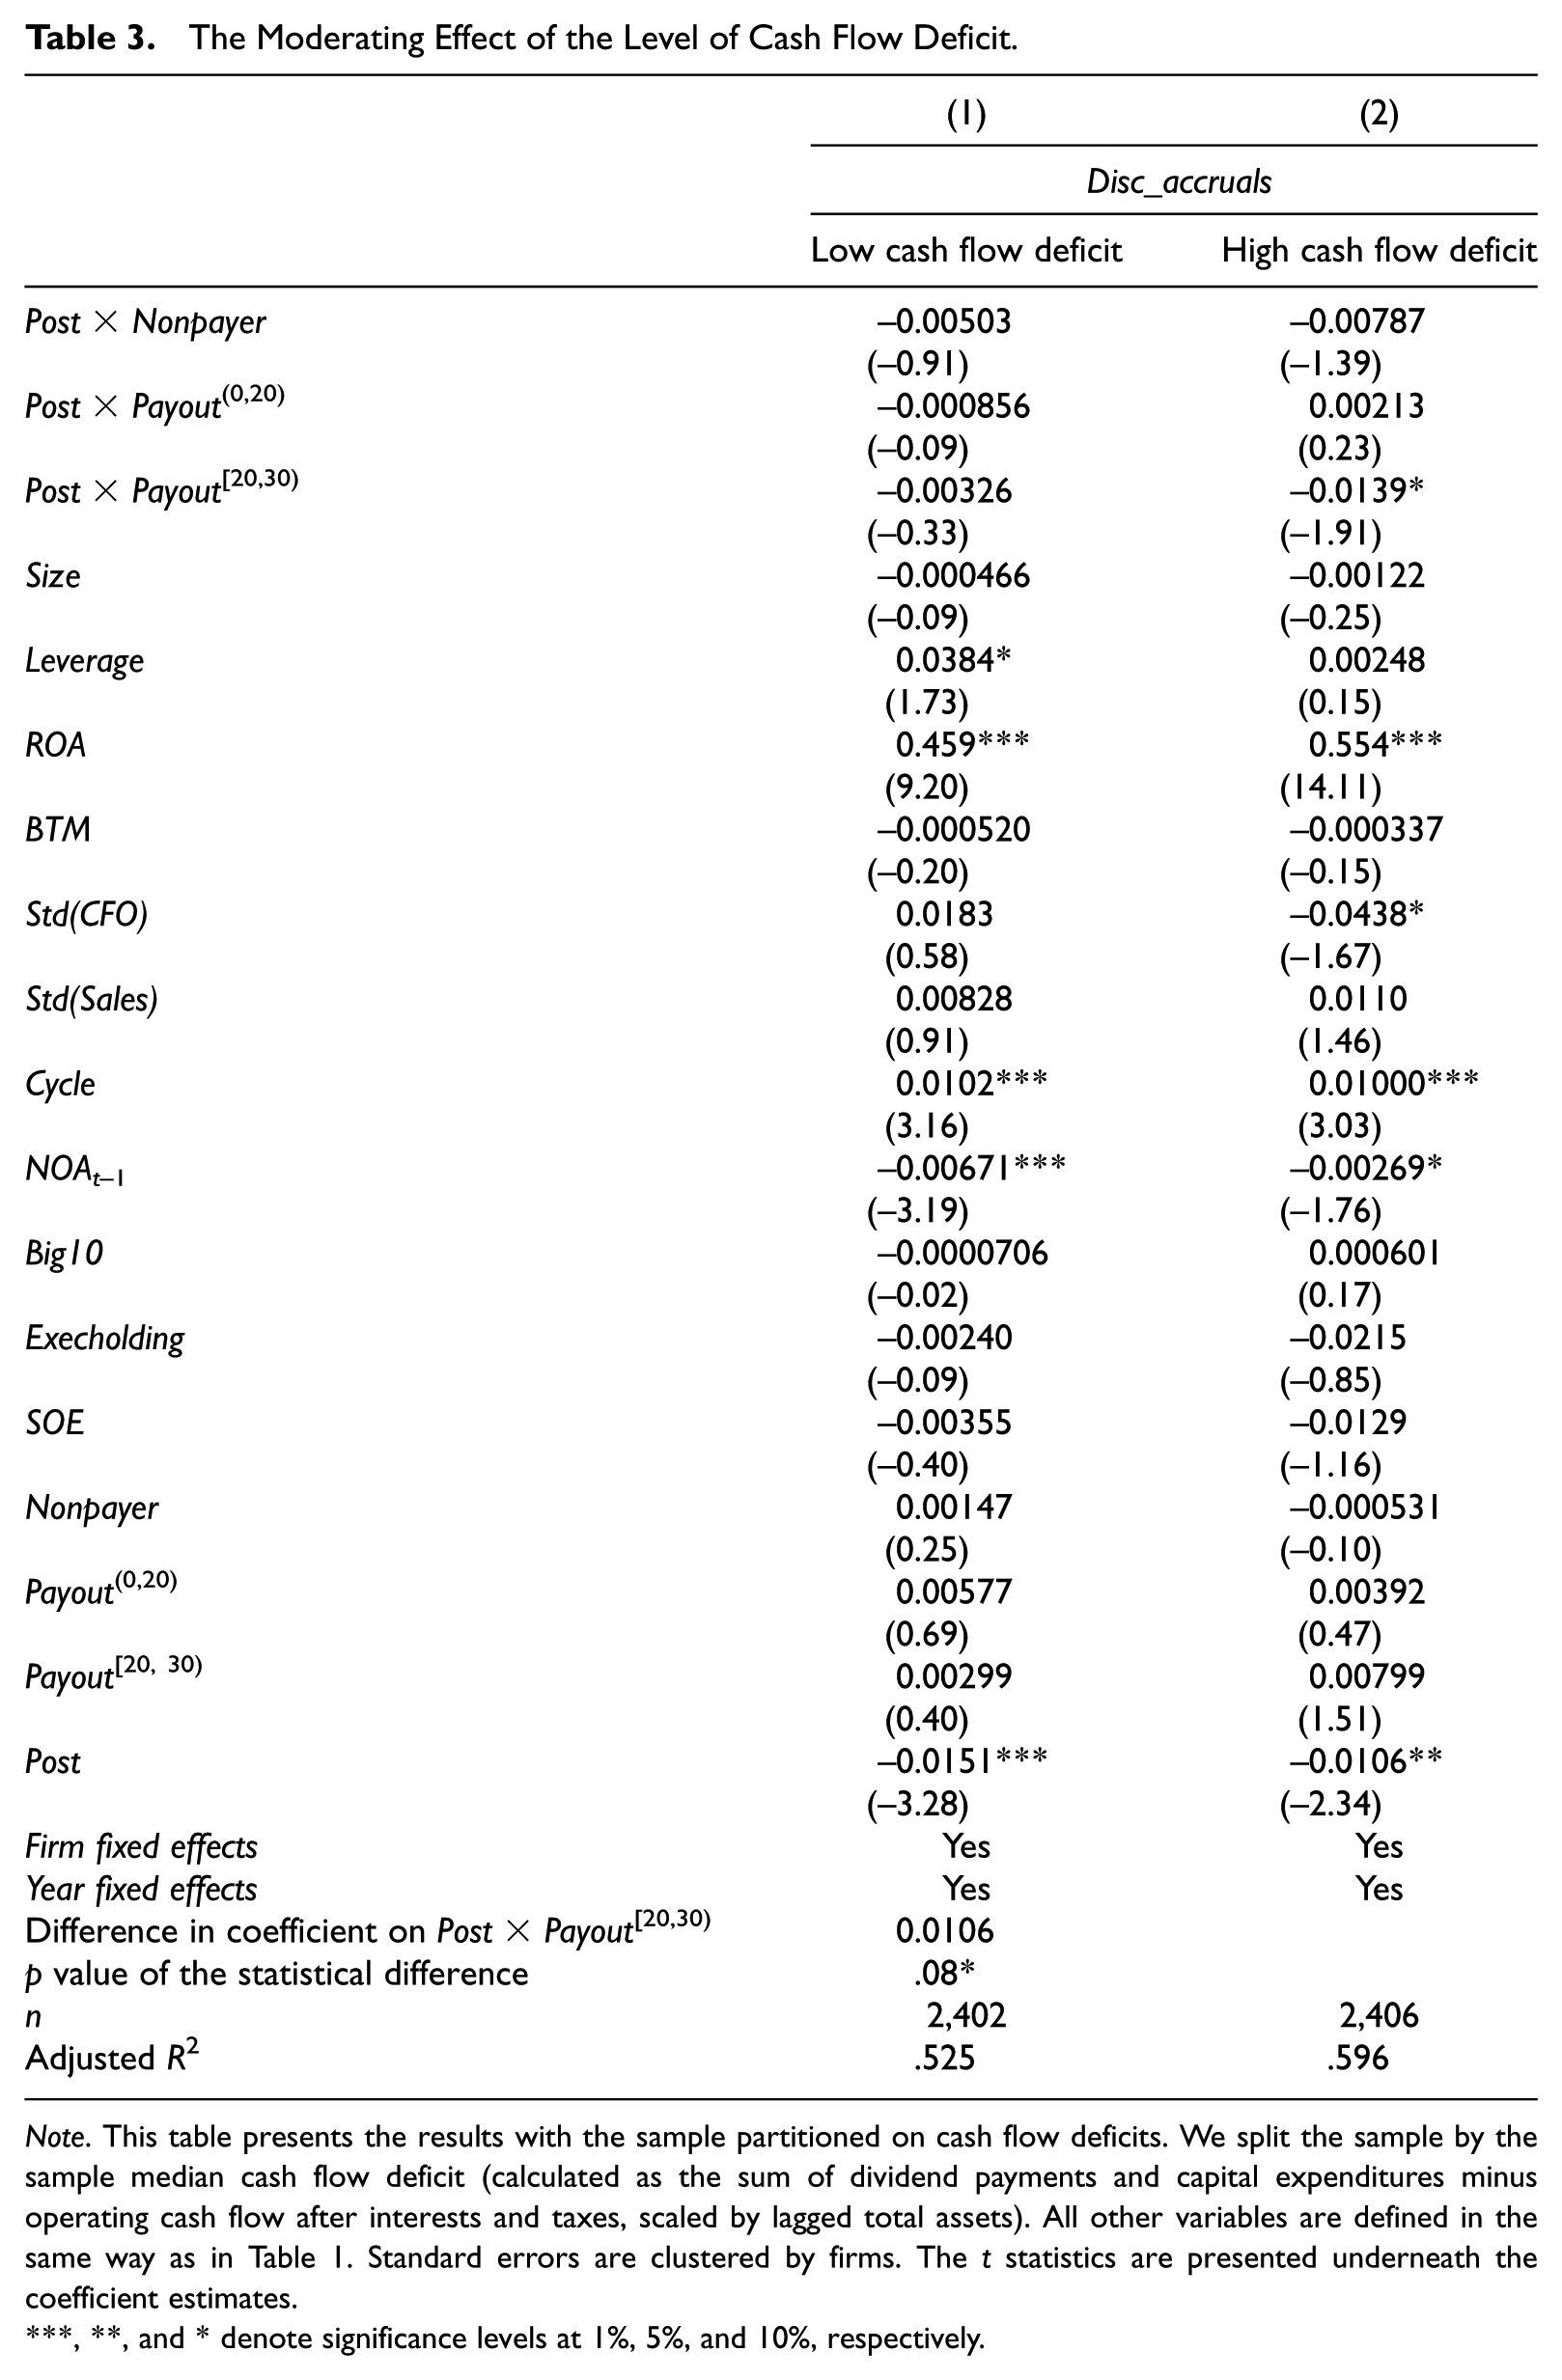
Note. This table presents the results with the sample partitioned on cash flow deficits. We split the sample by the sample median cash flow deficit (calculated as the sum of dividend payments and capital expenditures minus operating cash flow after interests and taxes, scaled by lagged total assets). All other variables are defined in the same way as in Table 1. Standard errors are clustered by firms. The t statistics are presented underneath the coefficient estimates.
, **, and * denote significance levels at 1%, 5%, and 10%, respectively.
As reported in column 1, the coefficient on Post×Payout[20,30) for the low cash flow deficit sample is −0.00326 and is not statistically different from 0 at conventional levels. In contrast, the coefficient on Post×Payout[20,30) for the high cash flow deficit sample is −0.0139, and is economically large and statistically significant at the 10% level. The difference between these two coefficients is economically and statistically significant (p value = .08). 13 Firms with a large cash flow deficit engage in more earnings management using discretionary accruals to influence the denominator in the dividend payout ratio after the mandatory dividend reform. Firms with smaller cash flow deficits do not appear to change their use of discretionary accruals after the reform. Coefficients on Post×Payout(0,20) in both samples are not statistically different from 0 at conventional levels. The coefficients on all other control variables are similar to those reported in Table 2. These results are consistent with H2, suggesting that firms with greater cash flow deficits are more likely to report lower discretionary accruals.
The effect of growth opportunities
Our second partitioning variable is past sales growth. We use the rolling prior 3-year sales growth to proxy for firms’ growth opportunities. In Table 4, we assign firms to the high growth partition if their rolling prior 3-year sales growth is above the sample median and to the low growth partition otherwise. We have 2,399 and 2,409 firm-year observations in the low growth partition and high growth partition, respectively. In column 1, the coefficient on Post × Payout[20,30) for the low growth partition is −0.00198 and is statistically indistinguishable from 0 at conventional levels. In contrast, the coefficient on Post × Payout[20,30) for the high growth sample is −0.0153, which is economically large and statistically significant at the 5% level. The difference between these two coefficients is economically and statistically significant (p value = .04). Coefficients on Post×Payout(0,20) in both samples are not statistically different from 0 at conventional levels. The coefficients on the control variables are similar to those reported in the previous tables. In summary, we conclude that high growth firms are more likely to engage in earnings management after the mandatory dividend reform. These results are consistent with H3.
The Moderating Effect of Past Sales Growth.
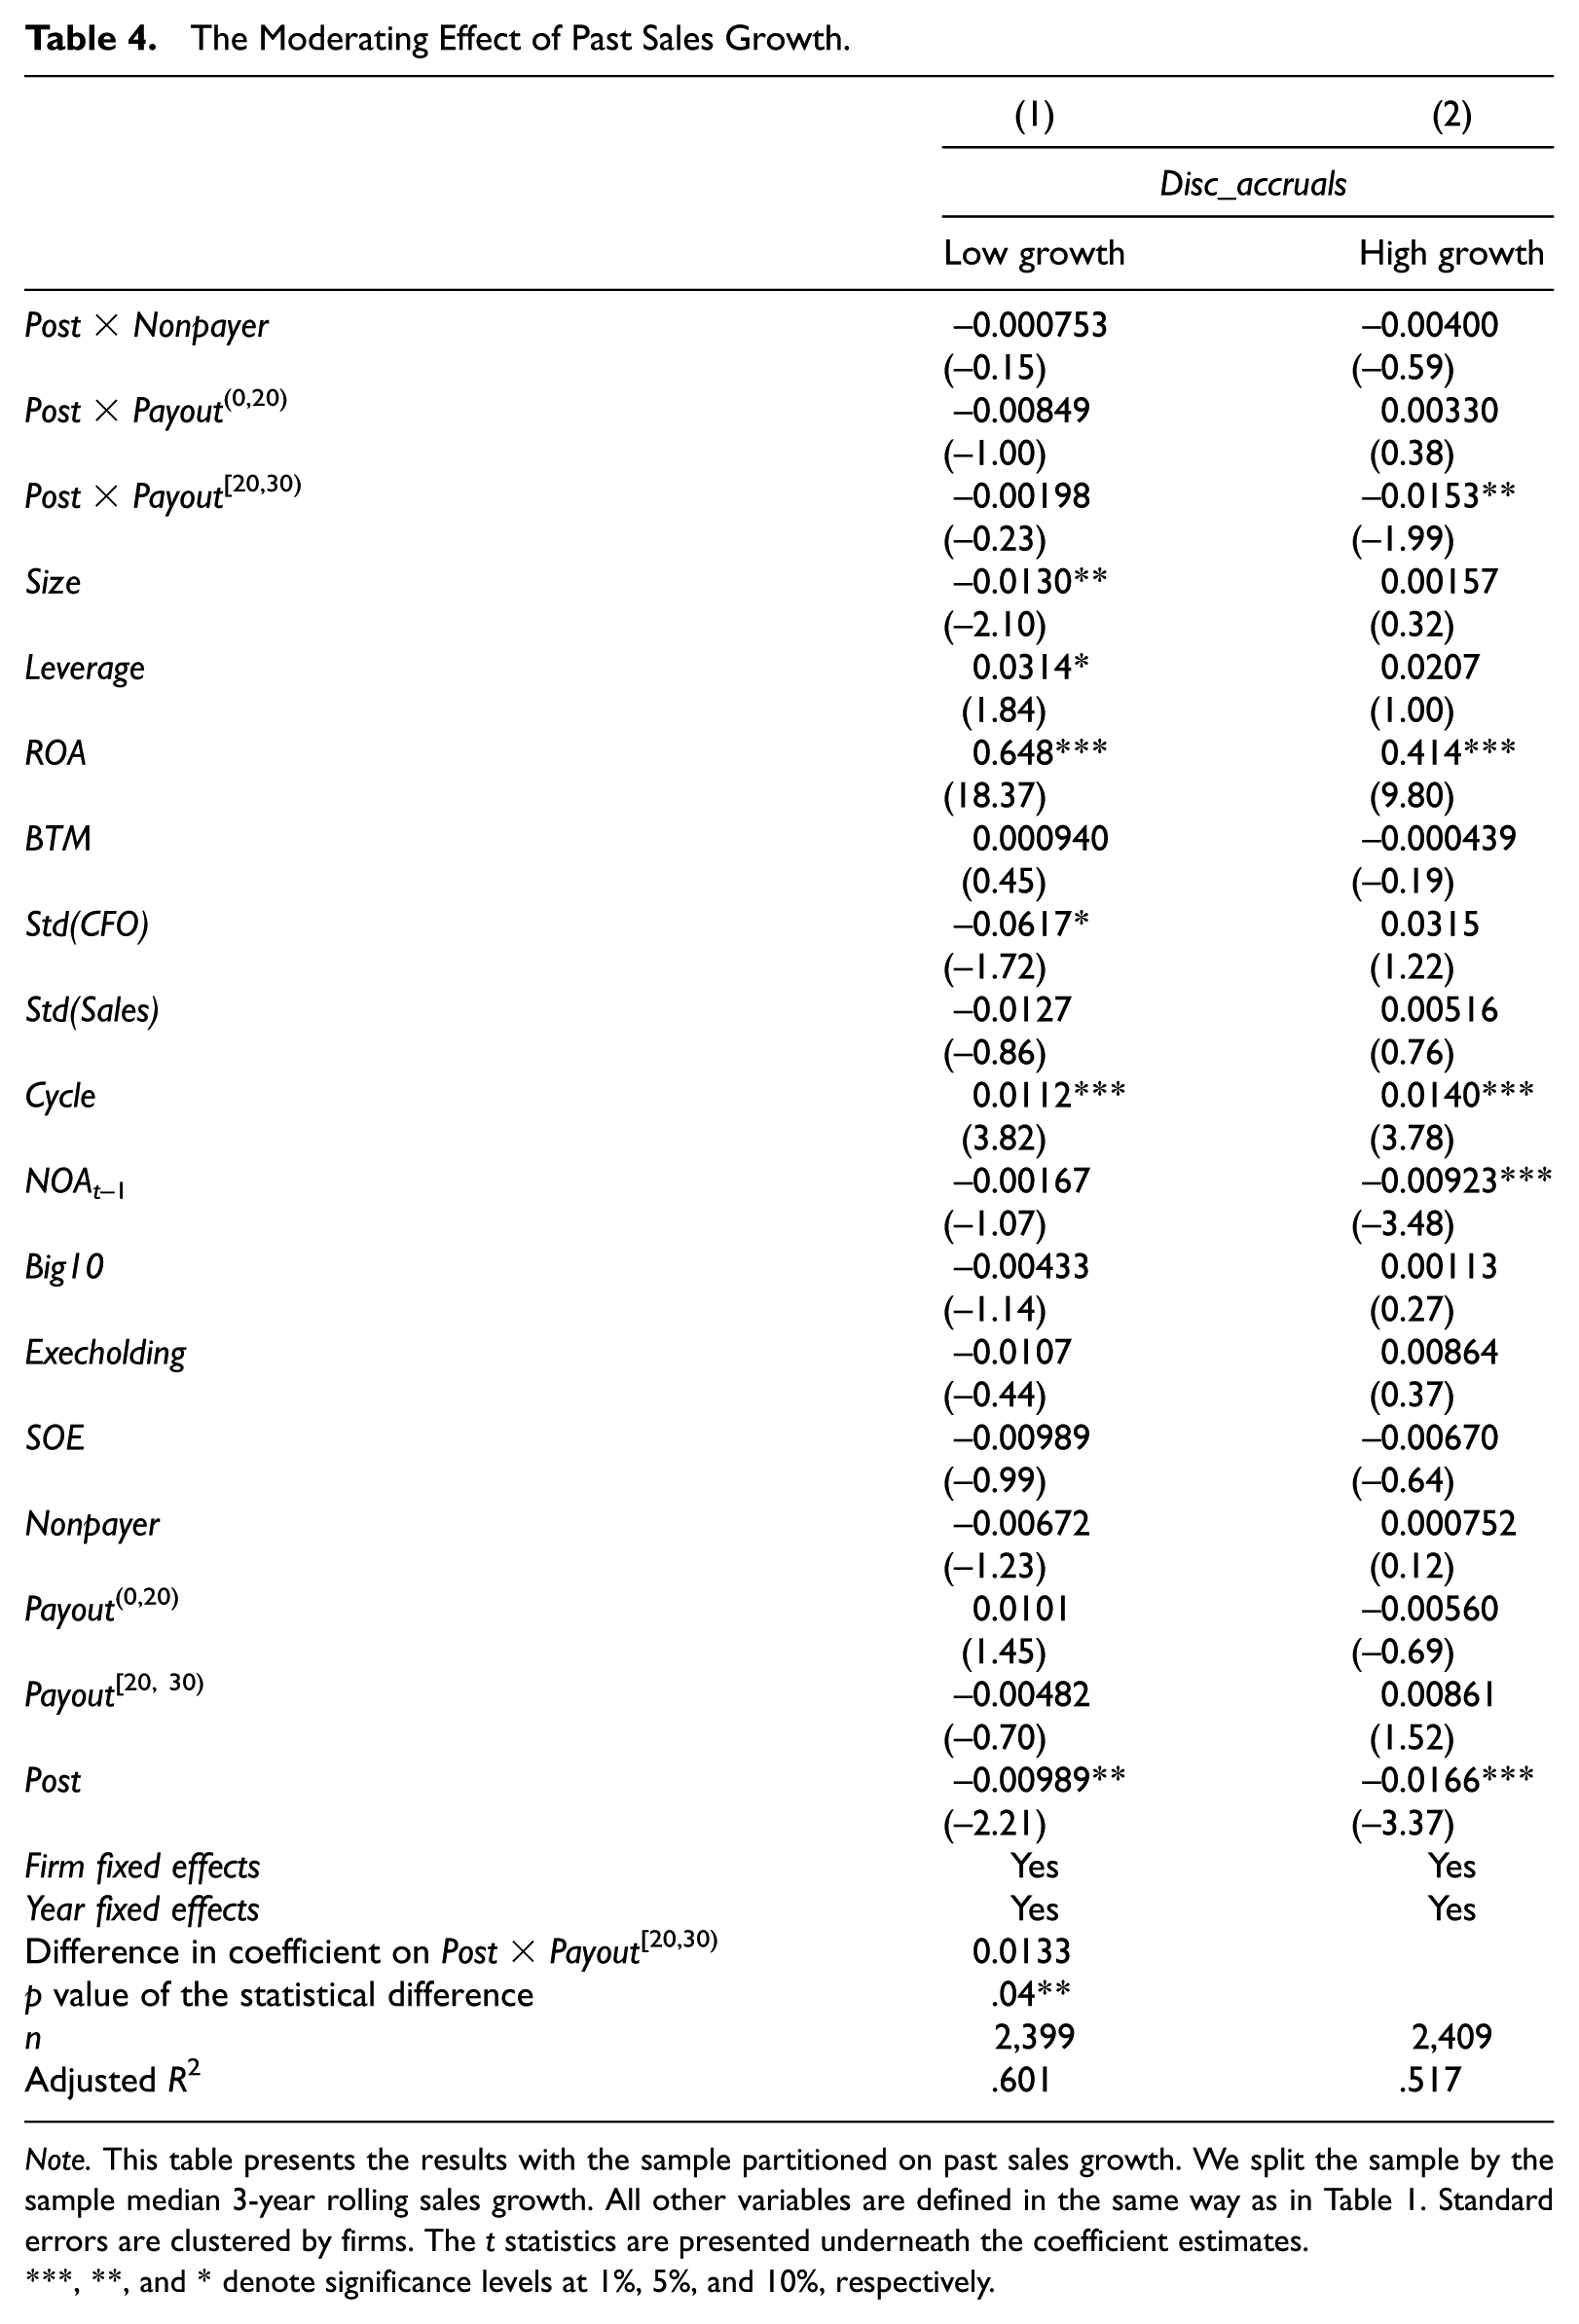
Note. This table presents the results with the sample partitioned on past sales growth. We split the sample by the sample median 3-year rolling sales growth. All other variables are defined in the same way as in Table 1. Standard errors are clustered by firms. The t statistics are presented underneath the coefficient estimates.
, **, and * denote significance levels at 1%, 5%, and 10%, respectively.
The effect of local bank market development
In China, the development of the banking market is uneven across provinces (Fan & Wang, 2011). Following Chen, Bushman, Wang, and Xiao (2013), we use the index from Fan and Wang (2011) to capture the development of the local banking infrastructure. In particular, Fan and Wang collect information from the National and Provincial Bureaus of Statistics, and assign a value ranging from 0 through 10 to each province to capture the bank market’s development in that province. We assign firms to the low bank market development partition if they are located in provinces with a below sample median bank market development index and to the high bank development partition otherwise. In particular, Zhejiang, Guangdong, Shanghai, Fujian, Hainan, Shandong, Jiangsu, Hunan, Hebei, and Beijing are the high bank market development provinces, and the other provinces are the low bank market development provinces. 14
We present the results with the sample partitioned by bank market development in Table 5. We focus our discussion on the key variables of interest. In column 1, the coefficient on Post × Payout[20, 30) in the high bank development sample is not significantly different from 0. In contrast, in column 2, the coefficient on Post × Payout[20, 30) in the low bank development sample is −0.0175 and is significantly different from 0 at the 5% level. The difference between these two coefficients is economically large and statistically significant (p value = .05). The coefficients on Post × Payout(0, 20) in both samples are not statistically different from 0 at conventional levels. The coefficients on other control variables are similar to those reported in previous tables. In summary, firms located in provinces in which banking is less developed are more likely to reduce their discretionary accruals to qualify for the dividend payout requirement, because alternative financing through bank loans is less available. These results are consistent with H4.
The Moderating Effect of Local Bank Market Development.
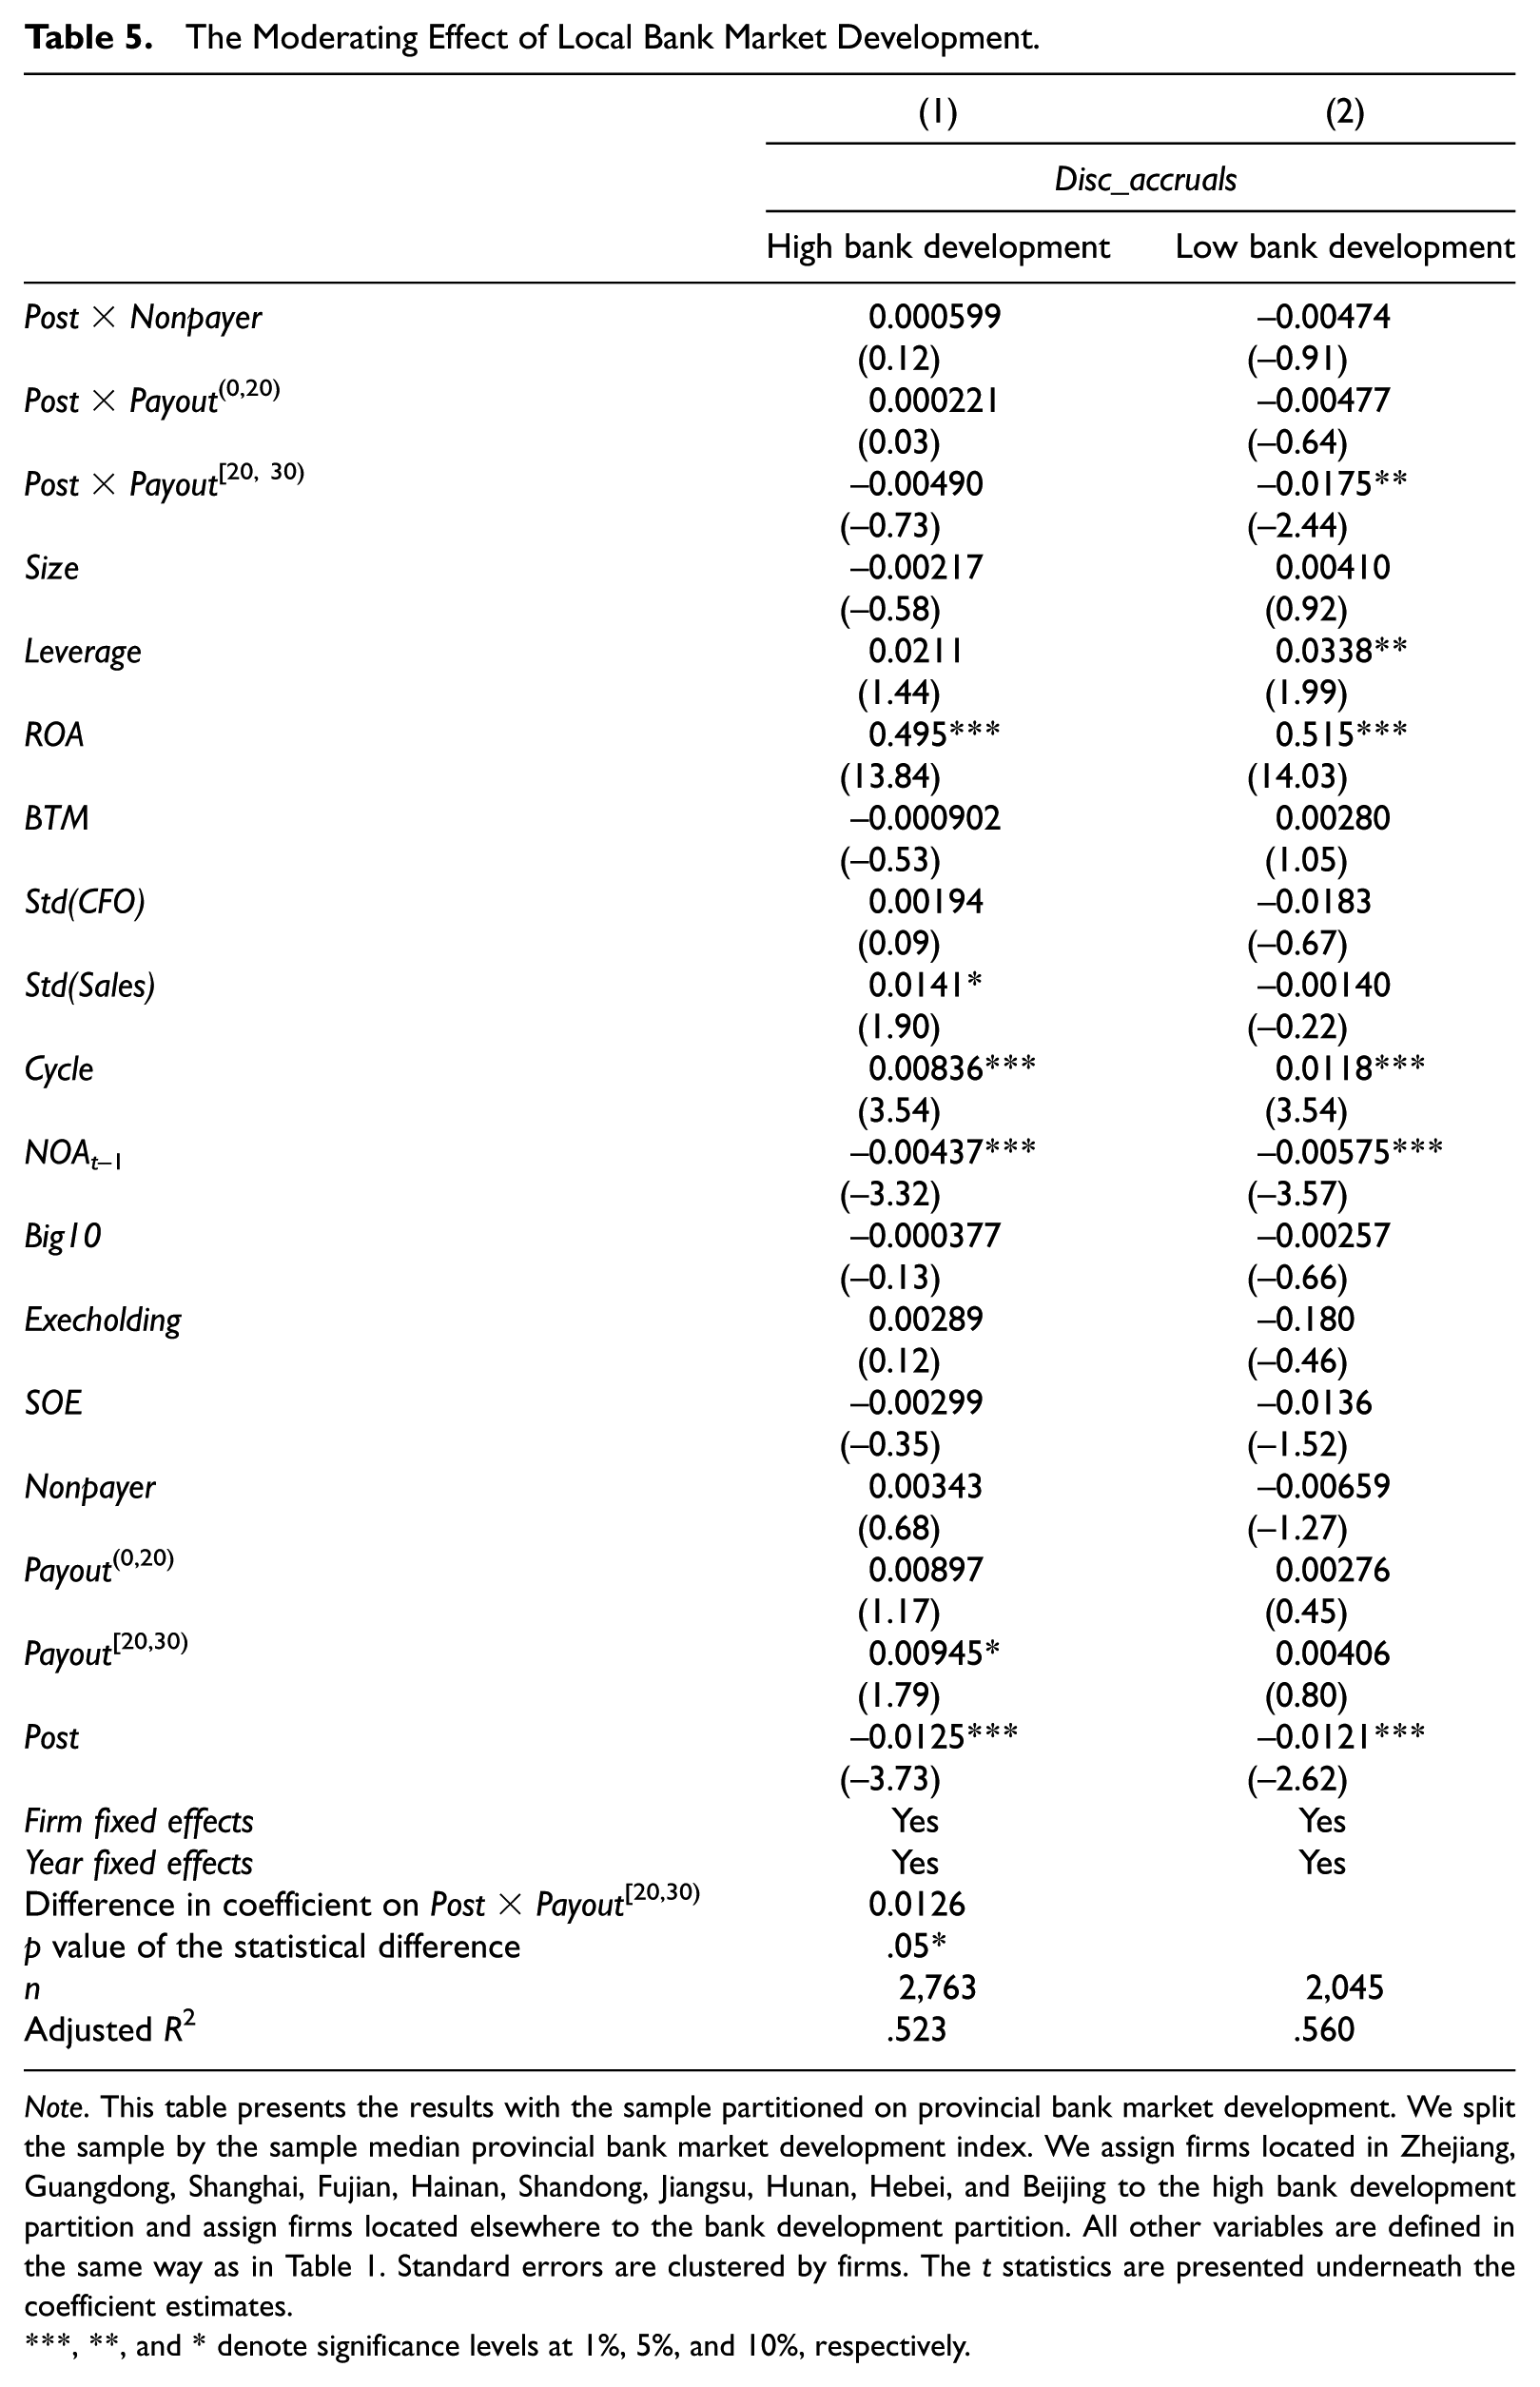
Note. This table presents the results with the sample partitioned on provincial bank market development. We split the sample by the sample median provincial bank market development index. We assign firms located in Zhejiang, Guangdong, Shanghai, Fujian, Hainan, Shandong, Jiangsu, Hunan, Hebei, and Beijing to the high bank development partition and assign firms located elsewhere to the bank development partition. All other variables are defined in the same way as in Table 1. Standard errors are clustered by firms. The t statistics are presented underneath the coefficient estimates.
, **, and * denote significance levels at 1%, 5%, and 10%, respectively.
The effect of the level of ROE
As discussed earlier, during our sample period, there is another requirement related to raising additional financing that could affect sample firms’ incentives for earnings management. Specifically, firms that wish to issue share rights to existing shareholders must have a ROE of at least 6% in the prior 3 years. We next investigate the effect of this threshold on sample firms by forming two samples. In particular, we examine firms that report ROE of 2% or more above this threshold (i.e., ROE≥ 0.08) separately from those firms that are closer to or below this threshold (i.e., ROE < 0.08). We expect that firms with ROE well above this threshold will be more willing to engage in downward earnings management to meet the dividend payout threshold because doing so would not cause them to fall below the ROE threshold. 15
We present results partitioned by ROE in Table 6. The coefficients on Post × Payout(0,20) in both samples are not statistically different from 0 at conventional levels. In column 1, when we estimate discretionary accruals for firms with ROE < 0.08, the coefficient on Post × Payout[20,30) is not significantly different from 0. In contrast, in column 2, the coefficient on Post × Payout[20,30) in the sample with ROE≥ 0.08 is −0.0148 and is significantly different from 0 at the 5% level. The difference in the coefficients on Post × Payout[20, 30) between columns 1 and 2 is statistically significant (p value = .02). The results reported in Table 6 are consistent with H5.
The Moderating Effect of Maintaining ROE.
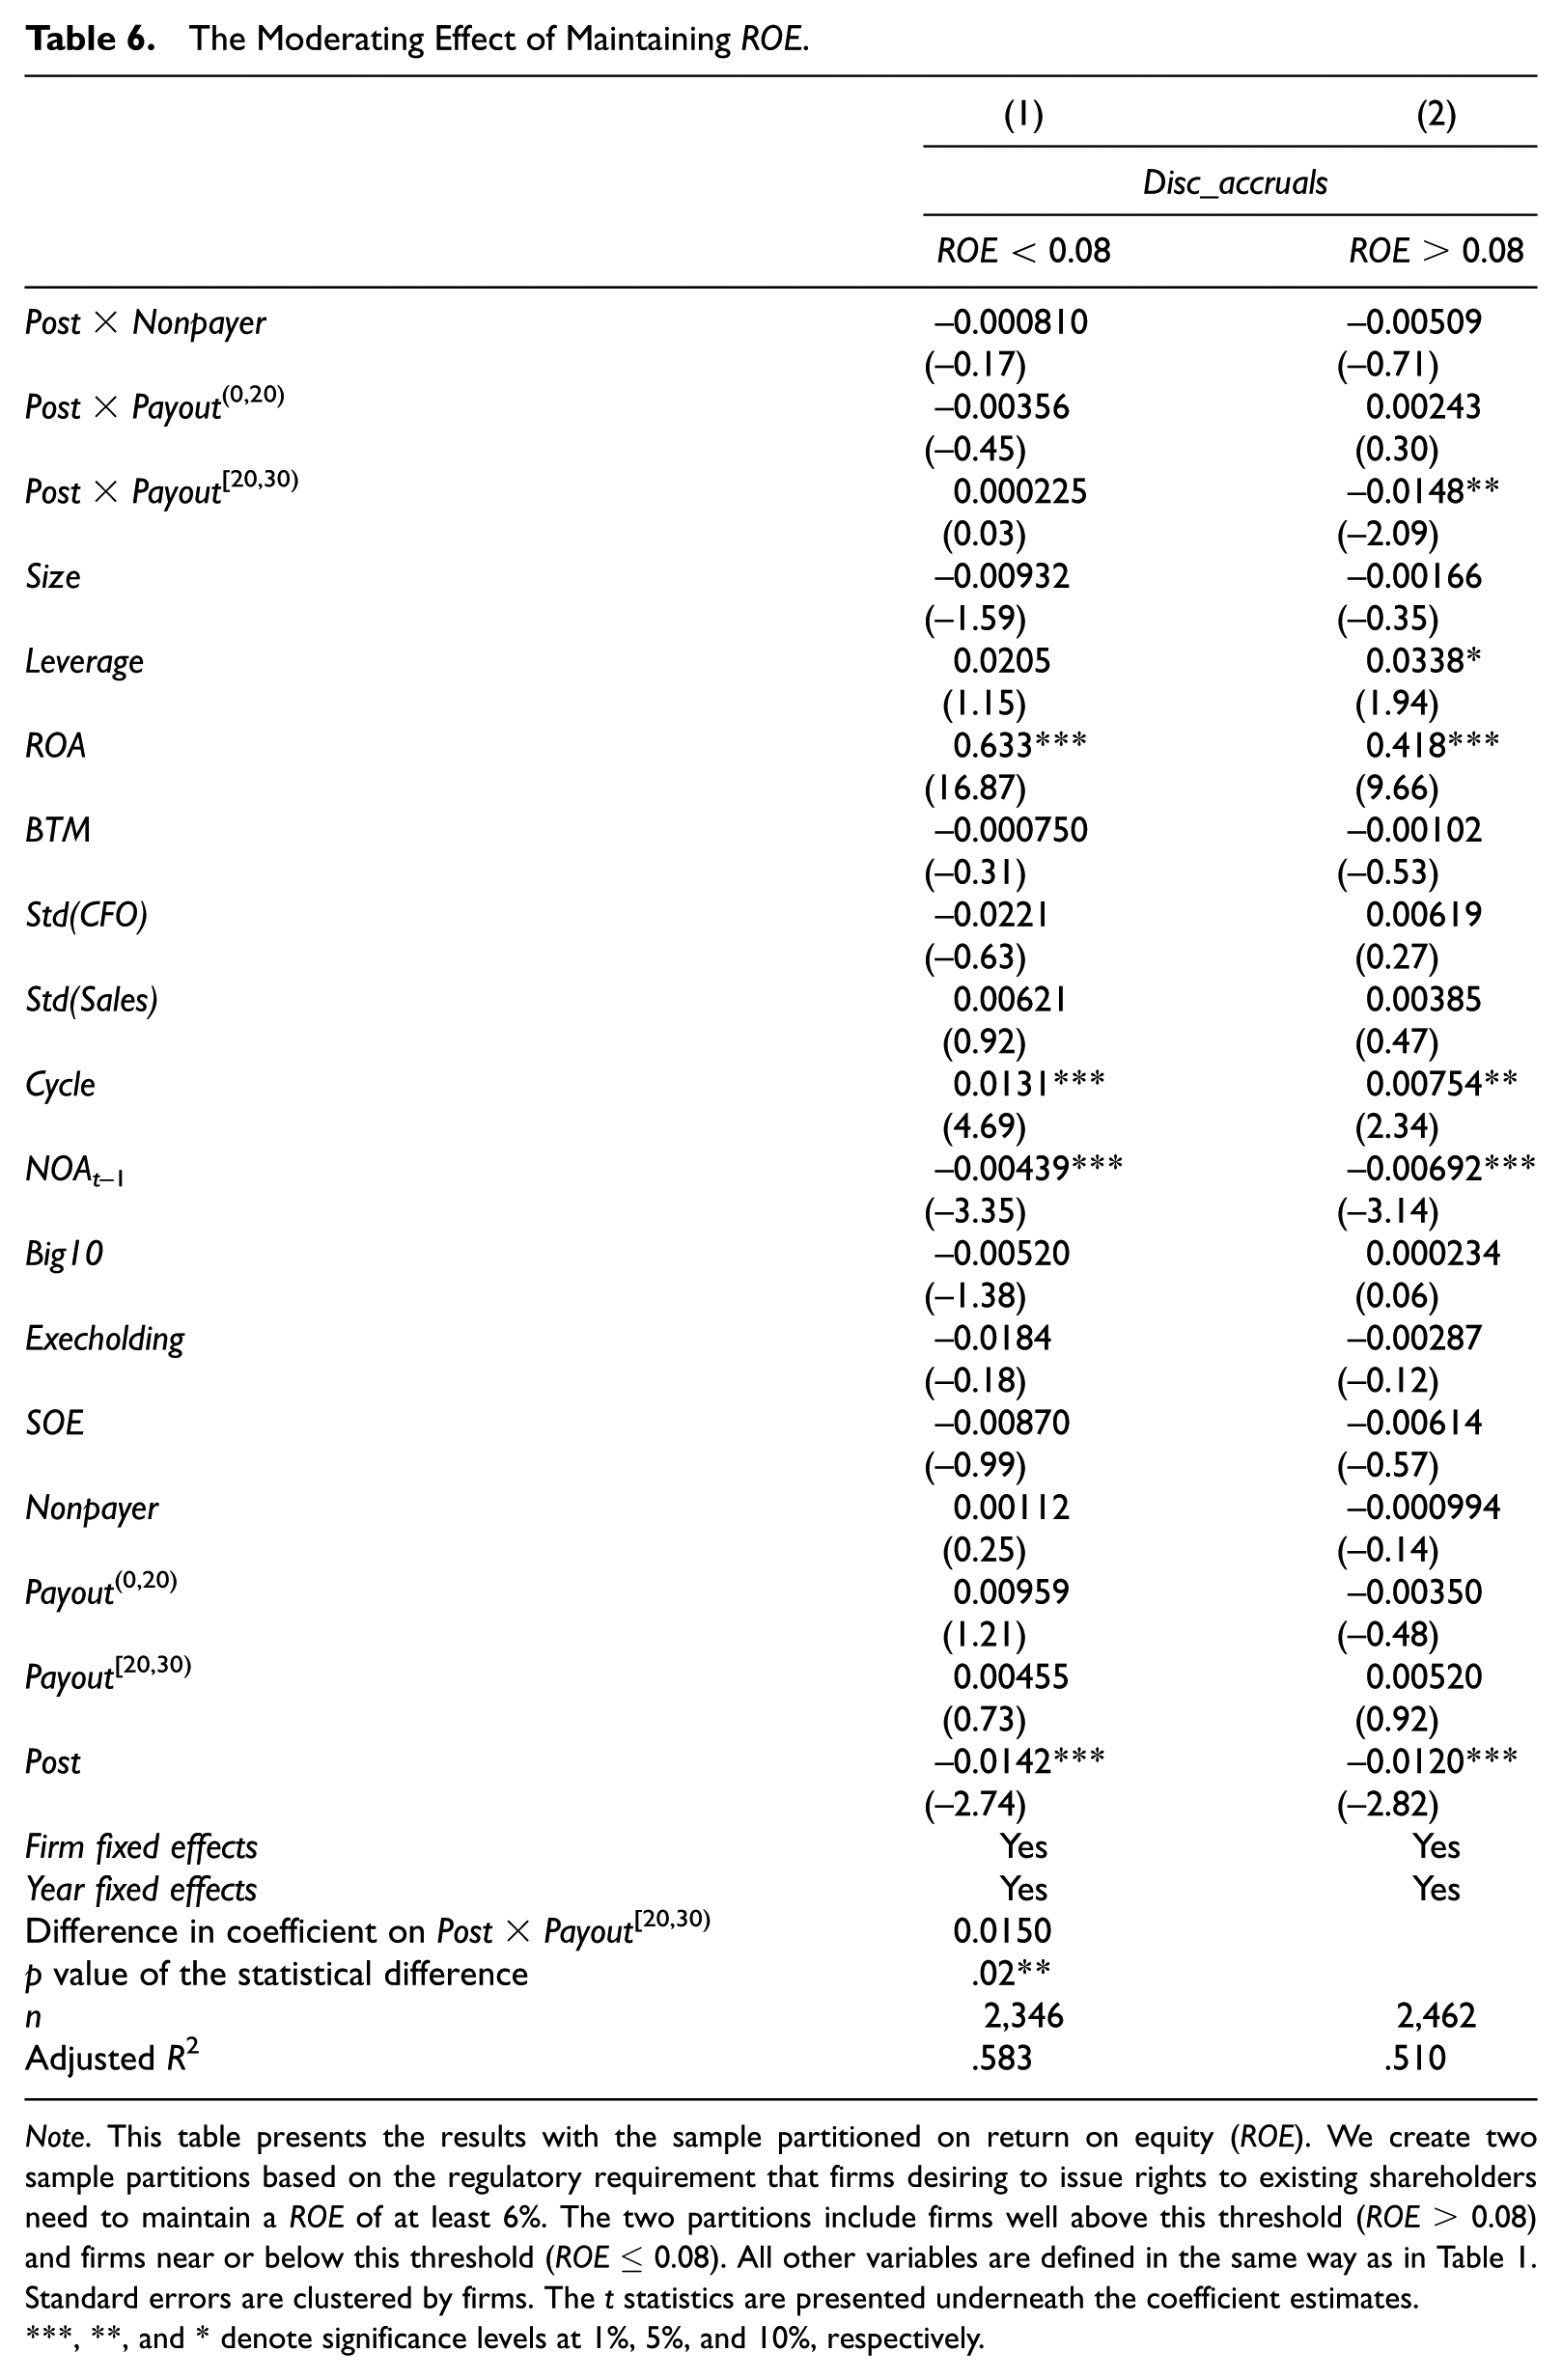
Note. This table presents the results with the sample partitioned on return on equity (ROE). We create two sample partitions based on the regulatory requirement that firms desiring to issue rights to existing shareholders need to maintain a ROE of at least 6%. The two partitions include firms well above this threshold (ROE > 0.08) and firms near or below this threshold (ROE≤ 0.08). All other variables are defined in the same way as in Table 1. Standard errors are clustered by firms. The t statistics are presented underneath the coefficient estimates.
, **, and * denote significance levels at 1%, 5%, and 10%, respectively.
Sensitivity and Supplemental Analyses
We also perform several sensitivity and supplemental analyses. First, we repeat our main test using a measure of performance-matched discretionary accruals. Specifically, following Fang, Huang, and Karpoff (2016), we define discretionary accruals as the residual term from Equation 2 minus the corresponding discretionary accruals of a matched firm from the same fiscal year and same industry with the closest return on assets. In untabulated tests, the coefficient on the Post × Payout[20,30) interaction is −0.0109 and is significant at the 5% level.
Our 3-year rolling window to calculate the trailing cumulative dividend payout ratio includes data from the pre-regulation period in the first two post-regulation years. Therefore, we exclude the years immediately around the implementation of the new regulation (specifically, 2007-2010), and we continue to find downward earnings management for firms with payout ratios between 20% and 30%.
We also examine several dividend payout cutoffs around 30%. Specifically, we alternately define the upper bound of the cutoff at 30.5%, 31%, 32%, 29.5%, 29%, and 28%. Our inferences hold with these alternative cutoffs. We also alternately introduce two new variables, Payout[30,35), which identifies firms with cumulative dividend payout ratios between 30% and 35%, and Payout[30,40), which identifies firms with cumulative dividend payout ratios between 30% and 40%. These variables allow us to examine the behavior of accruals for firms with dividend payouts just above the 30% threshold. Neither of these variables have a statistically significant coefficient in our main tests. Firms that have already satisfied the dividend payout requirement do not exhibit downward earnings management after the dividend reform.
Finally, we explore the role of executive stock ownership in shaping the earnings management incentives in our setting. It is possible that executive stock ownership would diminish the downward earnings management in our setting because such ownership would heighten managers’ sensitivity to share price. Alternatively, if executives planned to participate in an equity offering made possible by meeting the payout ratio requirement, greater executive ownership could promote more downward earnings management in affected firms to ensure that the firm qualified to issue equity. Untabulated results show that greater executive share ownership weakly moderates the downward earnings management of affected firms in our setting. 16
The Impact of the Regulation on Actual Dividend Payments
To the extent that firms choose to use earnings management to affect the denominator of the payout ratio to meet the dividend payout ratio requirement, these firms may not increase cash dividends as intended by the dividend payout reform. Thus, we investigate the effect of the mandatory dividend reform on firms’ actual cash dividend payments (i.e., the numerator in the payout ratio).
We employ two measures that capture cash dividend payments—cash dividends per share and dividend yield. Dividends per share captures the actual cash dividend paid per unit of share ownership, whereas dividend yield captures the rate of return to equity investors per unit of price. We estimate the following regressions:
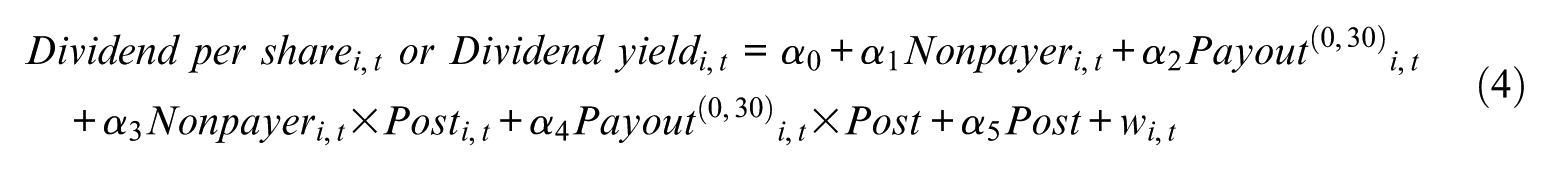
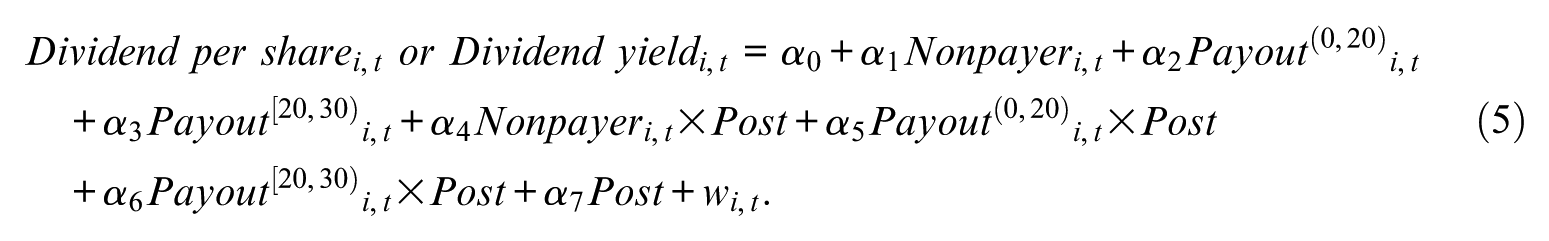
where Dividend per share is defined as total cash dividends scaled by total shares outstanding, and Dividend yield is defined as dividend per share divided by beginning-of-year stock price. Following Hail et al. (2014), we control for firm size (Size), leverage (Leverage), profitability (ROA), retained earnings (Retain, calculated as retained earnings scaled by total assets), total equity (Equity, calculated as total equity scaled by total assets), and cash flow from operations (CFO, calculated as the cash flow from operations scaled by total assets). Following our earlier regressions, we also control for BTM and SOE in this analysis.
We present the results from estimating Equations 4 and 5 in Table 7. The results for dividends per share are reported in columns 1 and 2, and the results for dividend yield are reported in columns 3 and 4, respectively. In column 1, the coefficient on Post×Payout(0,30) is positive and statistically significantly different from 0 at the 10% level, suggesting that affected firms with rolling cumulative dividend payout ratios between 0% and 30% increase their dividends per share after the dividend reform. 17 This is consistent with the dividend reform’s goal of returning cash to investors. When we further decompose Payout(0,30) into Payout(0,20) and Payout[20,30), we find that the coefficient on Post×Payout(0,20) is positive and statistically significant at the 1% level, whereas the coefficient on Post×Payout[20,30) is statistically indistinguishable from 0. This indicates that only firms with previous 3-year rolling cumulative dividend payout ratios greater than 0 and below 20% increase their dividends per share. Firms with cumulative payout ratios close to but slightly lower than the mandated threshold do not increase their dividends per share. This evidence complements our earlier findings that the firms in this group choose to decrease their discretionary accruals to meet the cumulative payout threshold after the reform while avoiding increasing actual cash dividend payments. The coefficient on Post is again negative and significantly different from 0, indicating that firms with a cumulative payout ratio above 30% (the benchmark group) decreased their dividends per share in the post-reform period. While it is possible that this decline occurs because these firms could lower dividends in the post period and still remain above the 30% threshold, it seems at least as likely that these firms reduce their dividends due to the effects of the financial crisis. This result again points to the importance of our difference-in-differences research design. In columns 3 and 4, we find similar results using dividend yield as the dependent variable. Taken together, these results suggest that the mandatory dividend payout regulation was successful in increasing dividends only for a subset of firms, specifically, those with cumulative payout ratios in the prior 3 years falling between 0% and 20%. We view the results in this table as complementing the evidence presented in earlier sections, in that firms with cumulative payout ratios in the prior 3 years slightly lower than the required 30% threshold use earnings management rather than increasing dividends to achieve the dividend payout target.
The Effect of the Reform on Dividend per Share and Dividend Yield.
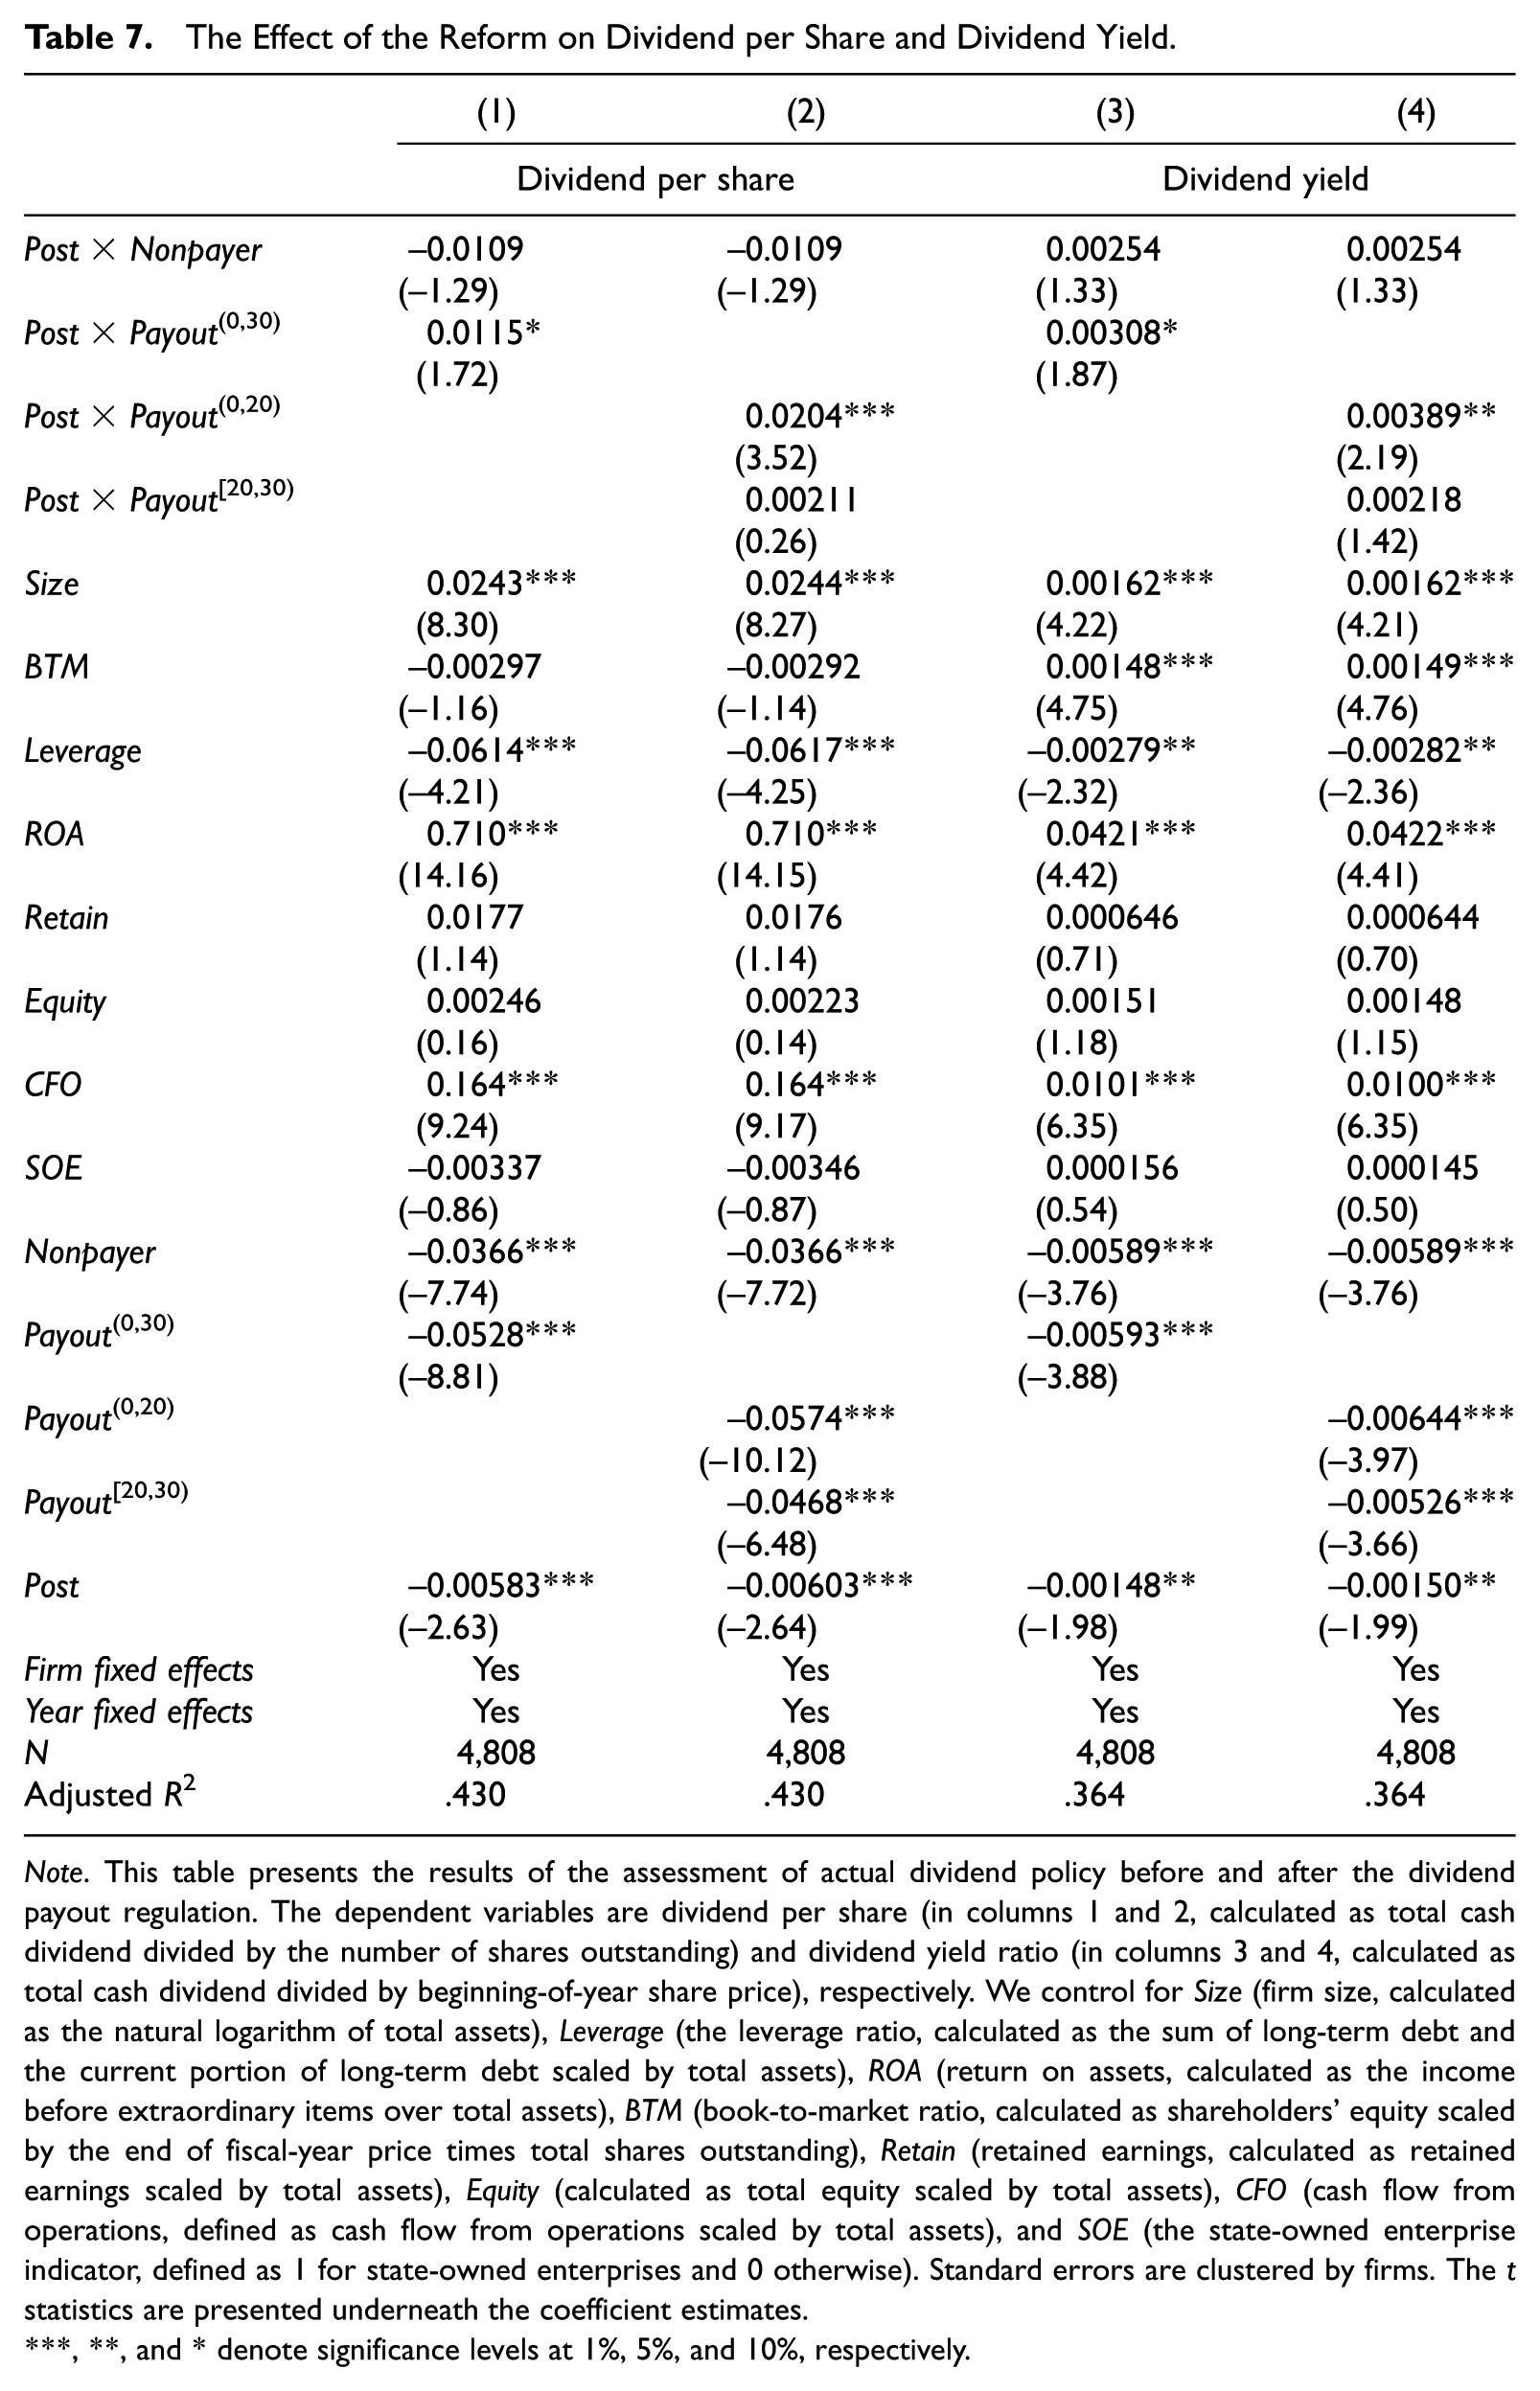
Note. This table presents the results of the assessment of actual dividend policy before and after the dividend payout regulation. The dependent variables are dividend per share (in columns 1 and 2, calculated as total cash dividend divided by the number of shares outstanding) and dividend yield ratio (in columns 3 and 4, calculated as total cash dividend divided by beginning-of-year share price), respectively. We control for Size (firm size, calculated as the natural logarithm of total assets), Leverage (the leverage ratio, calculated as the sum of long-term debt and the current portion of long-term debt scaled by total assets), ROA (return on assets, calculated as the income before extraordinary items over total assets), BTM (book-to-market ratio, calculated as shareholders’ equity scaled by the end of fiscal-year price times total shares outstanding), Retain (retained earnings, calculated as retained earnings scaled by total assets), Equity (calculated as total equity scaled by total assets), CFO (cash flow from operations, defined as cash flow from operations scaled by total assets), and SOE (the state-owned enterprise indicator, defined as 1 for state-owned enterprises and 0 otherwise). Standard errors are clustered by firms. The t statistics are presented underneath the coefficient estimates.
, **, and * denote significance levels at 1%, 5%, and 10%, respectively.
Conclusion
In this study, we examine the effect of a regulation regarding dividend payout policy on firms’ financial reporting choices and dividend payment policies using a natural experiment from China in October 2008. This regulation required firms that wish to issue new equity to maintain a cumulative dividend payout ratio of at least 30% over the past 3 years. We find that affected firms, on average, decrease their discretionary accruals, and this decrease is primarily driven by firms with cumulative payout ratios close to but slightly lower than the mandated dividend payout threshold. In addition, this earnings management is more pronounced in firms with larger cash flow deficits, firms with high recent sales growth, and firms from provinces with less developed banks. We also find that only firms with ROE that is well above another regulatory benchmark for ROE (i.e., firms with ROE≥ 0.08) and with cumulative payout ratios that are close to but below the 30% threshold engage in income-decreasing earnings management.
Interestingly, we find that only firms with previous cumulative payout ratios far below the mandated requirement (i.e., those with cumulative payout ratios that are positive but lower than 20%) significantly increase their dividends per share or dividend yield. Firms with cumulative payout ratios between 20% and 30% do not change their dividends per share or dividend yield in response to the regulation. This finding complements our evidence that firms with cumulative payout ratios close to but slightly lower than the mandated payout threshold may satisfy the mandatory dividend payout regulation by managing earnings downward rather than increasing cash payments to investors. This finding also suggests that the dividend payout regulation is only successful in boosting dividends for a subset of firms.
Our research contributes to the accounting and finance literature by showing that mandatory dividend payout regulations affect firms’ financial reporting choices. Our findings shed light on the effectiveness of mandatory dividend payout policies, which are suggested as a potential “legal substitute” for weak investor protection by La Porta et al. (1998, 2000). By utilizing a difference-in-differences framework, we show that the adoption of a mandatory dividend payout reform is at best partially effective because firms can either increase actual cash dividend payments (the numerator) or decrease reported earnings (the denominator) to satisfy the requirement.
Footnotes
Acknowledgements
The authors appreciate very helpful comments from Linda Myers (the editor) and two anonymous reviewers. They also thank S.P. Kothari (the discussant), Donal Byard, C.S. Agnes Cheng, Wei He, Zheng Liu, Weihang Sun, Bharat Sarath, Jing Wang, Nan Zhou, and participants at Jinan University, State University of New York at Binghamton, the 2015 International Accounting Section of the American Accounting Association Midyear Meeting; the 2015 AAA Annual Conference; and the 2016 Journal of Accounting, Auditing and Finance conference.
Declaration of Conflicting Interests
The author(s) declared no potential conflicts of interest with respect to the research, authorship, and/or publication of this article.
Funding
The author(s) disclosed receipt of the following financial support for the research, authorship, and/or publication of this article: Welker acknowledges financial support from the KPMG fellowship at Queen’s University. Ye acknowledges financial support from the Humanities and Social Science Foundation of the Ministry of Education of China (2016010141) and the National Key Accounting Research Projects of the Accounting Society of China (2015KJA009). Zhang acknowledges financial support from the Smith School of Business at Queen’s University.