
Abstract
This article investigates the gender effect on asymmetric cost behavior. We find that firms with female chief executive officers (CEOs) exhibit less cost asymmetry than firms with male CEOs. This finding holds in a range of robustness tests including those that address omitted variable bias and self-selection bias. Cross-sectional tests show that this gender effect is concentrated in the economic downturn period, firms with higher business risk, CEOs with higher personal career concerns, and firms in more competitive product markets, corroborating that females’ risk aversion and competitive preference are underlying mechanisms through which female CEOs manage costs differently compared to male CEOs. We also find supportive evidence of pessimism as an underlying mechanism. Further analysis shows that female CEOs tend to use more flexible costs to adjust resources in response to sales change.
Introduction
Over the past decade, the number of women on top executive teams has increased significantly. For example, according to Catalyst reports, the number of female corporate officers in Fortune 500 companies grew from 8.7% in 1995 (Catalyst 2007) to 14.6% in 2013 (Catalyst 2013). In 2015, women held one-fourth of executive and senior-level positions in S&P 500 companies (Catalyst 2016). With this increase, both academics and practitioners are interested in understanding gender differences in corporate decision-making. In the accounting field, a new stream of studies has examined how female executives affect external reporting quality, such as earnings management (Barua et al., 2010; Peni & Vähämaa, 2010), accounting conservatism (Francis et al., 2015), and aggressive tax reporting (Francis et al., 2014). Yet the implications of the gender effect on a firm’s internal resource management and adjustment have largely remained unexplored. Our article intends to fill the gap in the literature by examining whether female executives affect asymmetric cost behavior.
It is well documented in the literature that operating costs behave asymmetrically in the sense that cost magnitude increases with an increase in volume more than it decreases with the same amount of decrease in volume (e.g., Anderson et al., 2003). This asymmetric cost behavior is also called “cost stickiness.” Given the importance of operating costs, both researchers and practitioners are greatly interested in understanding the determinants of this asymmetric cost behavior. Prior studies have mainly focused on economic and agency factors, such as asset intensity and uncertainty of future demand (Anderson et al., 2003), agency conflict between managers and shareholders (C. X. Chen et al., 2012), and managerial incentives to meet/beat analyst forecasts (Dierynck et al., 2012; Kama & Weiss, 2013), as possible explanations. However, recent developments in the behavioral literature indicate that individuals make corporate decisions, and individual managers’ personal attributes play a significant role in making strategic and operational decisions (e.g., Bamber et al., 2010; Bertrand & Schoar, 2003). Our article aims to extend the asymmetric cost literature by introducing one of the most important executives’ personal attributes, gender, as a potential determinant of cost stickiness.
Women exhibit different risk preferences (e.g., Barua et al., 2010; Francis et al., 2015; Jianakoplos & Bernasek, 1998) because of gender differences in emotions, overconfidence, and perception of risk as challenges or threats (Croson & Gneezy, 2009). Prior studies find that women in general are more risk-averse than men; thus, they are more likely to outweigh the probability of loss (Croson & Gneezy, 2009). Therefore, we predict that female managers perceive the decrease in sales more likely when future demand is uncertain and accordingly react in a more conservative way. Specifically, female managers adjust resources downward more due to their higher expectations of decreased sales compared to their male counterparts.
In addition, when demand goes down, whether managers keep or cut the slack resources depends on their belief about how long the decrease in demand will last. Prior studies show that female managers are more pessimistic about the future in economic and stock market outlook than male managers (Jacobsena et al., 2014). Therefore, we expect that female managers are more likely to believe that the demand decrease is longer term, and consequently cut more slack resources than male managers. Furthermore, women are more likely to interpret risky situations as threats and to avoid them, whereas men see the same situations as challenges and participate in them (Arch, 1993; Croson & Gneezy, 2009). When demand goes up, female managers expand their operation and investment as male managers do because the downside risk (e.g., default risk) is lower. However, when demand goes down, female managers are more likely to view the situation as an increased risk of default and try to avoid it by adjusting resources downward; meanwhile, male managers are more likely to participate in such a challenging situation by keeping slack resources.
In addition to gender differences in risk attitudes, psychology literature shows gender differences in their competitive preference, with women being less willing to participate in a competition (e.g., Gneezy et al., 2003; Niederle & Vesterlund, 2007). Therefore, gender differences in competitive preference could also affect female managers’ cost behavior. To the degree that potential decrease in demand increases the competitiveness among firms, female managers are less willing to participate in such a competitive environment, and therefore are more likely to adjust costs downward to accommodate the demand decrease. In sum, we expect that costs are less sticky for firms with female managers than firms with male managers.
However, it is possible that costs are stickier for firms with female managers than firms with male managers. Adjustment costs involve the dismissal of employees (Anderson et al., 2003). In the literature on gender difference, it is documented that women are more intuitively altruistic than men (Rand et al., 2016). In addition, women are more concerned with equalizing earnings between parties, while men are more concerned with maximizing efficiency (Andreoni & Vesterlund, 2001). Thus, from the altruism and equalization perspective, female managers may less likely downward adjust the cost especially when it involves the dismissal of employees.
Furthermore, theories on risk aversion of women are based on the general population. In fact, there are not many women in top management positions, and female managers are unlikely to be representative of the female population. Instead, they are more likely to represent a special group of women who choose to pursue a career in the male-dominated professional management jobs. Several studies argue that in a predominantly male environment, those women who are in top management positions think and behave like men, and gender differences disappear (e.g., Atkinson et al., 2003; Johnson & Powell, 1994; Sila et al., 2016). If this is the case, we would expect that there are no gender differences in terms of their cost management behavior. Thus, it is ultimately an empirical question.
In this article, we focus on the gender of chief executive officers (CEOs) because they are the ones who make broad corporate decisions (Chava & Purnanandam, 2010). Resource adjustment is a broad modification of operation and investment levels in response to uncertain future demand, which falls under the CEO’s job function.
1
An article in Accountingtools on November 29, 2017 notes that though the CFO is responsible for reviewing all aspects of the business to see if the various operations are controlling costs in an appropriate manner, and whether resources are being allocated correctly. The CFO reports these findings to the CEO, who makes decisions about how to alter operations to make the firm more efficient and effective.
2
Anecdotal evidence suggests that female CEOs exert a significant impact on corporate cost management. For example, the Wall Street Journal (December 12, 2018) reports that General Motors CEO Mary Barra announced her plan of downsizing by cutting up to 14,800 jobs and closing five plants in the expectation of a downturn in U.S. vehicle sales. 3
Using a sample of 16,550 firm-year observations from 2000 to 2018, we test whether there is a CEO gender effect on asymmetric cost behavior. Following prior literature (e.g., Anderson et al., 2003; C. X. Chen et al., 2012), we use selling, general, and administrative (SG&A) costs, which represent a significant proportion of operating costs (C. X. Chen et al., 2012). 4 SG&A expenditures include broad corporate investments, such as brand development, research and development (R&D), information technology, and employee training costs (Banker et al., 2011), which fall under the CEO’s job function. The various components of SG&A expenditures enable cross-sectional comparison even though firms may not emphasize/cut the same category of slack resources. Using this sample, we find that firms with female CEOs adjust resources downward more than firms with male CEOs when demand decreases after controlling for known economic and agency determinants of cost asymmetry. Economically, our baseline results show that SG&A costs of firms with male CEOs increase by approximately 0.645% with a 1% increase in sales and decrease roughly by 0.235% with 1% decrease in sales. However, for firms with female CEOs, SG&A costs increase by 0.601% with a 1% increase in sales and decrease by 0.362% (i.e., 0.127% more decrease than male CEOs) with a 1% decrease in sales. Economically, female CEOs are about 54% (=0.127/0.235) less cost stickiness compared to male CEOs. Therefore, our results show that firms with female CEOs exhibit significantly less asymmetric cost behavior.
Female CEOs account for about 3% of the sample. To provide a more balanced comparison, we conduct a propensity score matching (PSM) analysis. Specifically, we match each firm with a female CEO with a firm with a male CEO in the same year and the same industry based on all standalone control variables used in the baseline model. Using the matched sample, we continue to find that firms with female CEOs exhibit less cost stickiness than firms with male CEOs. Another econometric concern is that some omitted factors could affect both having a female CEO and cost asymmetry, which could make our results spurious. To mitigate this concern, we conduct a difference-in-differences method by comparing male-to-female CEO transitions to male-to-male CEO transitions and find consistent results. Finally, our results also hold when we apply the Heckman (1979) two-stage procedure to deal with the potential self-selection bias.
We further conduct four sets of cross-sectional tests to explore underlying mechanisms. Females are more likely to express their risk preferences when they face situations with higher levels of risk (e.g., Fehr-Duda et al., 2006; Francis et al., 2015). Therefore, if risk aversion is an underlying channel through which female CEOs affect their firms’ asymmetric cost behavior, we expect to find that the gender effect is more pronounced in riskier situations. We first examine how macro-level risk moderates the gender effect on cost stickiness. When the macro-economy is in a downturn, future demand is highly uncertain. Therefore, we expect that the gender effect to be more pronounced during the macro-economic downturn. To test this conjecture, we construct a subsample of the 2009 to 2011 financial crisis period and a subsample of the pre-crisis period (2006–2008). We find that the CEO gender effect only holds for the financial crisis period. In addition, we separate our full sample into the bust period and the booming period. We continue to find that the CEO gender effect on cost stickiness only exists in the bust period.
Second, we examine how firm-level business risk moderates the gender effect on cost stickiness. We use two proxies for firm-level business risk: sales volatility and the first principal component of five business risk proxies (PC1) that are used in Stanley’s (2011) study. We expect that the differences in risk attitudes between female CEOs and male CEOs would be more likely to exhibit for firms with a higher level of business risk. To test this conjecture, we partition the sample into high-risk firms and low-risk firms based on these two proxies. We find that the CEO gender effect on cost asymmetry is concentrated in firms with a higher level of business risk.
Third, we examine how individual-level risk moderates the gender effect on cost stickiness. Management job security risk could exacerbate the gender differences in perceptions about the costs of keeping slack resources. More entrenched CEOs are less worried about getting dismissed and, thus, perceive costs of keeping slack resources to a lesser extent than CEOs who are less entrenched. To test this conjecture, we use two entrenchment proxies for management job security risk: state-level antitakeover status and CEOs’ tenures. CEOs of firms in states with antitakeover status are more protected from dismissal due to takeovers, and CEOs with longer tenures have fewer career concerns because longer tenures imply that the firm’s board is inclined to retain the CEO (Milbourn, 2003). Consistent with our prediction, we find that the gender effect only exhibits when firms in states with less antitakeover status and when CEOs have shorter tenures.
Fourth, we examine whether competitive preference is also an underlying mechanism through which female CEOs affect their firms’ asymmetric cost behavior. Specifically, we examine whether the product market competition moderates the gender effect on cost asymmetry. The uncertainty of future demand is higher in a more competitive market, because consumers can easily switch to a competitor for similar products. This indicates greater uncertainty for firms in highly competitive markets regarding their resource adjustment. We use two proxies for the product market competition: product similarity (Hoberg & Phillips, 2016) and product market fluidity (Hoberg et al., 2014). We find that the gender effect is concentrated in firms in highly similar product markets and high-fluidity product markets, supporting that competitive preference is also an underlying mechanism through which female CEOs affect cost stickiness.
Furthermore, we conjecture that women in general are more risk-averse than men because they are more likely to outweigh the probability of loss (Croson & Gneezy, 2009). Thus, female managers adjust resources downward more because of their more pessimism of decreased sales. If this is true, we should observe more pronounced gender effect in the subgroup of firms with low sales forecasts by management. Empirically, we split the sample into two subgroups based on management sales forecasts benchmarking the actual sales. We find that the gender effect is concentrated in the subgroup with low management sales forecasts. This provide supportive evidence that female’s pessimism is one of the mechanisms underlying the risk channel.
Finally, we investigate what corporate action is taken by female CEOs to reduce cost stickiness. We conjecture that it is easier for firms with more flexible costs as opposed to fixed costs to adjust resources in response to sales changes. Thus, we split the sample into two subgroups based on the ratio of flexible cost and fixed cost. We find that the gender effect is concentrated in the subgroup with higher flexible cost. This indicates that female CEOs are likely to use flexible cost to adjust the cost downward when the demand declines.
Our article makes several contributions to the literature by studying the effect of individual managers on cost asymmetry. First, prior studies have relied on economic and agency theory and documented managerial incentives from perspectives of empire-building incentives (C. X. Chen et al., 2012) and efforts to meet/beat targeted benchmarks (Dierynck et al., 2012; Kama & Weiss, 2013). Motivated by upper echelons theory, which asserts that managerial attributes play a significant role in shaping corporate policies, we focus on CEOs’ gender, demonstrating that it plays a significant role in shaping asymmetric cost behavior. Second, prior accounting studies have shown the gender effect on financial accounting choices (e.g., Barua et al., 2010; Francis et al., 2015; Huang & Kisgen, 2013). Our finding indicates that a significant gender factor contributes to the determinants of internal cost management. Thus, our article complements studies on the gender effect on accounting decision-making. Third, we provide a more comprehensive look on the gender difference from all three factors summarized in Croson and Gneezy’s (2009) study: gender difference in risk preferences, gender difference in competitive preferences, and gender difference in social preferences. The accounting and finance literature (e.g., Barua et al., 2010; Francis et al., 2015; Huang & Kisgen, 2013) usually studies the gender effect from gender difference in risk preference. We consider the possible effects of all three factors in gender difference in both hypothesis development and empirical tests. We provide four sets of cross-sectional tests to demonstrate that females’ risk aversion and competitive preference are the underlying mechanisms through which female CEOs affect asymmetric cost behavior. In addition, we provide further supportive evidence that female’s pessimism is one of the mechanisms underlying the risk channel. Finally, we take the initiatives to investigate what corporate action is taken by female CEOs to reduce cost stickiness. We find that female CEOs are likely to use flexible cost to adjust the cost downward when the demand declines. 5
Literature Review and Hypothesis Development
Overview of Prior Literature on Asymmetric Cost Behavior
Traditional cost accounting models are constructed under the assumption that variable costs change proportionately and symmetrically with activity levels, regardless of the direction of the activity change (e.g., Noreen 1991). However, Cooper and Kaplan (1998) observe that managers seem more ready to increase costs when activity levels increase than they are to decrease costs when activity levels decrease. Empirical evidence confirms this asymmetric cost behavior. Specifically, Anderson et al. (2003) document that SG&A costs of an average firm increase by 0.55% per 1% increase in sales but decrease only by 0.35% per 1% decrease in sales.
Dierynck et al. (2012) summarize three dimensions of research on cost asymmetry based on Anderson et al.’s (2003) work. The first dimension studies the relationship among variables that influence adjustment costs and the degree of cost asymmetry. For example, Balakrishnan et al. (2004) document that the cost decrease in response to a decrease in activity levels is smaller (larger) than that for an increase only when utilization capacity is currently strained (in excess). The second dimension examines the moderating effect of structural factors on the degree of cost asymmetry. For example, Banker and Chen (2006) document that labor market structure and policies, such as trade unions’ bargaining power, level of unemployment benefits, and strictness of employment protection legislation, affect the degree of asymmetric cost behavior. In addition, Balakrishnan and Gruca (2008) find that the degree of asymmetric cost behavior is greater in functions making contributions to an organization’s core competency.
The third dimension investigates the effect of managerial incentives on cost asymmetry. For example, Kama and Weiss (2013) find a negative association between managerial incentives to meet earnings targets and cost asymmetry in listed U.S. firms. Dierynck et al. (2012) also report a negative link between managerial incentives to meet or beat the zero earnings benchmark and labor cost asymmetry in private Belgian firms. In addition, C. X. Chen et al. (2012) document a positive relation between managerial empire-building incentives and asymmetric cost behavior.
Furthermore, this line of research documents that managerial equity compensation incentives affect asymmetric cost behavior. Specifically, Z. Li et al. (2020) find that equity incentives are positively associated with cost stickiness. W. Li et al. (2021) find that managerial incentive delta is positively associated with cost stickiness while managerial incentive vega is negatively associated with cost stickiness. Aboody et al. (2018) use the reduction in option-based compensation following the issuance of Financial Accounting Standard (FAS) 123R as an exogenous shock to the managerial risk-taking incentives and find firms’ adjustment in cost structure in response to the reduction in risk-taking incentives. Specifically, they find that firms use more variable costs to substitute fixed costs following the issuance of FAS 123R, indicating a positive relation between risk aversion and the usage of variable costs.
Our study extends the third dimension of research by focusing on top managers. Our article is different from the studies on managerial risk-taking incentives (e.g., compensation incentives), which is the external force. Instead of relying on economic and agency theories, which treat managers as economic agents who rationally respond to the economic environment, as well as monitoring and incentive mechanisms, our study is based on upper echelons theory (Bao et al., 2014; Hambrick & Mason, 1984), which argues that individuals make corporate decisions and individual managers’innate characteristics influence corporate decisions. In fact, Bertrand and Schoar (2003) find that managerial fixed effects explain more variations of corporate investment and financing decisions than typical firm-level characteristics. Bamber et al. (2010) find that top executives exert unique and economically significant influence on their firms’ voluntary disclosures. In this article, we focus on the gender of top executives (i.e., CEOs) because gender differences in attitudes toward risk have long been studied in the sociology, psychology, and economics literature (e.g., Bernasek & Shwiff, 2001; Jianakoplos & Bernasek, 1998; Powell & Ansic, 1997; Sunden & Surette, 1998). More recent studies in the accounting and finance literature show that top executives’ gender has a significant impact on corporate reporting, financing, and investment decisions. However, whether and how top executives’ gender affects internal cost management have largely remained unexplored. Our article aims to fill this gap in the literature.
Overview of Prior Literature on Gender
The majority of prior studies have focused on individuals’ decision-making, finding that women are more risk-averse than men. Croson and Gneezy’s (2009) literature review provides three explanations for gender differences in risk-taking: emotions, overconfidence, and perception of risk as challenges or threats. The first explanation indicates that women experience emotions more strongly than men (e.g., Harshman & Paivio, 1987) and, therefore, experience negative outcomes worse, such as with more intense nervousness and fear than men (e.g., Brody, 1993; Fujita et al., 1991). Furthermore, as women experience worse emotions, their perceptions of the probability of loss increase. Thus, women are naturally risk-averse in a risky situation due to their different emotional reactions.
The second explanation argues that men are more overconfident in their success in uncertain situations than women (e.g., Lichtenstein et al., 1982; Lundeberg et al., 1994); therefore, they are more likely to participate in uncertain situations than women. For example, Soll and Klayman (2004) find that men are more likely to give narrower bands than women when asked to provide high and low estimates so that they are X% sure that the correct answer for a given question lies between them.
The third explanation is gender differences in the interpretation of a risky situation. Specifically, men are more likely to regard a risky situation as a challenge and participate in it, whereas women tend to see it as a threat and try to avoid it (Arch, 1993). In other words, gender differences in risk behavior result from different motivations between genders: while men are more stimulated by challenging, ego-involving situations, women are more impaired by them (Block, 1983).
In addition to gender differences in risk attitudes, several studies show gender differences in their attitudes toward competition. First, women are less likely to choose to participate in a competition. For example, Buser et al. (2014) find that gender differences in competitiveness lead to different school choices between boys and girls: boys are more likely to choose more prestigious academic tracks, which focus more on mathematics and science compared to girls. Using a laboratory experiment, Niederle and Vesterlund (2007) find that most males request their performance to be compensated under the tournament incentives, while the majority of females request the piece-rate compensation, although there are no gender differences in performance between these two groups of participants.
Second, women and men react differently to competition. Specifically, men’s performance is more positively affected by the competitiveness of the environment than women’s performance. For example, in a field study, Gneezy and Rustichini (2004) find that boys run faster and girls run slower when they compete with each other, even though there are no performance differences when they run separately. Niederle and Vesterlund (2010) find that boys perform better in math tests than girls because of gender differences in competitiveness. Gneezy et al. (2003) find that men’s performance is increased more under a competitive environment than women’s performance, indicating males react with more efforts, while females do not in competitive situations.
Niederle and Vesterlund (2007) summarize two possible explanations for gender differences in competition: nurture and nature. First, men and women are nurtured differently: while girls are encouraged to be empathetic and egalitarian, boys are encouraged to be assertive. Therefore, men are innately better equipped to compete (Baron-Cohen, 2003). Gneezy et al. (2009) and Andersen et al. (2013) provide evidence for a strong role of nurture for the formation of attitudes toward competitiveness among children. Second, men have evolved to be more competitive than women. Because men could have more children than women, the potential gain in reproductive success from winning a competition is significantly higher for men (Daly & Wilson, 1983). In addition, a man’s death does not affect his current reproductive success, but a woman’s death could cause the loss of her current offspring (Campbell, 2002). Therefore, the differences in potential losses make women shy away from the competition. Buser (2012) and Wozniak (2012) provide evidence in supporting nature as an underlying driver for gender differences in competitiveness. 6
Furthermore, there is gender difference in social preferences, which could be in the form of altruism, envy, inequality aversion, and reciprocity (Croson & Gneezy, 2009). We will briefly review the literature on gender difference in altruism and inequality aversion, as they likely affect corporate decision-making by managers of different genders. In general, the literature finds that women are more altruistic and inequality averse. For example, Simmons and Emanuele (2007) find that women donate more money and time than men. Andreoni and Vesterlund (2001) find that women are more generous when it is relatively expensive to give while men are more generous when it is less expensive to give. In addition, women tend to share evenly between the parties. Dickinson and Tiefenthaler (2002) also find that women tend to share scarce resources evenly among parties even though they are the disinterested third party in the sense that their own payoffs are not at stake from the allocation. More recently, in a corporate plant-level setting, Tate and Yang (2015) document a similar result. They find that firms with more female managers have smaller gender pay gaps and offer more equal pay to newly hired employees.
Hypothesis Development
Our study is related to an emerging stream of studies in accounting and finance that investigate gender differences in corporate decision-making. For example, firms with female executives exhibit a lower risk level than firms with male executives (Khan & Vieito, 2013). Barua et al. (2010) document that firms with female executives have higher accruals quality than firms with male executives. Huang and Kisgen (2013) find that firms with female executives are less likely to make acquisitions and issue debt than firms with male executives. However, when they do, the announcement returns are often higher. Francis et al. (2014) document that female executives are less tax aggressive than their male counterparts. Francis et al. (2015) find that female executives are more conservative in financial reporting than male executives. In general, these studies support the theoretical argument that female executives are more risk-averse than their male counterparts in the corporate setting.
We develop our hypothesis based on gender differences in risk attitudes summarized in Croson and Gneezy’s (2009) study and gender differences in competitive preference developed in Niederle and Vesterlund’s (2007) study. First, because women outweigh the probability of loss due to their emotional reactions and under-confidence (Croson and Gneezy 2009), female CEOs may anticipate a greater possibility of sales decrease when facing uncertain sales demand than male CEOs. Resource adjustment results from the anticipated probability of future demand change. Managers deliberately increase resource investment when anticipating an increase in demand and decrease resource investment when anticipating a decline in demand (Anderson et al., 2003). If female CEOs anticipate a greater likelihood of a decline in sales demand than male CEOs, they are more likely to adjust resources downward, which could subsequently diminish cost stickiness.
Second, a resource adjustment decision depends on the manager’s belief about how long the decrease in demand will last. Prior research shows that men are more optimistic than women (e.g., Garbarino & Strahilevitz, 2004). In particular, Jacobsena et al. (2014) examine gender differences in optimism and find that women tend to be significantly more pessimistic than men regarding the future of the economy and the stock market. When market demand decreases, because of their stronger emotionally pessimistic expectations about future outcomes, female CEOs see demand uncertainty more imminent than male CEOs. Consequently, we expect female CEOs to be more likely to adjust resources downward when demand is expected to decline; therefore, firms with female CEOs exhibit less cost asymmetry.
Third, women are more likely to interpret risky situations as threats and, thus, seek to avoid them; meanwhile, men see the same situations as challenges and engage in them (Arch, 1993). In the time of uncertain future demand, resource investment involves risk. One particular risk that managers need to consider is the downside risk (i.e., financial risk associated with future losses including default). When market demand goes up, female managers expand their operation and investment as male managers do because the downside risk is lower. 7 However, when market demand goes down, because female managers are more pessimistic about future economic outlook, their assessment of the downside risk is higher than male managers. Therefore, female managers are more likely to adjust resources downward to avoid the potential downside risk. On the other hand, male managers are more likely to participate in such challenging situations by keeping slack resources.
Fourth, women are less likely to choose to participate in a competition, and men’s performance is more stimulated by the competitiveness of the environment than women’s performance (Niederle & Vesterlund, 2007). When demand declines, competition among firms becomes more intensive. To the degree that declining demand represents a more competitive environment, female CEOs could avoid competition by adjusting resources downward. Therefore, we expect female CEOs to be more likely to adjust resources to avoid competition, whereas male CEOs would be more likely to participate in such a competition by keeping slack resources.
In sum, if female CEOs have higher degrees of risk aversion and lower levels of competitiveness, we expect that firms with female CEOs exhibit less cost asymmetry. Thus, we hypothesize as follows:
However, if gender difference in social preference is more saliently shown in the corporate setting, we expect firms with female CEOs exhibit more cost asymmetry than firms with male CEOs. This is because adjustment costs often involve the dismissal of employees when demand decreases (Anderson et al., 2003). In the literature on gender difference, it is documented that women are more intuitively altruistic than men (Rand et al., 2016) and are more concerned with equalizing earnings between parties, while men are more concerned with maximizing efficiency (Andreoni & Vesterlund, 2001). This is even more true when the price of doing so is more expensive (Andreoni & Vesterlund, 2001). In the time of declining demand, keeping slack labor becomes more expensive. To the extent that Andreoni and Vesterlund (2001)’s finding applies in such a situation, female managers may choose not to lay off employees. Thus, from the altruism and equalization perspective, female managers may less likely downward adjust the cost especially when it involves the dismissal of employees. Therefore, we hypothesize as follows:
Nevertheless, several researchers argue that gender differences among professionals are smaller than those in the general population and are often nonexistent (e.g., Adams & Funk, 2012). Adams and Ragunathan (2017) argue that some gender theories for the general population, such as female risk aversion, might not apply to professional executives. Focusing on the financial industry, they find that female executives are not more risk-averse in financial firms compared to their male counterparts. Thus, those females who are selected into management positions may exhibit similar traits to men. In addition, because women are denied promotion because of their “feminine” actions (Branson, 2006), those females who are promoted to management positions are likely to think like men. Furthermore, in a predominantly male environment, gender differences could disappear because female managers could adapt to male managers’ behaviors.
Several empirical studies find that there are no gender differences for professional managers. For example, Johnson and Powell (1994) compare gender effects in a nonmanagerial group and a managerial group and find that men and women in the managerial group exhibit similar risk propensity and decision quality. Atkinson et al. (2003) compare the performance and investment behavior of male and female fixed-income mutual fund managers and they find that the ways in which men and women manage funds do not differ significantly in terms of performance, risk, and other fund characteristics. Sila et al. (2016) find that female directors have no effect on firms’ equity risk. Kumar (2010) argues that women with high risk tolerance and superior forecasting abilities tend to self-select into the professional analyst profession. Therefore, if female CEOs have comparable attitudes as their male counterparts, there should be no gender effect on cost stickiness.
Research Design
Sample
We collect CEO gender information from BoardEx database from 2000 to 2018. We obtain data on sales revenue, SG&A costs, and other financial variables from the Compustat annual database. CEO compensation information is from Capital IQ. Following prior studies (e.g., Anderson et al., 2003; C. X. Chen et al., 2012), we require sales and SG&A costs to be available in the current year and the previous year for the sample period. We also require SG&A costs to be smaller than sales revenue. Following Liu et al. (2019), we remove the observations with share prices of less than $1 dollar at the end of the fiscal year. In addition, we require all observations to have non-missing control variables used in the tests. Furthermore, because financial institutions and public utilities operate in regulated industries with different cost structures (e.g., Liu et al., 2019), we remove those firms from the sample. With these criteria, our final sample has 16,550 firm-year observations for the period from 2000 to 2018. All continuous variables are winsorized at the top and the bottom 1% of the observations.
Regression Model and Variable Measurement
To test the hypothesis, we use the following empirical model from asymmetric cost behavior literature (e.g., Anderson et al., 2003; C. X. Chen et al., 2012; Dierynck et al., 2012; Kama & Weiss, 2013):
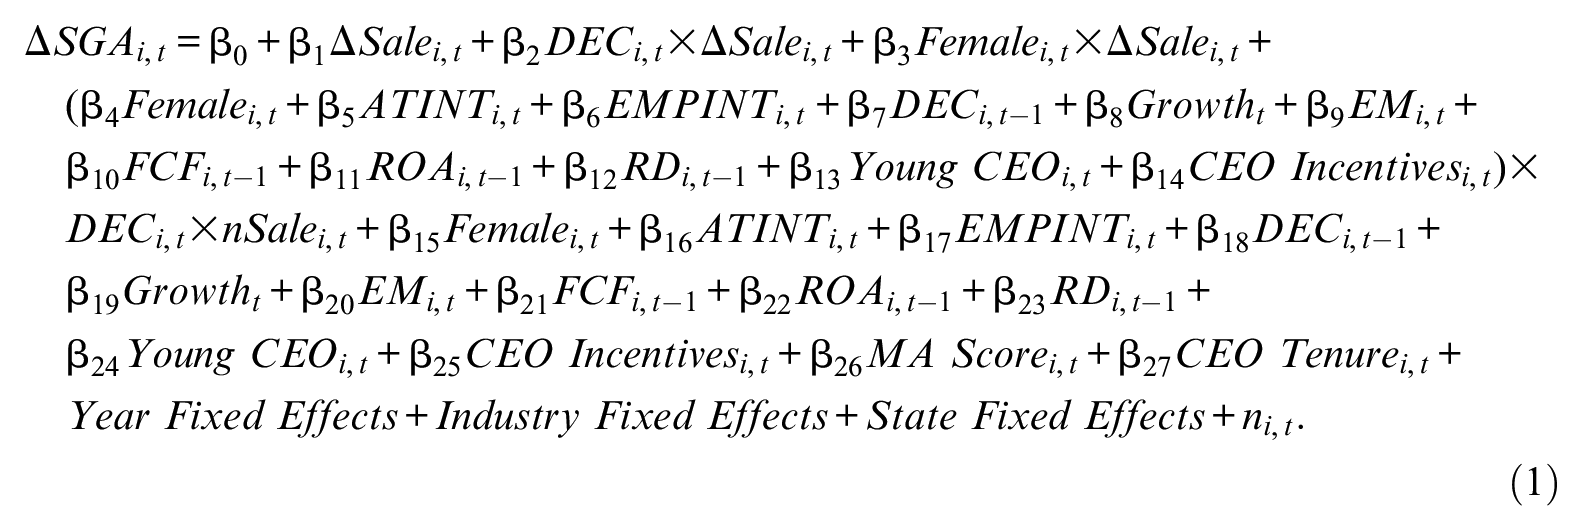
Following Anderson et al. (2003), we measure the change in sales revenue and change in SG&A costs with log-changes. Specifically, ΔSGA is calculated as the natural logarithm of the ratio of SG&A expenses at year t to SG&A expenses at year t − 1. ΔSale is calculated as the natural logarithm of the ratio of sales revenue at year t to sales revenue at year t − 1. The testing variable, Female, is an indicator, which equals one if a firm has a female CEO, and zero otherwise. Coefficient β1 measures the percentage change in SG&A costs with a 1% increase in sales revenue, and the sum of the coefficients (β1+β2) represents the percentage change in SG&A costs with a 1% decrease in sales revenue. Based on cost stickiness literature, we expect a significantly positive coefficient β1 and a significantly negative coefficient β2. Our hypothesis predicts that firms with female CEOs exhibit less SG&A cost stickiness, which means that they are more likely to adjust cost downward when sales revenue decreases. Thus, we expect the coefficient (β4) on the testing variable, Femalet × DECt × ΔSalet, to be significantly positive.
We control for known determinants of cost stickiness in the test. First, we control for four variables used in Anderson et al.’s (2003) study. DEC is an indicator equal to one if sales revenue at year t is less than sales revenue at year t − 1, and zero otherwise. ATINT is calculated as the natural logarithm of the ratio of total assets to sales revenue. EMPINT is calculated as the natural logarithm of the ratio of the number of employees to sales revenue. Growth is calculated as real gross national product (GNP) denominated in 2009 dollar value at year t less real GNP denominated in 2009 dollar value at year t − 1 scaled by real GNP denominated in 2009 dollar value at year t − 1. C. X. Chen et al. (2012) find that agency conflicts affect cost stickiness. Thus, we also control for agency conflicts in our model. Following prior studies such as Lehn and Poulsen (1989), Gul and Tsui (1997), and C. X. Chen et al. (2012), we use free cash flow to proxy for agency conflicts (Jensen, 1986). FCF is calculated as operating cash flow less both common and preferred dividends scaled by total assets. Dierynck et al. (2012) and Kama and Weiss (2013) document the effect of managerial incentives to manage earnings on cost stickiness. Thus, we also control for earnings management. EM is calculated using the modified cross-sectional Jones (1991) model as described in Dechow et al.’s (1995) study. 8 Following Liu et al. (2019), we also control for profitability and R&D intensity. ROA is calculated as income before extraordinary items scaled by total assets. RD is calculated as R&D expenses scaled by total assets. We also control for other CEO characteristics including CEO age (Young CEO), CEO compensation incentives (CEO Incentives), managerial ability (MA Score), and CEO tenure (CEO Tenure). Young CEOs and old CEOs may have different risk preferences, and therefore age may affect CEOs’ cost management decisions. Young CEO is a dummy variable that equals one if a CEO’s age is less than the sample median, and zero otherwise. CEOs’ compensation incentives and managerial ability could influence the CEO’s decision regarding cost adjustments. Thus, we also control for CEOs’ compensation incentives and managerial ability. CEO Incentives is calculated as the ratio of CEO’s restricted stock awards and stock options awards to the CEO’s total compensation. MA Score is the managerial ability score from Demerjian et al.’s (2012) study that was extended to 2020. CEO tenure could also affect CEO’s risk preference and therefore cost management decision, so we also control for CEO tenure. CEO Tenure is the natural logarithm of the number of years that the CEO has been working for the company. Finally, we include dummy variables to control for industry fixed effects using two-digit Standard Industrial Classification, year fixed effects, and state fixed effects in the regression models. 9
Empirical Results
Descriptive Statistics
Table 1 provides summary statistics on sale revenues, SG&A costs as a percentage of sales, testing variables, and control variables. The average (median) sales revenue is $3,266.99 (612.19) million. The mean (median) value of SG&A costs as a percentage of sales revenue is 28 (23)%. These statistics are comparable to prior literature (e.g., Anderson et al., 2003; C. X. Chen et al., 2012; Liu et al., 2019). In our sample, 3% of firms have female CEOs, which is comparable to other studies. For example, Lee and James (2007) show an average of 3% of female CEOs during the period from 1990 to 2000, and Hill et al. (2015) find an average of 2% of female CEOs during the period from 1996 to 2005. We find that 24% of sample firms experience a decline in sales revenue. On average, firms experience macro-economic growth of 2%. The average (median) asset intensity (ATINT) is 0.04 (0.02), and the average (median) employee intensity (EMPINT) is 1.27 (1.34), comparable to Liu et al.’s (2019) study. The average (median) discretionary accruals (EM) are 0.08 (0.06). The average (median) free cash flow (FCF) equals 8 (8)% of total assets; the average (median) return on assets (ROA) is 4 (5)%, and the average (median) R&D expenses constitute 5 (1)% of total assets. The descriptive statistics of these control variables are comparable to prior studies such as Liu et al. (2019). The average (median) CEO Incentives is 31 (28)% of total compensation. The average (median) MA Score is 0.00 (−0.03). The average (median) CEO Tenure is 1.37 (1.39).
Descriptive Statistics.
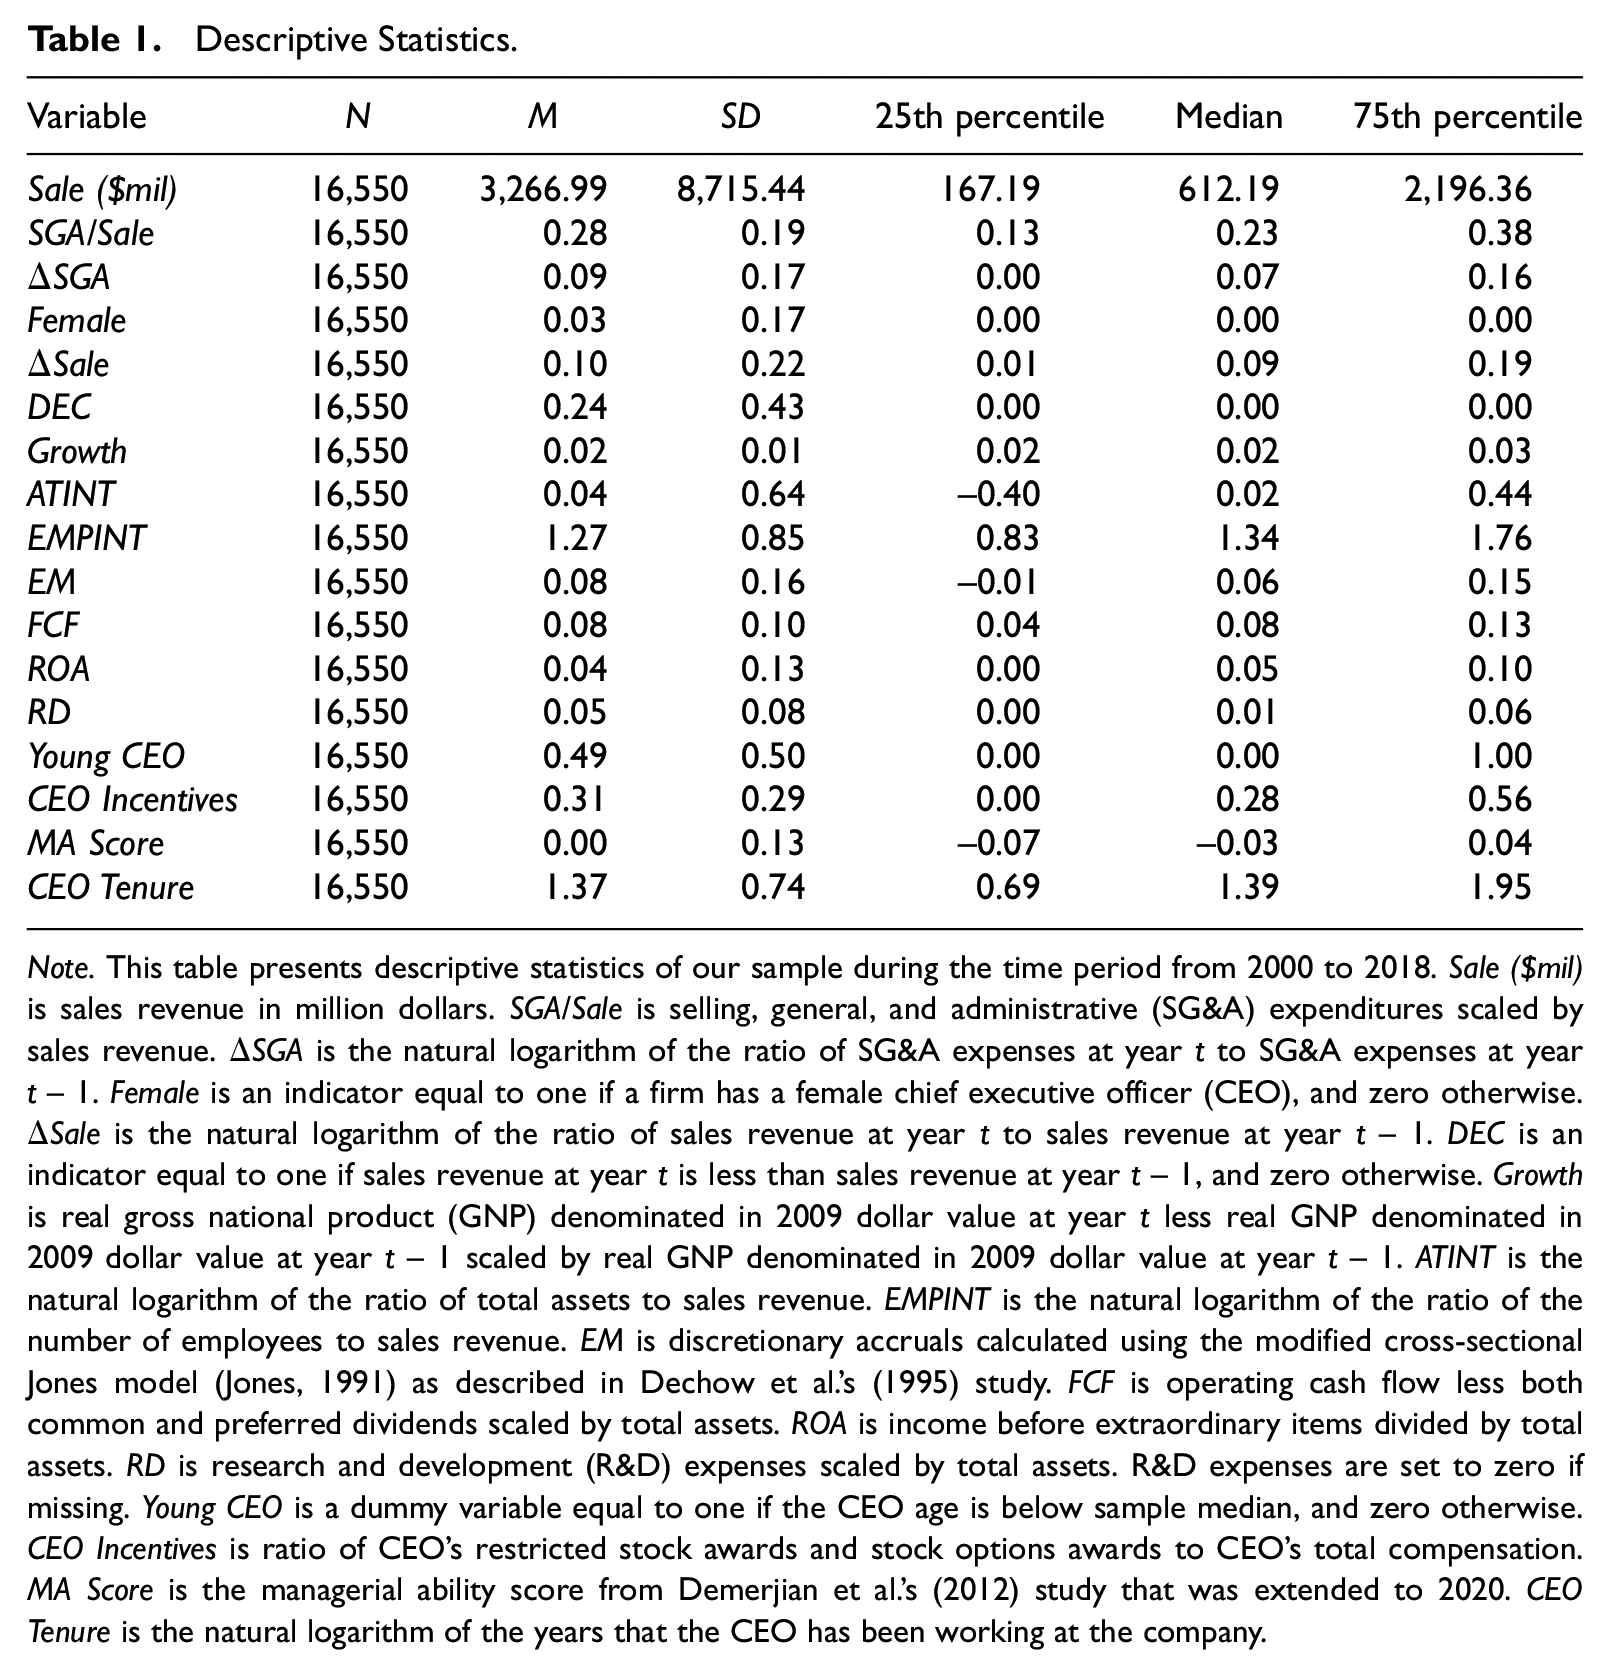
Note. This table presents descriptive statistics of our sample during the time period from 2000 to 2018. Sale ($mil) is sales revenue in million dollars. SGA/Sale is selling, general, and administrative (SG&A) expenditures scaled by sales revenue. ΔSGA is the natural logarithm of the ratio of SG&A expenses at year t to SG&A expenses at year t − 1. Female is an indicator equal to one if a firm has a female chief executive officer (CEO), and zero otherwise. ΔSale is the natural logarithm of the ratio of sales revenue at year t to sales revenue at year t − 1. DEC is an indicator equal to one if sales revenue at year t is less than sales revenue at year t − 1, and zero otherwise. Growth is real gross national product (GNP) denominated in 2009 dollar value at year t less real GNP denominated in 2009 dollar value at year t − 1 scaled by real GNP denominated in 2009 dollar value at year t − 1. ATINT is the natural logarithm of the ratio of total assets to sales revenue. EMPINT is the natural logarithm of the ratio of the number of employees to sales revenue. EM is discretionary accruals calculated using the modified cross-sectional Jones model (Jones, 1991) as described in Dechow et al.’s (1995) study. FCF is operating cash flow less both common and preferred dividends scaled by total assets. ROA is income before extraordinary items divided by total assets. RD is research and development (R&D) expenses scaled by total assets. R&D expenses are set to zero if missing. Young CEO is a dummy variable equal to one if the CEO age is below sample median, and zero otherwise. CEO Incentives is ratio of CEO’s restricted stock awards and stock options awards to CEO’s total compensation. MA Score is the managerial ability score from Demerjian et al.’s (2012) study that was extended to 2020. CEO Tenure is the natural logarithm of the years that the CEO has been working at the company.
Baseline Result
Table 2 presents our main results. Consistent with the cost stickiness literature (e.g., Anderson et al., 2003; Liu et al., 2019), the coefficient on ΔSalet is positive (β1 = 0.645) and significant at the 1% level. The coefficient on DECt × ΔSalet is negative (β2 =−0.410) and significant at the 1% level. This suggests that, for firms under the control of male CEOs, SG&A costs increase by approximately 0.645% with a 1% increase in sales and decrease roughly 0.235 (=0.645 − 0.410)% with 1% decrease in sales. In addition, the coefficient on Femalet × ΔSalet is −0.044 and is not statistically significant.
CEO Gender and Cost Asymmetry.
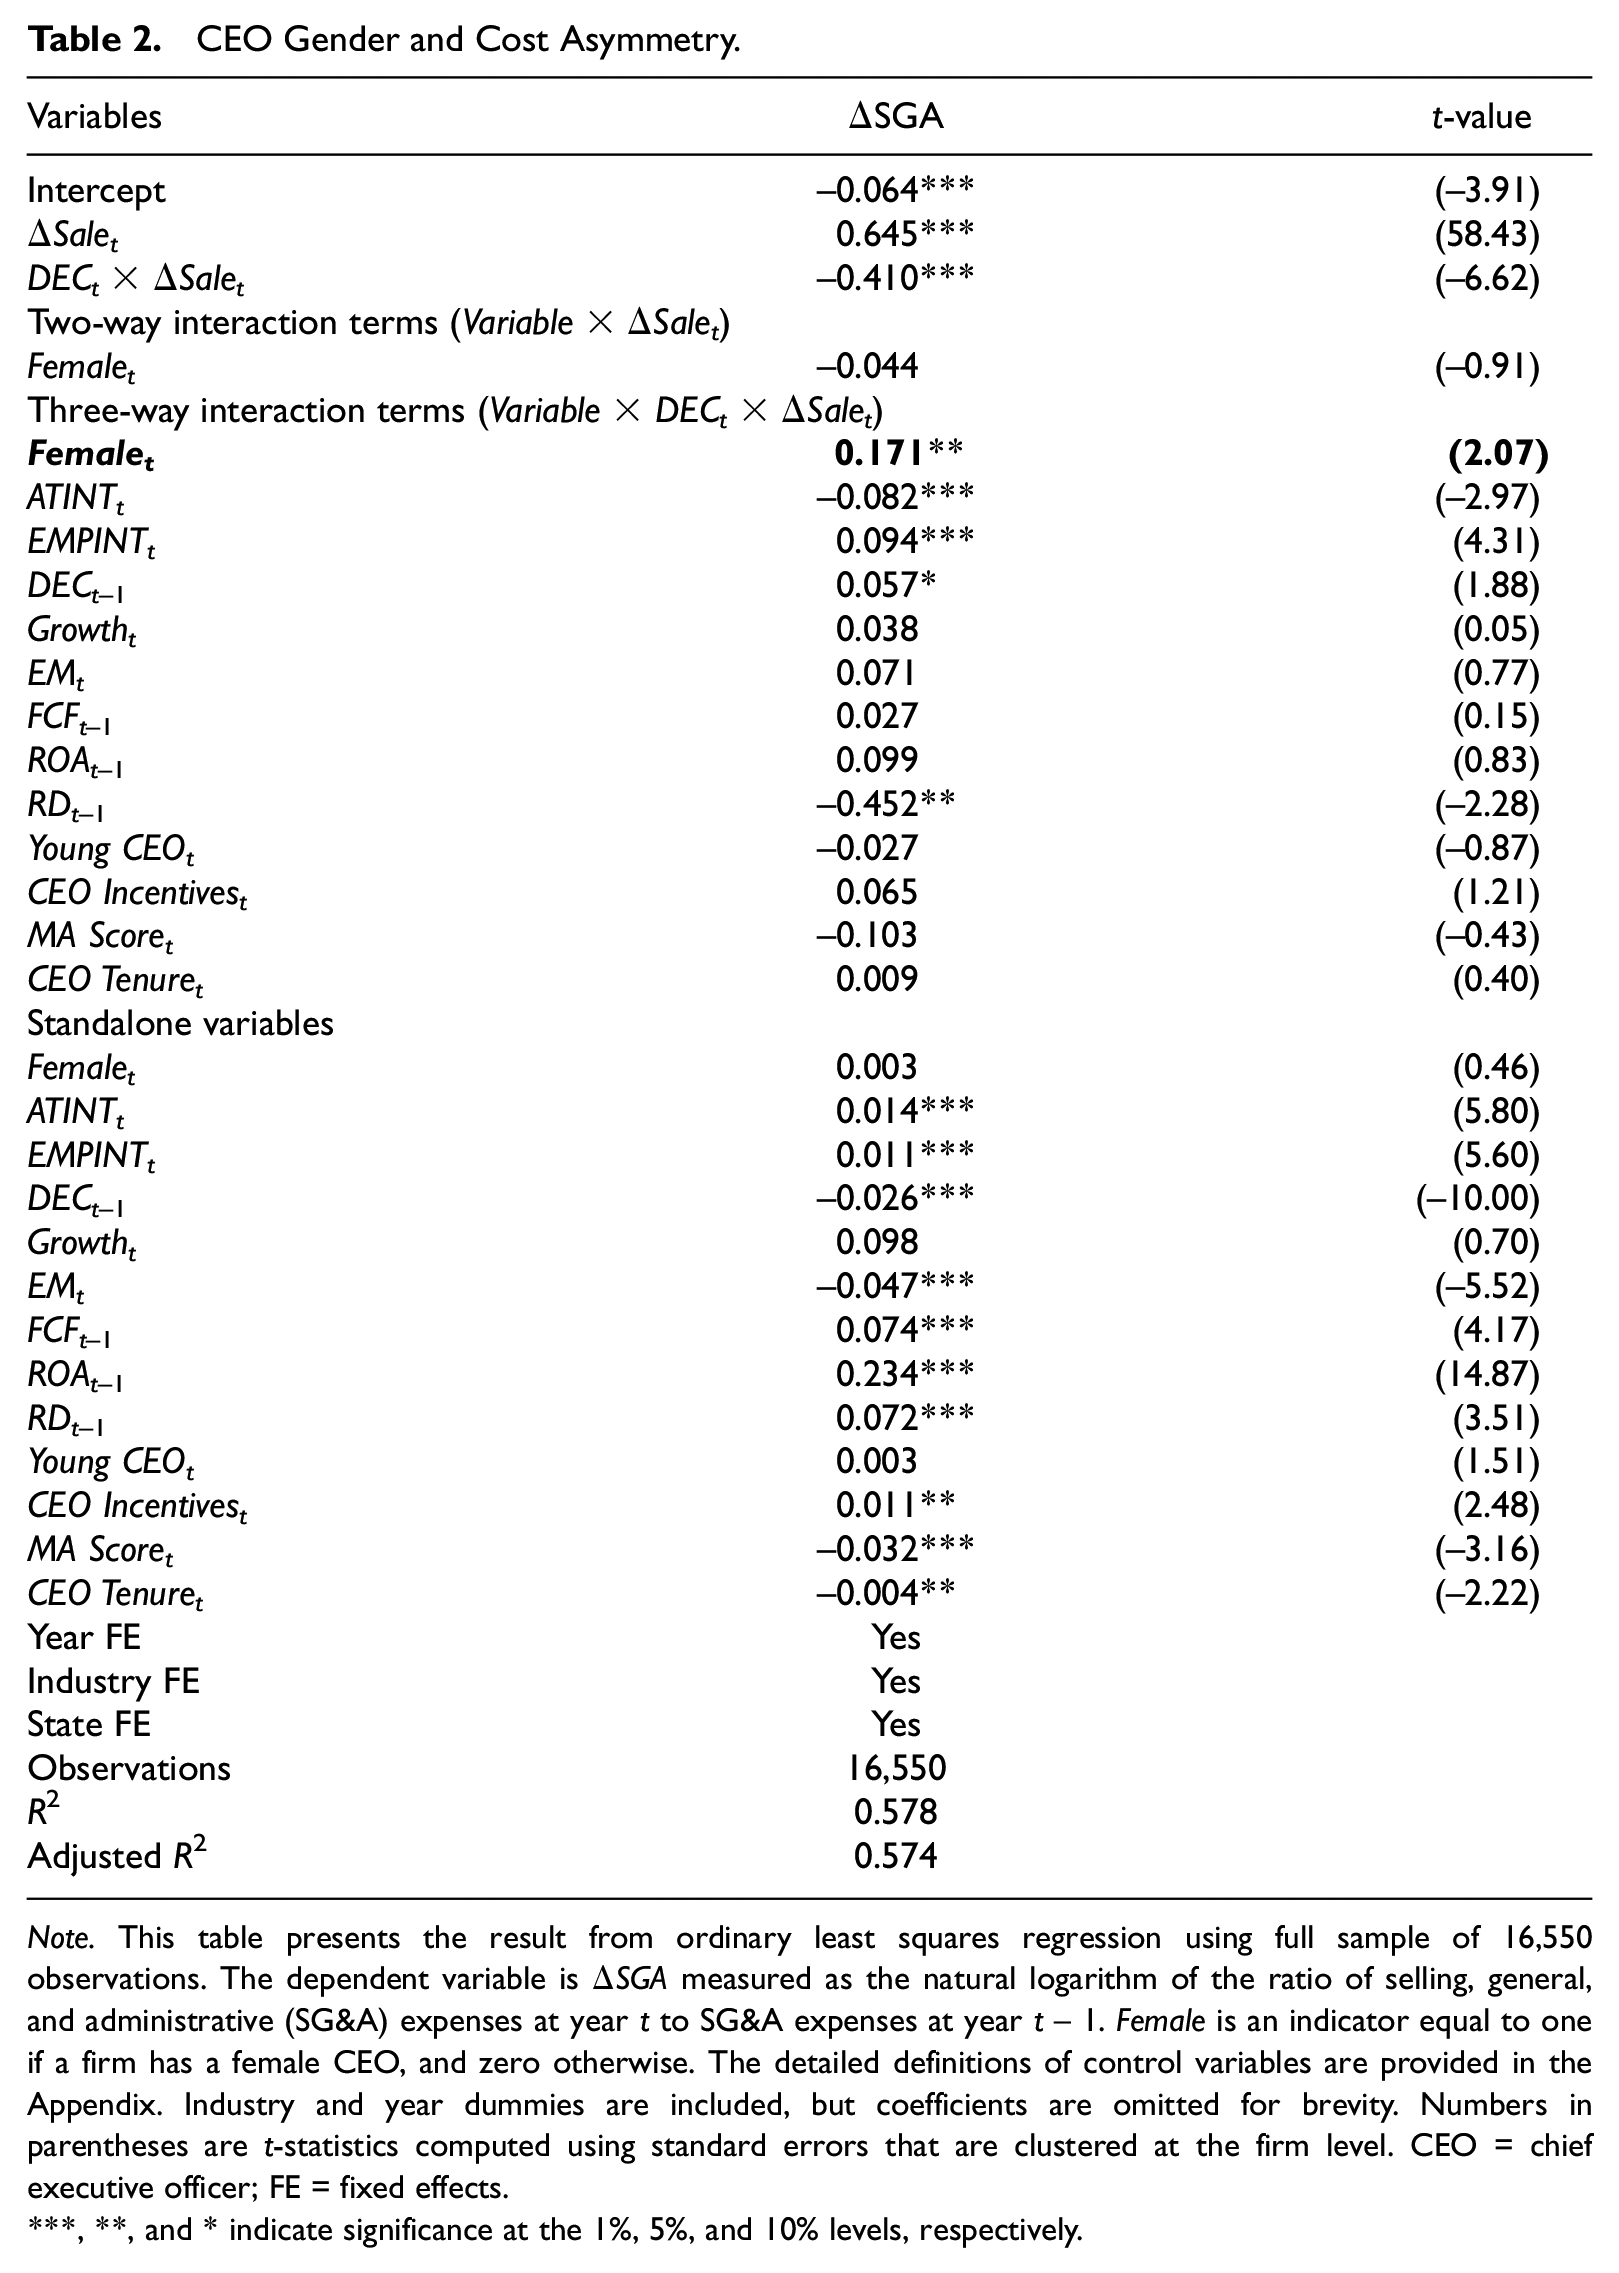
Note. This table presents the result from ordinary least squares regression using full sample of 16,550 observations. The dependent variable is ΔSGA measured as the natural logarithm of the ratio of selling, general, and administrative (SG&A) expenses at year t to SG&A expenses at year t − 1. Female is an indicator equal to one if a firm has a female CEO, and zero otherwise. The detailed definitions of control variables are provided in the Appendix. Industry and year dummies are included, but coefficients are omitted for brevity. Numbers in parentheses are t-statistics computed using standard errors that are clustered at the firm level. CEO = chief executive officer; FE = fixed effects.
, **, and * indicate significance at the 1%, 5%, and 10% levels, respectively.
Consistent with our hypothesis, we find that the coefficient on Femalet × DECt × ΔSalet is 0.171 and significant at the 5% level, indicating that firms with female CEOs experience less cost stickiness than firms with male CEOs. Economically, SG&A costs decrease around 0.362 (=0.645 − 0.410 − 0.044 + 0.171)% with 1% decrease in sales. We conduct an F-test for the sum between the coefficient on DECt × ΔSalet and the coefficient on Femalet × DECt × ΔSalet (−0.410 + 0.171 = −0.239). It is significant at the 5% level (p = .02). In terms of economic magnitude, our results show that female CEOs are about 0.127 (=0.362 − 0.235)% more decrease in SG&A expense with 1% decrease in sales compared to male CEOs. Relatively, female CEOs are about 54% (=0.127/0.235) less cost stickiness compared to male CEOs. Our results indicate that although cost behavior is still asymmetric for firms under the control of female CEOs, the degree of asymmetry is significantly less than firms under the control of male CEOs.
The coefficients on control variables are generally consistent with prior literature. The coefficient on ATINTt × DECt × ΔSalet is negative and significant at the 1% level. This indicates greater cost stickiness in firms with greater asset intensity, consistent with Anderson et al.’s (2003) study. Consistent with C. X. Chen et al. (2012) and Liu et al. (2019), the coefficient on EMPINTt × DECt × ΔSalet is positive and significant at the 1% level, indicating a less cost stickiness for firms with greater employee intensity. A positive and significant coefficient on DECt−1 × DECt × ΔSalet is consistent with Anderson et al.’s (2003) study, indicating that a successive decline in sales reduces cost stickiness. A negative and significant coefficient on RDt−1 × DECt × ΔSalet is consistent with Liu et al.’s (2019) study, indicating that previous-period R&D increases cost stickiness. We do not find significant coefficient on CEO Incentivest × DECt × ΔSalet. However, the fact that we find significant gender effect on cost stickiness with the control of CEO compensation incentives shows that gender effect, an innate characteristic, is incremental to the effect of external incentives.
Robustness Checks
PSM Approach
In our sample, only 3% of the firms have female CEOs. To make male CEO firms more comparable to female CEO firms, we employ a PSM methodology to match each female CEO firm with a male CEO firm with similar firm characteristics and CEO traits. This PSM methodology could also help mitigate functional form misspecification (Shipman et al., 2016). Specifically, we estimate the following probit regression:
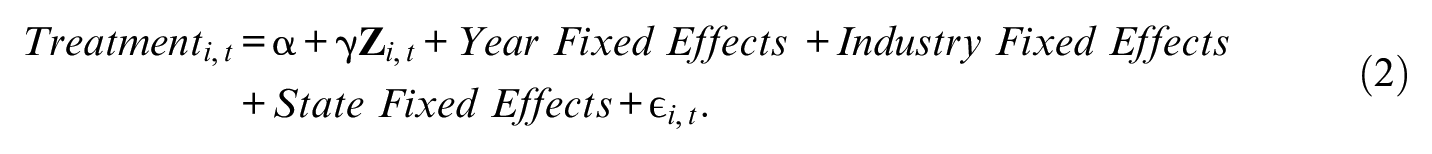
Treatment equals one if a firm has a female CEO, and zero otherwise.
Propensity Score Matching.
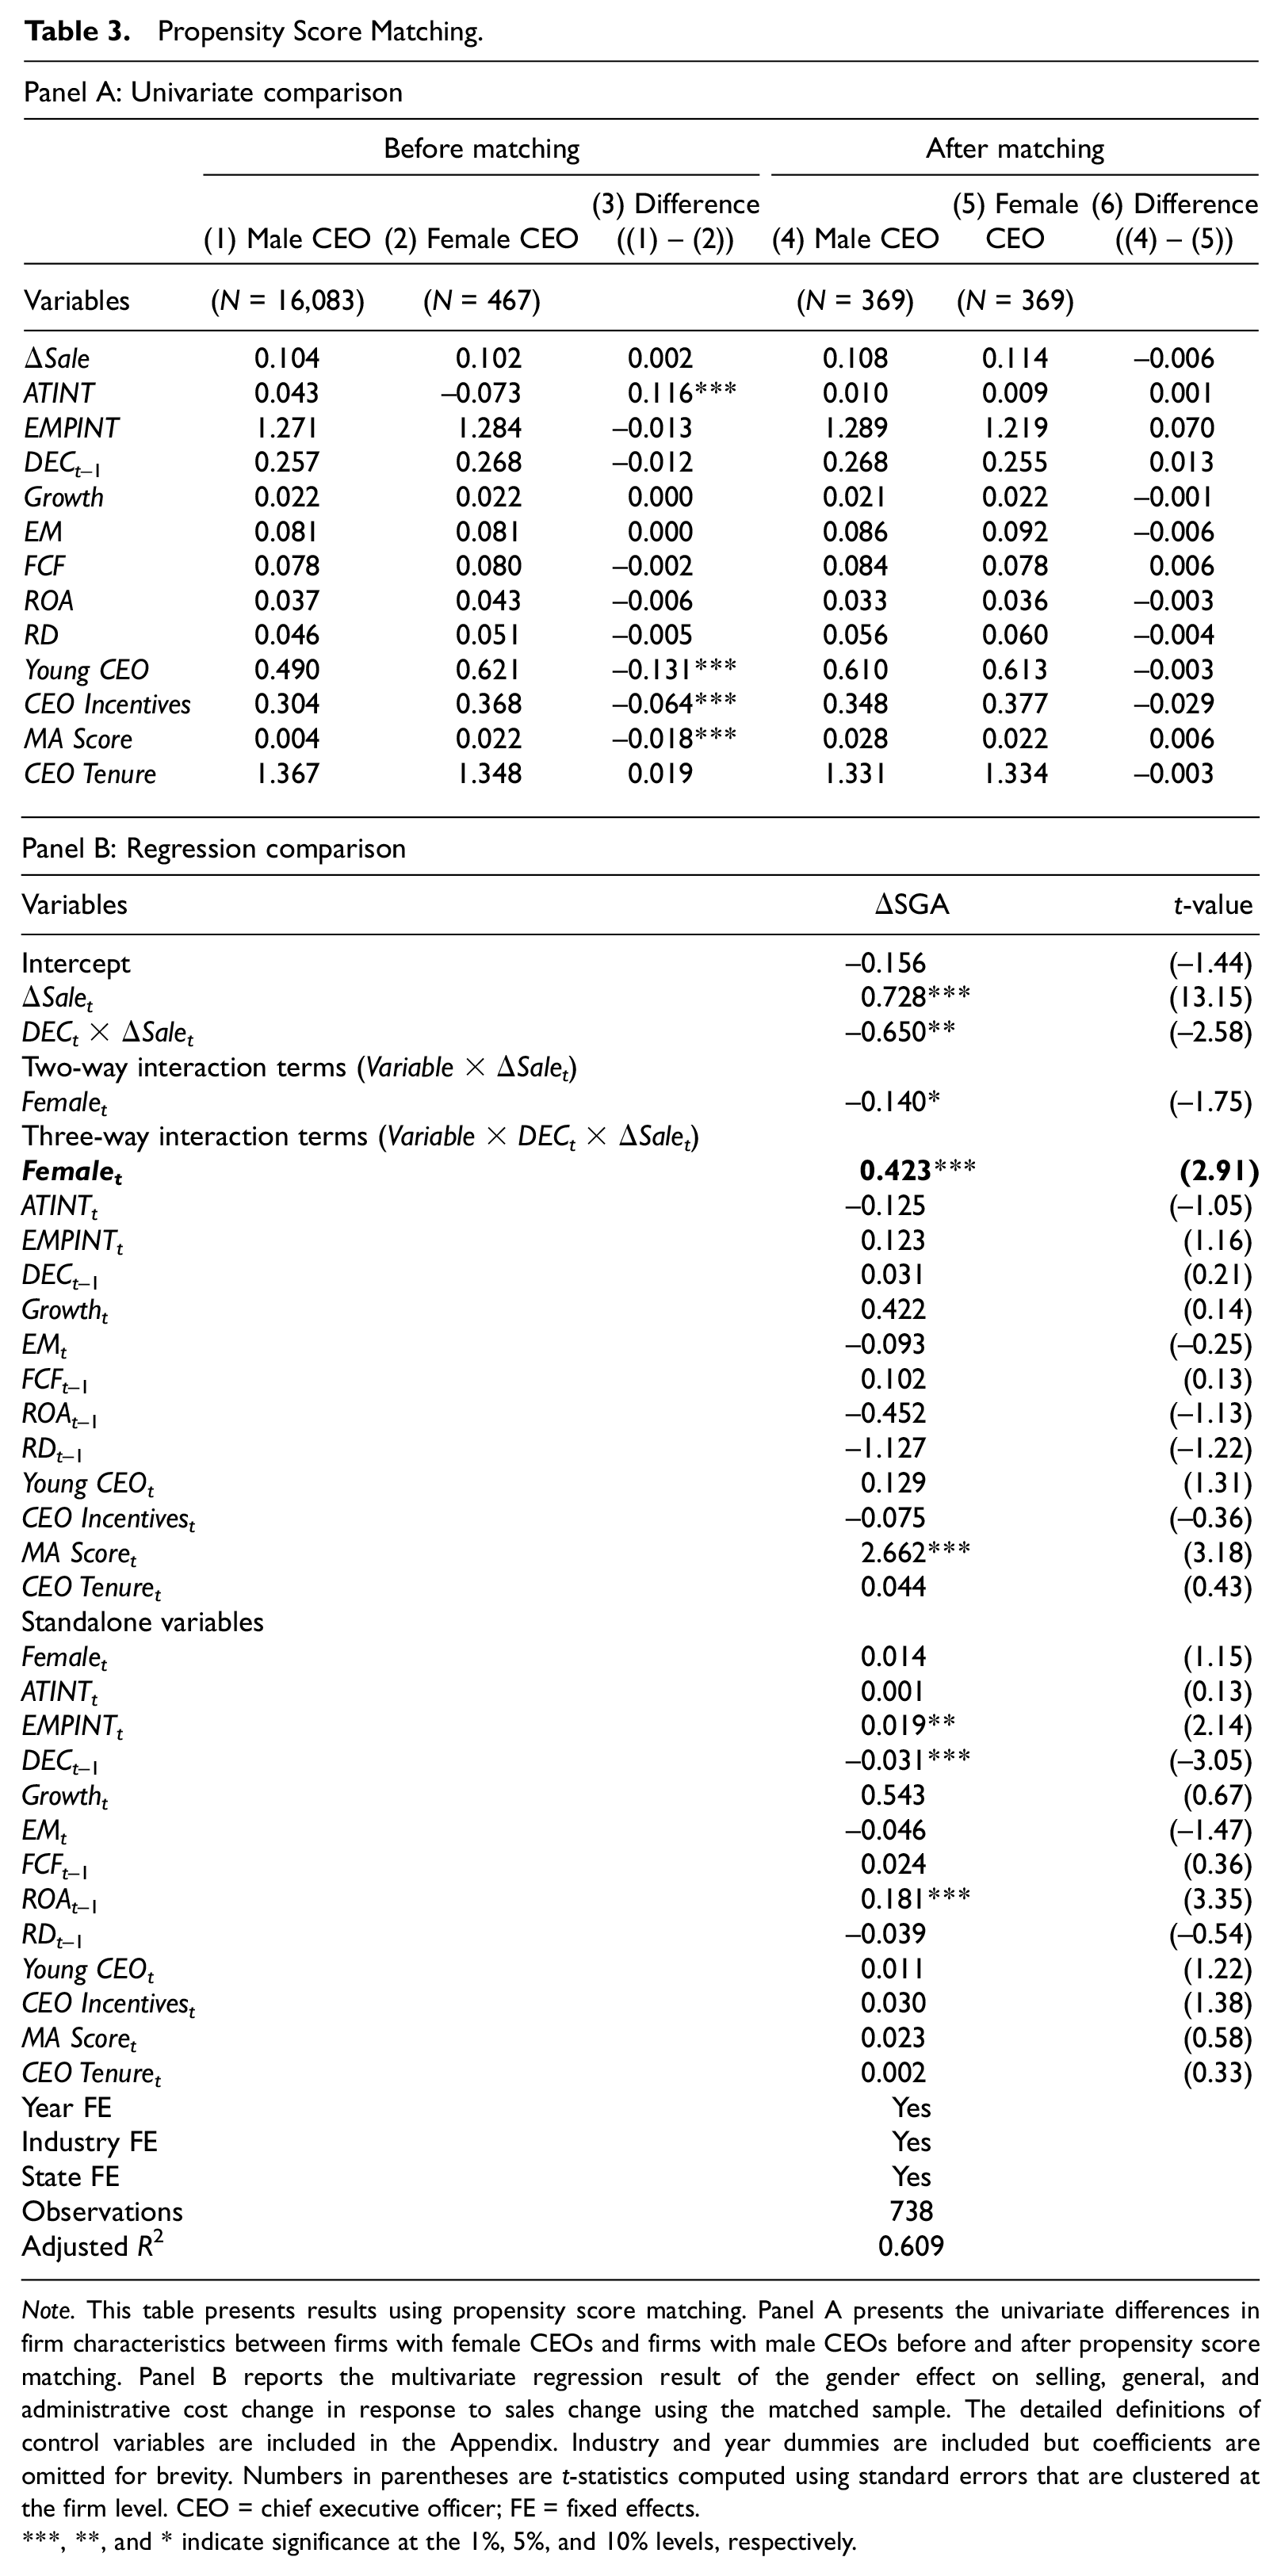
Note. This table presents results using propensity score matching. Panel A presents the univariate differences in firm characteristics between firms with female CEOs and firms with male CEOs before and after propensity score matching. Panel B reports the multivariate regression result of the gender effect on selling, general, and administrative cost change in response to sales change using the matched sample. The detailed definitions of control variables are included in the Appendix. Industry and year dummies are included but coefficients are omitted for brevity. Numbers in parentheses are t-statistics computed using standard errors that are clustered at the firm level. CEO = chief executive officer; FE = fixed effects.
, **, and * indicate significance at the 1%, 5%, and 10% levels, respectively.
Next, using the matched sample, we examine the effect of female CEOs on cost stickiness with a multivariate regression model. Panel B of Table 3 presents results. The coefficient on Femalet × DECt × ΔSalet is positive and significant at the 1% level, indicating a less cost stickiness for firms with female CEOs. Overall, the result based on PSM confirms the baseline result and mitigates the concern that our baseline result is driven by systemic differences between two compared groups or functional form misspecification.
Difference-in-Differences Model Using CEO Gender Transitions
To further mitigate endogeneity concerns, similar to Francis et al. (2015), we exploit the CEO transitions as a quasi-natural experiment. Specifically, we keep firms with male-to-female CEO transitions and male-to-male CEO transitions and compare these two groups of firms to identify the gender effect. To have a clean sample, we exclude firms having more than one CEO transitions during our sample period. Using this sample, we conduct a difference-in-differences test. The treatment sample includes those firms with male-to-female CEO transitions, and the control sample includes those firms with male-to-male CEO transitions. We create a dummy variable FemaleT that equals one if a firm is a male-to-female CEO transition firm and zero if a firm is a male-to-male CEO transition firm. Post is a dummy variable that equals one if the year is after the transition year, and zero otherwise. The variable of interest is FemaleT × Post × DECt × ΔSalet, capturing the incremental change in SG&A costs at 1% of sales decrease for firms with male-to-female CEO transitions after the transition year, compared to male-to-male CEO transitions.
Table 4 reports the result. The coefficient on FemaleT × Post × DECt × ΔSalet is positive and significant at the 10% level, indicating a less cost stickiness for firms with male-to-female CEO transitions after the transition year. It shows that firms reduce more SG&A costs at the 1% decrease in sales when they hire female CEOs to replace their previous male CEOs, compared to firms transiting from male CEOs to male CEOs. We acknowledge that CEO transitions are not exogenous events. Nonetheless, this result does provide additional convincing evidence of the gender effect on cost stickiness.
Difference-in-Differences Analysis.
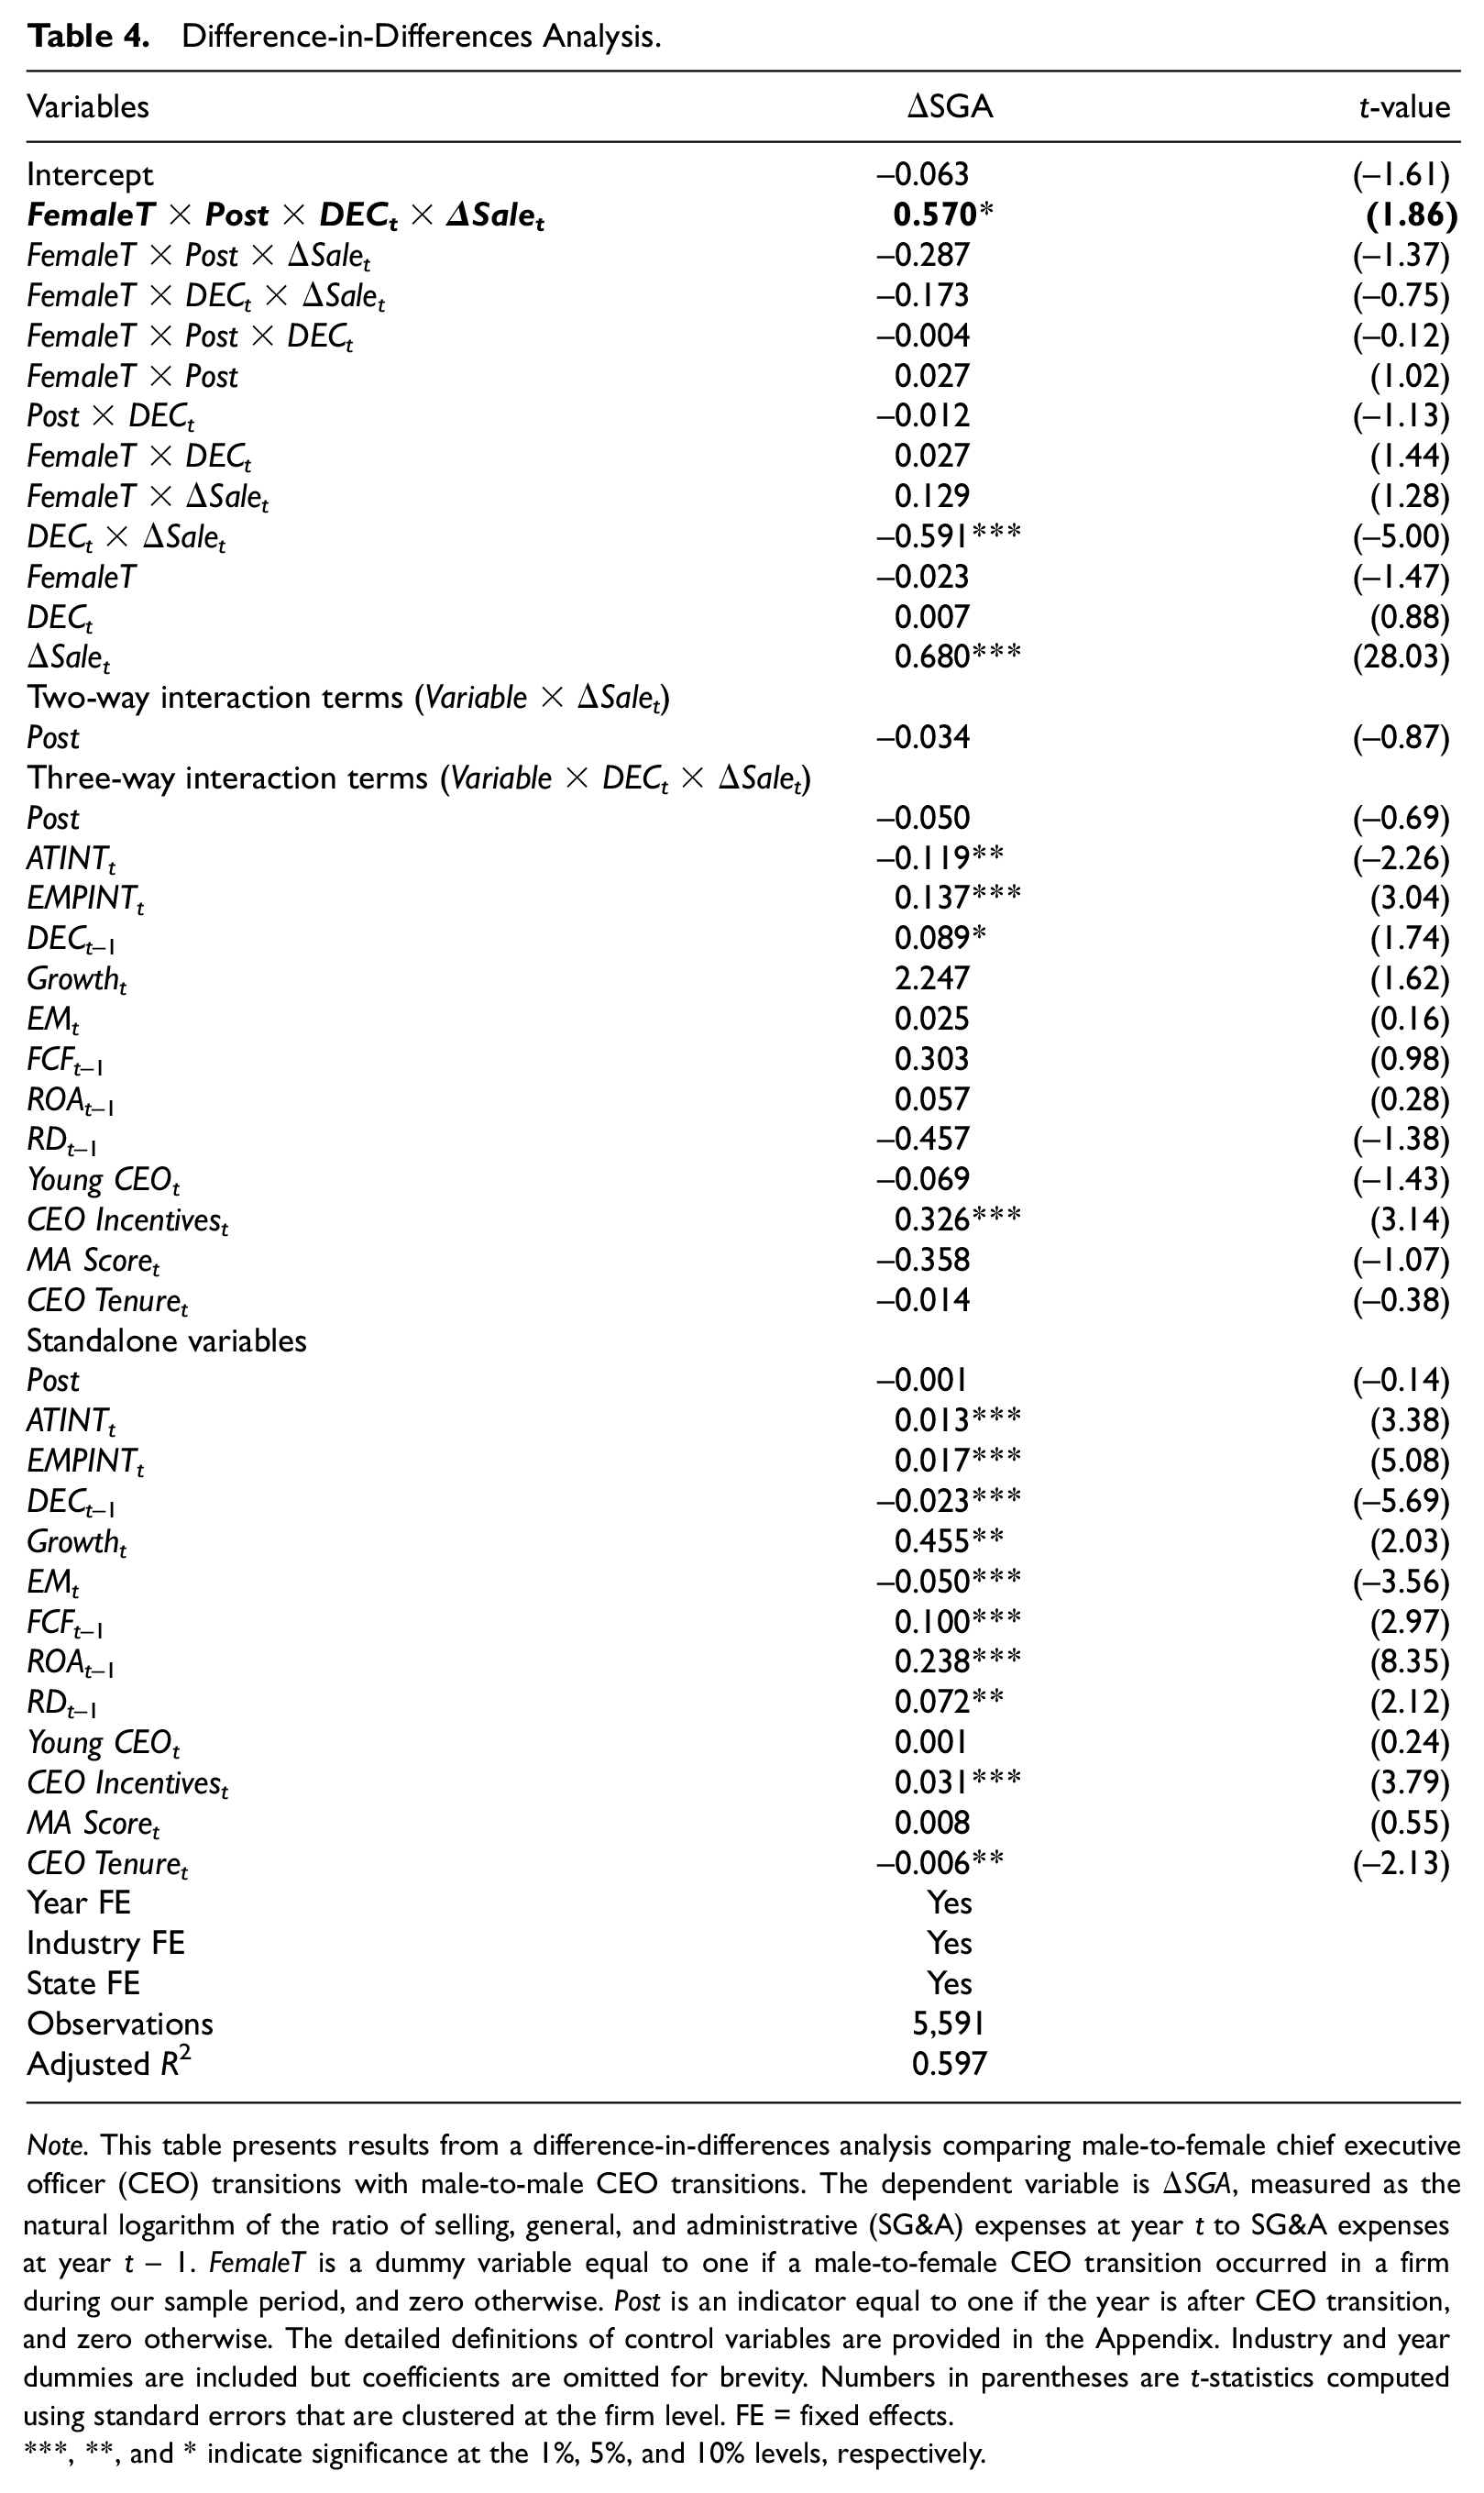
Note. This table presents results from a difference-in-differences analysis comparing male-to-female chief executive officer (CEO) transitions with male-to-male CEO transitions. The dependent variable is ΔSGA, measured as the natural logarithm of the ratio of selling, general, and administrative (SG&A) expenses at year t to SG&A expenses at year t − 1. FemaleT is a dummy variable equal to one if a male-to-female CEO transition occurred in a firm during our sample period, and zero otherwise. Post is an indicator equal to one if the year is after CEO transition, and zero otherwise. The detailed definitions of control variables are provided in the Appendix. Industry and year dummies are included but coefficients are omitted for brevity. Numbers in parentheses are t-statistics computed using standard errors that are clustered at the firm level. FE = fixed effects.
, **, and * indicate significance at the 1%, 5%, and 10% levels, respectively.
Heckman Two-Stage Model
To mitigate the concern that female CEOs are not randomly selected into firms, we apply the Heckman (1979) two-stage procedure to deal with the potential self-selection bias. The first-stage probit model finds the probability of having a female CEO. Therefore, the dependent variable is Female, as we defined earlier. In addition to the basic variables for firm characteristics, we include a series of variables that could affect the selection of female CEOs. These additional variables are as follows. Overall Index is a state-level gender equality index proposed by Di Noia (2002). The rationale is that firms in a state that are friendlier to women’s equality generally are more likely to have female CEOs. No theoretical or empirical evidence suggests that the choice of a firm’s headquarter location in a state with higher gender status equality could directly affect its asymmetric cost behavior. Therefore, the exclusion condition cannot be rejected. We also include the following in the first-stage model: Female Board Members (pctg), the number of female board members divided by total board members; Duality, a dummy variable equal to one if the CEO is also the chairman of the board, and zero otherwise; Board Size, the natural logarithm of the number of board members; and Independent Board Members (pctg), the number of independent board members divided by total board members. These variables capture the board governance, which could affect the selection of a female CEO for the firm. Then we calculate Inverse Mills Ratio from the selection model (first-stage) and include it as an additional control variable in our baseline regression (second-stage).
Table 5 presents the results. Column 1 reports the first-stage result. We find that firms are more likely to have female CEOs when they are in the states with higher gender equality index and when they have more female members on the boards. Firms are less likely to have female CEOs if their chairmen of the boards are also CEOs (i.e., board duality). The larger the board size, the less likely a firm has a female CEO. Young CEO and CEO Incentives are positively correlated to the likelihood of the CEO being a woman while MTB is negatively associated with the likelihood of the CEO being a woman. We obtain the Inverse Mills ratio from the first-stage regression and include it in the second-stage model to mitigate selection bias. Column 2 reports the result. After controlling for potential selection bias, we continue to find a significant gender effect. The result mitigates the concern of self-selection bias.
Heckman Two-Stage Model.
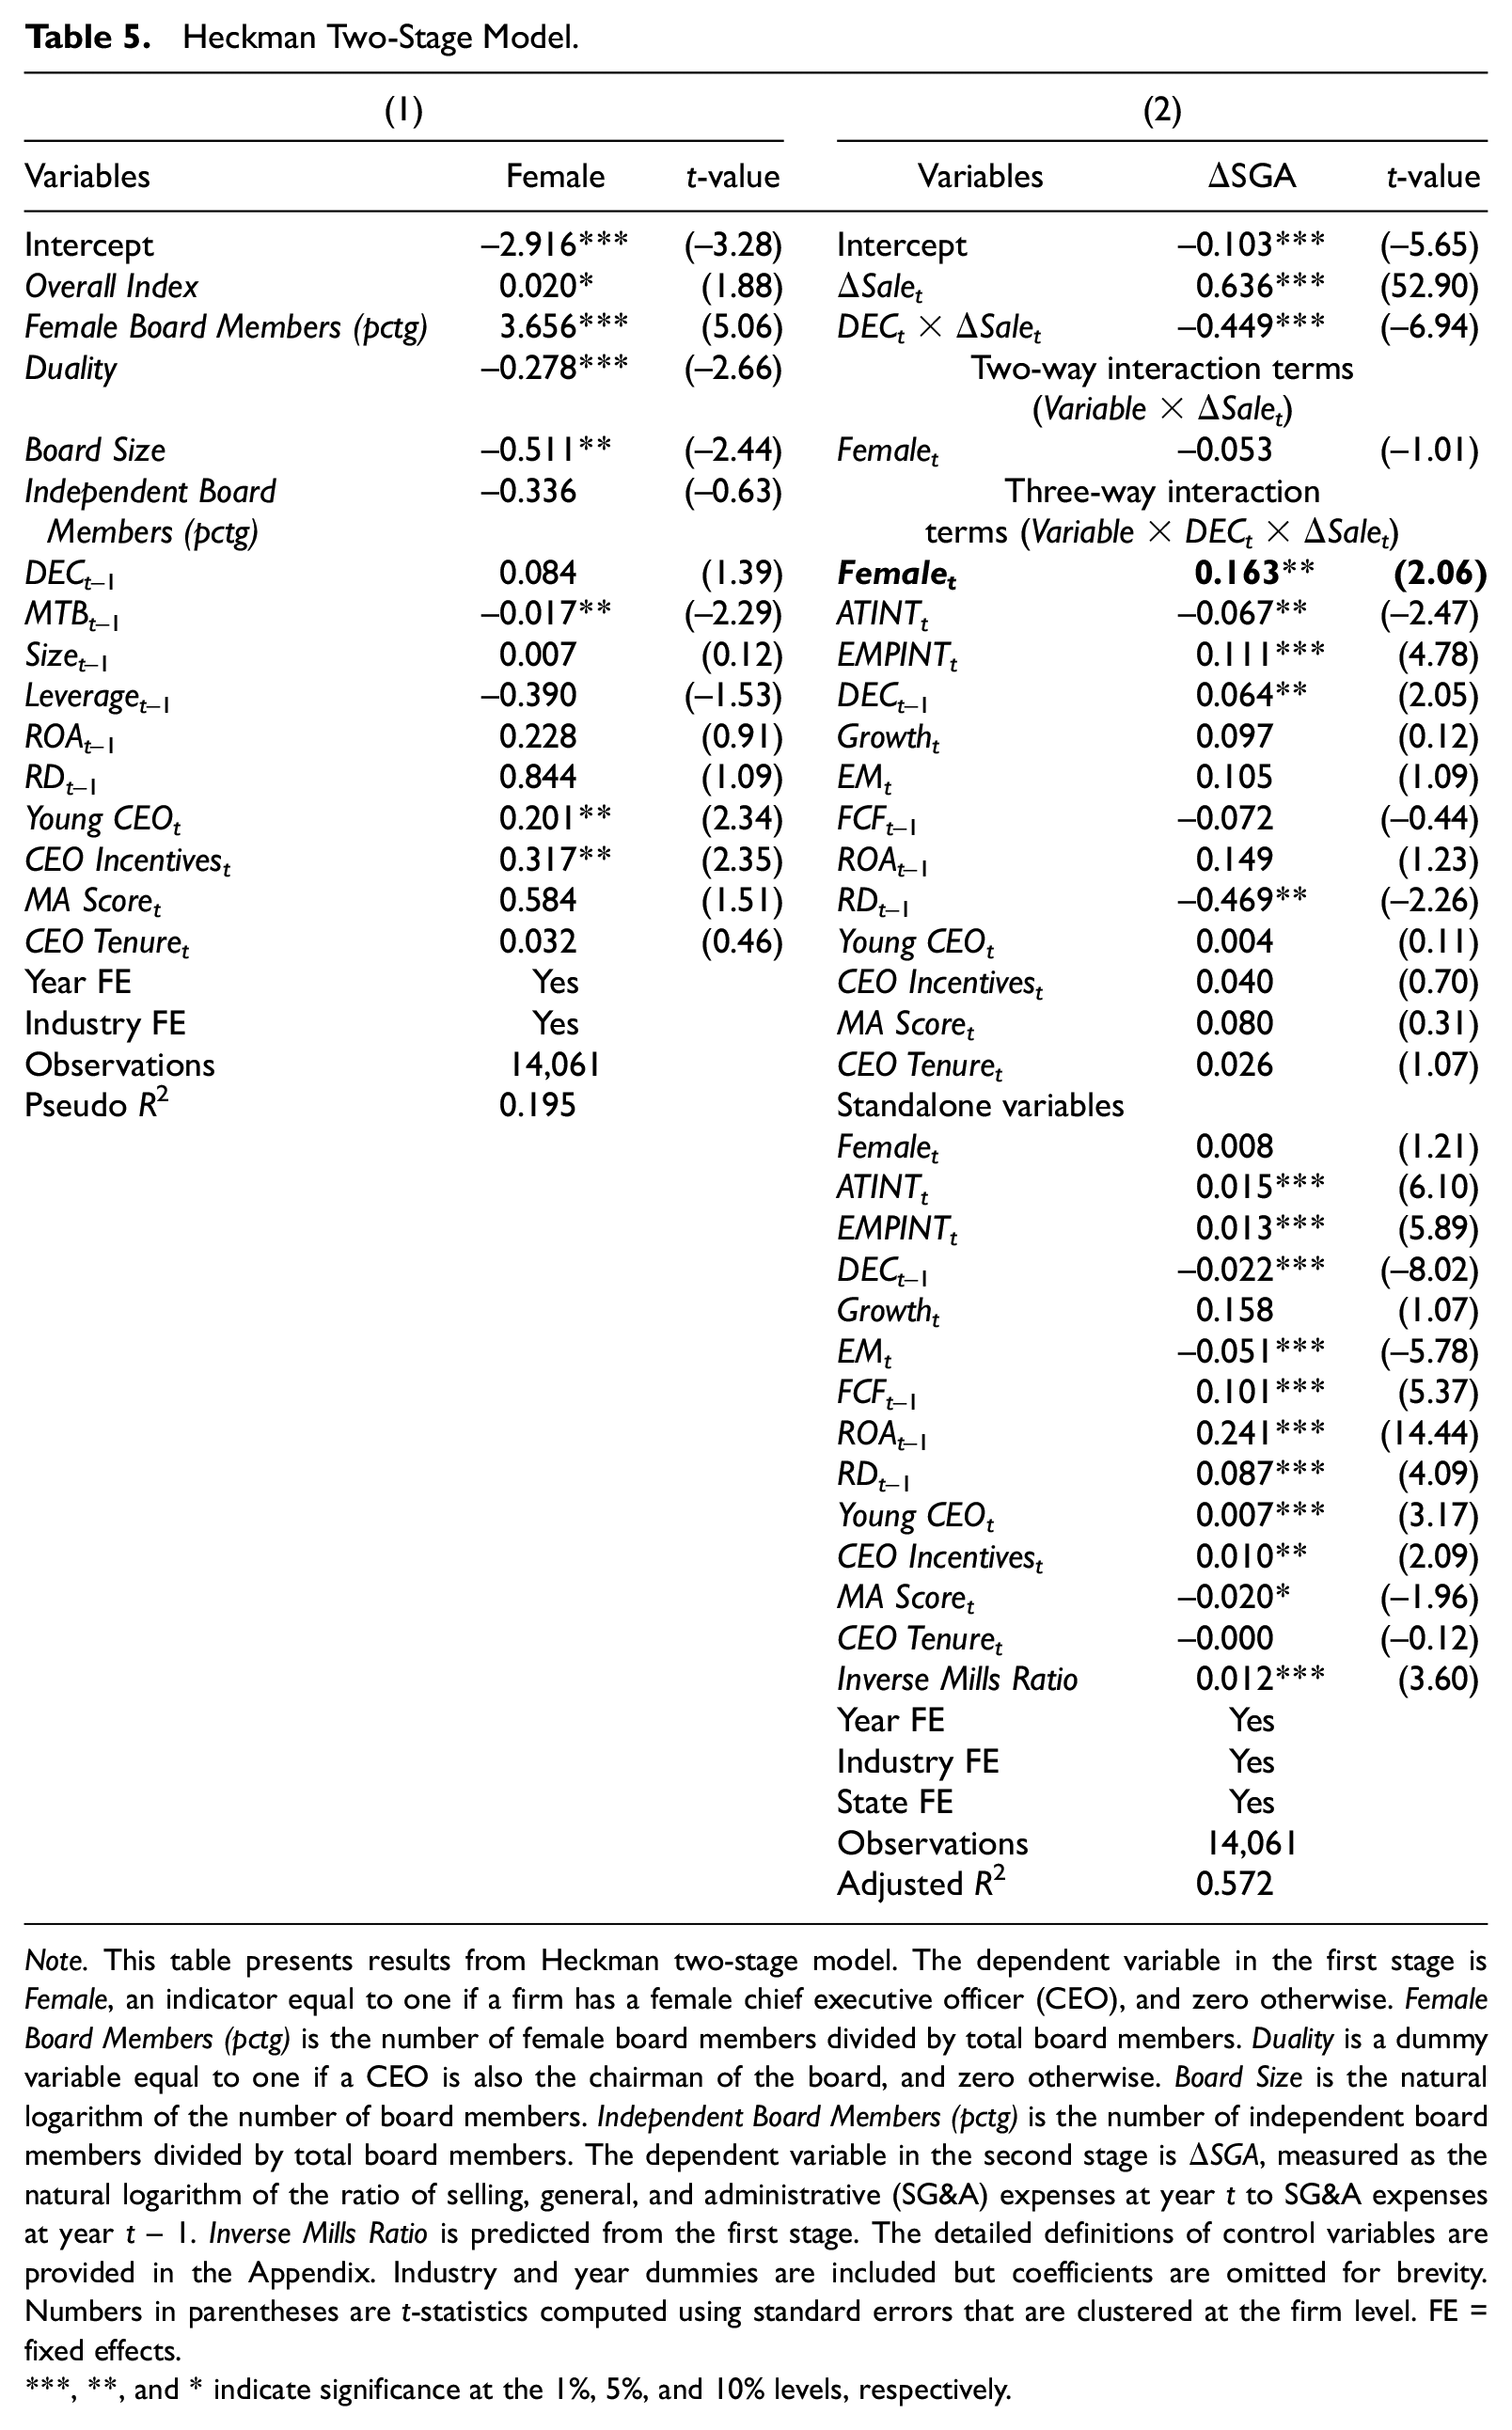
Note. This table presents results from Heckman two-stage model. The dependent variable in the first stage is Female, an indicator equal to one if a firm has a female chief executive officer (CEO), and zero otherwise. Female Board Members (pctg) is the number of female board members divided by total board members. Duality is a dummy variable equal to one if a CEO is also the chairman of the board, and zero otherwise. Board Size is the natural logarithm of the number of board members. Independent Board Members (pctg) is the number of independent board members divided by total board members. The dependent variable in the second stage is ΔSGA, measured as the natural logarithm of the ratio of selling, general, and administrative (SG&A) expenses at year t to SG&A expenses at year t − 1. Inverse Mills Ratio is predicted from the first stage. The detailed definitions of control variables are provided in the Appendix. Industry and year dummies are included but coefficients are omitted for brevity. Numbers in parentheses are t-statistics computed using standard errors that are clustered at the firm level. FE = fixed effects.
, **, and * indicate significance at the 1%, 5%, and 10% levels, respectively.
Cross-Sectional Tests
Although females on average are more risk-averse and have lower levels of competitiveness, their risk and competitive preferences are more likely to exhibit when they face situations with higher levels of risk and competition. If risk and competitive preferences are the underlying channels through which female CEOs affect their firms’ asymmetric cost behavior, we expect to find that the CEO gender effect is more pronounced in riskier situations.
We conduct four sets of cross-sectional tests based on macro-, firm-, and individual-level risk as well as the level of product market competition. We expect that the gender effect is more pronounced when female CEOs face higher macro-economic risk, higher firm-level business risk, higher personal job security risk, and higher product market competition. To test these conjectures, we separate the full sample into two subsamples based on these risk and competition measures and then test whether there are significant differences in the CEO gender effect on cost stickiness between subsamples.
The Effect of Macro-Level Economic Risk
The uncertainty about future demand is higher when the economy is in a bust cycle than when the economy is in a booming cycle. Therefore, we expect that the gender differences in cost stickiness to be more pronounced in a bust period than in a booming period. We use two ways to construct economic bust and booming cycles. First, given the fact that the 2009 to 2011 financial crisis is one of the worst economic downturns in U.S. history, we use the 2009 to 2011 financial crisis as a bust cycle and compare this crisis period with the pre-crisis period of the years 2006 to 2008. The second, and more general, measure is based on GNP growth rates. Specifically, we define the time period when GNP growth rate is above the median of the sample period as the booming cycle and the time period when GNP growth rate is below the median of the sample period as the bust cycle.
Table 6 presents the results. Columns 1 and 2 use the financial crisis and Columns 3 and 4 use the GNP growth rates to capture macro-economic risk. We find that the coefficients on Femalet × DECt × ΔSalet are only significantly positive for the financial crisis period and for the bust time period (Columns 1 and 3). These results indicate that the CEO gender effect is concentrated on the time period of the bust economy with a higher level of economic uncertainty. In Columns 2 and 4, we find that the coefficients on Femalet × DECt ×ΔSalet are insignificant, indicating that there is no gender effect on cost stickiness when the economy is booming. The results are consistent with our conjecture that because in the booming economy period the level of macro-economic risk is relatively lower, female CEOs exhibit less cost asymmetry in such a circumstance. In sum, the results based on macro-level economic risk provide supportive evidence that risk aversion of female executives is an underlying channel through which female executives affect cost stickiness.
Cross-Sectional Tests: Macro-Economic Risk.
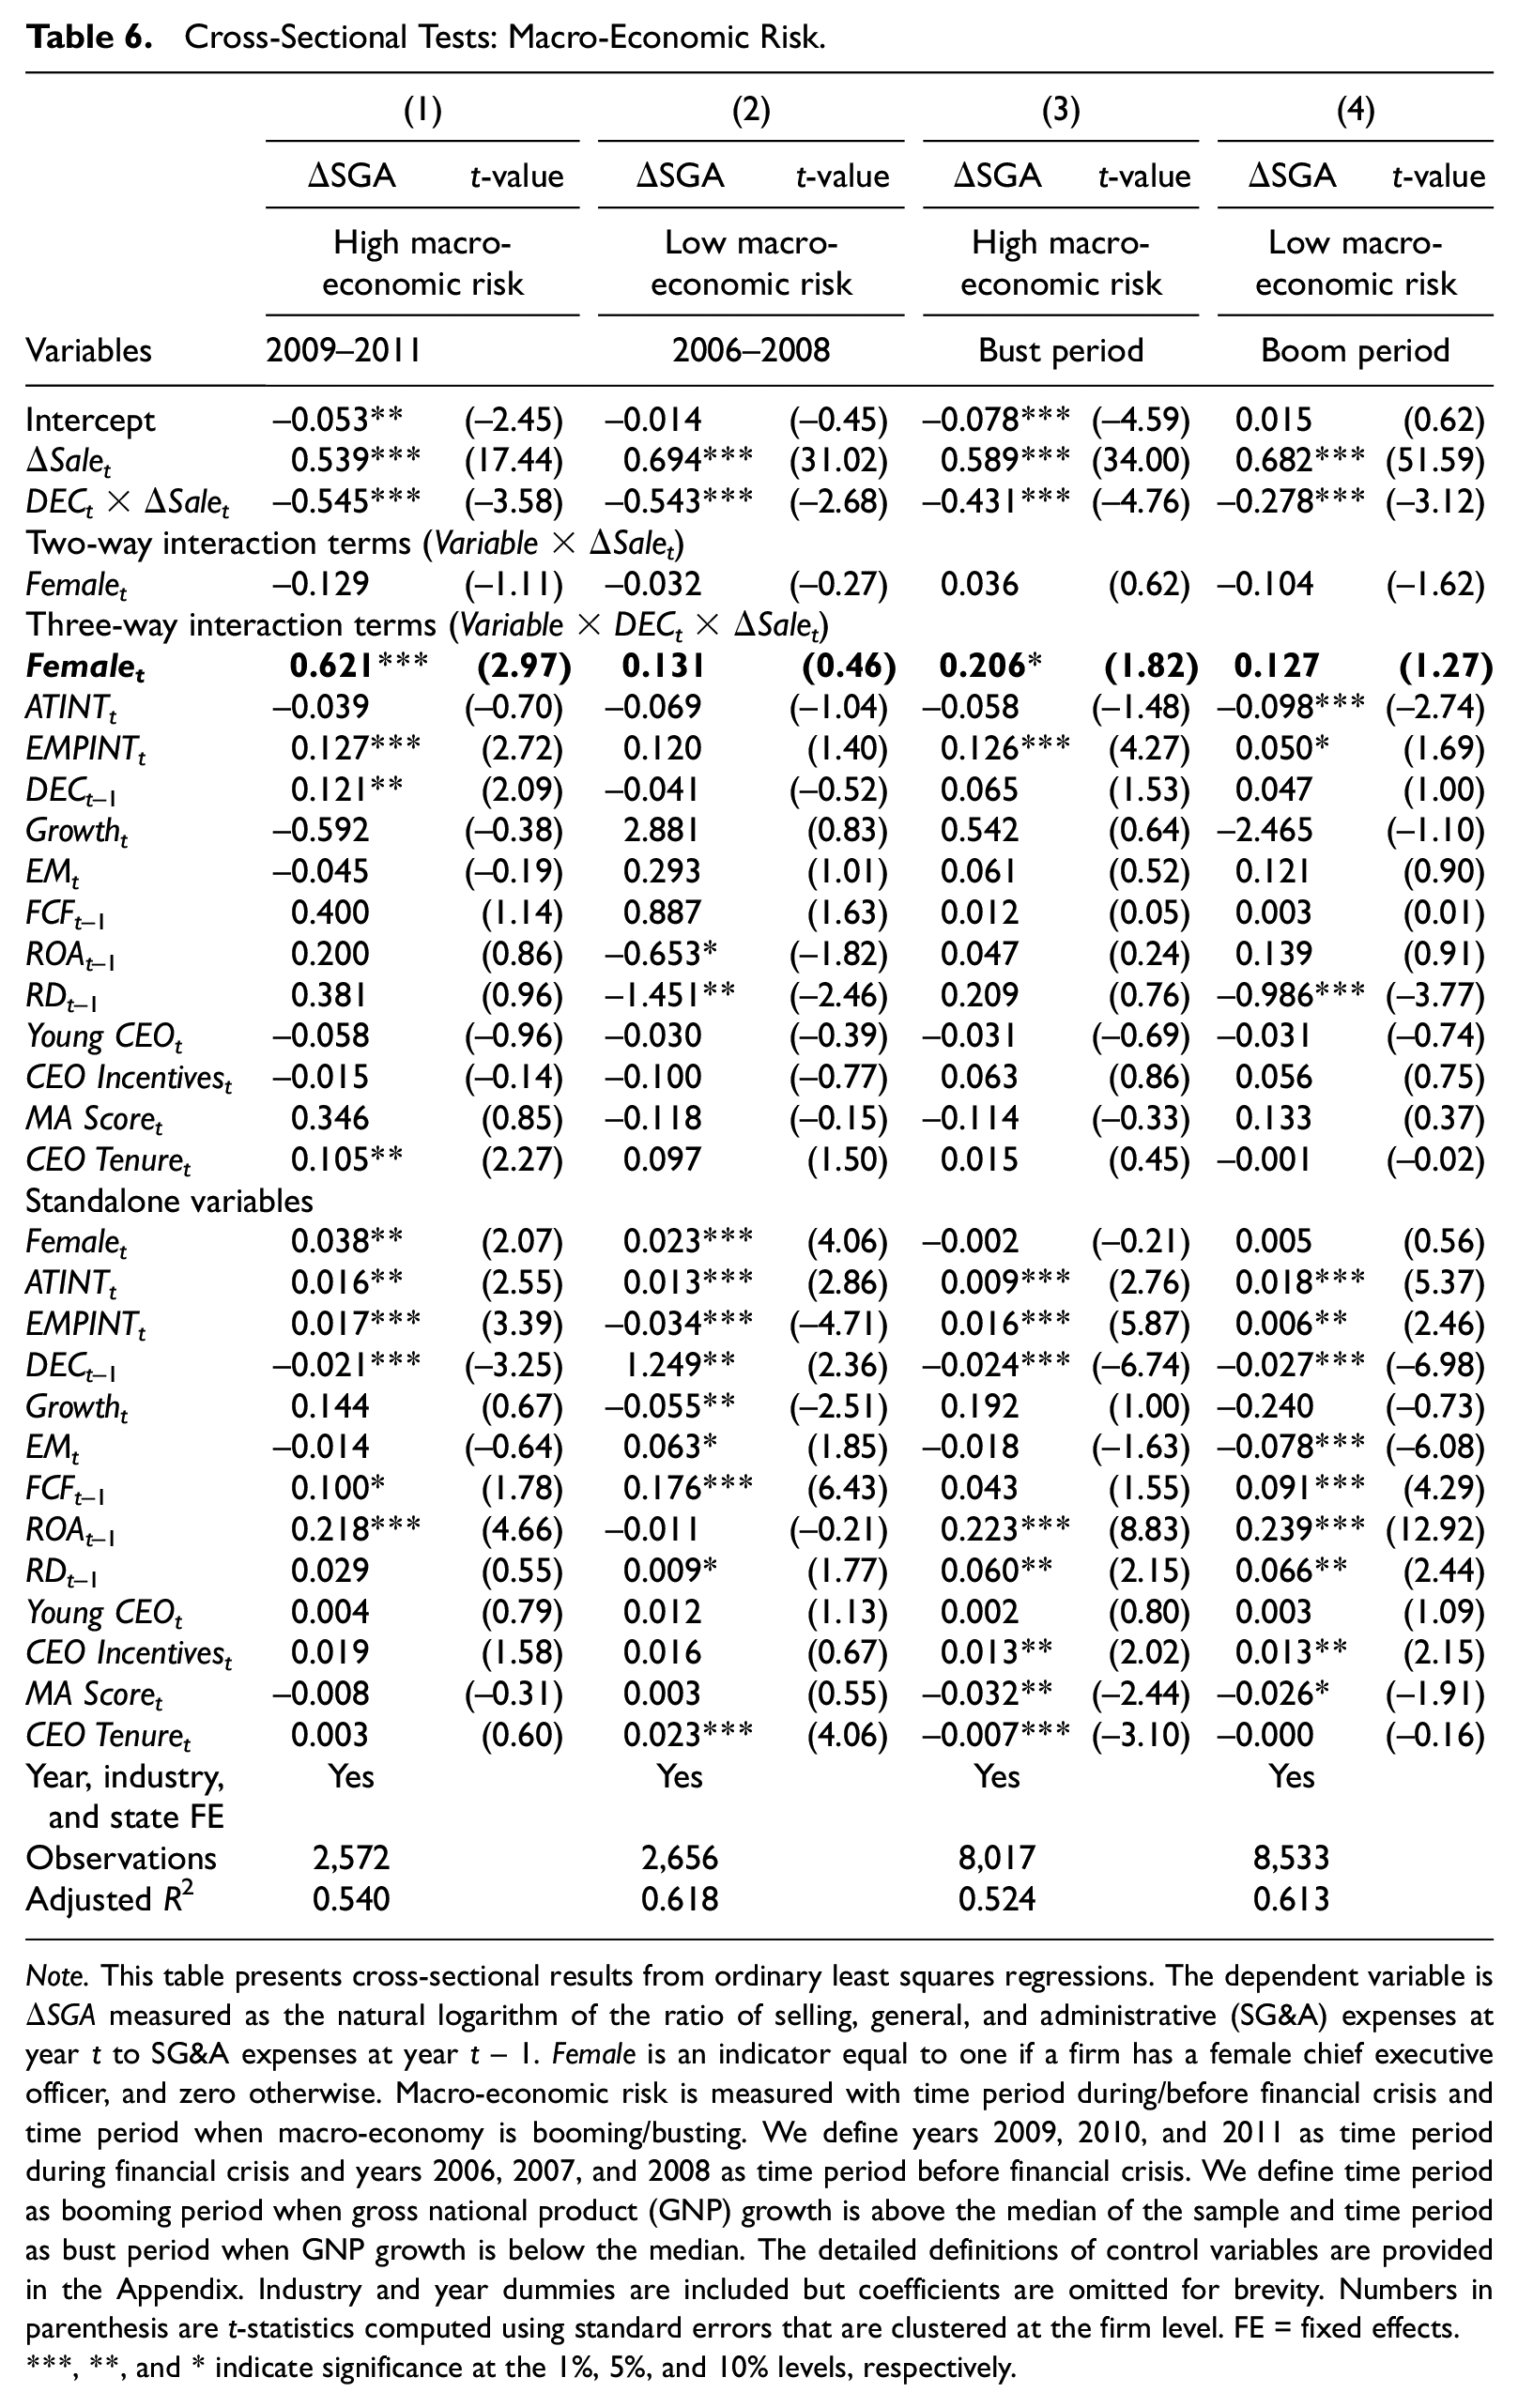
Note. This table presents cross-sectional results from ordinary least squares regressions. The dependent variable is ΔSGA measured as the natural logarithm of the ratio of selling, general, and administrative (SG&A) expenses at year t to SG&A expenses at year t − 1. Female is an indicator equal to one if a firm has a female chief executive officer, and zero otherwise. Macro-economic risk is measured with time period during/before financial crisis and time period when macro-economy is booming/busting. We define years 2009, 2010, and 2011 as time period during financial crisis and years 2006, 2007, and 2008 as time period before financial crisis. We define time period as booming period when gross national product (GNP) growth is above the median of the sample and time period as bust period when GNP growth is below the median. The detailed definitions of control variables are provided in the Appendix. Industry and year dummies are included but coefficients are omitted for brevity. Numbers in parenthesis are t-statistics computed using standard errors that are clustered at the firm level. FE = fixed effects.
, **, and * indicate significance at the 1%, 5%, and 10% levels, respectively.
The Effect of Firm-Level Business Risk
Higher business risk indicates that the uncertainty about future demand is higher. On the contrary, when firms face lower business risk, future demand is more stable. Therefore, the assessed probability of future demand for firms with lower business risk is less likely to be influenced by executives’ attitudes toward risk. In contrast, when future demand is highly uncertain, female CEOs tend to exhibit their risk aversion attitudes and assign a greater possibility to the decrease in future demand. Thus, we expect that the gender effect on cost asymmetry is more pronounced for firms with higher business risk.
We measure business risk in two ways. The first proxy is sales volatility, calculated as the standard deviation of sales revenue over the 5 years divided by the average sales revenue over the same time period. 10 We separate the sample in terciles based on sales volatility. Firms in bottom tercile have less business risk. The second proxy is the PC1 as used in Stanley’s (2011) study. The five business risk proxies are ROA_Earnings, ROA_Cash, Current Ratio, Leverage, and Inverse Interest Coverage. ROA_Earnings is calculated using operating income after depreciation divided by total assets at the beginning of period; ROA_Cash is calculated using operating cash flows divided by current liabilities; Current Ratio is current assets divided by current liabilities; Leverage is the ratio of the sum of short- and long-term debt to book value of total assets; Inverse Interest Coverage is measured as interest expense divided by operating income before depreciation with a cap of 2.00 (if operating income before depreciation is negative, Inverse Interest Coverage is assigned to have a value of 2.00). We separate the sample based on the sample median of this principal component.
Table 7 presents the results. Columns 1 and 2 use sales volatility as a business risk proxy, and Columns 3 and 4 use the principal component as a business risk proxy. We find that the coefficients on Femalet × DECt × ΔSalet are only positive and significant for firms with high business risk (Columns 1 and 3). These results indicate that the gender effect on cost stickiness is concentrated in high-business-risk firms. The insignificant coefficients on Femalet × DECt × ΔSalet in Columns 2 and 4 suggest that there is no gender effect on cost stickiness when business risk is lower. The results are consistent with our conjecture that because the range of the assessed probability of future demand is narrowed for low-business-risk firms, the gender differences in assessment and cost management decisions accordingly are not exhibited. In sum, the results based on business risk are consistent with our conjecture and support our hypothesis that risk aversion is an underlying channel through which female CEOs affect cost stickiness.
Cross-Sectional Tests: Firm-Level Business Risk.
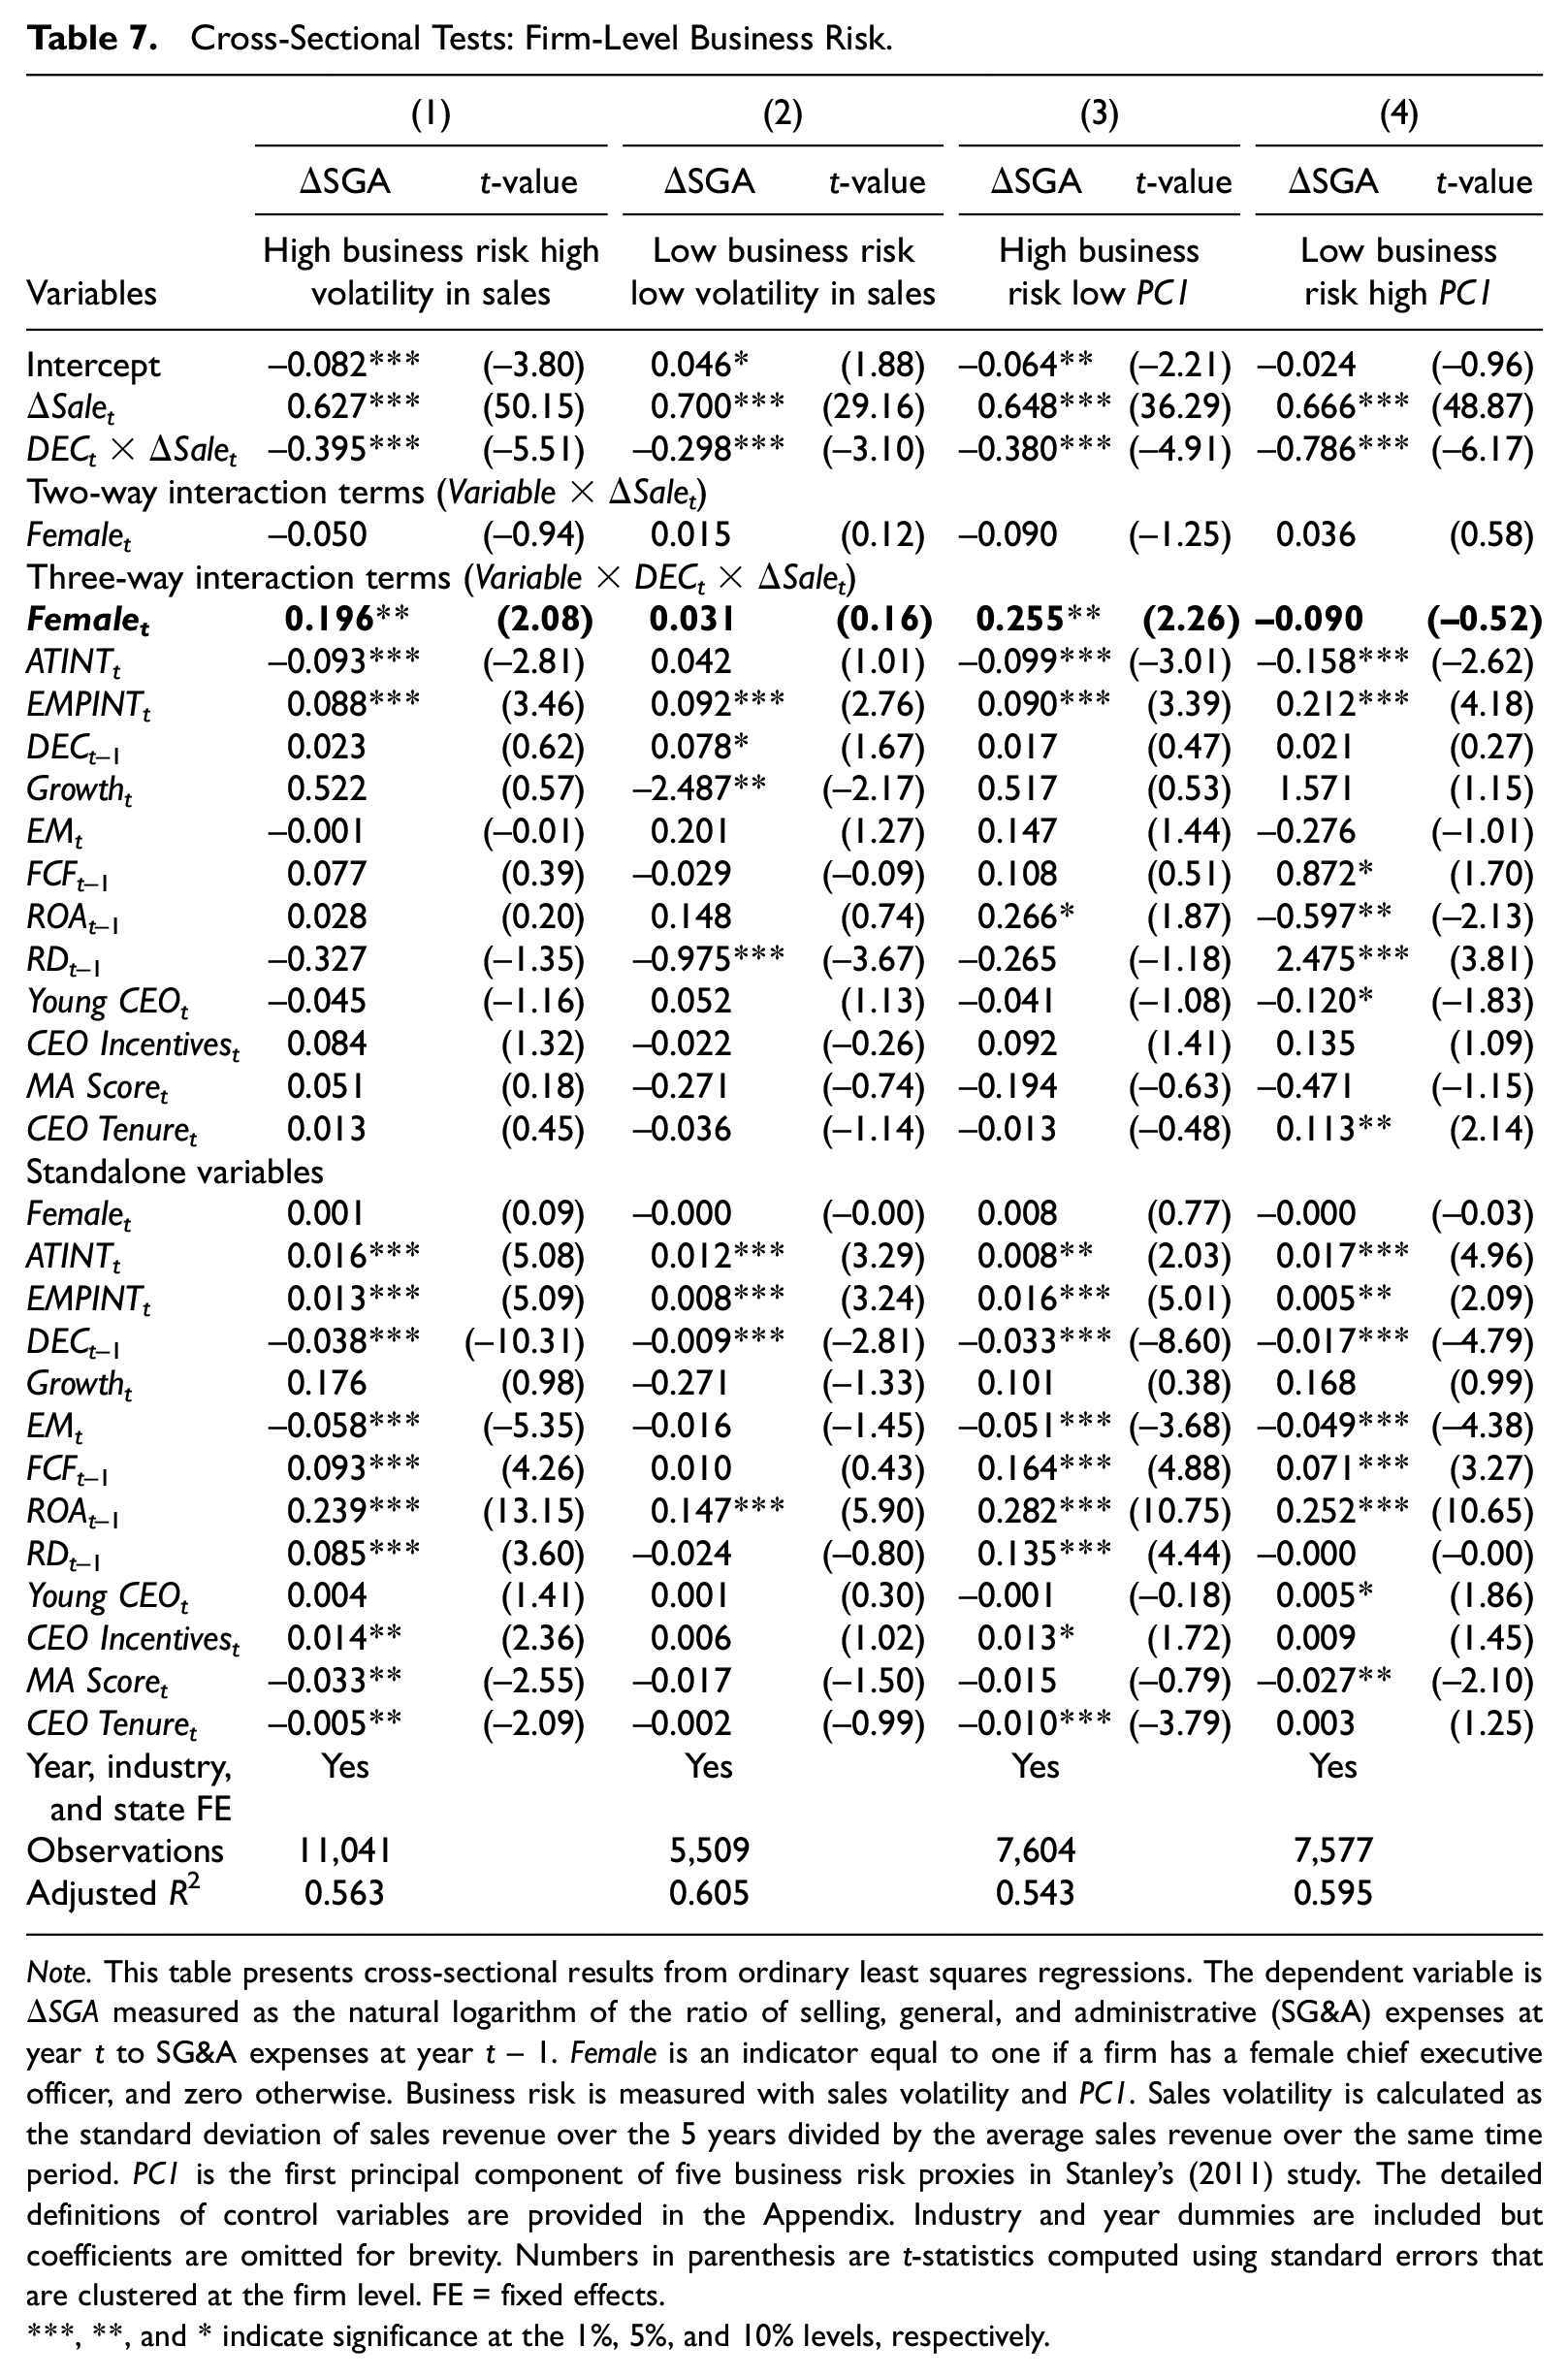
Note. This table presents cross-sectional results from ordinary least squares regressions. The dependent variable is ΔSGA measured as the natural logarithm of the ratio of selling, general, and administrative (SG&A) expenses at year t to SG&A expenses at year t − 1. Female is an indicator equal to one if a firm has a female chief executive officer, and zero otherwise. Business risk is measured with sales volatility and PC1. Sales volatility is calculated as the standard deviation of sales revenue over the 5 years divided by the average sales revenue over the same time period. PC1 is the first principal component of five business risk proxies in Stanley’s (2011) study. The detailed definitions of control variables are provided in the Appendix. Industry and year dummies are included but coefficients are omitted for brevity. Numbers in parenthesis are t-statistics computed using standard errors that are clustered at the firm level. FE = fixed effects.
, **, and * indicate significance at the 1%, 5%, and 10% levels, respectively.
The Effect of Individual-Level Job Security Risk
Female CEOs are more likely to be fired than male CEOs (Fortune 2018). 11 In addition, female CEOs have a lower chance of regaining jobs than males after resignation. Therefore, Female CEOs are more concerned about their job security than their male counterparts. Francis et al. (2015) point out that female executives exhibit more conservative when they are confronted with higher job security risk. Therefore, we expect that risk-averse female CEOs are more likely to adjust costs to avoid substantial loss due to keeping slack resources. Thus, we expect that the gender effect on cost stickiness is more pronounced when CEOs face higher job security risk.
We use two measures to proxy for CEO career risk. The first one is whether firms are protected from takeovers under state-level antitakeover law. Firms often experience high management turnover after takeovers (Walsh, 1989). To the extent that antitakeover law reduces the possibility of hostile takeovers, firms under antitakeover law experience lower job security risk. We define firms in states with less than three antitakeover laws passed as those having CEOs less entrenched and therefore facing higher career risk. The second proxy is the CEO’s tenure. CEOs’ tenure is positively associated with CEOs’ risk-taking behavior due to their fewer career concerns with longer tenures (D. Chen & Zheng, 2014). CEO tenure is separated based on the median value in the full sample.
Table 8 presents the results. Columns 1 and 2 use state-level antitakeover law as job security risk proxy. Columns 3 and 4 report results using CEO tenure as job security risk proxy. The results show female CEOs exhibit less cost stickiness when they are less entrenched and less tenured. When CEOs are more entrenched and have longer tenures, their positions are relatively secure. Thus, they are less worried about getting fired and less concerned about the high costs of keeping slack resources. In such a case, the decisions made by female CEOs and male CEOs are less different. Therefore, the results triangulate our findings of the macro-economic risk test and the business risk test and further confirm that risk aversion of female CEOs is an underlying mechanism of the CEO gender effect.
Cross-Sectional Tests: Job Security Risk.
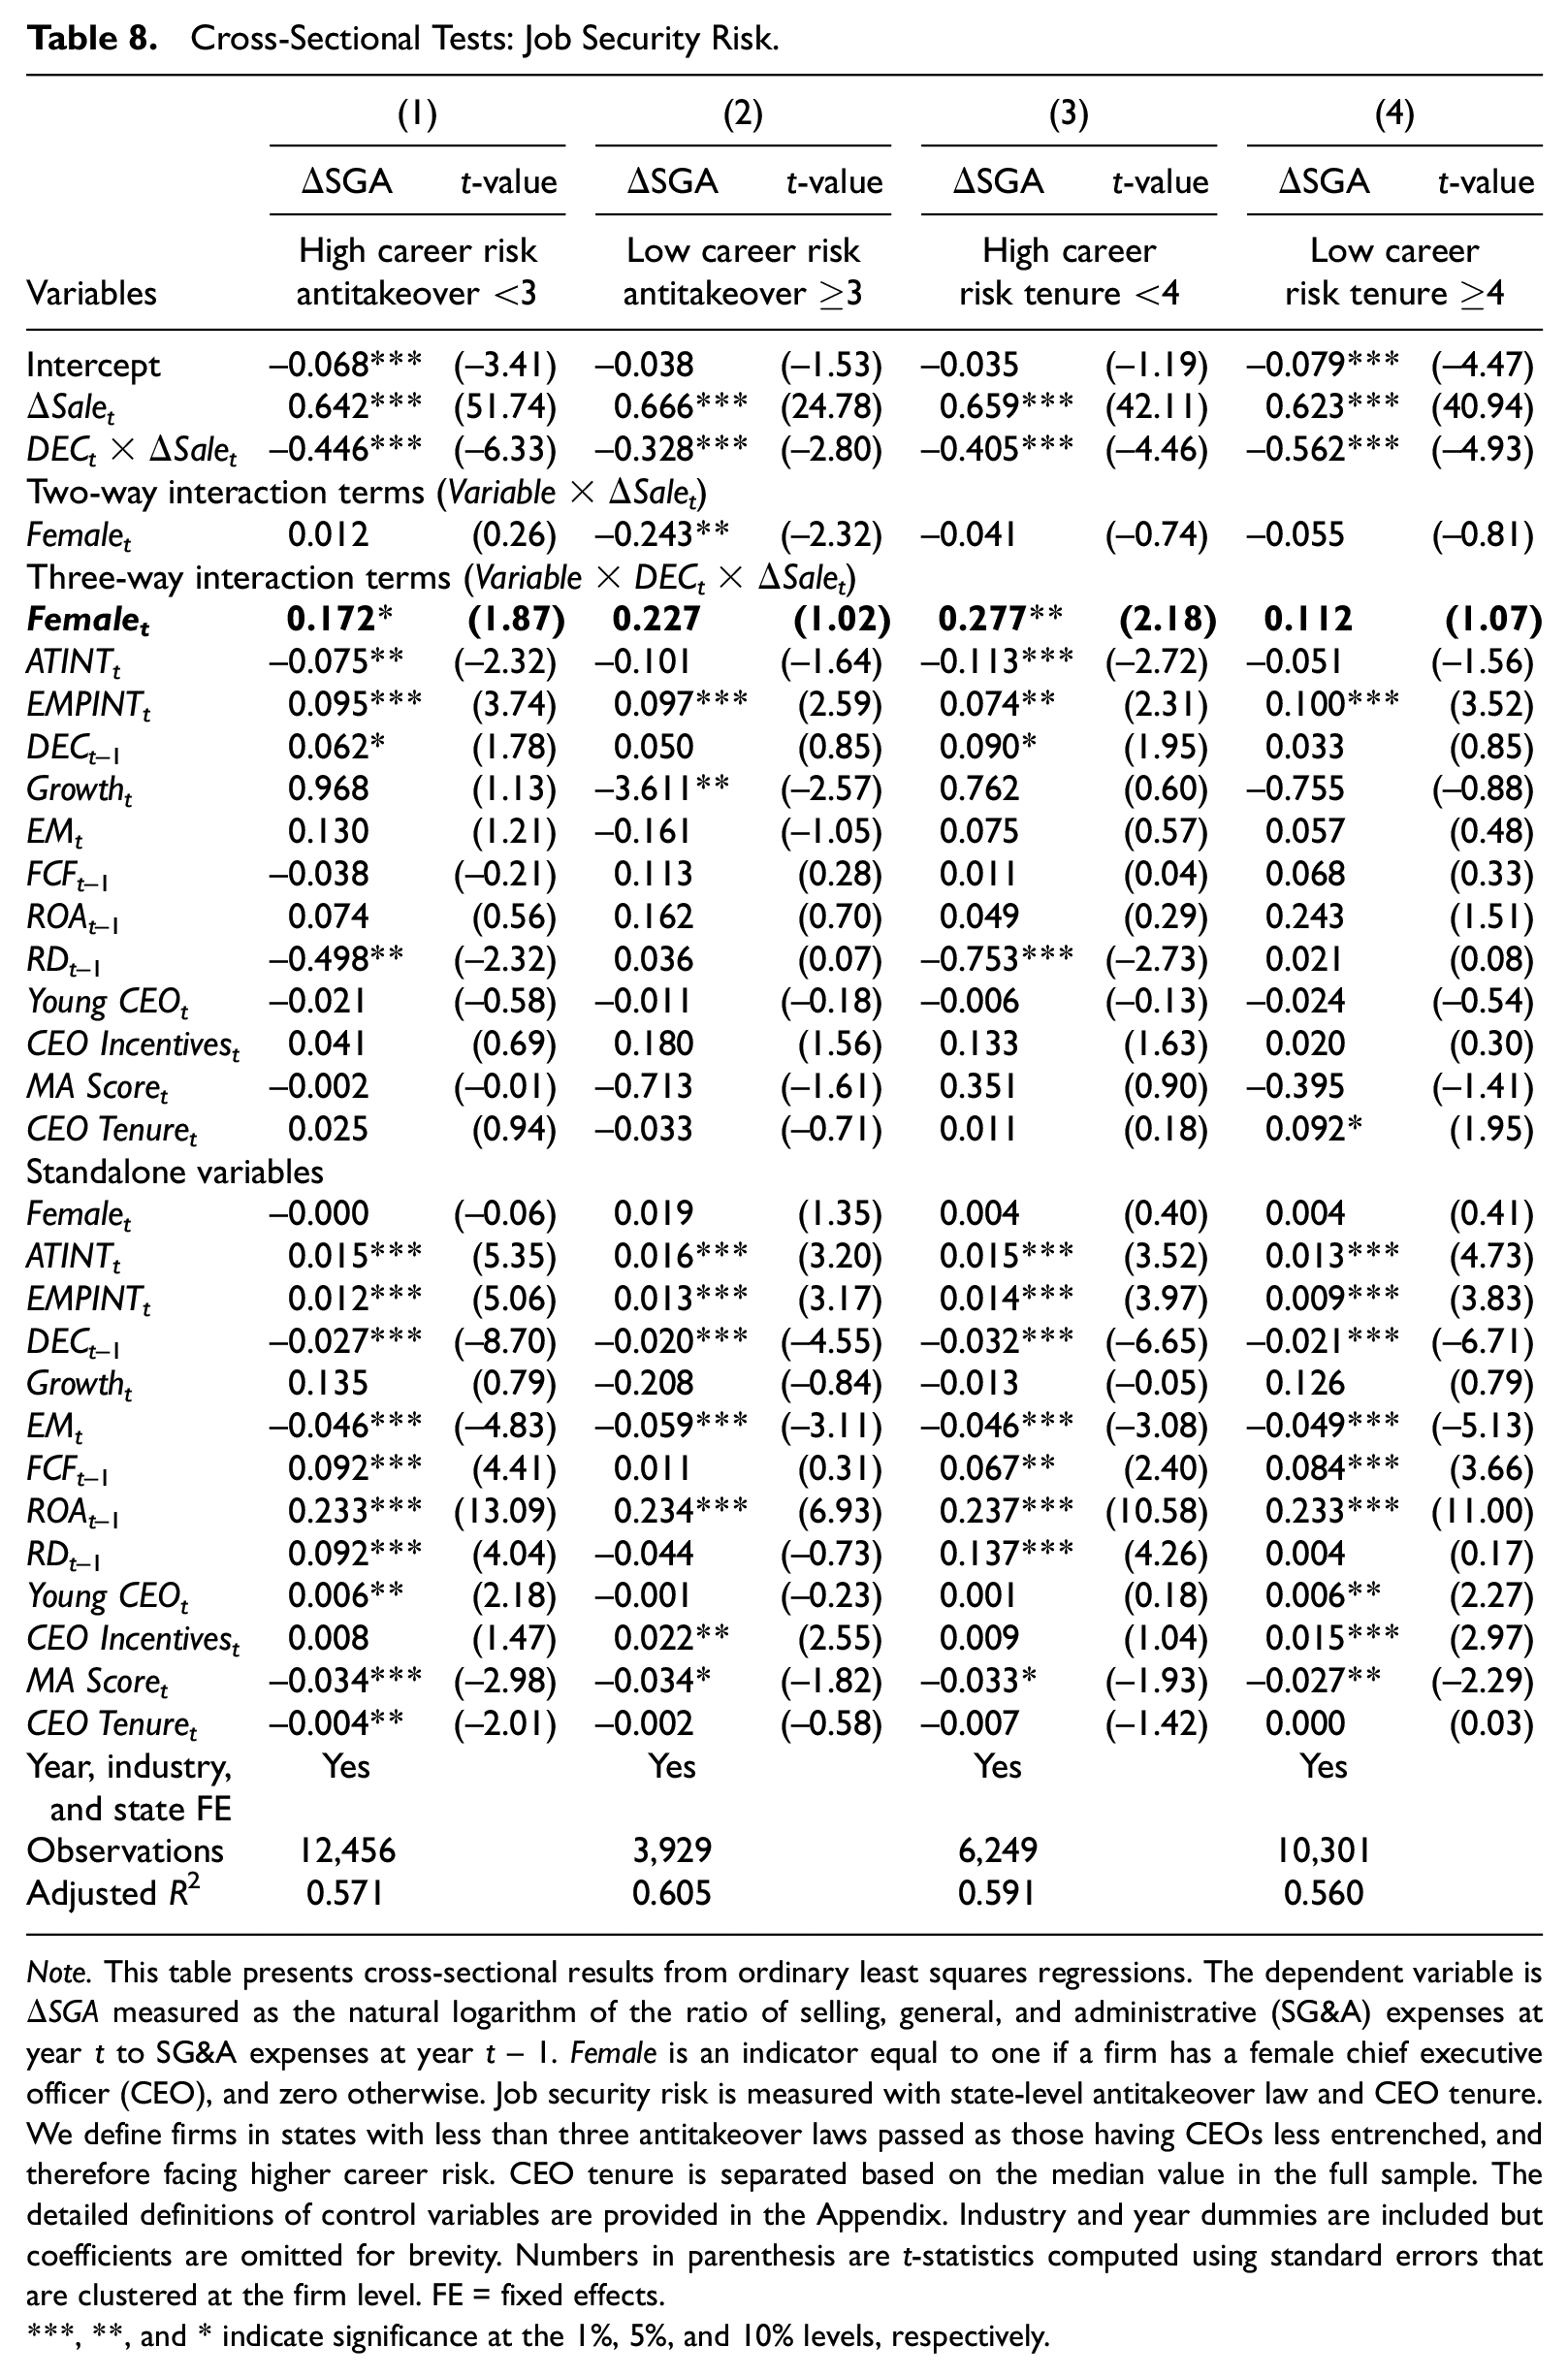
Note. This table presents cross-sectional results from ordinary least squares regressions. The dependent variable is ΔSGA measured as the natural logarithm of the ratio of selling, general, and administrative (SG&A) expenses at year t to SG&A expenses at year t − 1. Female is an indicator equal to one if a firm has a female chief executive officer (CEO), and zero otherwise. Job security risk is measured with state-level antitakeover law and CEO tenure. We define firms in states with less than three antitakeover laws passed as those having CEOs less entrenched, and therefore facing higher career risk. CEO tenure is separated based on the median value in the full sample. The detailed definitions of control variables are provided in the Appendix. Industry and year dummies are included but coefficients are omitted for brevity. Numbers in parenthesis are t-statistics computed using standard errors that are clustered at the firm level. FE = fixed effects.
, **, and * indicate significance at the 1%, 5%, and 10% levels, respectively.
The Effect of Product Market Competition
Higher competition in product markets indicates higher uncertainty of future demand, because consumers can easily switch to a competitor for similar products. This indicates that in more competitive product markets, firms face a higher risk when it comes to resource adjustment. If a firm overproduces, its products may be more difficult to be absorbed by the market. If it underproduces, it may make the company lose its market share, as other similar products can easily replace the company’s products. In contrast, firms in less competitive product markets face fewer uncertainties. Thus, overproduction/underproduction due to resource (un)adjustment will not hurt the firms as much as those in more competitive product markets. Therefore, we expect that the CEO gender effect on cost stickiness is more pronounced when female CEOs face more market competition.
We measure product market competition with two proxies: product similarity and product market fluidity. Product similarity captures a firm’s product similarity compared to its rival firms based on text-based analysis of firms’ 10-K product descriptions conducted by Hoberg and Phillips (2016). Product market fluidity captures the competitive threats of a firm in the product market. It is measured with changes in rival firms’ products relative to the firm’s products. The data are from Hoberg et al.’s (2014) study. We define the subsamples in the bottom tercile as the firms with low competitiveness and the rest as the firms with high competitiveness. Table 9 reports the results. Columns 1 and 2 use product similarity as the proxy for product market competition, and Columns 3 and 4 use product market fluidity as the proxy for product market competition. We find that the coefficients on Femalet × DECt × ΔSalet are only positive and significant for firms with higher product market competition (Columns 1 and 3). These results indicate that the gender effect on cost stickiness is concentrated on firms in more competitive product markets. The insignificant coefficients on Femalet × DECt × ΔSalet in Columns 2 and 4 are consistent with our conjecture that because the costs of not adjusting resources, for example, overproduction/underproduction, are lower when the levels of product market competition are lower, female CEOs exhibit less resource adjustment. In sum, the results based on product market competition support our hypothesis that risk aversion of female CEOs is the underlying channel through which female CEOs affect cost stickiness.
Cross-Sectional Tests: Product Market Competition.
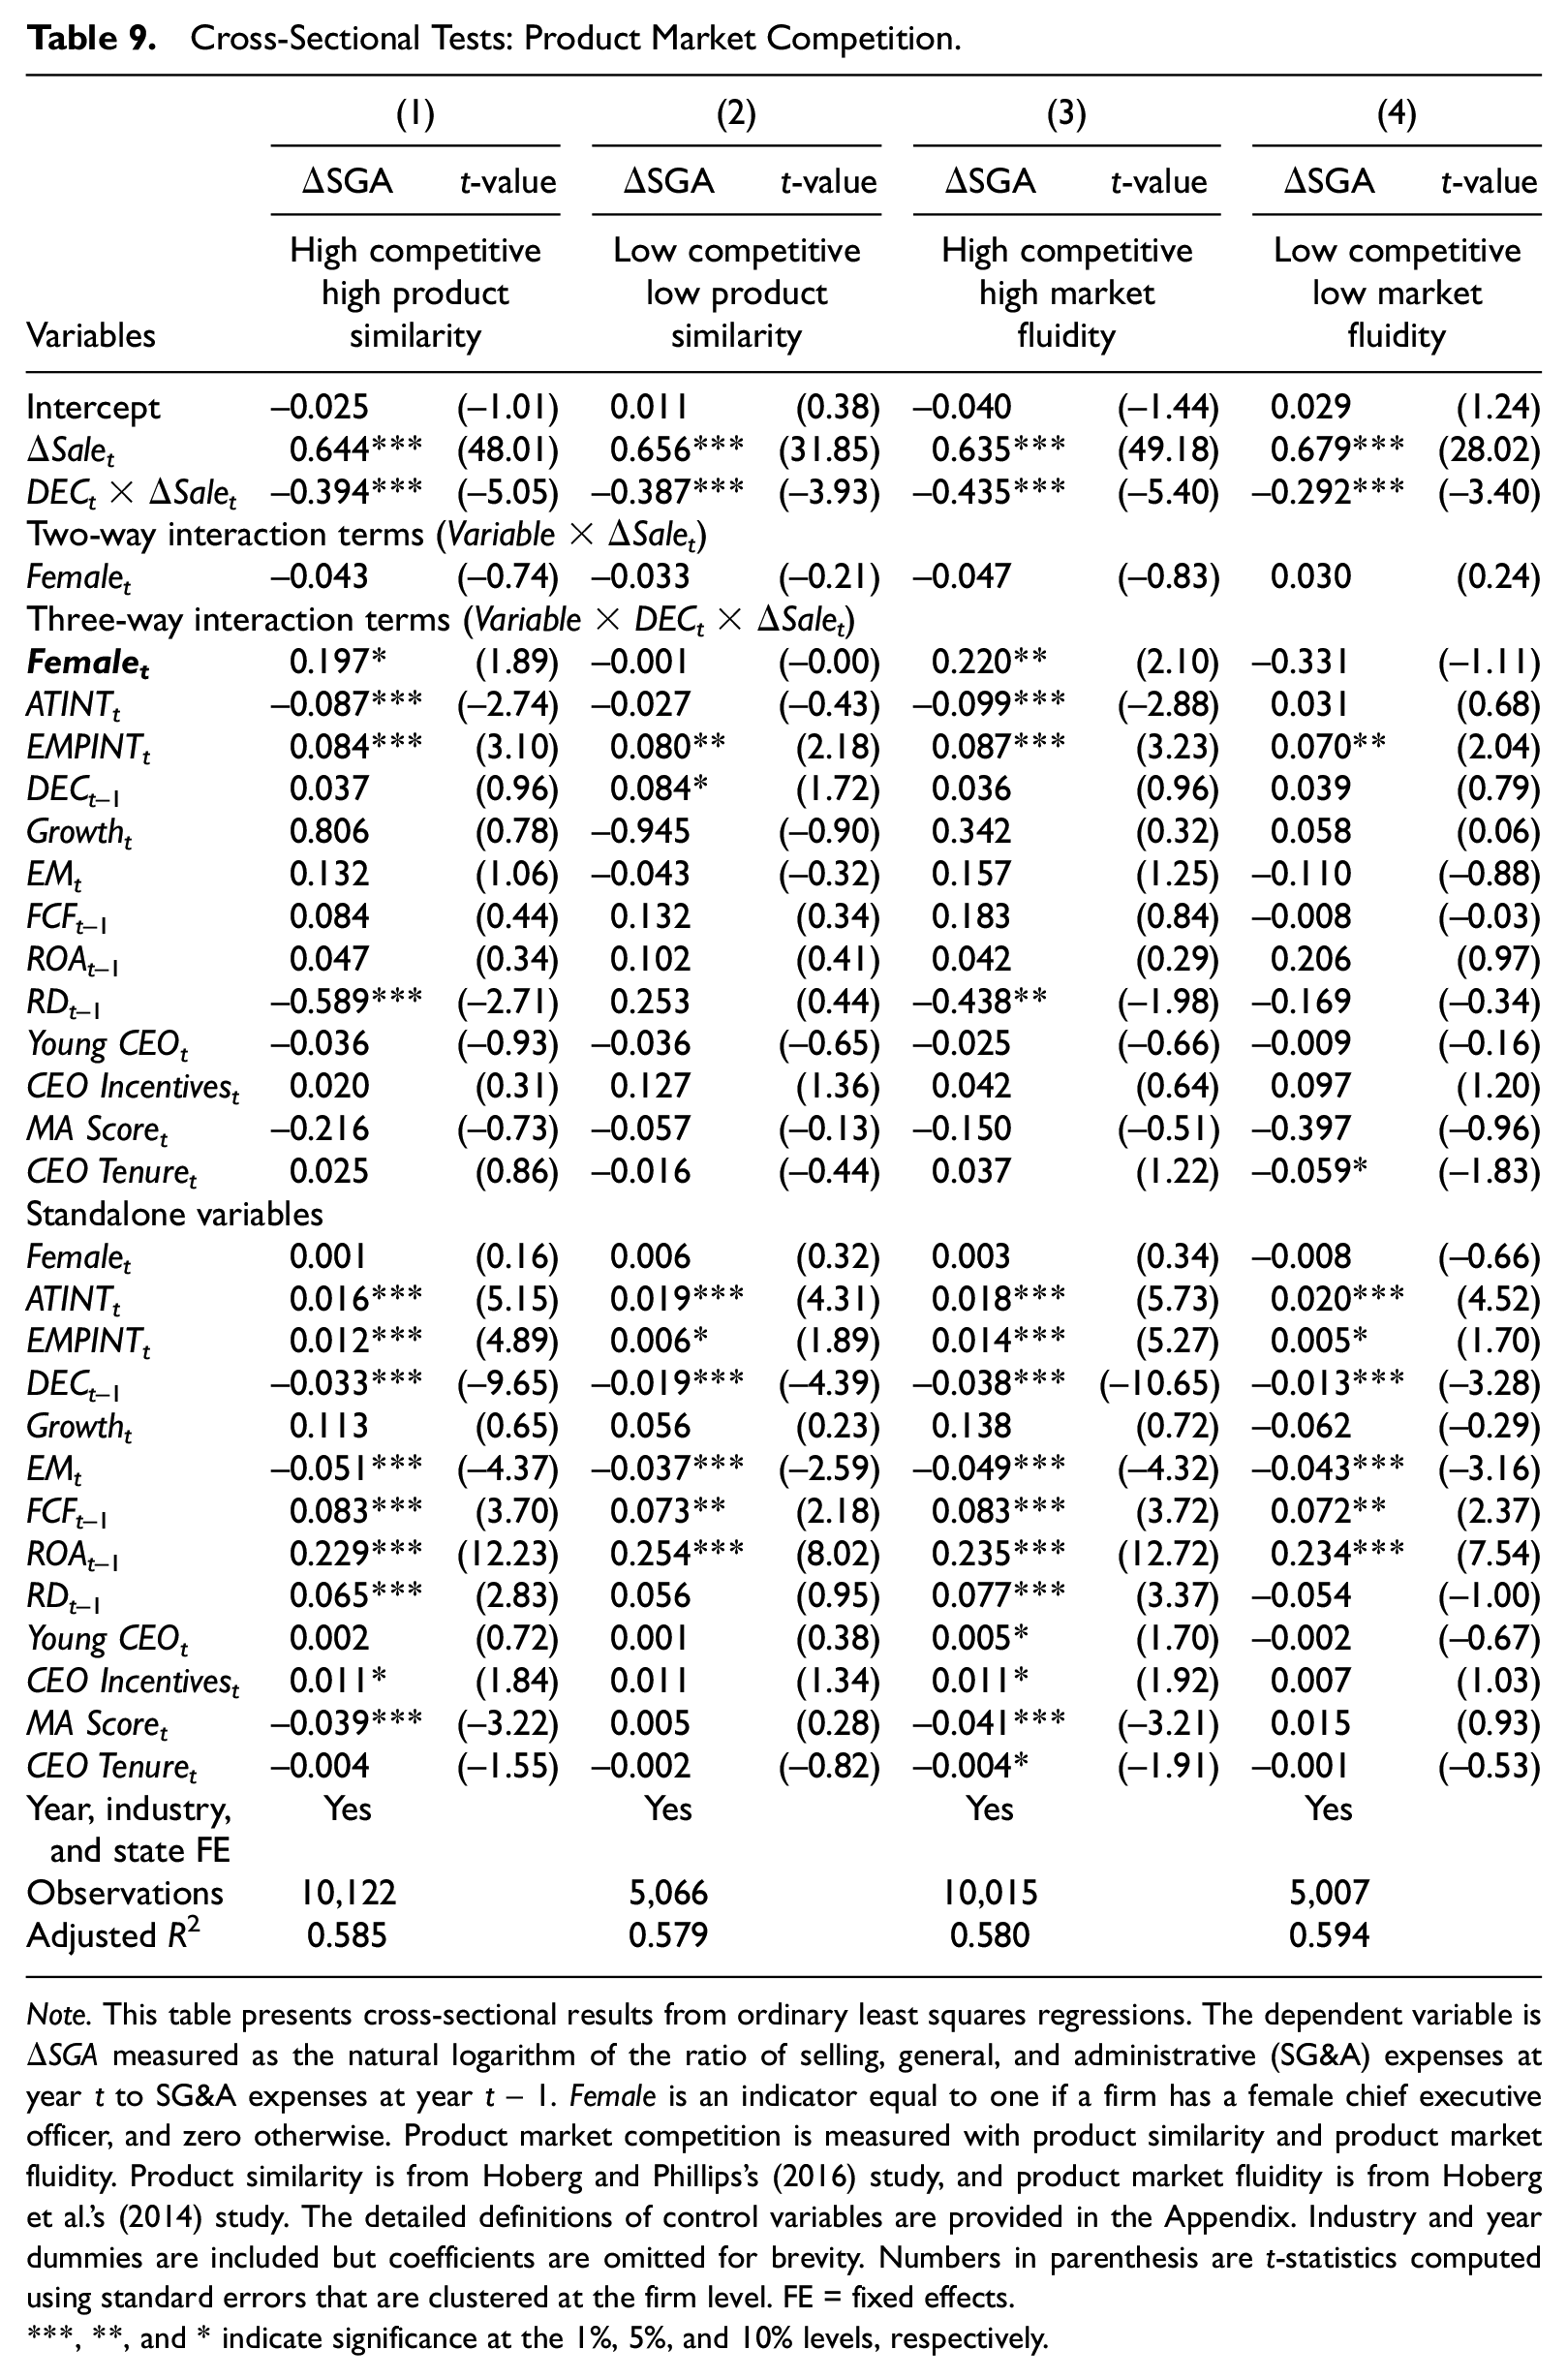
Note. This table presents cross-sectional results from ordinary least squares regressions. The dependent variable is ΔSGA measured as the natural logarithm of the ratio of selling, general, and administrative (SG&A) expenses at year t to SG&A expenses at year t − 1. Female is an indicator equal to one if a firm has a female chief executive officer, and zero otherwise. Product market competition is measured with product similarity and product market fluidity. Product similarity is from Hoberg and Phillips’s (2016) study, and product market fluidity is from Hoberg et al.’s (2014) study. The detailed definitions of control variables are provided in the Appendix. Industry and year dummies are included but coefficients are omitted for brevity. Numbers in parenthesis are t-statistics computed using standard errors that are clustered at the firm level. FE = fixed effects.
, **, and * indicate significance at the 1%, 5%, and 10% levels, respectively.
Additional Tests
Underlying Mechanism of Pessimism
We conjecture that women in general are more risk-averse than men because they are more likely to outweigh the probability of loss (Croson & Gneezy, 2009). Thus, female managers perceive the decrease in sales more likely when future demand is uncertain and accordingly react in a more conservative way. In other words, female managers adjust resources downward more because of their higher expectations of decreased sales. We call this pessimism by female CEOs. If this is true, we should observe more pronounced gender effect in the subgroup of firms with low sales expectations by management. In this section, we empirically test this conjecture.
To do this, we split the sample into two groups based on management sales forecasts. We obtain management sales forecasts from I/B/E/S database and benchmark it with the actual sales. Specifically, we define Sales Forecast as management sales forecasts less actual sales forecasts scaled by actual sales forecasts. We split the sample into high/low sales forecast groups based on the median of Sales Forecast. We expect that the gender effect is more pronounced in the low sales forecast group. Table 10 presents the results. We find that the coefficient on Femalet × DECt × ΔSalet is only positive and significant for firms in low sales forecast group (Column 1) and the coefficient on Femalet × DECt × ΔSalet in Column 2 is insignificant. This result indicates that the gender effect on cost stickiness is concentrated on firms whose managers have lower sales expectations. It is consistent with our conjecture that one of the reasons that female CEOs exhibit more resource adjustment is because of them being pessimistic.
Cross-Sectional Tests: Underlying Mechanism of Pessimism.
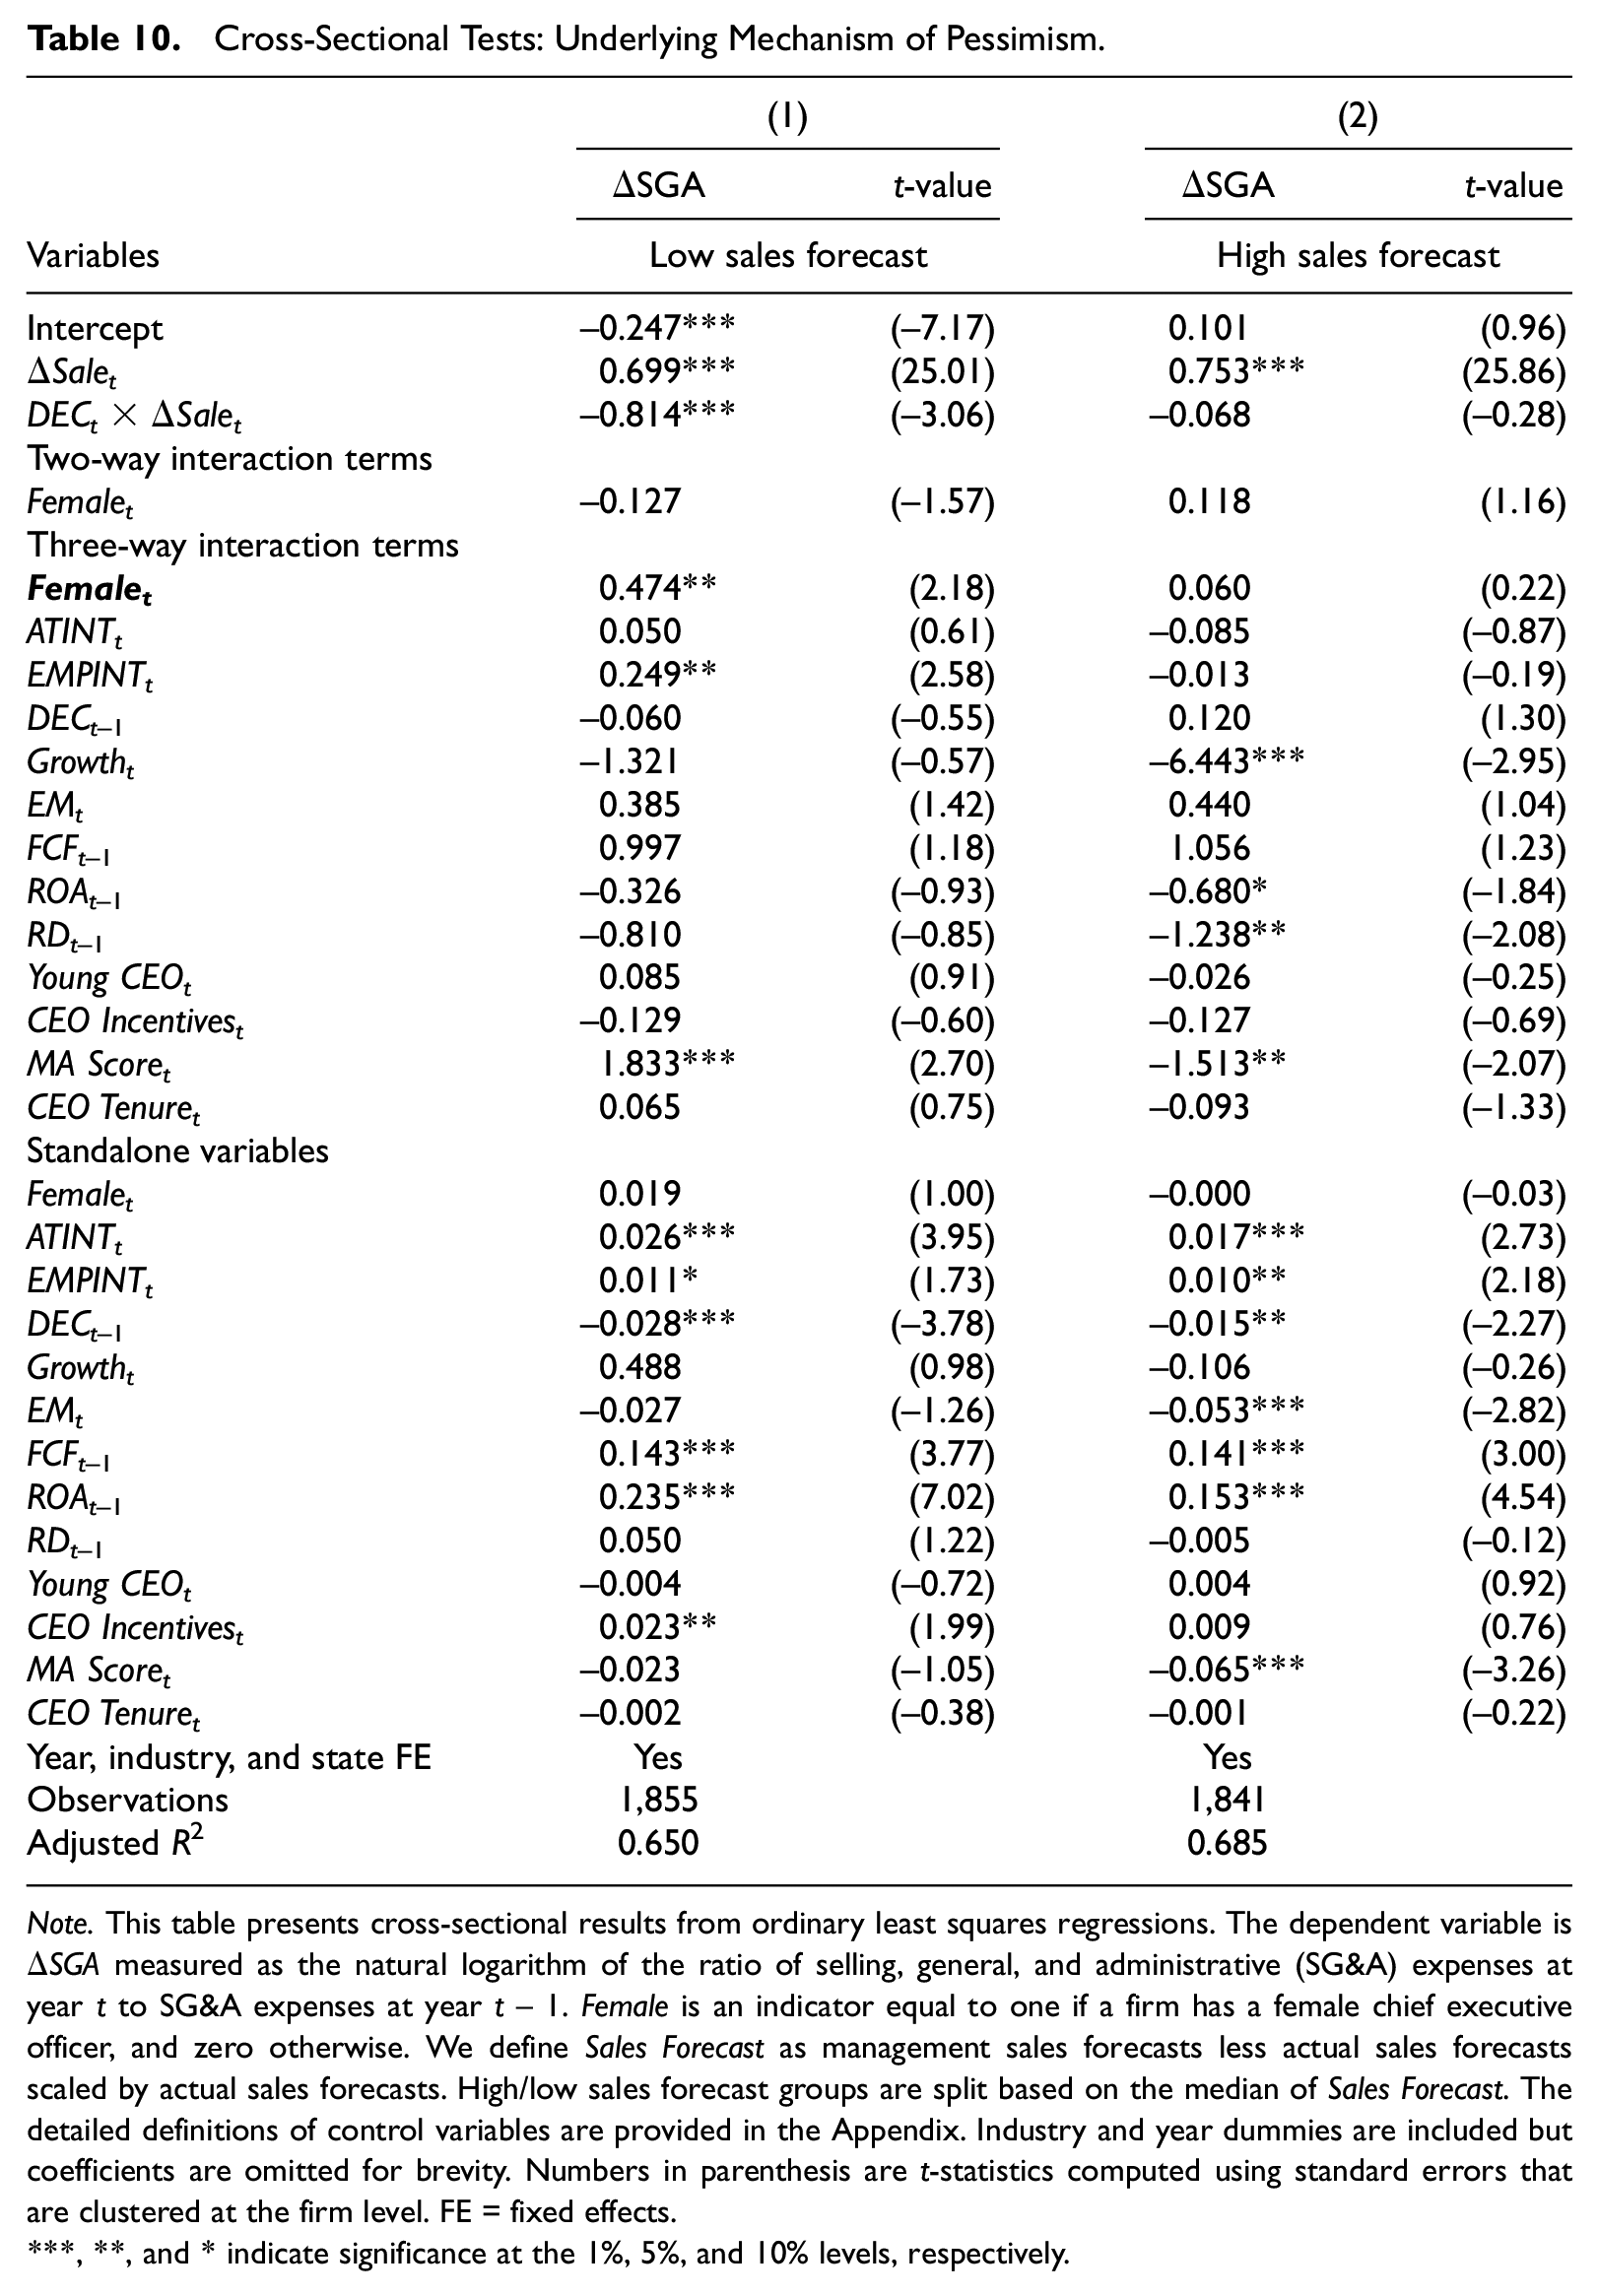
Note. This table presents cross-sectional results from ordinary least squares regressions. The dependent variable is ΔSGA measured as the natural logarithm of the ratio of selling, general, and administrative (SG&A) expenses at year t to SG&A expenses at year t − 1. Female is an indicator equal to one if a firm has a female chief executive officer, and zero otherwise. We define Sales Forecast as management sales forecasts less actual sales forecasts scaled by actual sales forecasts. High/low sales forecast groups are split based on the median of Sales Forecast. The detailed definitions of control variables are provided in the Appendix. Industry and year dummies are included but coefficients are omitted for brevity. Numbers in parenthesis are t-statistics computed using standard errors that are clustered at the firm level. FE = fixed effects.
, **, and * indicate significance at the 1%, 5%, and 10% levels, respectively.
The Flexibility of Adjusting Resources
So far, we have documented the gender effect on cost stickiness and its underlying channels. A natural question that comes next is how managers are able to adjust resources downward. In other words, what corporate action is taken by female CEOs to reduce cost stickiness? We conjecture that it is easier for firms with more flexible costs as opposed to fixed cost to adjust resources in response to sales change. To capture this, we modify the operating leverage model in Aboody et al.’s (2018) study. Specifically, we run firm-gender-specific time-series model as follows:

We use SG&A expense instead of operating cost in the model to be consistent with cost stickiness model in which SG&A expense is used. The coefficient β captures the proportion of variable costs to total costs. Thus, SG&A leverage, 1 − β, captures the proportion of fixed costs to total costs. Higher SG&A leverage indicates more fixed costs and lower SG&A leverage indicates more variable costs. We split the sample into two groups based on the median of SG&A leverage. We conjecture that gender effect on cost stickiness is more pronounced in the subgroup of low SG&A leverage.
Table 11 presents the results. We find that the coefficient on Femalet × DECt × ΔSalet is only positive and significant for firms in low SG&A group (Column 1) and the coefficient on Femalet × DECt × ΔSalet in Column 2 is insignificant. This shows that the gender effect is more pronounced for the subsample of firms with low SG&A leverage, indicating that female CEOs use more outsourcing for SG&A expense, providing flexibility to adjust the cost downward when the demand declines.
Cross-Sectional Tests: The Flexibility of Adjusting Resources.
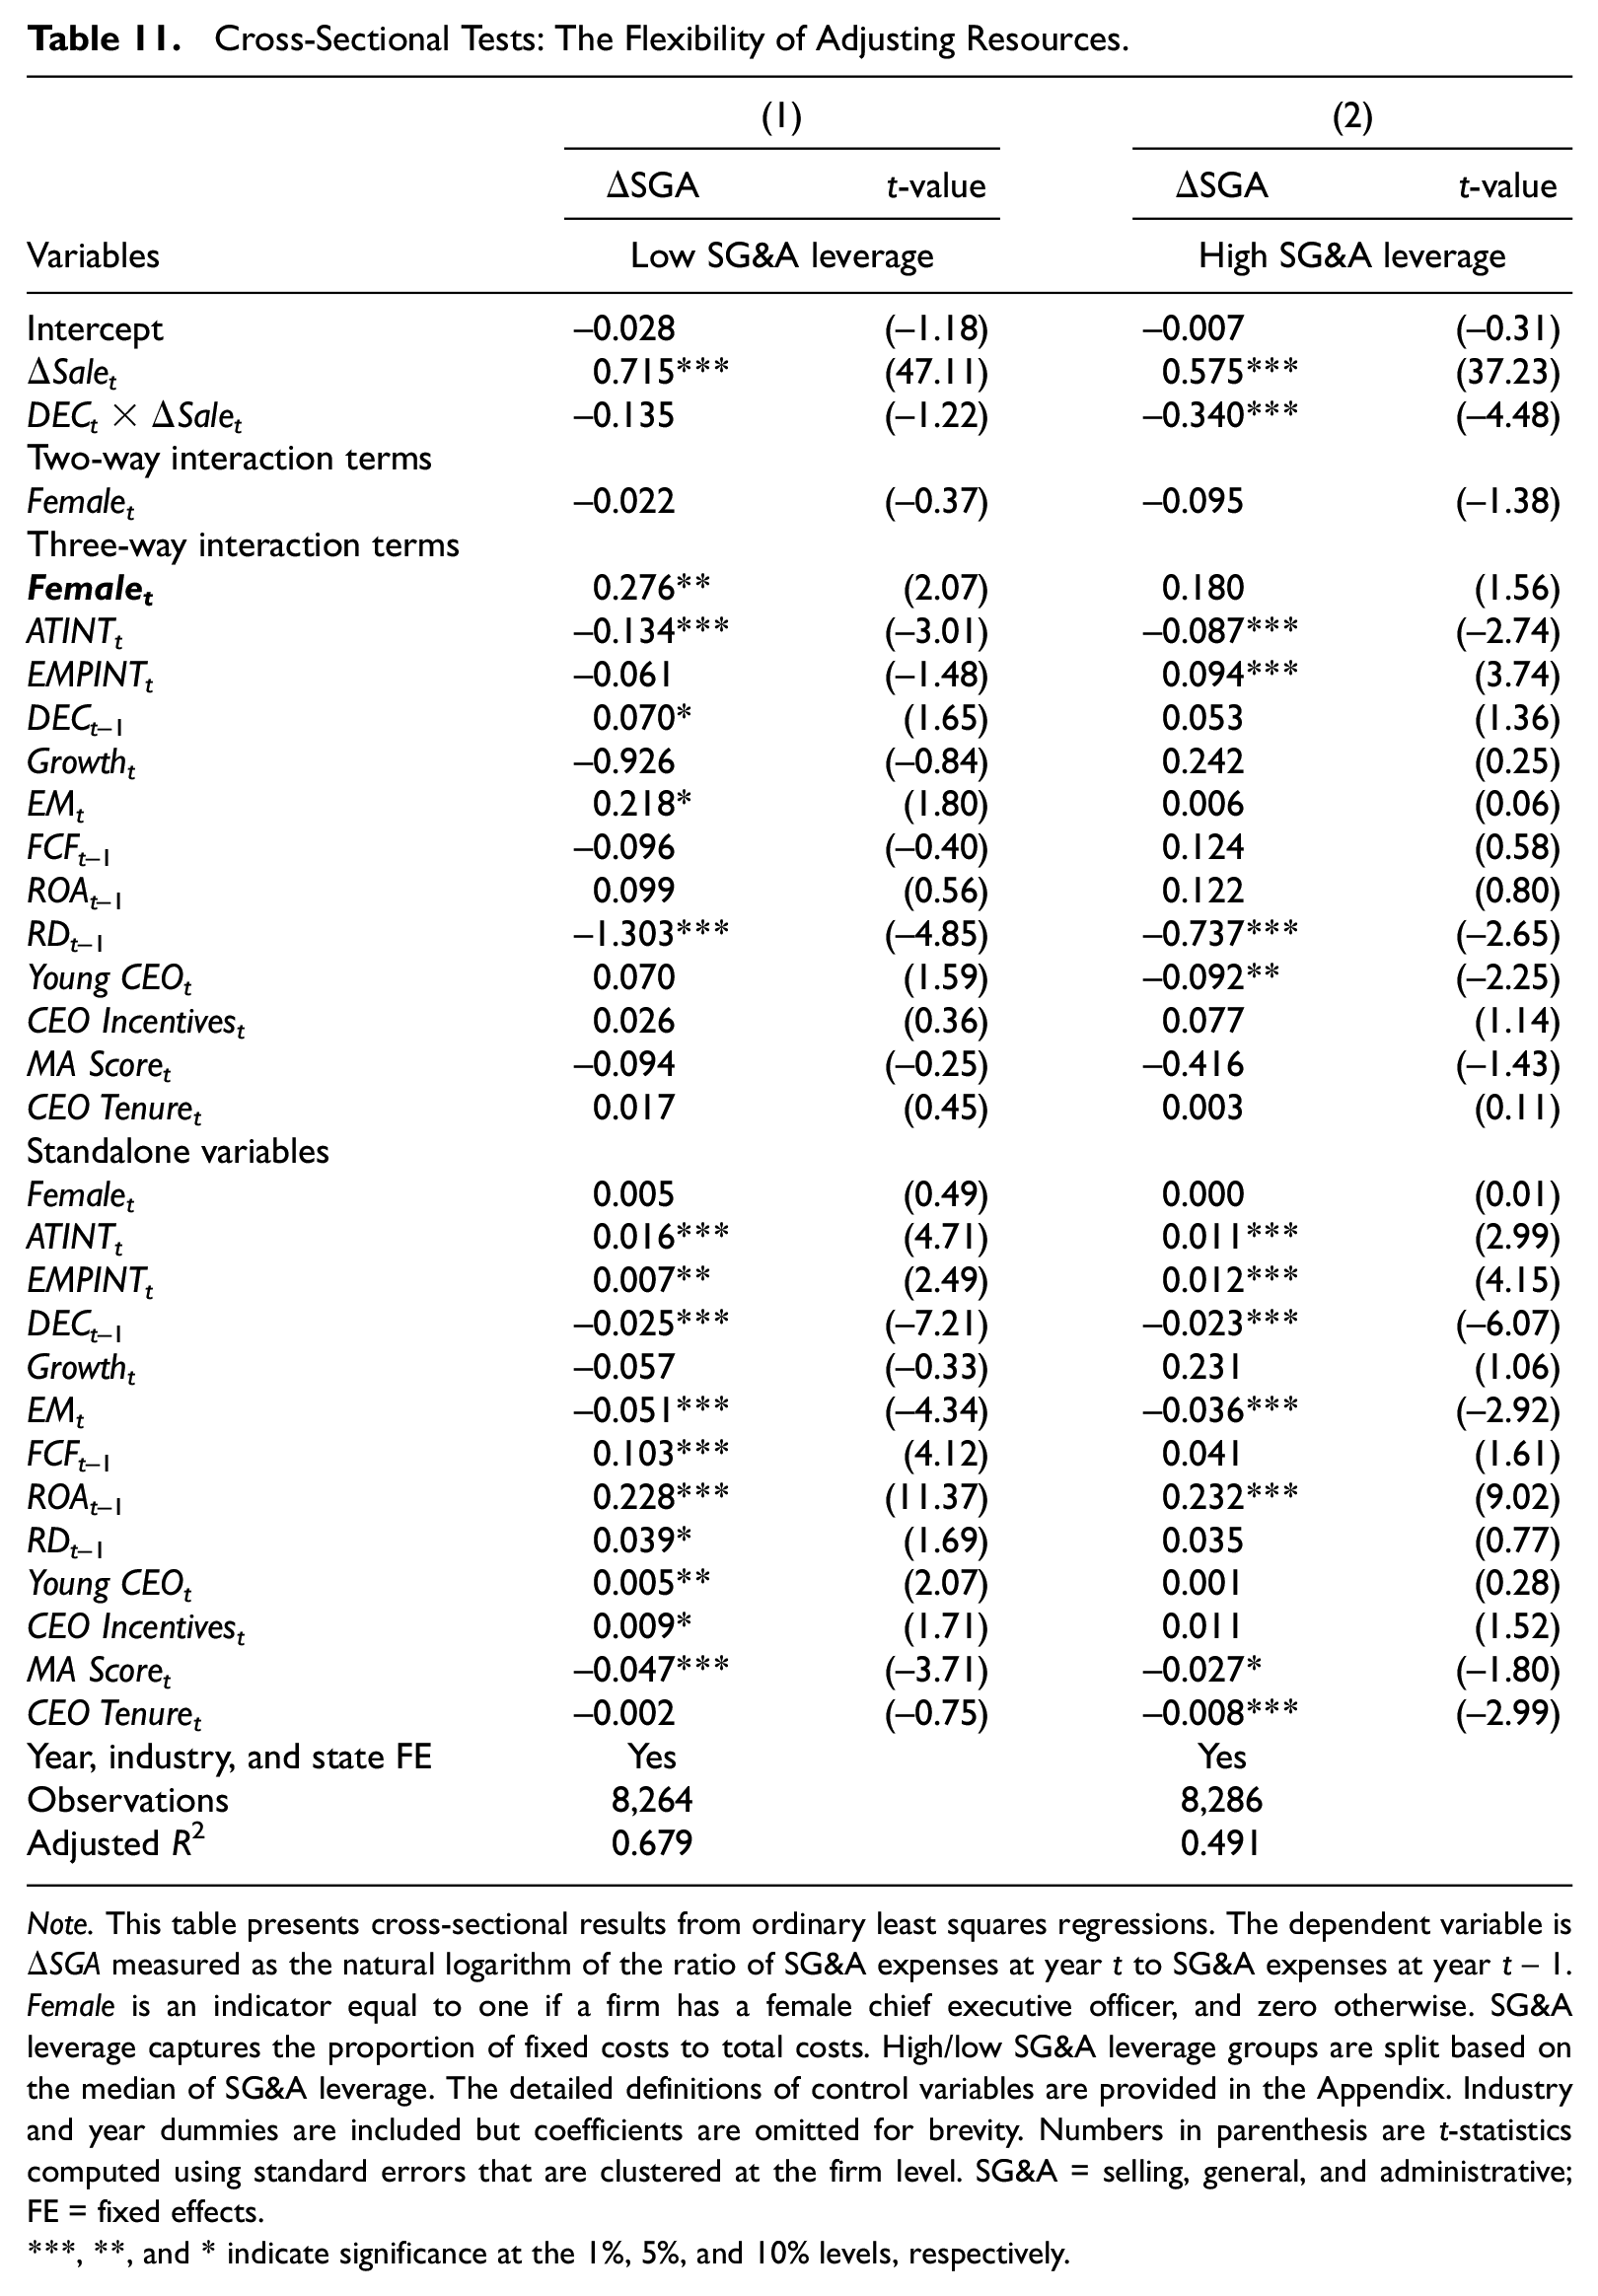
Note. This table presents cross-sectional results from ordinary least squares regressions. The dependent variable is ΔSGA measured as the natural logarithm of the ratio of SG&A expenses at year t to SG&A expenses at year t − 1. Female is an indicator equal to one if a firm has a female chief executive officer, and zero otherwise. SG&A leverage captures the proportion of fixed costs to total costs. High/low SG&A leverage groups are split based on the median of SG&A leverage. The detailed definitions of control variables are provided in the Appendix. Industry and year dummies are included but coefficients are omitted for brevity. Numbers in parenthesis are t-statistics computed using standard errors that are clustered at the firm level. SG&A = selling, general, and administrative; FE = fixed effects.
, **, and * indicate significance at the 1%, 5%, and 10% levels, respectively.
Conclusion
This study investigates whether there is a CEO gender effect on asymmetric cost behavior. Our finding shows that firms with female CEOs are more likely to cut slack resources following a demand decrease than firms with male CEOs, resulting in less cost asymmetry. Our cross-sectional tests show that the gender differences in asymmetric cost behavior are concentrated in the economic downturn period, firms with higher business risk, CEOs with higher career concerns, and firms in the highly competitive product markets. These results demonstrate that risk aversion and competitive preference of female CEOs drive our main finding. In addition, we find supportive evidence that female CEOs’ low sales forecast is an underlying mechanism of the gender effect. Furthermore, the additional test result shows that female CEOs tend to use flexible expenses to achieve resource adjustment.
Our study extends contemporaneous accounting literature in three major ways. First, we present evidence that managerial gender explains the variations in cost behavior. This extends the literature studying the effect of managerial incentives on cost asymmetry. Prior studies mainly rely on agency theory and document managerial incentives from perspectives of empire-building incentives (C. X. Chen et al., 2012) and meeting/beating targeted benchmarks (Dierynck et al., 2012; Kama & Weiss, 2013). Our article is motivated by the well-documented gender effect in the psychology and economics literature and provides fresh evidence that CEO gender plays an important role in asymmetric cost behavior. Second, and more broadly, our article fits in the emerging literature that examines how the gender of top executives affects finance and accounting decisions. Prior studies on the gender effect focus on corporate investment decisions (e.g., Huang & Kisgen, 2013) and financial reporting practices (e.g., Barua et al., 2010; Francis et al., 2015). Our article introduces the gender effect into the cost management literature and paints a more complete picture of how female executives manage firms differently compared to their male counterparts. Third, while prior accounting and finance literature (e.g., Barua et al., 2010; Francis et al., 2015; Huang & Kisgen, 2013) usually studies the gender effect from gender difference in risk preference only, we hypothesize and study the possible effects by all three factors summarized in Croson and Gneezy’s (2009) study. In addition, we investigate the corporate action taken by female CEOs to reduce cost stickiness. These provide a more comprehensive understanding on gender difference in corporate behavior.
Footnotes
Appendix
Definitions of Variables.
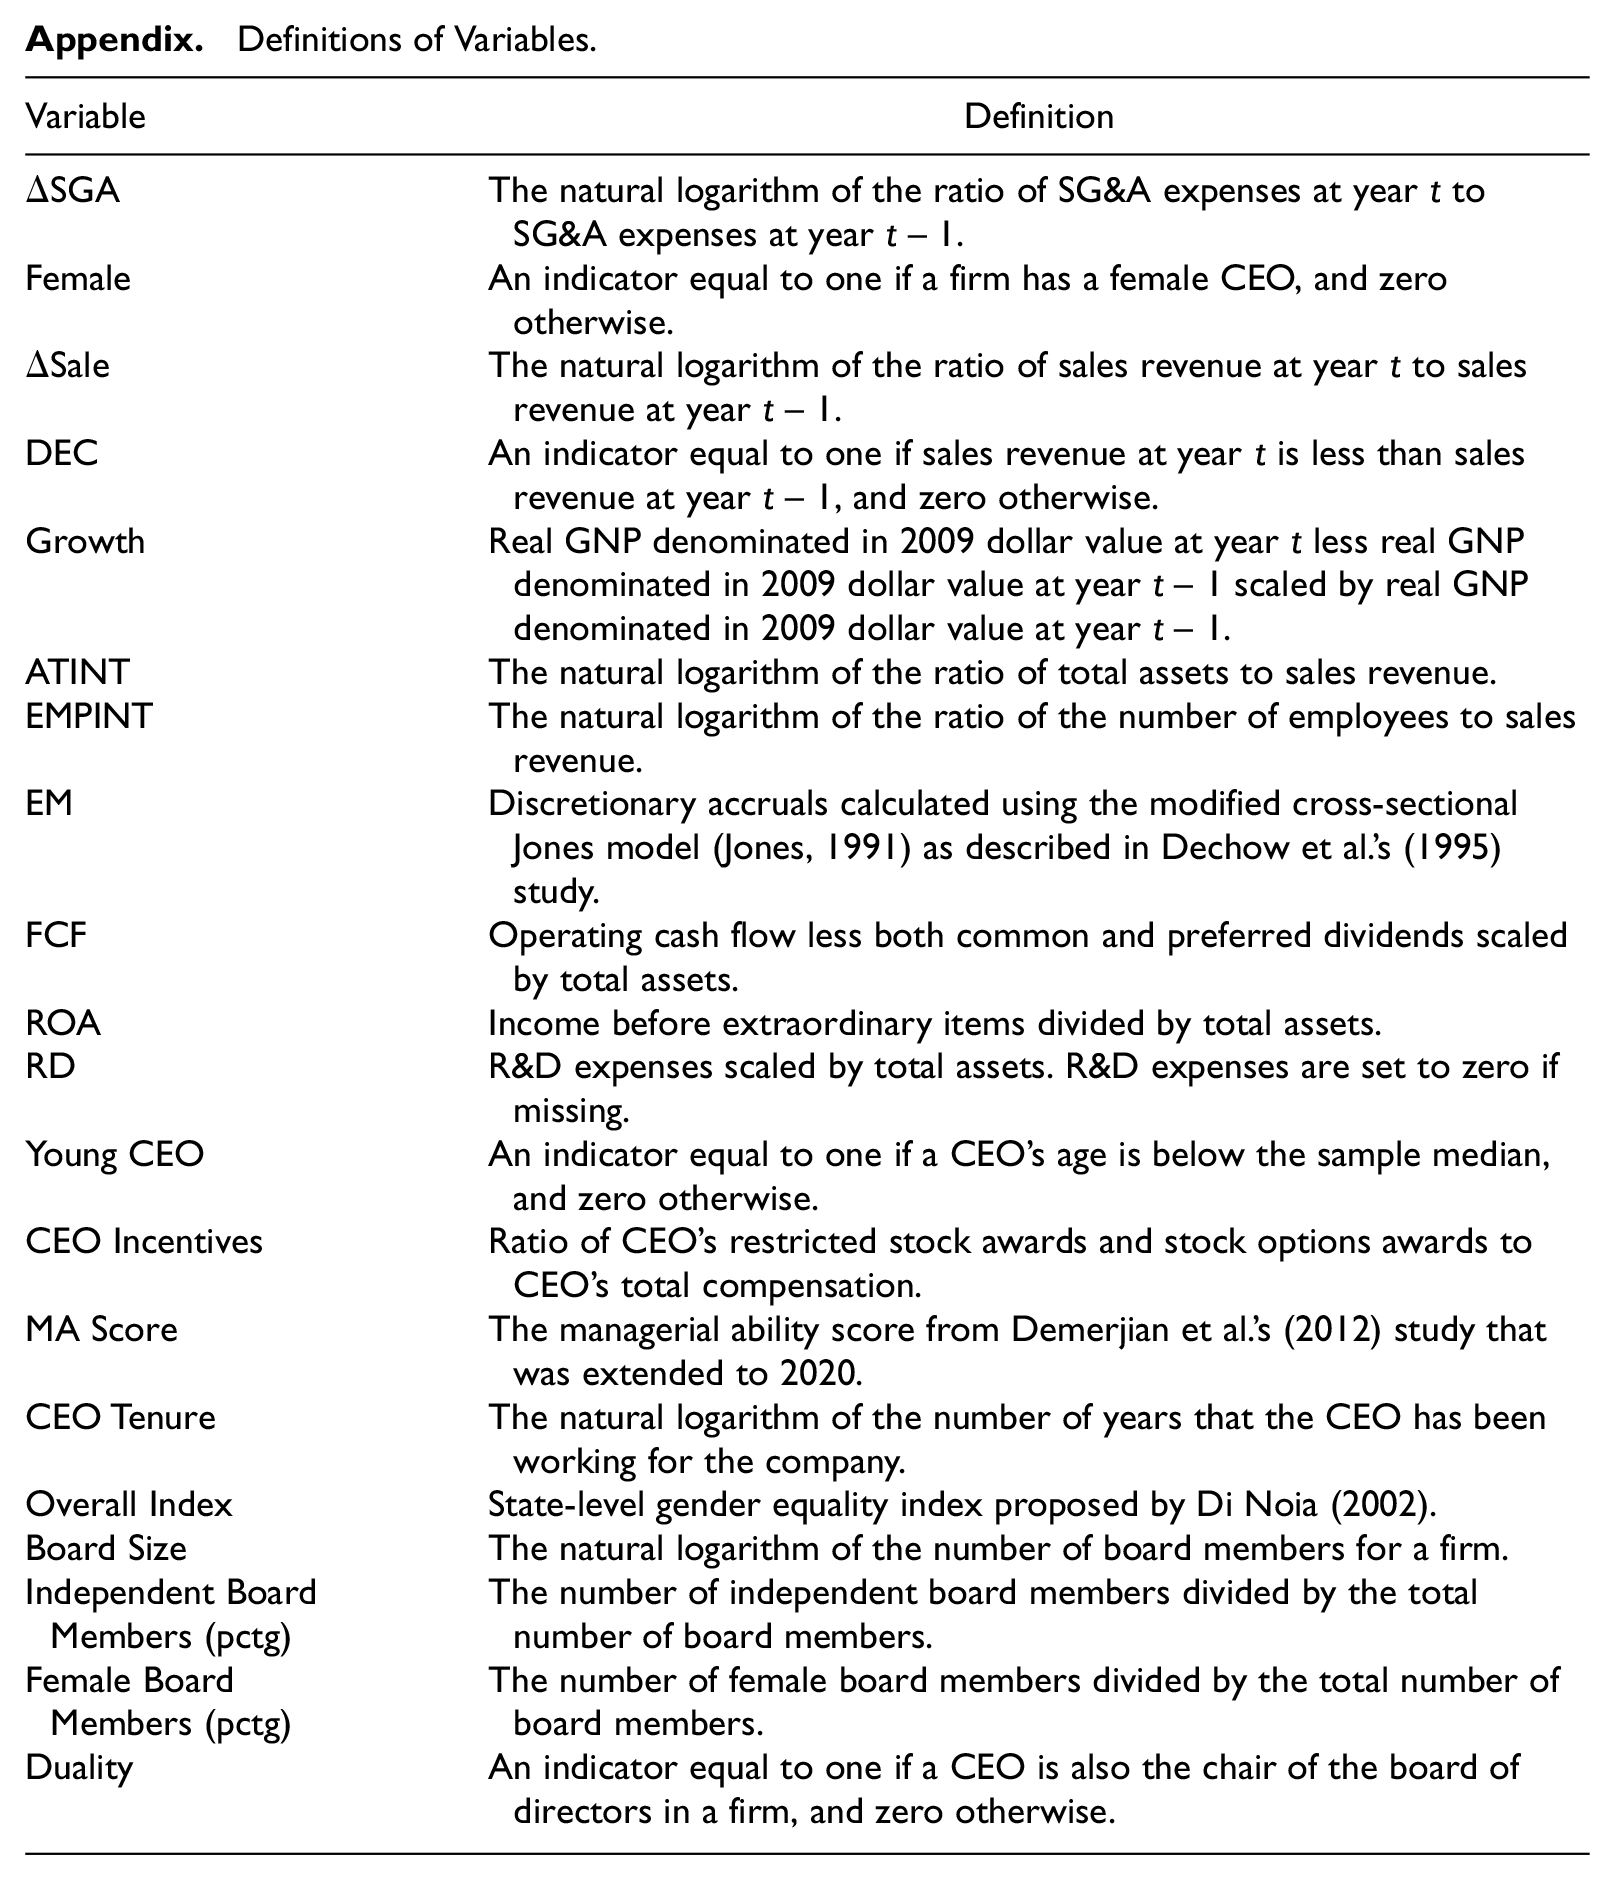
| Variable | Definition |
|---|---|
| ΔSGA | The natural logarithm of the ratio of SG&A expenses at year t to SG&A expenses at year t − 1. |
| Female | An indicator equal to one if a firm has a female CEO, and zero otherwise. |
| ΔSale | The natural logarithm of the ratio of sales revenue at year t to sales revenue at year t − 1. |
| DEC | An indicator equal to one if sales revenue at year t is less than sales revenue at year t − 1, and zero otherwise. |
| Growth | Real GNP denominated in 2009 dollar value at year t less real GNP denominated in 2009 dollar value at year t − 1 scaled by real GNP denominated in 2009 dollar value at year t − 1. |
| ATINT | The natural logarithm of the ratio of total assets to sales revenue. |
| EMPINT | The natural logarithm of the ratio of the number of employees to sales revenue. |
| EM | Discretionary accruals calculated using the modified cross-sectional Jones model (Jones, 1991) as described in Dechow et al.’s (1995) study. |
| FCF | Operating cash flow less both common and preferred dividends scaled by total assets. |
| ROA | Income before extraordinary items divided by total assets. |
| RD | R&D expenses scaled by total assets. R&D expenses are set to zero if missing. |
| Young CEO | An indicator equal to one if a CEO’s age is below the sample median, and zero otherwise. |
| CEO Incentives | Ratio of CEO’s restricted stock awards and stock options awards to CEO’s total compensation. |
| MA Score | The managerial ability score from Demerjian et al.’s (2012) study that was extended to 2020. |
| CEO Tenure | The natural logarithm of the number of years that the CEO has been working for the company. |
| Overall Index | State-level gender equality index proposed by Di Noia (2002). |
| Board Size | The natural logarithm of the number of board members for a firm. |
| Independent Board Members (pctg) | The number of independent board members divided by the total number of board members. |
| Female Board Members (pctg) | The number of female board members divided by the total number of board members. |
| Duality | An indicator equal to one if a CEO is also the chair of the board of directors in a firm, and zero otherwise. |
Declaration of Conflicting Interests
The author(s) declared no potential conflicts of interest with respect to the research, authorship, and/or publication of this article.
Funding
The author(s) received no financial support for the research, authorship, and/or publication of this article.