
Abstract
We examine the persistence of the zero-earnings discontinuity in quarterly earnings around the adoption of the Sarbanes-Oxley Act in 2002. Previous studies find that the zero-earnings discontinuity in annual earnings disappears after the adoption of the Act, likely due to the stricter regulatory environment. We hypothesize that the adoption coincides with a relatively smaller reduction in the zero-earnings discontinuity in quarterly earnings, since interim financial statements are unaudited. Consistent herewith, we find that the zero-earnings discontinuity in quarterly earnings persists after the adoption of the Act. This is driven by the reduction in the zero-earnings discontinuities being weaker in magnitude for quarterly earnings compared to annual earnings. We find similar results using changes in earnings as well as analysts’ earnings forecast errors. Our findings are relevant for both regulators and academics in assessing the role of auditors in the adoption of SOX.
Keywords
Introduction
In their seminal paper, Burgstahler and Dichev (1997) documented the so-called zero-earnings discontinuity: a “hole” in the frequency of reported earnings just below zero followed by a “bump” at and just above zero. Following their paper, the discontinuity captured the interest of accounting scholars, leading to a stream of literature investigating its existence and implications.
The discontinuity is controversial and sparks debate as to what drives its existence. Some argue that it reflects companies’ incentives to meet and beat the zero-earnings benchmark (e.g., Burgstahler and Dichev (1997), Dichev et al. (2013), Gilliam et al. (2015), Burgstahler and Chuk (2017), and de la Rosa and Lambertsen (2022)), while others suggest that it is merely an artifact in the data (e.g., Durtschi & Easton, 2005, 2009). Scholars of the former view have extensively studied whether exogenous shocks, such as regulatory interventions, impact its presence (Enomoto & Yamaguchi, 2017; Gilliam et al., 2015).
In this paper, we contribute to this body of literature by investigating the zero-earnings discontinuity in interim financial statements surrounding the adoption of the Sarbanes-Oxley Act (hereafter SOX) in 2002. In particular, we investigate whether the discontinuity in quarterly financial statements persists after the adoption. Additionally, we explore whether the persistence is driven by the decline in the quarterly zero-earnings discontinuity being less pronounced compared to the annual zero-earnings discontinuity.
The adoption of SOX marked a major regulatory intervention that led to stricter financial reporting. It involved the creation of an oversight board to ensure sufficient audit quality, as well as accurate and reliable reporting (SOX, 2002, Section 101), limiting audit firms’ supply of nonaudit services to their audited clients to enhance auditor independence (SOX, 2002, Section 208), and disclosure on firms’ internal control measures (SOX, 2002, Section 404). As a result, the adoption of SOX likely led to lower managerial flexibility and, hence, reduced earnings management. Consistent with this, the prior literature finds that the zero-earning discontinuity in annual earnings disappeared after the adoption, and attributes this to increased costs of performing earnings management (e.g., Gilliam et al. (2015)). Similar results are found in Japan following the adoption of the Financial Instruments and Exchange Act of 2006 (hereafter J-SOX), although the discontinuity did not disappear completely (Enomoto & Yamaguchi, 2017). Since companies are required to comply with SOX irrespective of whether they issue annual or quarterly financial statements, the zero-earnings discontinuity in quarterly earnings may also disappear after the adoption.
On the contrary, quarterly financial statements, unlike their annual counterparts, are not subject to mandatory audits (17 CFR, 2021, 210.10–01.a.1). During an audit, auditors investigate whether the financial statements contain material misstatements and whether the company complies with the regulation in force. The absence of an auditor when preparing quarterly financial statements allows managers to engage in earnings management that otherwise is likely to be identified and corrected by auditors in annual financial statements. Consequently, quarterly financial statements are less likely to be compliant with SOX compared to annual financial statements, making SOX less effective in restricting earnings management in the former. Moreover, quarterly financial statements are generally more likely to contain material misstatements compared to annual financial statements, since it is challenging to determine “the results of operations on a meaningful basis for intervals of less than a full year” (GAAP, 2022) [270-10-05-2] and, “in view of the limited time available to develop complete information, many costs and expenses are estimated in interim periods” (GAAP, 2022) [270-10-05-2]. Hence, management has more leeway to manipulate earnings in quarterly financial statements compared to annual financial statements even in the absence of SOX, which is likely to cause the differential impact of the adoption to be economically significant. In contrast, prior studies (e.g., Jacob and Jorgensen (2007)) find that earnings management may not be common in quarterly earnings, as management’s compensation is often tied to annual earnings at the fiscal year-end. As a result, management may face little incentive to manage earnings on an interim basis. Conversely, as the adoption of SOX likely restricts the ability of management to manage annual earnings, managing quarterly earnings may become a viable alternative. This may result in greater incentive to manage earnings on an interim basis. Altogether, the zero-earnings discontinuity in quarterly earnings may persist after the adoption of SOX.
Discontinuities around zero have been documented in various contexts. Prior studies (e.g., Burgstahler and Dichev (1997), and (Gilliam et al., 2015)) show that the discontinuity in zero changes in earnings tends to mirror the discontinuity in zero earnings. Other studies (e.g., Doyle et al. (2013), and Huang et al. (2017), and Kim et al. (2021)) explore discontinuities in the market’s expectations of firms’ performance using financial analysts’ earnings forecast errors, and find a discontinuity which they attribute to firms’ effort to meet and beat analysts’ earnings forecasts (e.g., Chang et al. (2023), Gilliam et al. (2015), and Bird et al. (2019)). We follow the literature and extend our analysis by examining the discontinuity around zero in changes in earnings as well as in analysts’ earnings forecast errors, using both annual and quarterly data, around the adoption of SOX.
To investigate our hypotheses, we collect financial data on annual and quarterly financial statements filed by listed companies in the USA using Compustat from 1980 to 2020, and analysts’ earnings forecasts on listed firms in USA using I/B/E/S from 1983 to 2020. 1 After truncation, our sample consists of 222,611 (829,664), 204,685 (751,274), and 138,160 (339,500) observations of annual (quarterly) earnings, changes in annual (quarterly) earnings, and analysts’ annual (quarterly) earnings forecast errors, respectively. We employ the standardized-difference test by Burgstahler and Dichev (1997) as our main test, and the manipulation test by Cattaneo et al. (2020) 2 as a robustness test. The manipulation test offers statistical advantages over the standardized-difference test, including its use of a data-driven bandwidth. To this end, we address the concern commonly raised in the literature (e.g., Lahr (2014, p. 560)) that the zero-earnings discontinuity may be driven by the researchers’ choice of interval size, while simultaneously complementing recent studies on how to measure the zero-earnings discontinuity (e.g., Byzalov and Basu (2019) and Bird et al. (2019)) by adopting a test that is more robust compared to those commonly used in prior studies (e.g., Burgstahler and Dichev (1997)). We capture the zero-earnings discontinuity using (changes in) earnings scaled by lagged total assets and verify that our findings are robust toward scaling by lagged market capitalization. Moreover, we capture the discontinuity in the market’s expectations using analysts’ earnings forecast errors measured as the consensus earnings forecast per share minus the firms’ actual earnings per share as per prior studies (e.g., Das et al. (2024)).
We find that the zero-earnings discontinuity persists in quarterly earnings following the adoption of SOX. This is consistent with our prediction that the lack of mandatory audits in quarterly financial statements reduces the effectiveness of SOX in restricting earnings management. To further examine the persistence, we investigate the relative magnitude of the change in the discontinuity around the adoption. On the one hand, the zero-earnings discontinuity in quarterly earnings may persist due to SOX having a weaker impact on the quarterly discontinuity compared to the annual discontinuity. On the other hand, due to the different auditing requirements, managers are likely to have more discretion in making reporting choices for quarterly financial statements than for annual financial statements, both before and after SOX. This greater flexibility is likely to cause the discontinuity to be larger in magnitude for quarterly earnings compared to annual earnings prior to the adoption. We verify this and find that the standardized-difference test statistics are roughly twice as large in quarterly earnings compared to annual earnings. As such, the zero-earnings discontinuity in quarterly earnings could persist following the adoption even if the impact of the adoption is greater, simply due to the discontinuity being substantially larger in magnitude prior to the adoption. To investigate this, we adopt a difference-in-difference design, comparing the change in the zero-earnings discontinuity around the adoption between quarterly and annual financial statements. As a robustness test, we allow for continuous changes over time in the magnitude of the zero-earnings discontinuity to ensure that our findings are not driven by extreme-year observations (see Enomoto and Yamaguchi (2017) for more on continuous changes over time).
We find that the decrease in the zero-earnings discontinuity is smaller in magnitude for quarterly earnings compared to annual earnings. This is consistent with our prediction that the persistence is driven by the weaker impact of SOX on the quarterly zero-earnings discontinuity compared to the annual zero-earnings discontinuity. Although drawing causal inference is challenging as per previous studies examining the adoption of SOX (e.g., Gilliam et al. (2015)), our findings align with the explanation that the adoption of SOX caused the disappearance of the zero-earnings discontinuity in annual earnings, while the zero-earnings discontinuity in quarterly earnings persists because SOX is less effective in restricting earnings management in interim financial statements.
Next, we examine the discontinuity for other distributions commonly studied in the literature. We find similar results for changes in earnings, suggesting that firms are more likely to meet and beat their previous quarterly earnings compared to their previously reported annual earnings, following the adoption of SOX. For analysts’ earnings forecast errors, we find that the discontinuity for small positive forecast errors persists in both annual and quarterly earnings following the adoption. The discontinuity is larger in magnitude for quarterly forecast errors compared to annual forecasts errors, consistent with our findings using earnings and changes in earnings scaled by lagged assets. The distribution of earnings forecast errors is dissimilar to that of earnings, with both smaller negative and smaller positive forecast errors than expected under continuity. We find no discontinuity in small negative forecast errors for annual earnings, both before and after the adoption.
Lastly, we conduct a series of robustness tests. Prior studies (e.g., Durtschi and Easton (2005; 2009)) speculate that the zero-earnings discontinuity may be driven by sample selection, model specifications, and tax items. We find that our results remain robust to these effects. To further address the concern that our findings could be driven by methodological choices, we extend the robustness tests from prior studies as well as conduct several model specification tests. Our results remain robust in all of these tests, including different scaling factors, measurements, and estimation specifications.
The paper contributes to the literature in two ways. First, it adds to the vast line of research investigating the consequences of SOX (Coates & Srinivasan, 2014). Prior studies find differences in earnings management behavior (Cohen et al., 2008; Krishnan et al., 2011), altered markets for auditors (DeFond & Lennox, 2011), and changed corporate risk-willingness (Bargeron et al., 2010) following the adoption. This paper is the first to demonstrate that the adoption is also associated with differential changes in financial reporting quality for different types of financial statements. It hereby extends prior studies showing the existence of the quarterly zero-earnings discontinuity prior to the adoption (Brown & Caylor, 2005), and complements studies showing that the annual zero-earnings discontinuity disappears after the adoption (Gilliam et al., 2015).
Second, the paper adds to the literature on the adoption of SOX-like regulations (Chardonnens & Wallmeier, 2024; Enomoto & Yamaguchi, 2017). Prior studies argue that J-SOX is more lenient than SOX regarding internal controls (Enomoto & Yamaguchi, 2017). This aligns with our findings that SOX is more lenient toward quarterly financial statements compared to annual financial statements. By extending studies on earnings management (e.g., Durtschi and Easton (2005), Durtschi and Easton (2009), Burgstahler and Chuk (2015), and Burgstahler and Chuk (2017)), this paper shows that the zero-earnings discontinuity remains relevant in the current regulatory environment.
The remainder of the paper is organized as follows. Section 2 presents the hypothesis development. Section 3 outlines the research design and sample construction. Section 4 reports the findings. Section 5 depicts the robustness tests and, lastly, section 6 concludes.
Hypothesis Development
The Sarbanes-Oxley Act was enacted in 2002 in response to a series of corporate scandals in the late 1990s and early 2000s. Its primary objective was to restore trust in financial reporting “by improving the accuracy and reliability of corporate disclosures” (SOX, 2002, amendment). It represented a major regulatory intervention, leading to long-lasting changes in the financial reporting environment. Among others, SOX required the establishment of an oversight board to issue and monitor compliance with auditing standards (SOX, 2002, Section 101.c.2–101.c.6), restricted audit firms from offering nonaudit services to their clients (SOX, 2002, Section 208.b), and enhanced internal control transparency by mandating an internal control report to be disclosed (SOX, 2002, Section 404). Prior studies generally agree that the adoption was followed by increased financial disclosure and tightened auditor requirements.
As a result, substantial attention has been devoted to investigating whether the adoption of SOX leads to an increase in financial reporting quality. The literature employs various measures of financial reporting quality with earnings management proxies comprising an integral part. One type of earnings management that has received particular attention is the zero-earnings discontinuity: the “hole” in the frequency of earnings below zero followed by a “bump” at and above zero. Its existence is commonly interpreted as firms’ incentive to manage earnings from a small loss to a small profit (Burgstahler & Dichev, 1997). However, despite its widespread use in the literature to capture earnings management (e.g., Jacob and Jorgensen (2007), Li (2014), and Burgstahler and Chuk (2015)), it is surrounded by great controversy. Prior studies argue that the discontinuity may merely be an artifact of income tax items (Beaver et al., 2007), scaling (Dechow et al., 2003), and sample selection (Durtschi & Easton, 2009). Yet, these arguments are often followed by additional studies ruling out such explanations (e.g., Burgstahler and Chuk (2013), and Burgstahler and Chuk (2015)).
Nonetheless, considerable attention has been devoted to examining the existence of the zero-earnings discontinuity and how changes in the discontinuity coincide with exogenous regulatory interventions (e.g., Enomoto and Yamaguchi (2017)). Prior studies (e.g., Gilliam et al. (2015)) find that the zero-earnings discontinuity in annual financial statements disappears following the adoption of SOX. This is commonly interpreted as the consequence of the stricter reporting environment that makes accrual earnings management more challenging to perform. However, little is known about the zero-earnings discontinuity, as well as other discontinuities, in quarterly financial statements and whether they also disappear following the adoption. This is economically important, as such statements are channels through which management discloses information (e.g., Lougee and Marquardt (2004)). Prior studies (e.g., Brown and Caylor (2005)) document that the zero-earnings discontinuity exists in quarterly earnings prior to the adoption. However, to our knowledge, no studies explore the existence of the zero-earnings discontinuity in quarterly financial statements after the adoption of SOX. Our study aims to fill this void by providing insight into the behavior of discontinuities in quarterly financial statements.
It is, ex ante, unclear how the adoption of SOX coincides with changes in the zero-earnings discontinuity. On the one hand, the improved accuracy and reliability in financial reporting following the adoption are likely to reduce management’s ability to manage earnings in annual financial statements. Additionally, violation of SOX increases the risk of personal prosecution for management, which could decrease their incentive for intentionally misstating financial information. In line with this, prior studies (e.g., Gilliam et al. (2015)) conjecture and find that the zero-earnings discontinuity in annual earnings disappears after adoption. While little is known about the zero-earnings discontinuity in quarterly financial statements, a similar disappearance is likely to be present following the adoption, as compliance with SOX is also required in quarterly financial statements.
On the other hand, the existence of mandatory audits is likely to play an important role in supporting the effectiveness of SOX in reducing earnings management. During an audit, an auditor investigates whether firms’ financial statements contain material misstatements and assesses their level of compliance with the regulation in force. In contrast to annual financial statements, quarterly financial statements “need only be provided as to the registrant and its subsidiaries consolidated and may be unaudited” (17 CFR, 2021, 210.10–01.a.1). This creates an opportunity for management to remain noncompliant with SOX on a quarterly basis while still being compliant on an annual basis. As a result, annual earnings may be vastly different from the sum of quarterly earnings, since management can perform misstatements in quarterly earnings that remain undiscovered until the annual audit. 3 However, despite this opportunity, management may be disincentivized to engage in such practices, as deviations between the sum of quarterly earnings and annual earnings will become apparent when the annual financial statements are published. Unless management can convince capital providers that such deviations are due to estimation errors, their earnings management behavior is likely to be revealed through the annual earnings. Due to the potential manipulation in quarterly earnings, the zero-earnings discontinuity in quarterly financial statements may not disappear after the adoption of SOX.
Therefore, we present our first directional hypothesis.
The zero-earnings discontinuity in quarterly earnings persists after the adoption of SOX. The persistence of the zero-earnings discontinuity in quarterly earnings may be attributable to different effects. On the one hand, the discontinuity may persist if SOX is less effective in restricting earnings management in quarterly financial statements compared to annual financial statements. On the other hand, the discontinuity may also persist if SOX is equally, or even more, effective in restricting earnings management in quarterly financial statements compared to annual financial statements. This is because earnings management is more likely to occur in quarterly financial statements than in annual financial statements prior to the adoption, due to the absence of auditors and greater potential estimation error in many line items in the statement (GAAP, 2022) [270-10-05-2]. As such, the zero-earnings discontinuity in quarterly earnings may persist following the adoption, even if the impact of SOX is greater, simply due to the discontinuity being substantially larger in magnitude prior to the adoption. To test whether the adoption of SOX has a weaker impact, in magnitude, on the zero-earnings discontinuity in quarterly compared to annual earnings, we present our second directional hypothesis.
The zero-earnings discontinuity in quarterly earnings declines less after the adoption of SOX compared to the zero-earnings discontinuity in annual earnings.
Research Design and Sample Selection
Research Design
To investigate Hypothesis 1, we follow prior studies (e.g., Brown and Caylor (2005), Beaver et al. (2007) and Gilliam et al. (2015)) and adopt the standardized-differences test by Burgstahler and Dichev (1997) (hereafter BD) as our main test. 4 By grouping the earnings distribution into intervals, the test identifies a discontinuity if the number of observations in a given interval differs significantly from the expected, which is defined as the average of the adjacent number of observations. Following Gilliam et al. (2015), we incorporate the variance correction proposed by Beaver et al. (2007) to obtain valid inference, causing our findings to be conservative compared to those by Burgstahler and Dichev (1997). Throughout our paper, we perform the BD test on both small profit and small loss observations in an effort to test both sides of the discontinuity. We find the BD test attractive due to its simplicity, the degree to which it is accepted in the literature, as well as its robustness towards skewness in the earnings distribution identified in prior studies (e.g., Burgstahler and Dichev (1997) and Gilliam et al. (2015)), since it relies only on the number of observations in the two adjacent intervals rather than the full sample. The test requires the subjective but important choice of interval size (hereafter bin size) to group the earnings distribution. We follow the prior literature (e.g., Burgstahler & Dichev, 1997 and Gilliam et al. (2015)) and use a bin size of 0.005 for annual earnings and one-fourth of that, 0.00125, for quarterly earnings.
To address the concern that our findings may be driven by the choice of bin size, we adopt the manipulation test by Cattaneo et al. (2020) (hereafter MT) as a robustness check. Intuitively, the MT test investigates self-selection in a variable of interest (the so-called “running” variable). In our case, we interpret self-selection as earnings management and adopt reported earnings as the running variable. The test is nonparametric and based on local polynomial techniques, is boundary adaptive and bins the data in a Means Squared Error (MSE 5 ) optimal fashion. This approach circumvents one of the main disadvantages of the BD test and follows prior literature (e.g., Degiannakis et al. (2022)) by applying nonparametric tests in investigating the zero-earnings discontinuity. We find the MT test attractive due to its nonparametric nature, allowing us to use more observations than when applying the BD test and to obtain estimates that are robust to skewness. Unless otherwise noted, we apply a first order local polynomial for the point estimate, a second order local polynomial for the bias correction, and a triangular kernel following recommendations in prior studies (e.g., Cattaneo et al. (2019a)). 6
To investigate Hypothesis 2, we adopt a difference-in-difference research design. Our approach is similar to that of prior studies (e.g., Enomoto and Yamaguchi (2017) and Chardonnens and Wallmeier (2024)), but instead of only considering the implementation of new regulation, we compare the difference in impact on annual and quarterly earnings. We adopt two measures capturing the magnitude of the zero-earnings discontinuity to ensure our findings are not driven by our choice of measurement: In our first measure, we use the difference between the actual and expected numbers of zero-earnings observations, which is equivalent to the numerator in the BD test (hereafter the unstandardized discontinuity measure). This enables us to isolate the size of the discontinuity from its corresponding standard error. In doing so, we address the concern that a discontinuity may appear economically large because the corresponding standard error is small. In our second measure, we standardize our first measure by its corresponding standard error, which is equivalent to the BD test statistic (hereafter the standardized discontinuity measure). This enables us to capture the strength of the discontinuity, hereby taking into account the uncertainty associated with the point estimates. To ensure consistency with our prior analysis, we investigate the small loss and small profit discontinuities individually using both measures. Furthermore, we scale both measures to ensure that they are comparable. Since quarterly earnings are four times as frequent as annual earnings, we divide the unstandardized discontinuity measure by four. Since the numerator in the BD test for quarterly earnings discontinuity is four times larger than for the annual earnings discontinuity, and the denominator is two times larger, we divide the standardized discontinuity measure by two.
Using these measures, we estimate the following two linear regression models using Ordinary Least Squares:


Discontinuities around zero are observed in various financial data. One example is changes in earnings (e.g., Burgstahler and Dichev (1997) and Gilliam et al. (2015)), which seek to capture firms’ incentives to meet and beat their previously reported earnings. Another example is analysts’ earnings forecast errors (e.g., Burgstahler and Dichev (1997), Gilliam et al. (2015), and Bird et al. (2019)). Financial analysts act as intermediaries between firms and capital markets, providing earnings forecasts, among others, to institutional investors to guide their investment decisions (Lang & Lundholm, 1996). In making earnings forecasts, analysts incorporate public and private information (e.g., Nichols (1989), Abarbanell (1991), Schipper (1991), Bowen et al. (2002), Weiss (2010), Nekrasov et al. (2022), and Campbell et al. (2023)). Prior studies (e.g., Degeorge et al. (1999)) find that companies manage earnings to meet and beat analysts’ expectations, which implies that a discontinuity may exist in analysts’ earnings forecast errors. We follow prior studies (e.g., Gilliam et al. (2015)) and extend our analysis by investigating discontinuities in both changes in earnings and analysts’ earnings forecast errors in quarterly financial statements after the adoption of SOX.
Sample Construction
To test our hypotheses, we collect financial statements of all publicly traded firms in the USA from Compustat during the period 1980 to 2020. Consistent with prior literature (e.g., Gilliam et al. (2015)), we eliminate public utility companies (with a Standard Industrial Classification (SIC) code between 4400 and 5000) and financial companies (with a SIC code between 6000 and 6500) due to regulatory differences. This causes 93,472 annual firm-specific and 246,615 quarterly firm-specific observations to leave the sample. Next, we eliminate observations that appear twice in the dataset such that only one of the identical firm-specific observations is kept, leading to the removal of 1870 annual firm-specific and 7594 quarterly firm-specific observations, respectively.
Firstly, we investigate the zero-earnings discontinuity using net income scaled by one year lagged total assets for both annual and quarterly earnings (hereafter annual and quarterly earnings for simplicity), respectively, to control for firm size. While other methods of scaling have been used in the literature, prior studies (e.g., Burgstahler and Chuk (2017)) argue that the discontinuity will be present if the chosen measure is widely reported and used by stakeholders. We believe this holds for earnings scaled by lagged total assets.
Secondly, we investigate the discontinuity around zero using changes in earnings scaled by lagged total assets for both annual and quarterly earnings. Changes in annual earnings are measured as the difference in earnings from the previous year to the current year. Calculating changes in quarterly earnings is, however, nontrivial, as this can be done from quarter to quarter or from the last year’s quarter to the current year’s quarter (Byun & Roland, 2022). We choose the latter since this takes into account systematic differences between quarters such as fourth quarter reversal effects (Das et al., 2009).
Thirdly, we investigate the discontinuity around zero using analysts’ earnings forecast errors. We collect individual analysts’ earnings per share forecasts including the covered firms’ actual earnings per share, both adjusted for stock splits, from I/B/E/S 7 during the period 1983 to 2020. 8 We are unable to extend the sample period to 1980 as I/B/E/S started collecting earnings forecasts from 1983. Earnings forecast errors are calculated as the difference between the consensus earnings forecast, measured as the median of analysts’ earnings per share forecasts for each firm-quarter (year) observation, and the actual earnings per share of each firm-quarter (year) observation in our sample. Following prior literature (e.g., Kini et al. (2009) and Cheong and Thomas (2011)), we exclude firm-quarter(year)-observations with fewer than three earnings forecasts, earnings forecasts made less than one month prior to the earnings announcement, and earnings forecasts made before the last earnings announcement to minimize the impact of outliers. We do not calculate the absolute value of the forecast errors, as the direction of the forecast errors is crucial to our discontinuity test. Larger values in either positive or negative direction reflect greater (less) forecast errors (accuracy).
Our final sample consists of 222,611 (829,664), 204,685 (751,274), and 138,160 (339,500) annual (quarterly) earnings, changes in earnings, and analyst earnings forecast error observations, respectively.
Descriptive Statistics
Descriptive Statistics.
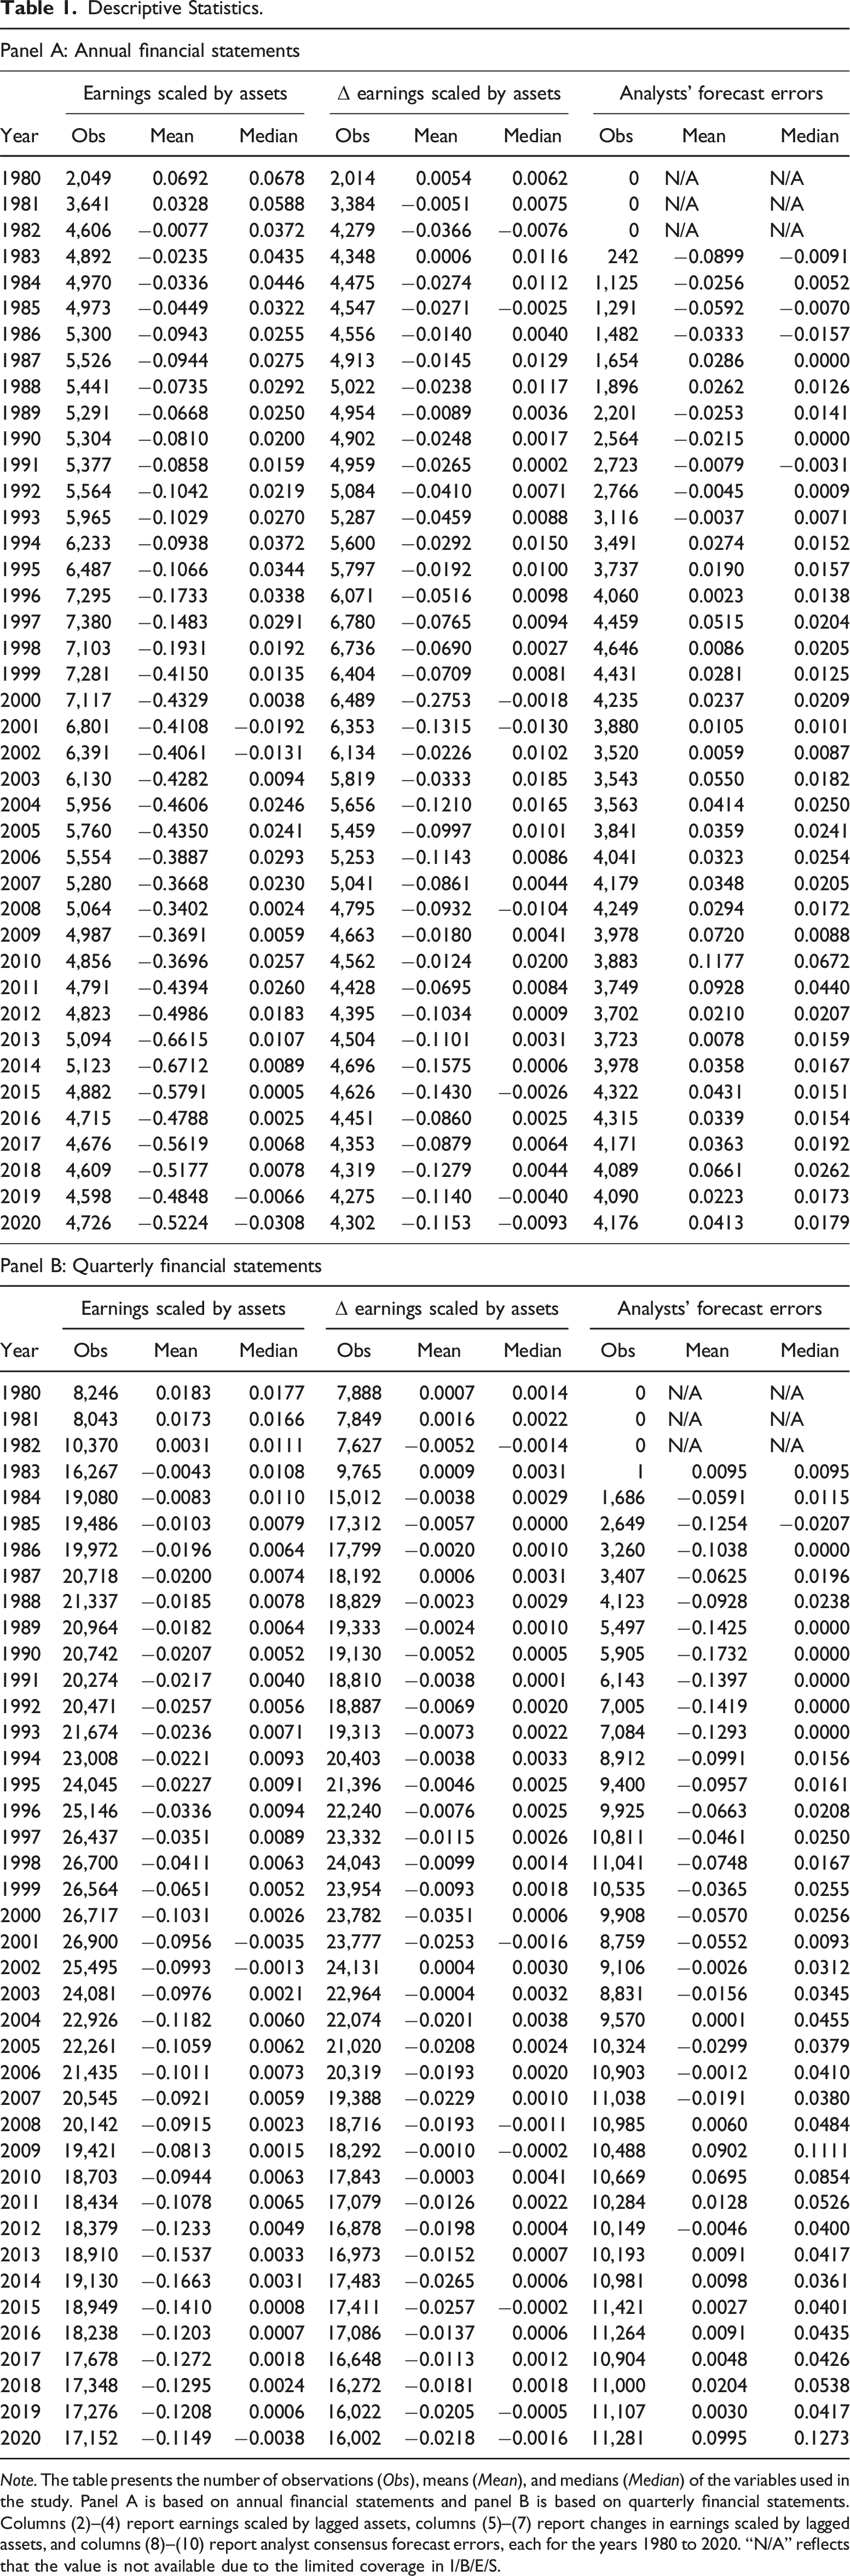
Note. The table presents the number of observations (Obs), means (Mean), and medians (Median) of the variables used in the study. Panel A is based on annual financial statements and panel B is based on quarterly financial statements. Columns (2)–(4) report earnings scaled by lagged assets, columns (5)–(7) report changes in earnings scaled by lagged assets, and columns (8)–(10) report analyst consensus forecast errors, each for the years 1980 to 2020. “N/A” reflects that the value is not available due to the limited coverage in I/B/E/S.
Empirical Findings
The Zero-Earnings Discontinuity
Pre- and Post-SOX Periods
We investigate Hypothesis 1 by first examining the zero-earnings discontinuity graphically. As such, Figure 1 presents annual and quarterly earnings scaled by lagged assets for the post SOX period. The figure reveals a noticeable drop in the frequency of quarterly earnings just below zero compared to just above zero. A similar pattern is observed for annual earnings, although the effect is less pronounced. Consistent with our descriptive statistics, we find that the distributions are approximately normal though slightly left skewed. Based on the graphical inspection, we find that the zero-earnings discontinuity likely persists in quarterly earnings after the adoption of SOX. However, due to the smaller effect on annual earnings, we refrain from drawing inference about the persistence of the discontinuity in annual earnings. Annual and quarterly earnings post-SOX. Note: The figure depicts the histograms of annual and quarterly earnings scaled by lagged assets around zero-earnings for the period 2003 to 2020. Observations in the range of [−0.15; 0.15] are grouped into intervals of size 0.0025 leading to 120 bins. The histogram colored in red displays annual earnings, while the histogram colored in blue displays quarterly earnings. The left hand axis shows the frequency of annual earnings, whereas the right hand axis shows the frequency of quarterly earnings. Quarterly earnings are multiplied by 4 to ensure comparability.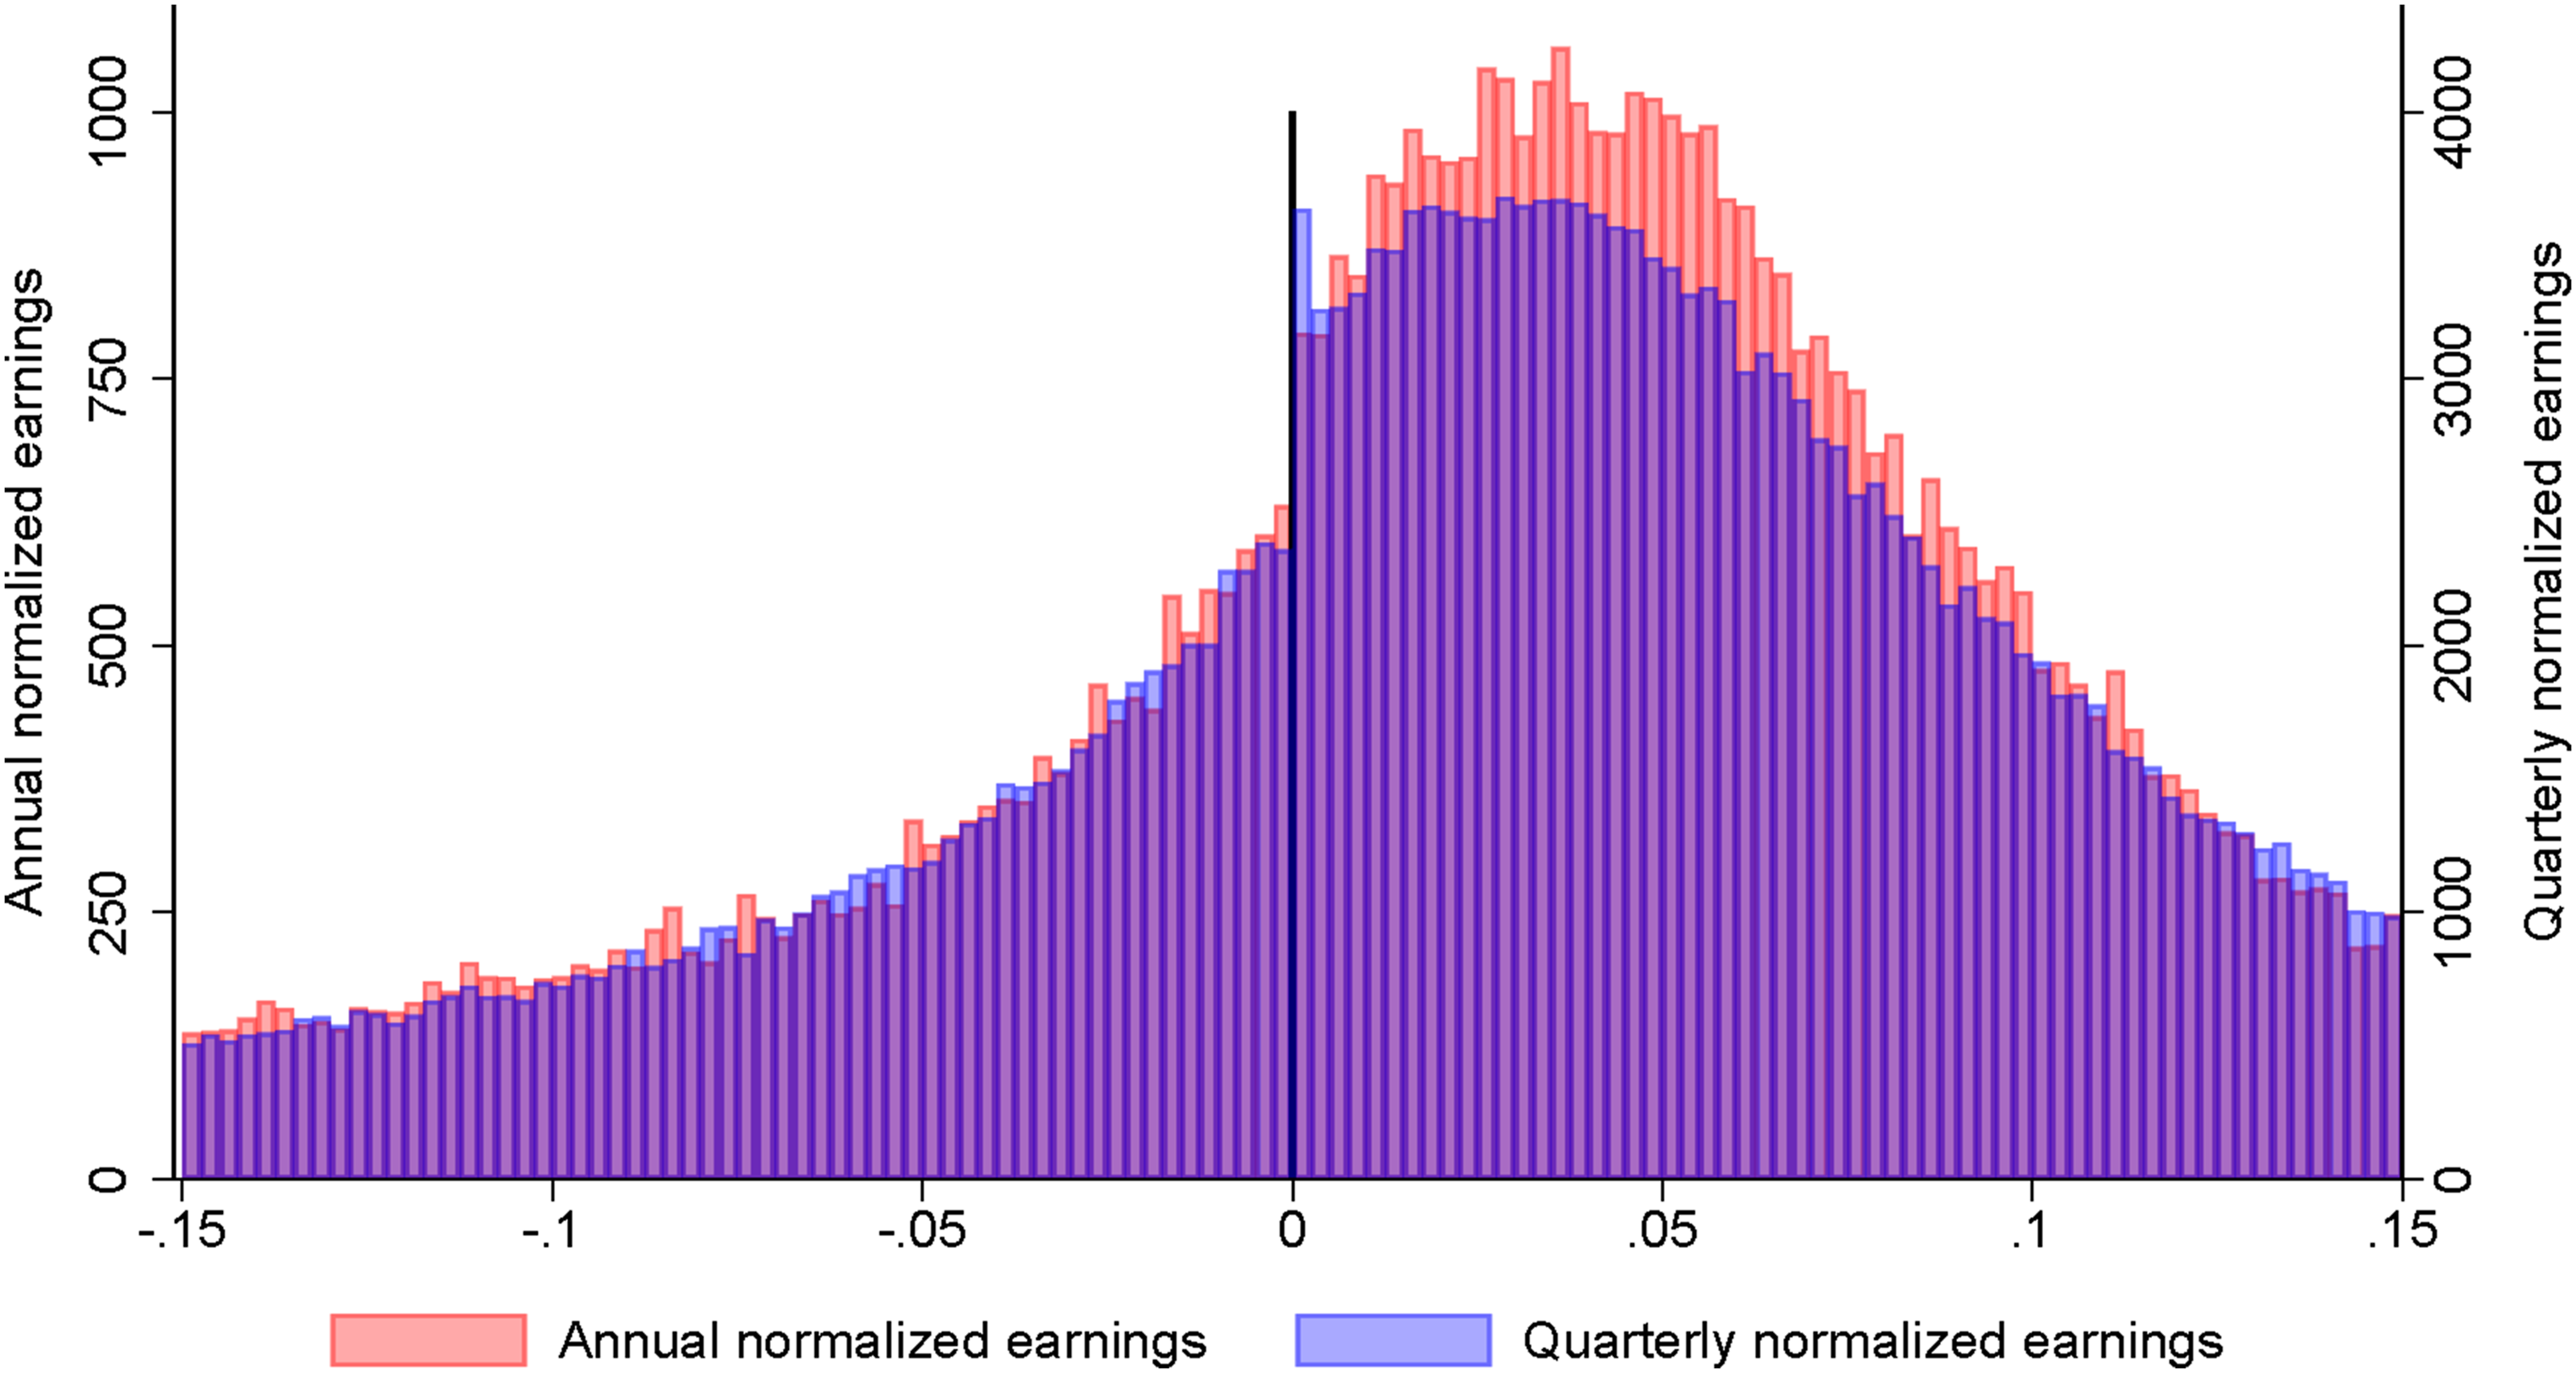
Figure 2 presents smoothed density functions around the zero-earnings discontinuity for earnings scaled by lagged assets, along with the corresponding confidence intervals. Panels A and B show the estimated density functions for annual earnings, while Panels C and D display the functions for quarterly earnings. Panels A and C present the estimated density functions using the pre-SOX period, and panels B and D show the post-SOX period. The zero-earnings discontinuity is present in both annual and quarterly earnings prior to the adoption of SOX, as shown by the nonoverlapping confidence intervals, which is consistent with prior studies (e.g., Burgstahler and Dichev (1997) and Brown and Caylor (2005)). Following the adoption, the zero-earnings discontinuity disappears in annual earnings, which is consistent with Gilliam et al. (2015). The discontinuity persists in quarterly earnings, which supports our prediction and is consistent with the graphical inspection in Figure 1. This is consistent with the explanation that companies continue to manage earnings around the zero-earnings threshold in quarterly financial statements following the adoption of SOX. Estimated densities for annual and quarterly earnings pre- and post-SOX. (a) Panel A: Annual earnings pre-SOX. (b) Panel B: Annual earnings post-SOX. (c) Panel C: Quarterly earnings pre-SOX. (d) Panel D: Quarterly earnings post-SOX. Note: The figure visualizes the manipulation test developed by Cattaneo et al. (2020) using the companion 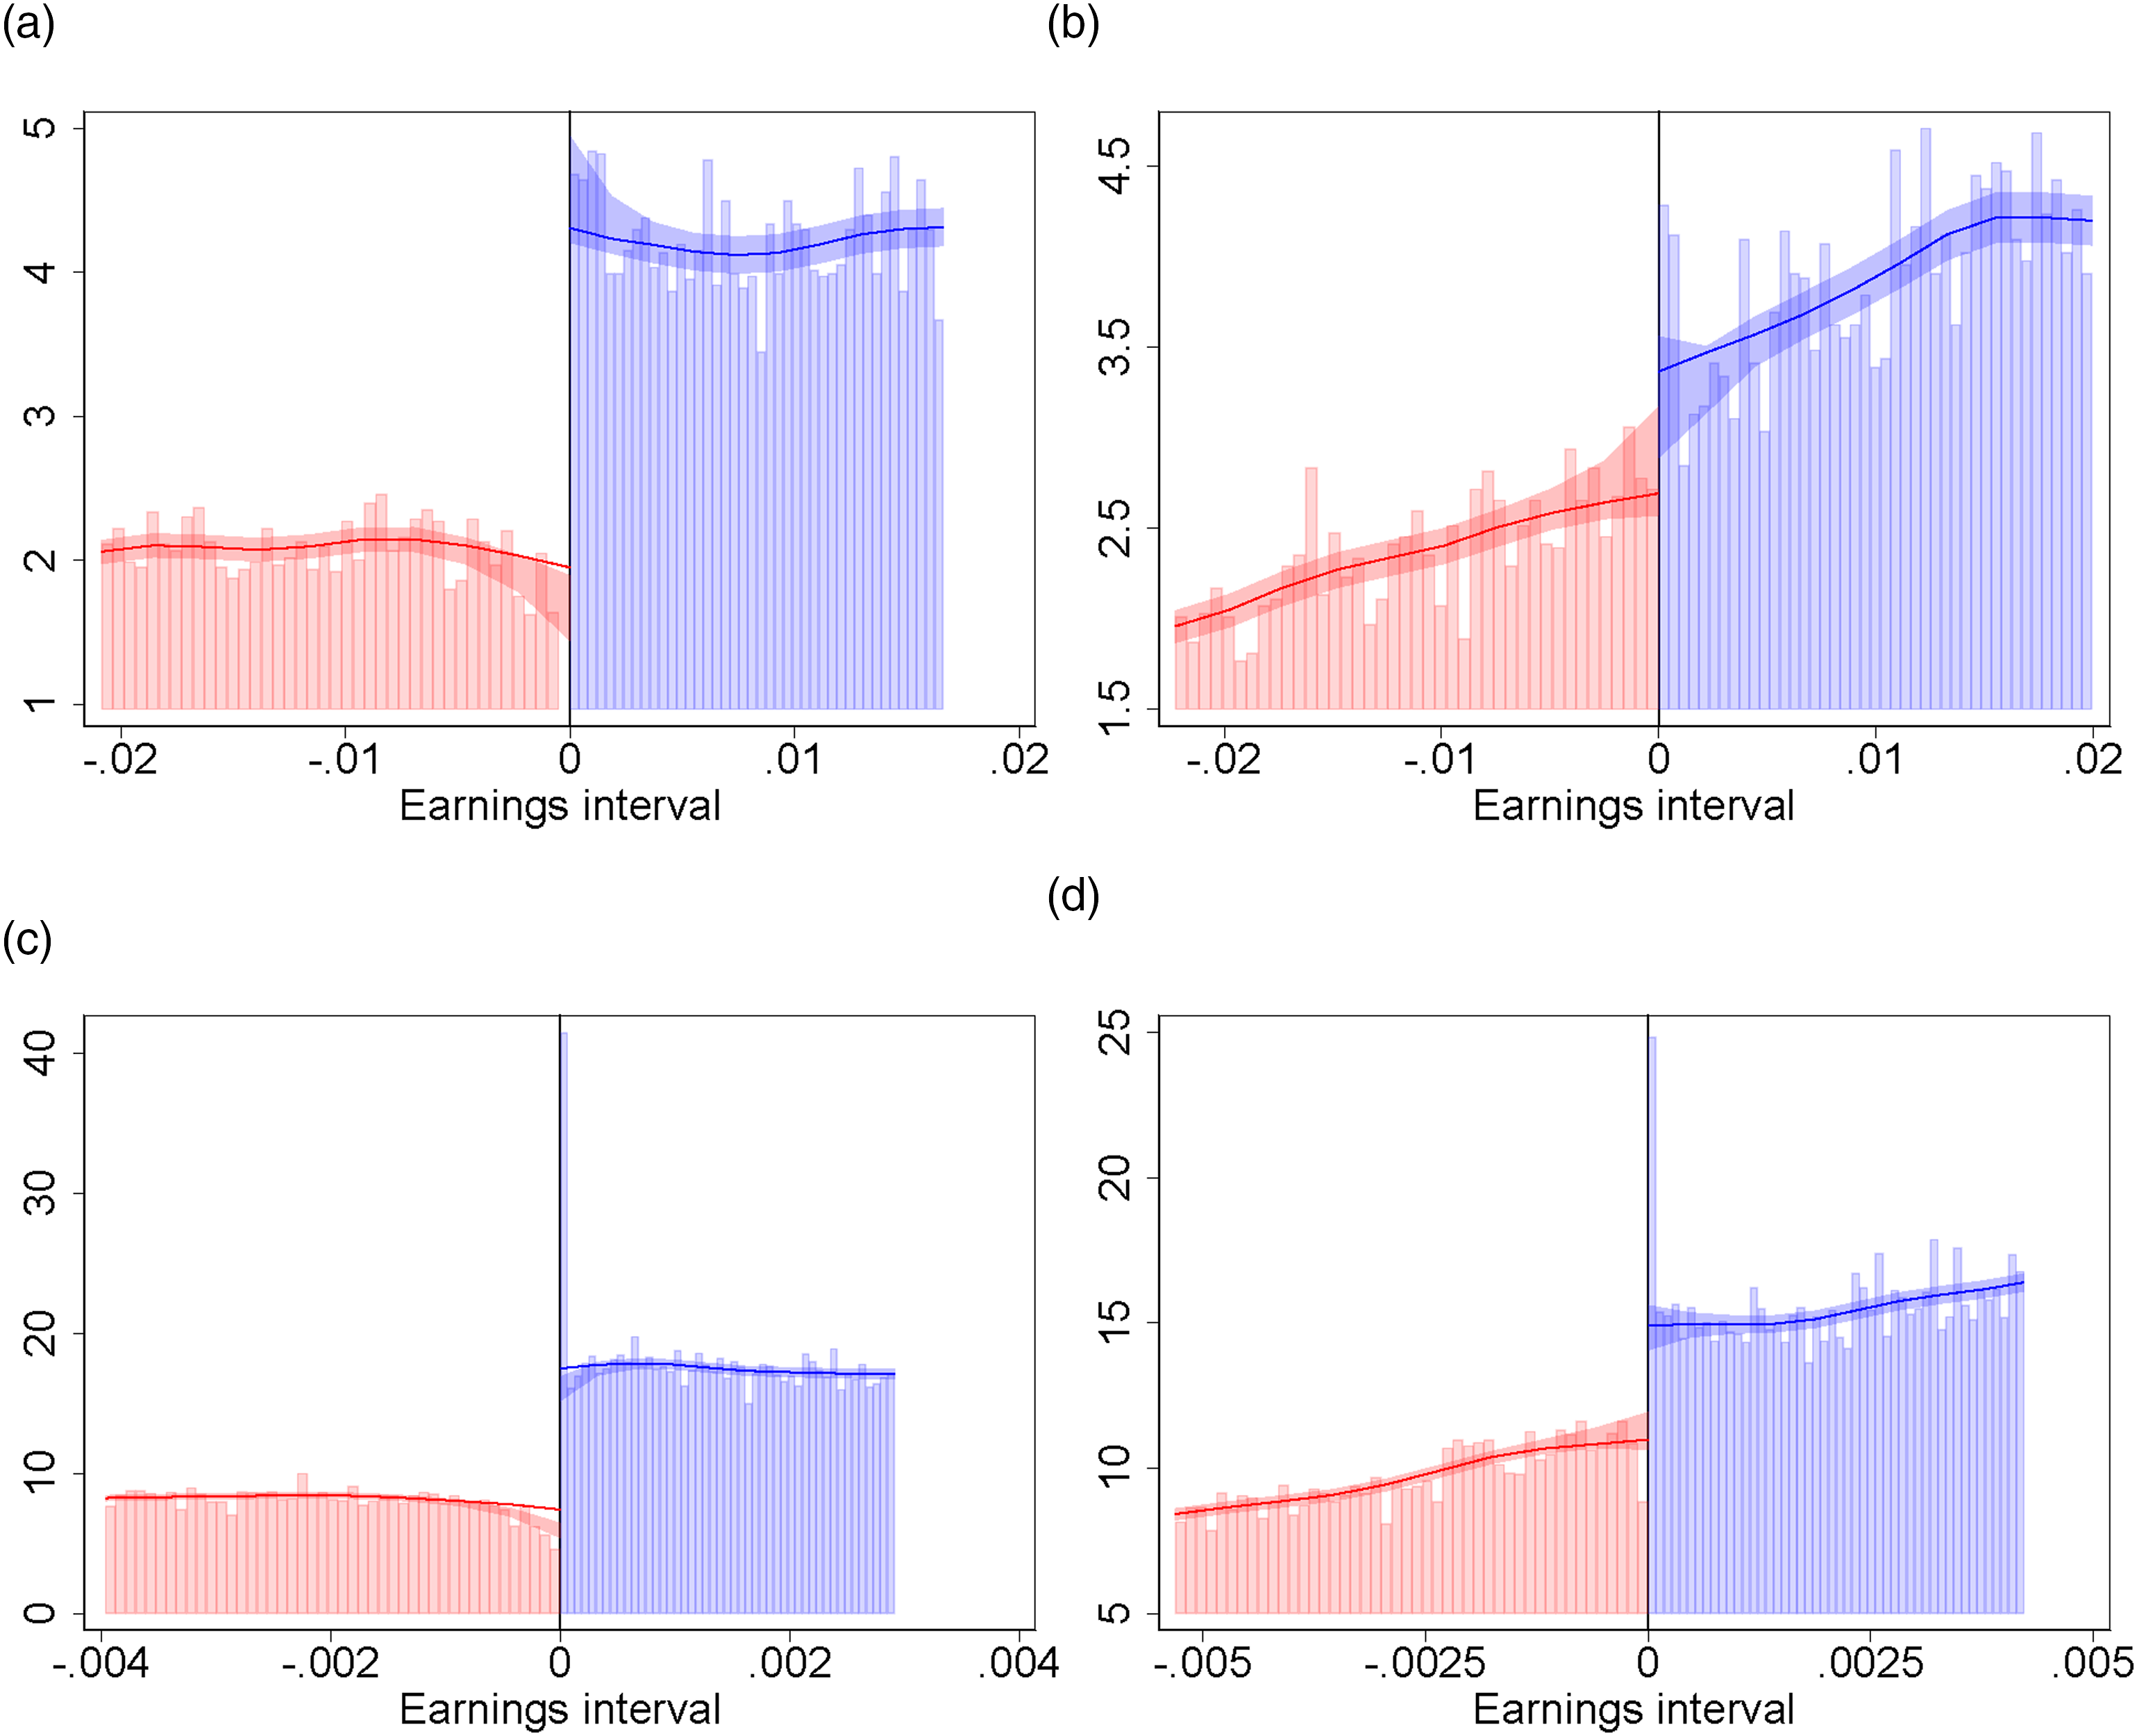
The BD and MT Tests for Annual and Quarterly Earnings Pre- and Post-SOX.
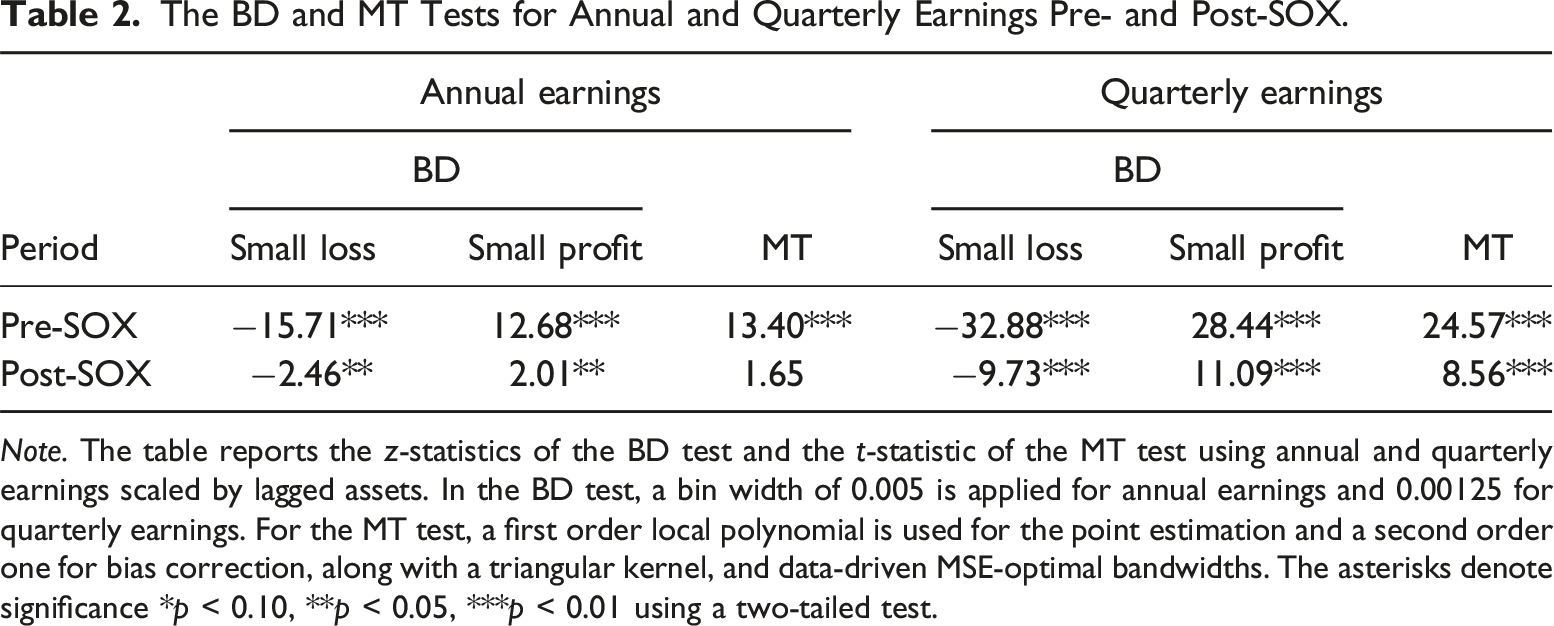
Note. The table reports the z-statistics of the BD test and the t-statistic of the MT test using annual and quarterly earnings scaled by lagged assets. In the BD test, a bin width of 0.005 is applied for annual earnings and 0.00125 for quarterly earnings. For the MT test, a first order local polynomial is used for the point estimation and a second order one for bias correction, along with a triangular kernel, and data-driven MSE-optimal bandwidths. The asterisks denote significance *p < 0.10, **p < 0.05, ***p < 0.01 using a two-tailed test.
For quarterly earnings, the BD z-statistics for the zero-earnings discontinuity in the pre- and post-SOX periods are −32.88 and −9.73 for small loss observations, respectively, and 28.44 and 11.09 for small profit observations, respectively. In all cases, the test statistics are significant with a p-value less than 1%, suggesting that the zero-earnings discontinuity exists in both the pre- and post-SOX periods, although being substantially smaller in the latter. Similar results are found when using the MT test with significant z-statistic of 24.57 and 8.56 in the pre- and post-SOX periods, respectively. The test statistics for the quarterly zero-earnings discontinuity are generally at least twice as large as those for the annual zero-earnings discontinuity both before and after the adoption of SOX. This suggests, as argued in Hypothesis 2, that management likely has greater reporting flexibility in quarterly earnings compared to annual earnings even before SOX was adopted.
The graphical insights and empirical tests provide evidence that the zero-earnings discontinuity persists in quarterly earnings following the adoption of SOX. This is consistent with our explanation that SOX had a weaker impact on earnings management in quarterly financial statements compared to annual statements.
Analyses by Year
To obtain additional insights into the persistence of the zero-earnings discontinuity and to shed further light on our inconsistent findings with Gilliam et al. (2015), we examine how the zero-earnings discontinuity evolves over time by employing both the BD and MT tests independently for each year. For quarterly earnings, we pool the four quarters together for each year to ensure comparability. 9
The BD and MT Tests for Annual and Quarterly Earnings by Year.
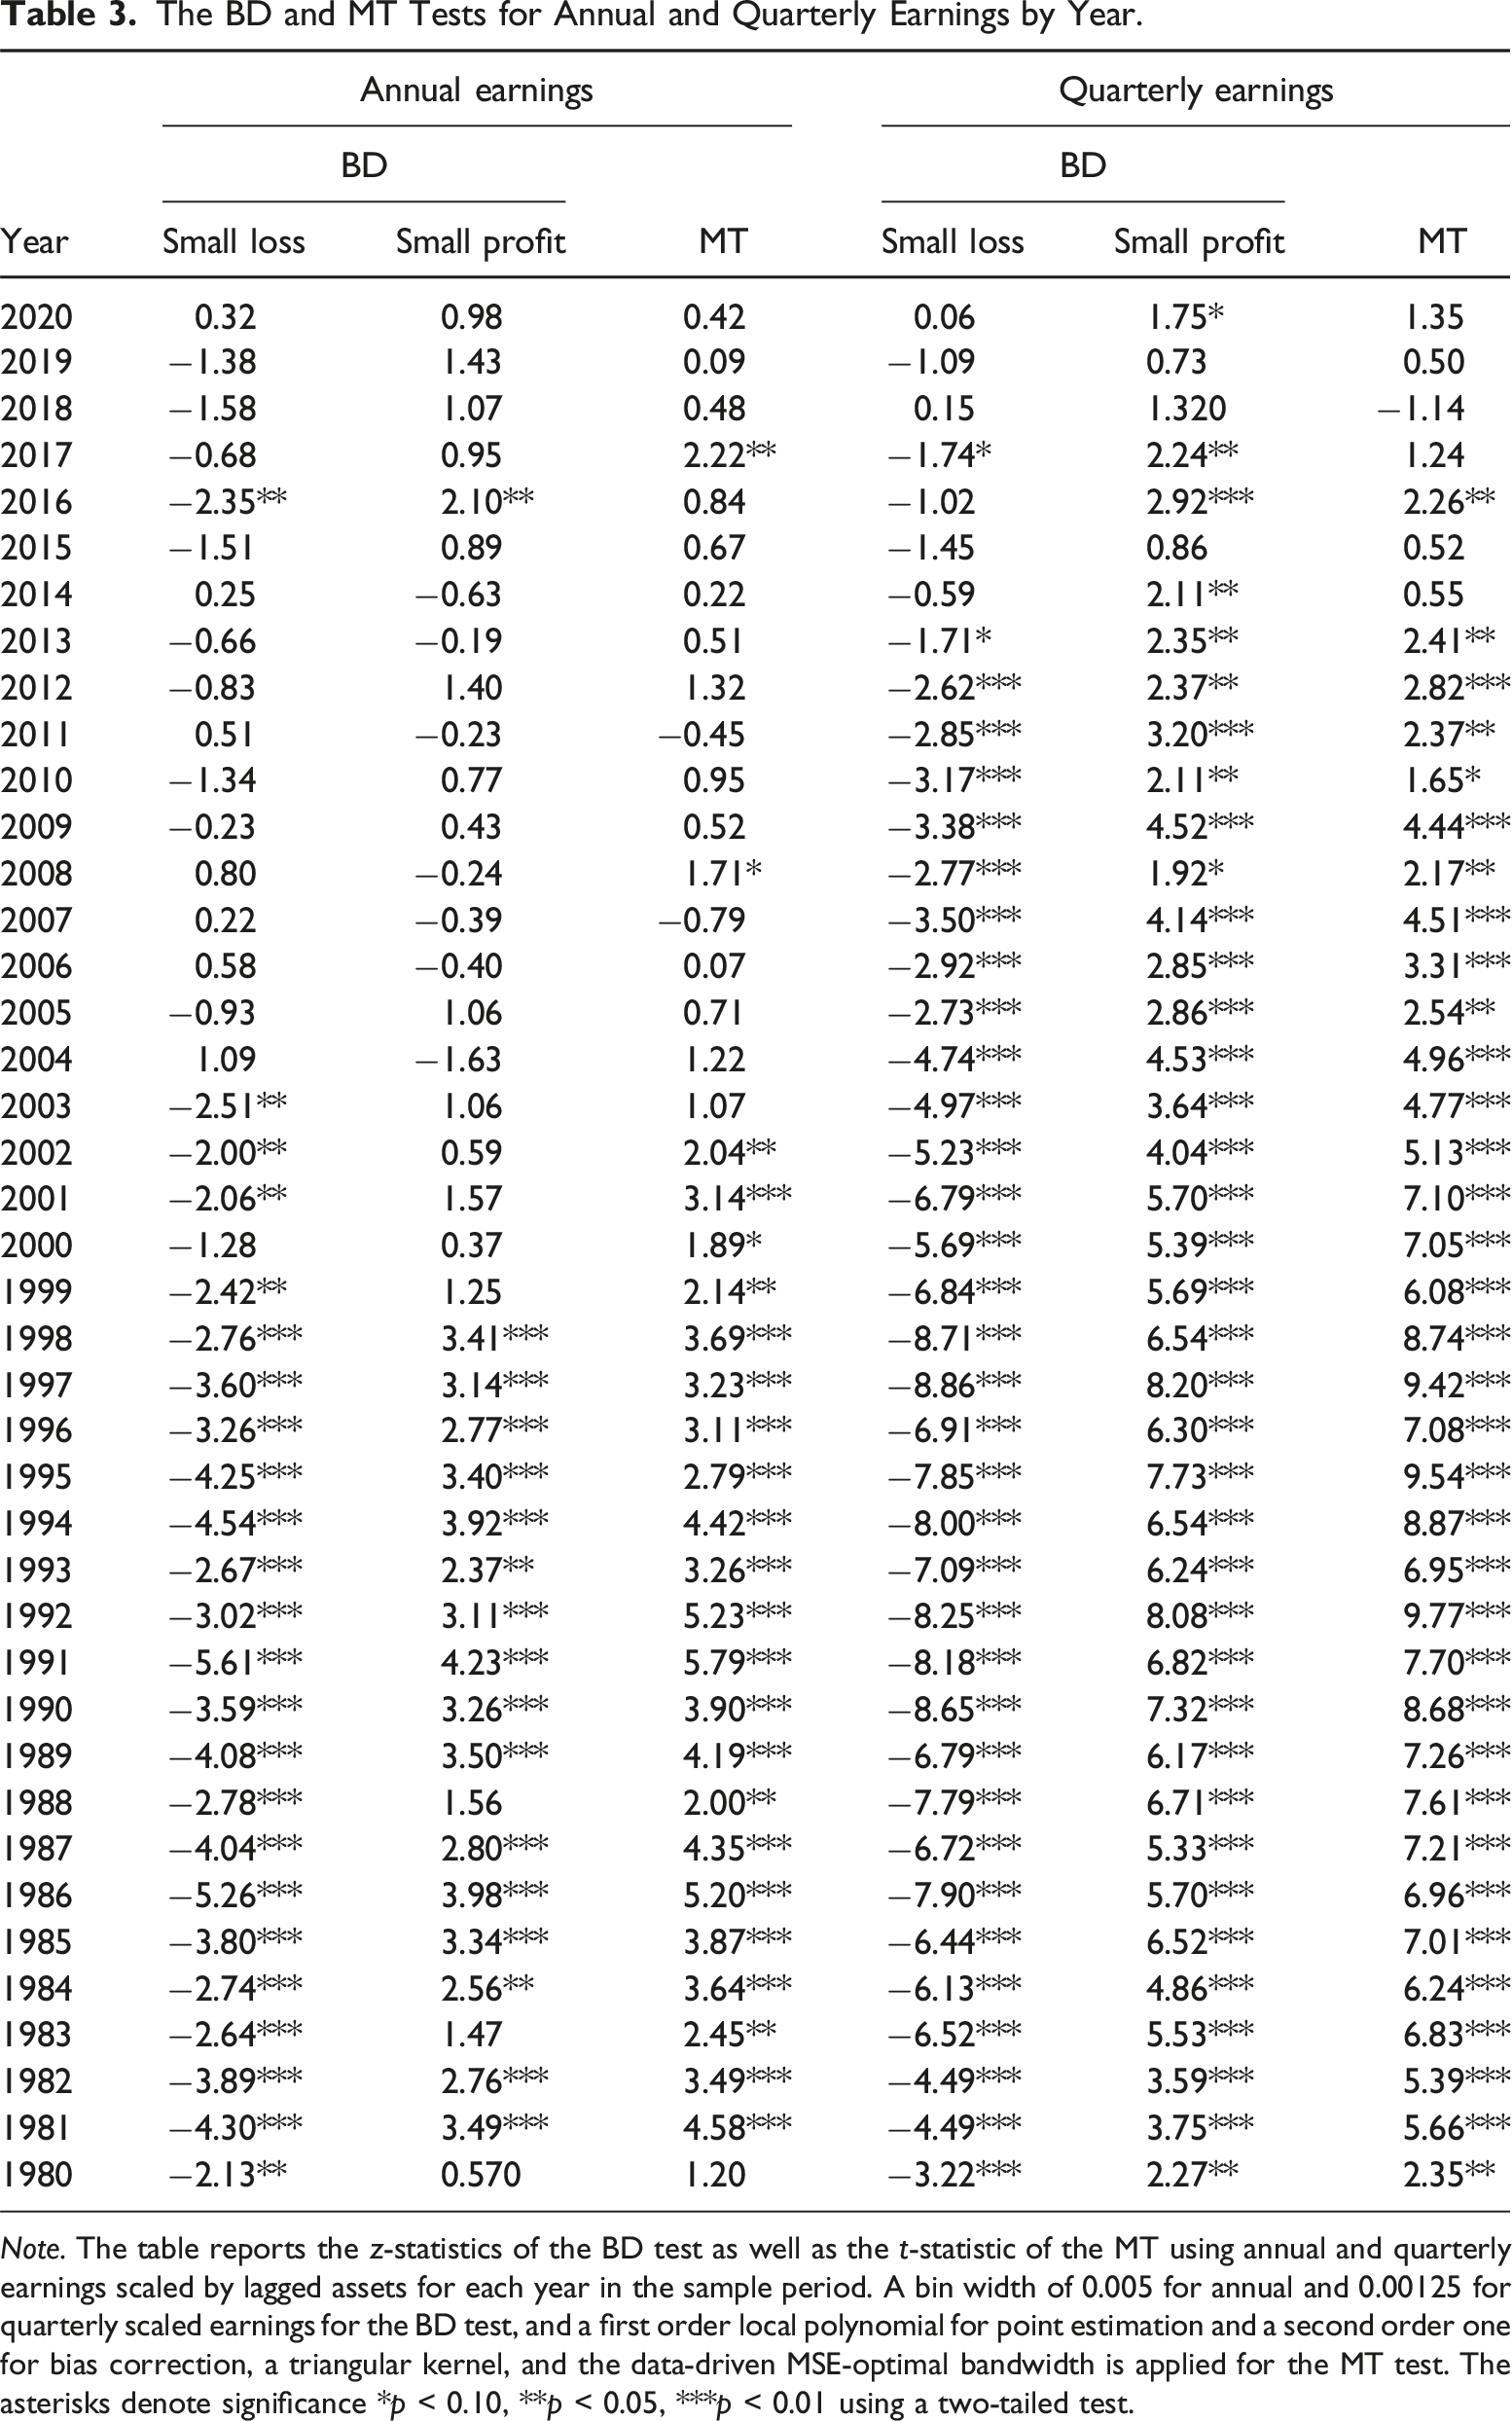
Note. The table reports the z-statistics of the BD test as well as the t-statistic of the MT using annual and quarterly earnings scaled by lagged assets for each year in the sample period. A bin width of 0.005 for annual and 0.00125 for quarterly scaled earnings for the BD test, and a first order local polynomial for point estimation and a second order one for bias correction, a triangular kernel, and the data-driven MSE-optimal bandwidth is applied for the MT test. The asterisks denote significance *p < 0.10, **p < 0.05, ***p < 0.01 using a two-tailed test.
The zero-earnings discontinuity in quarterly earnings persists until 2013, after which it disappears. To explore this further, we recreate Figure 2 in Figure 3 by comparing quarterly earnings from 2003 to 2013 and from 2014 to 2020. Confirming the findings of Table 3, we find that the zero-earnings discontinuity in quarterly earnings largely disappears after 2013. Several factors may contribute to this disappearance: It aligns with the explanation that SOX exhibited a delayed effect on the zero-earnings discontinuity in quarterly earnings (e.g., Chardonnens et al. (2022)). Alternatively, it may also be due to investors shifting their attention away from the zero-earnings threshold (e.g., Herrmann et al. (2011)) towards other thresholds (e.g., Bird et al. (2019) and de la Rosa and Lambertsen (2022)). Moreover, it could also be caused by the imposed regulation and increased scrutiny of financial reporting in the aftermath of the financial crisis. We do not conjecture what caused this decline due to the difficulties in attributing changes in the zero-earnings discontinuity to events (e.g., Gilliam et al. (2015)).
10
Estimated densities for annual and quarterly earnings pre- and post-2013. (a) Panel A: Quarterly Earnings from 2003 to 2013. (b) Panel B: Quarterly Earnings from 2014 to 2020. Note: The figure visualizes the manipulation test developed by Cattaneo et al. (2020) using the companion 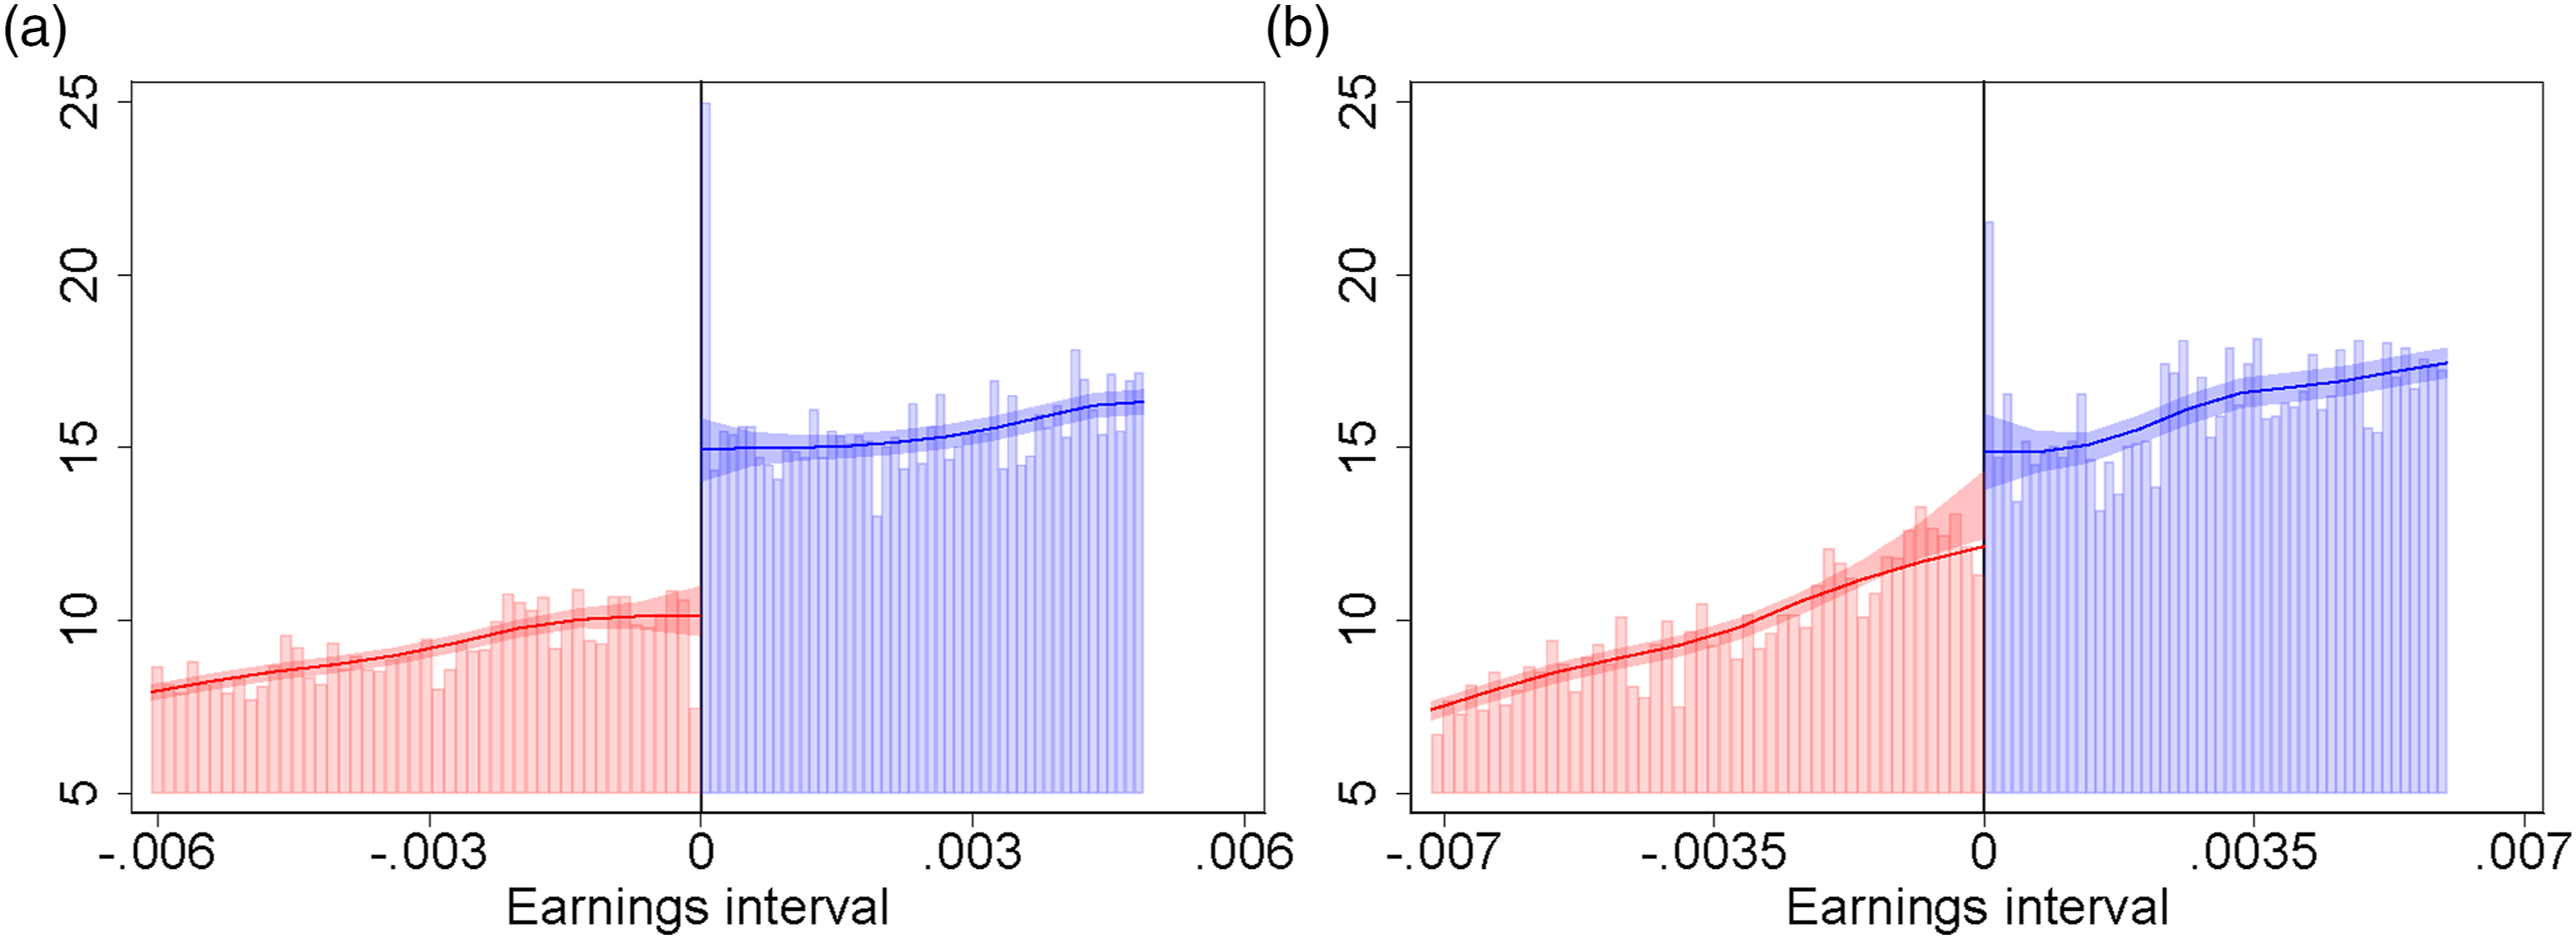
The year-by-year tests provide evidence consistent with our prediction that the adoption of SOX is associated with a weaker decline in earnings management in quarterly financial statements compared to annual financial statements. Our findings align with those of Enomoto and Yamaguchi (2017), who find that J-SOX weakened but did not eliminate the zero-earnings discontinuity in Japan, and Trimble (2018), who find the adoption of IFRS weakened but did not eliminate the zero-earnings discontinuity in both EU and non-EU countries. While our findings coincide with the adoption of SOX, establishing causal inference remains challenging as per prior studies (Gilliam et al., 2015). As a result, we caution the reader towards attributing the changes in the zero-earnings discontinuity solely to the adoption of SOX.
Relative Change in the Zero-Earnings Discontinuity
Relative Magnitude of the Discontinuity for Annual Compared to Quarterly Earnings.
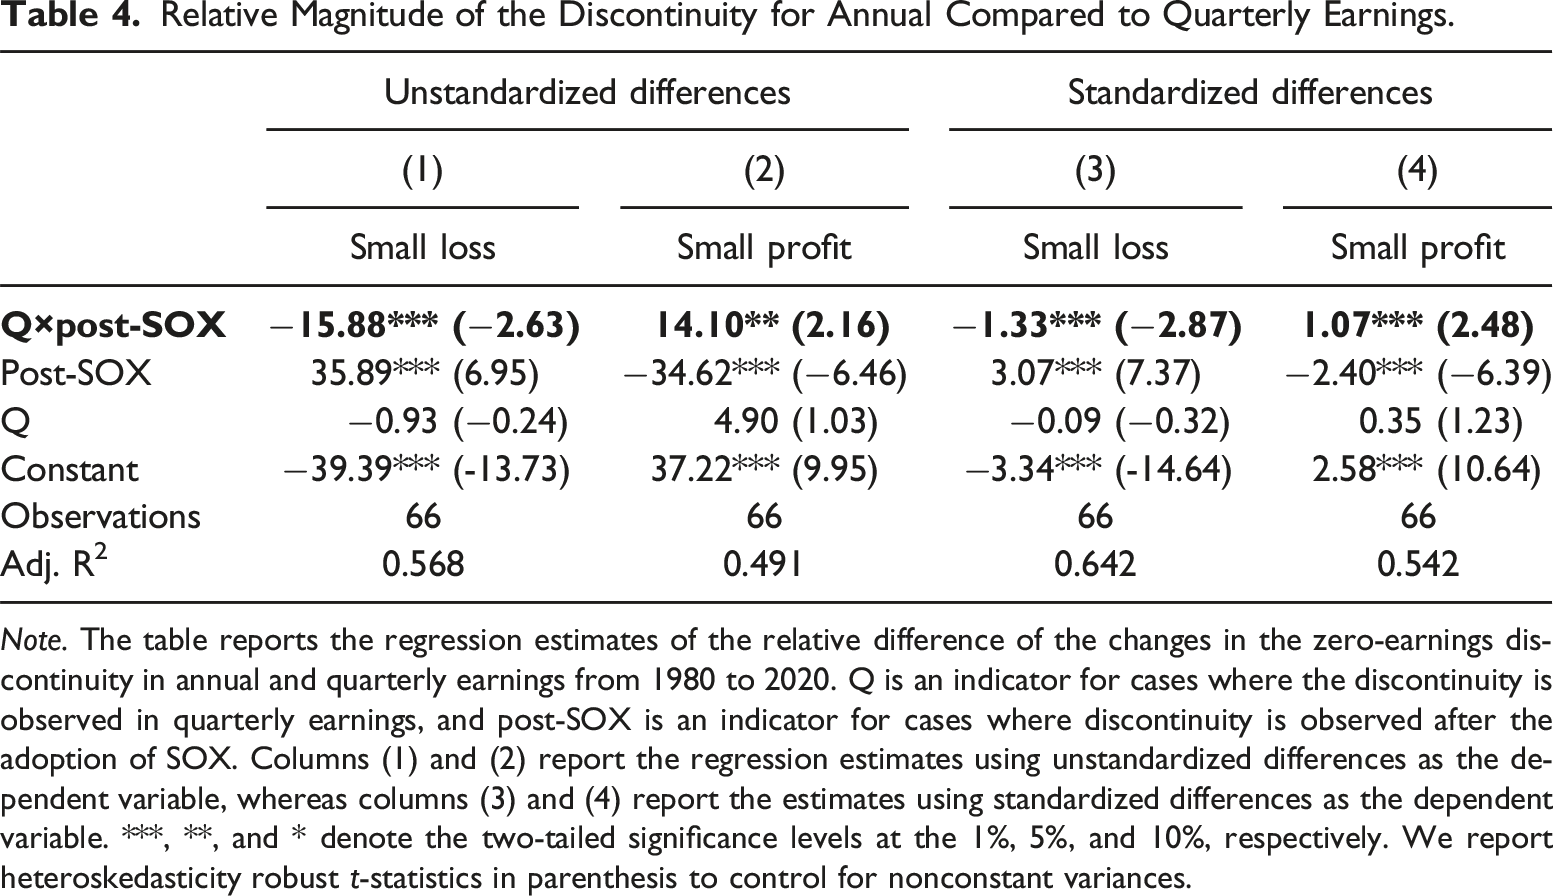
Note. The table reports the regression estimates of the relative difference of the changes in the zero-earnings discontinuity in annual and quarterly earnings from 1980 to 2020. Q is an indicator for cases where the discontinuity is observed in quarterly earnings, and post-SOX is an indicator for cases where discontinuity is observed after the adoption of SOX. Columns (1) and (2) report the regression estimates using unstandardized differences as the dependent variable, whereas columns (3) and (4) report the estimates using standardized differences as the dependent variable. ***, **, and * denote the two-tailed significance levels at the 1%, 5%, and 10%, respectively. We report heteroskedasticity robust t-statistics in parenthesis to control for nonconstant variances.
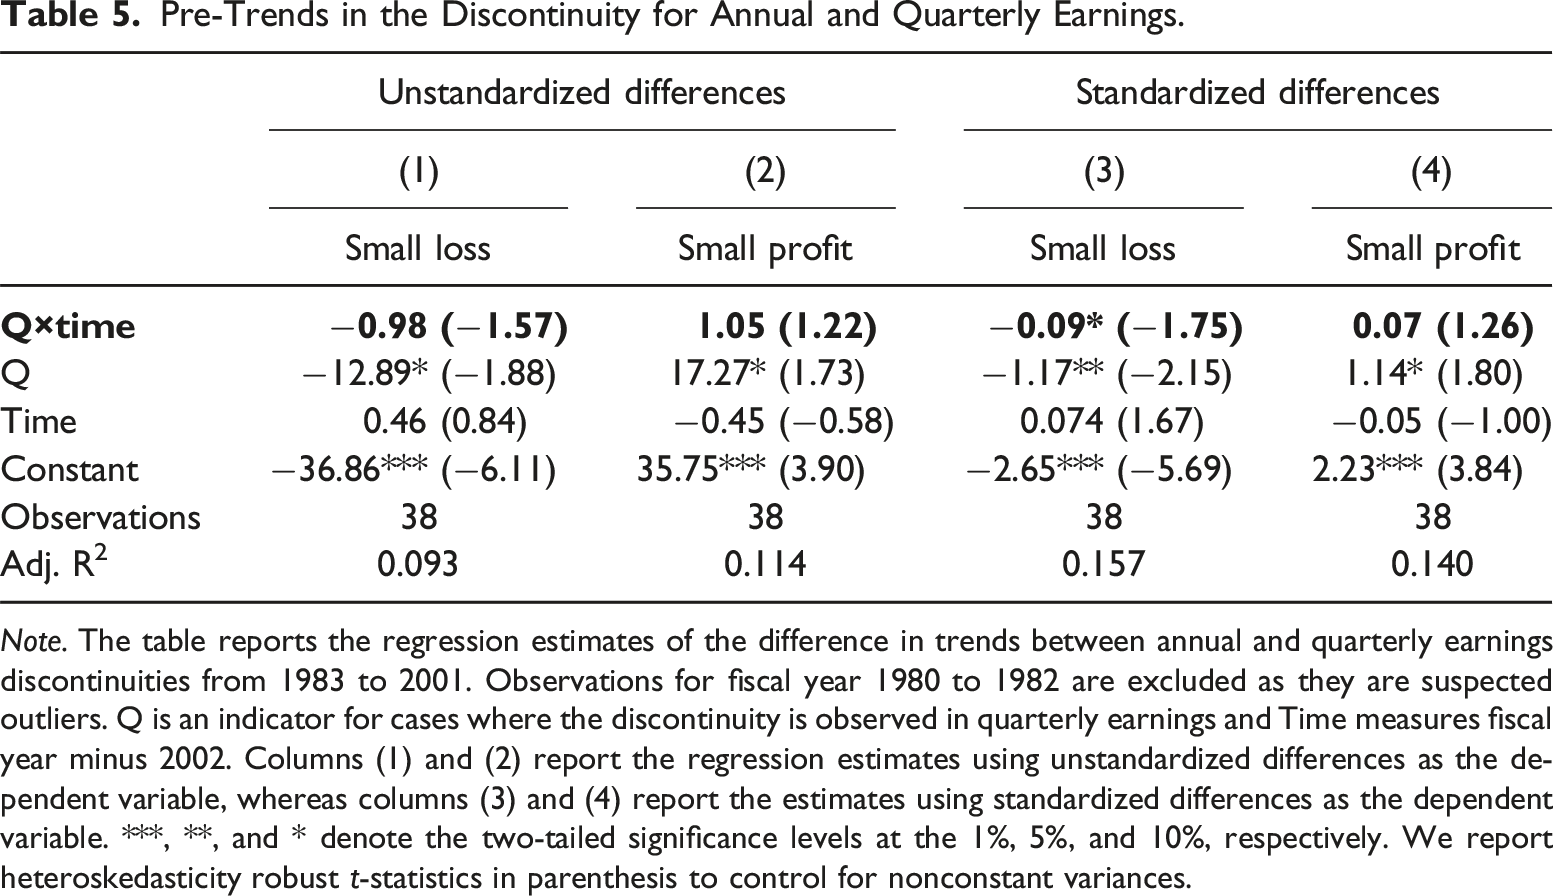
The validity of the difference-in-difference estimates relies on the assumption of parallel trends. To assess potential violations of this assumption, Figure 4 presents both discontinuity measures across time. Visual inspection reveals no meaningful pre-trends in either plot, although the discontinuity becomes larger in magnitude between 1980 and 1982. Since this is isolated to fiscal years with relatively few observations as evident from Table 1, we consider these years as outliers. To test the assumption, we interact the quarterly earnings discontinuity indicator, “Q,” with the continuous time variable, Time, and restrict the sample to the pre-SOX period. If a pre-trend exists prior to the adoption, the interaction term will likely be significant. Table 5 reports the findings. There is no significant pre-trend in the zero-earnings discontinuity prior to the adoption, except for a weak pre-trend for small standardized losses (p-value: 0.09) suggesting our findings are unlikely to be driven by existing trends in the discontinuities.
12
The magnitude of the discontinuity for annual and quarterly earnings across time. (a) Panel A: Small profit discontinuities, (b) Panel B: Small loss discontinuities. Note: The figure depicts the zero-earnings discontinuity in annual and quarterly earnings from 1980 to 2020. Panels A and B display the discontinuity for small profits and small losses, respectively. Each dot represents point estimates of the discontinuity across time, calculated as the difference between the number of small loss (profit) observations and the expected number of observations under continuity (i.e., the numerator in the BD test statistic). The vertical bar shows the corresponding confidence intervals for each point estimate, calculated using the standard error of each point estimate (i.e., the denominator in the BD test statistic). The red dots represent annual earnings, while the blue dots represent quarterly earnings. Pre-Trends in the Discontinuity for Annual and Quarterly Earnings. Note. The table reports the regression estimates of the difference in trends between annual and quarterly earnings discontinuities from 1983 to 2001. Observations for fiscal year 1980 to 1982 are excluded as they are suspected outliers. Q is an indicator for cases where the discontinuity is observed in quarterly earnings and Time measures fiscal year minus 2002. Columns (1) and (2) report the regression estimates using unstandardized differences as the dependent variable, whereas columns (3) and (4) report the estimates using standardized differences as the dependent variable. ***, **, and * denote the two-tailed significance levels at the 1%, 5%, and 10%, respectively. We report heteroskedasticity robust t-statistics in parenthesis to control for nonconstant variances.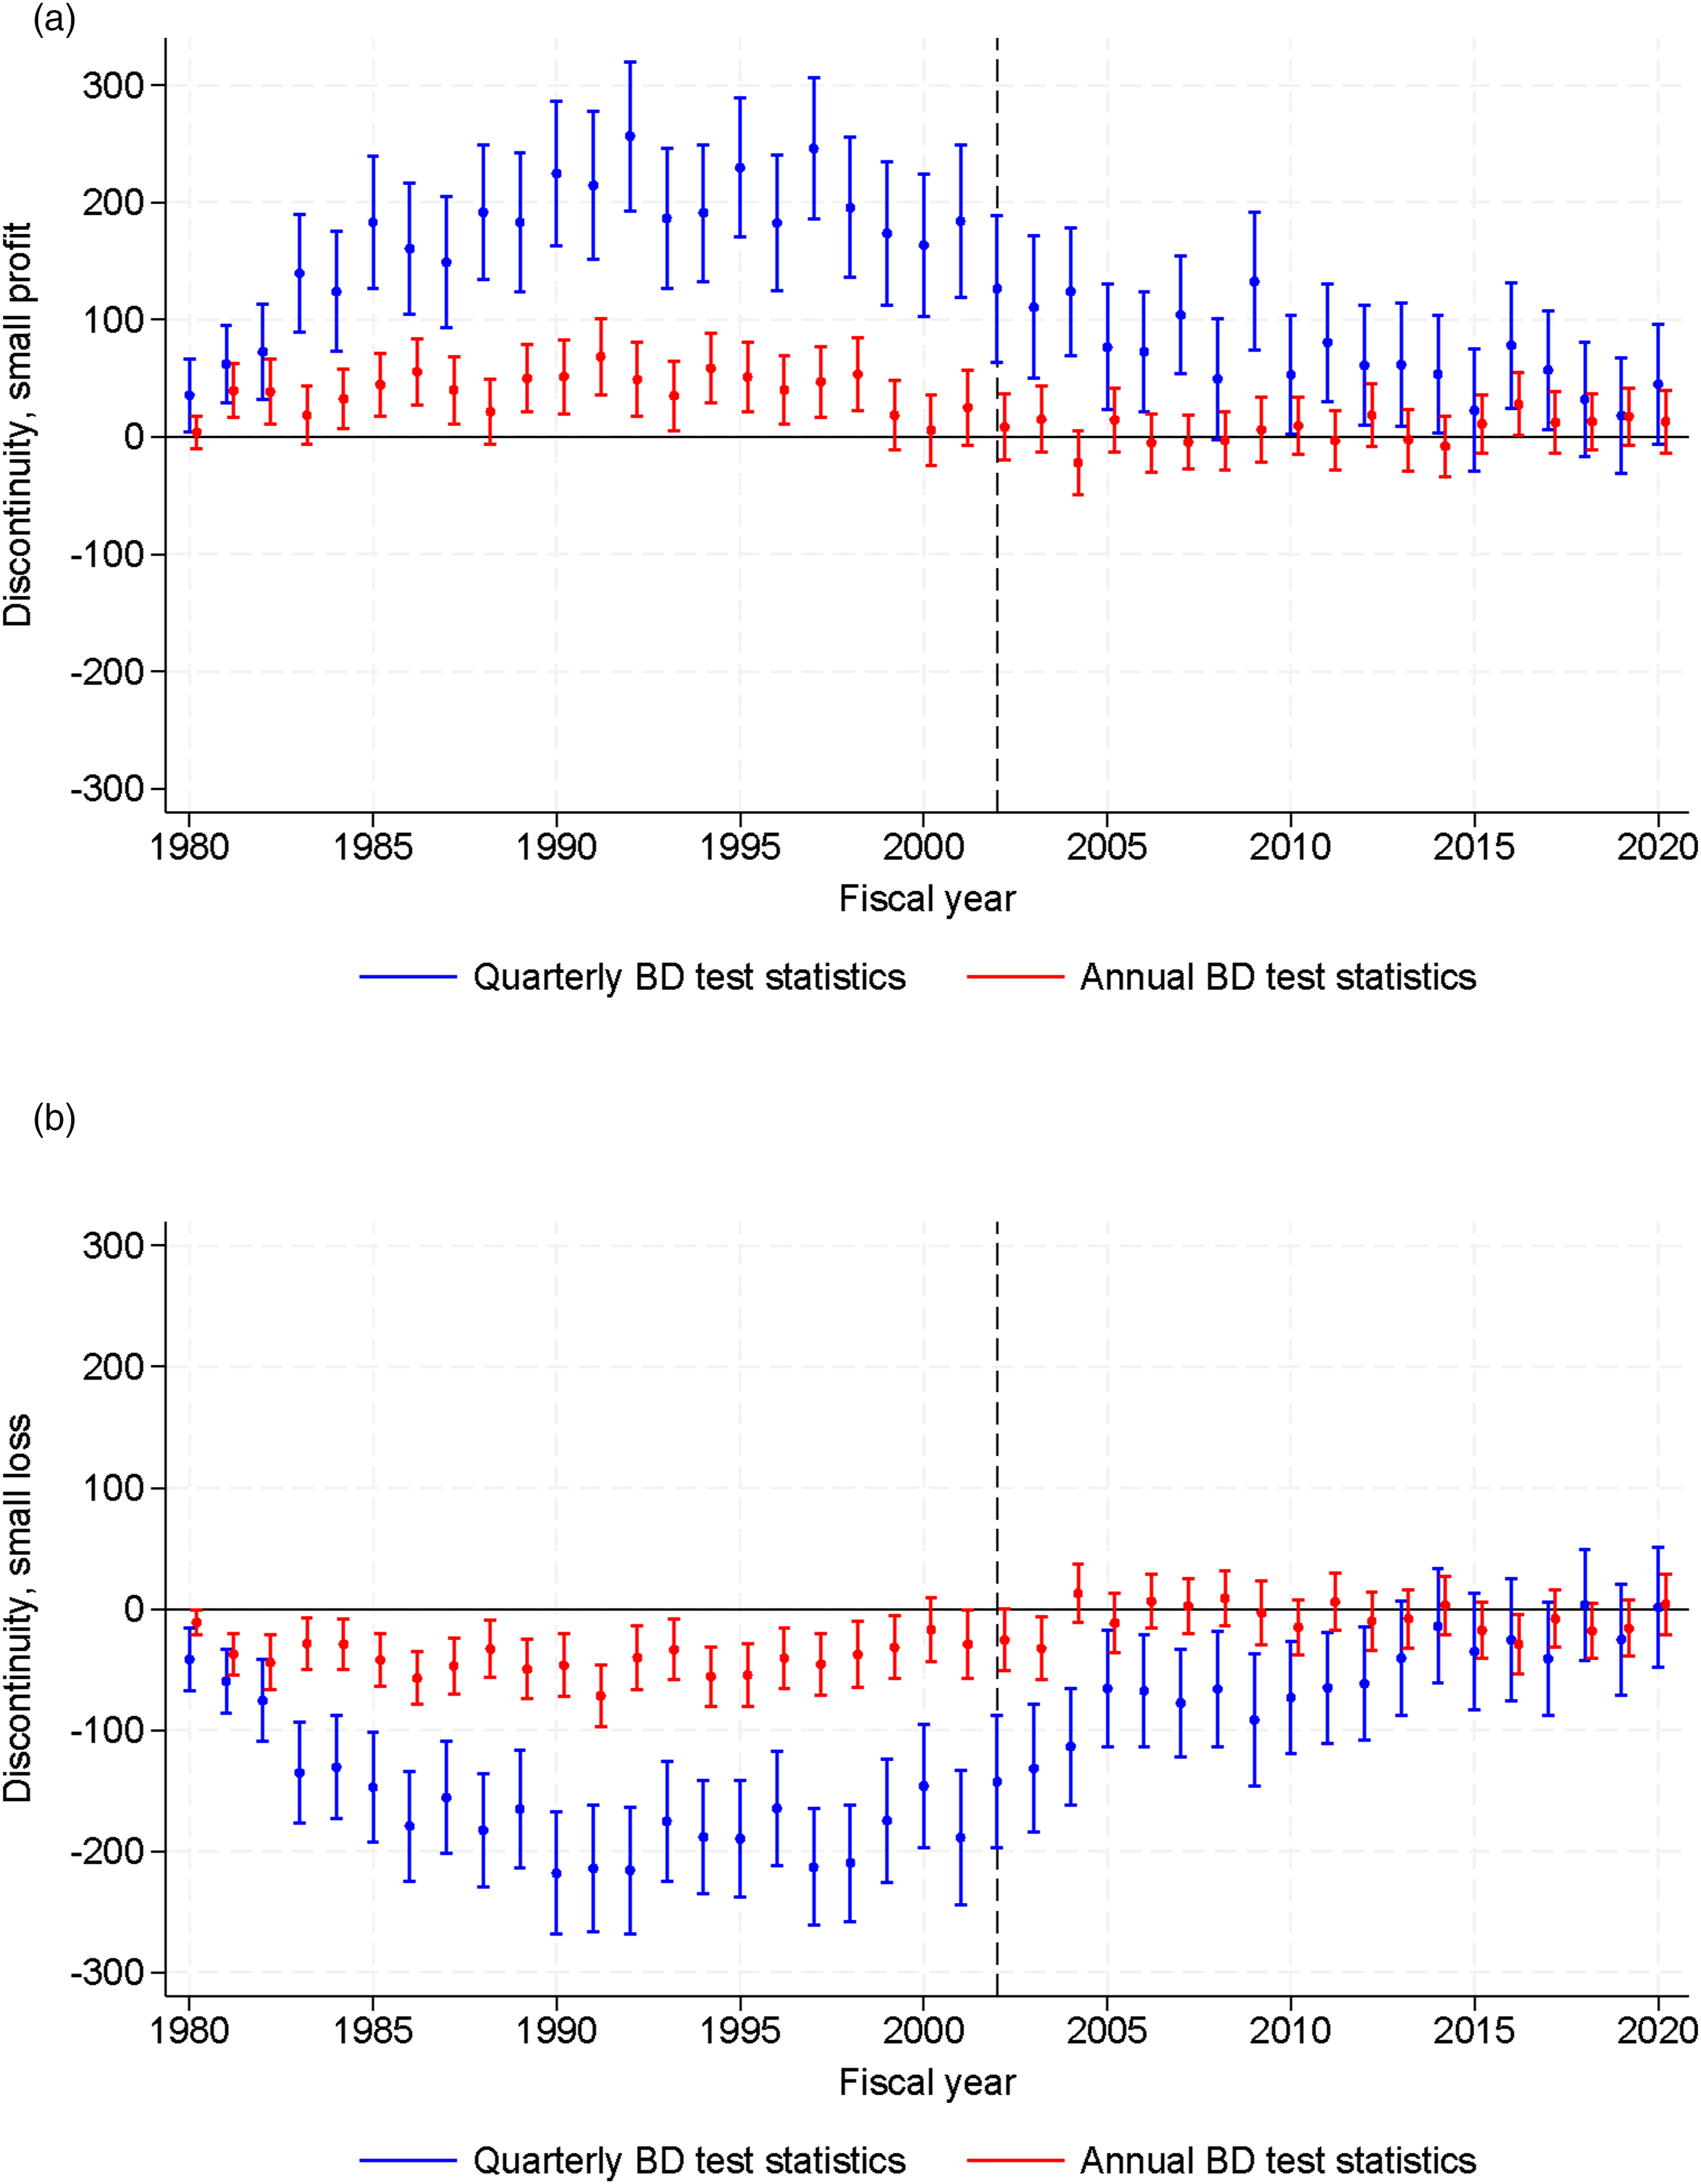
Changes in Earnings
We next investigate the discontinuity in the distribution of changes in earnings around zero changes. Figure 5 presents changes in annual and quarterly earnings scaled by lagged assets in the post-SOX period. The figure reveals that the noticeable drop in the frequency of changes in quarterly earnings persists, while it largely disappears for changes in annual earnings. Consistent with prior studies (e.g., Burgstahler and Dichev (1997)), the magnitude of the discontinuity appears smaller compared to that of earnings scaled by lagged assets. Based on the graphical inspection, the zero-earnings discontinuity also persists in quarterly earnings following the adoption of SOX. Changes in annual and quarterly earnings post-SOX. Note: The figure depicts the histograms of changes in annual and quarterly earnings scaled by lagged assets around zero changes in earnings from 2003 to 2020. Observations in the range of [−0.15; 0.15] are presented and grouped into intervals of size 0.0025 leading to 120 bins. The histogram colored in red displays changes in annual earnings, while the histogram colored in blue displays changes in quarterly earnings. The left hand side axis represents the frequency of changes in annual earnings, whereas the right hand side axis represents the frequency of changes in quarterly earnings. Quarterly earnings are multiplied by 4 to ensure comparability.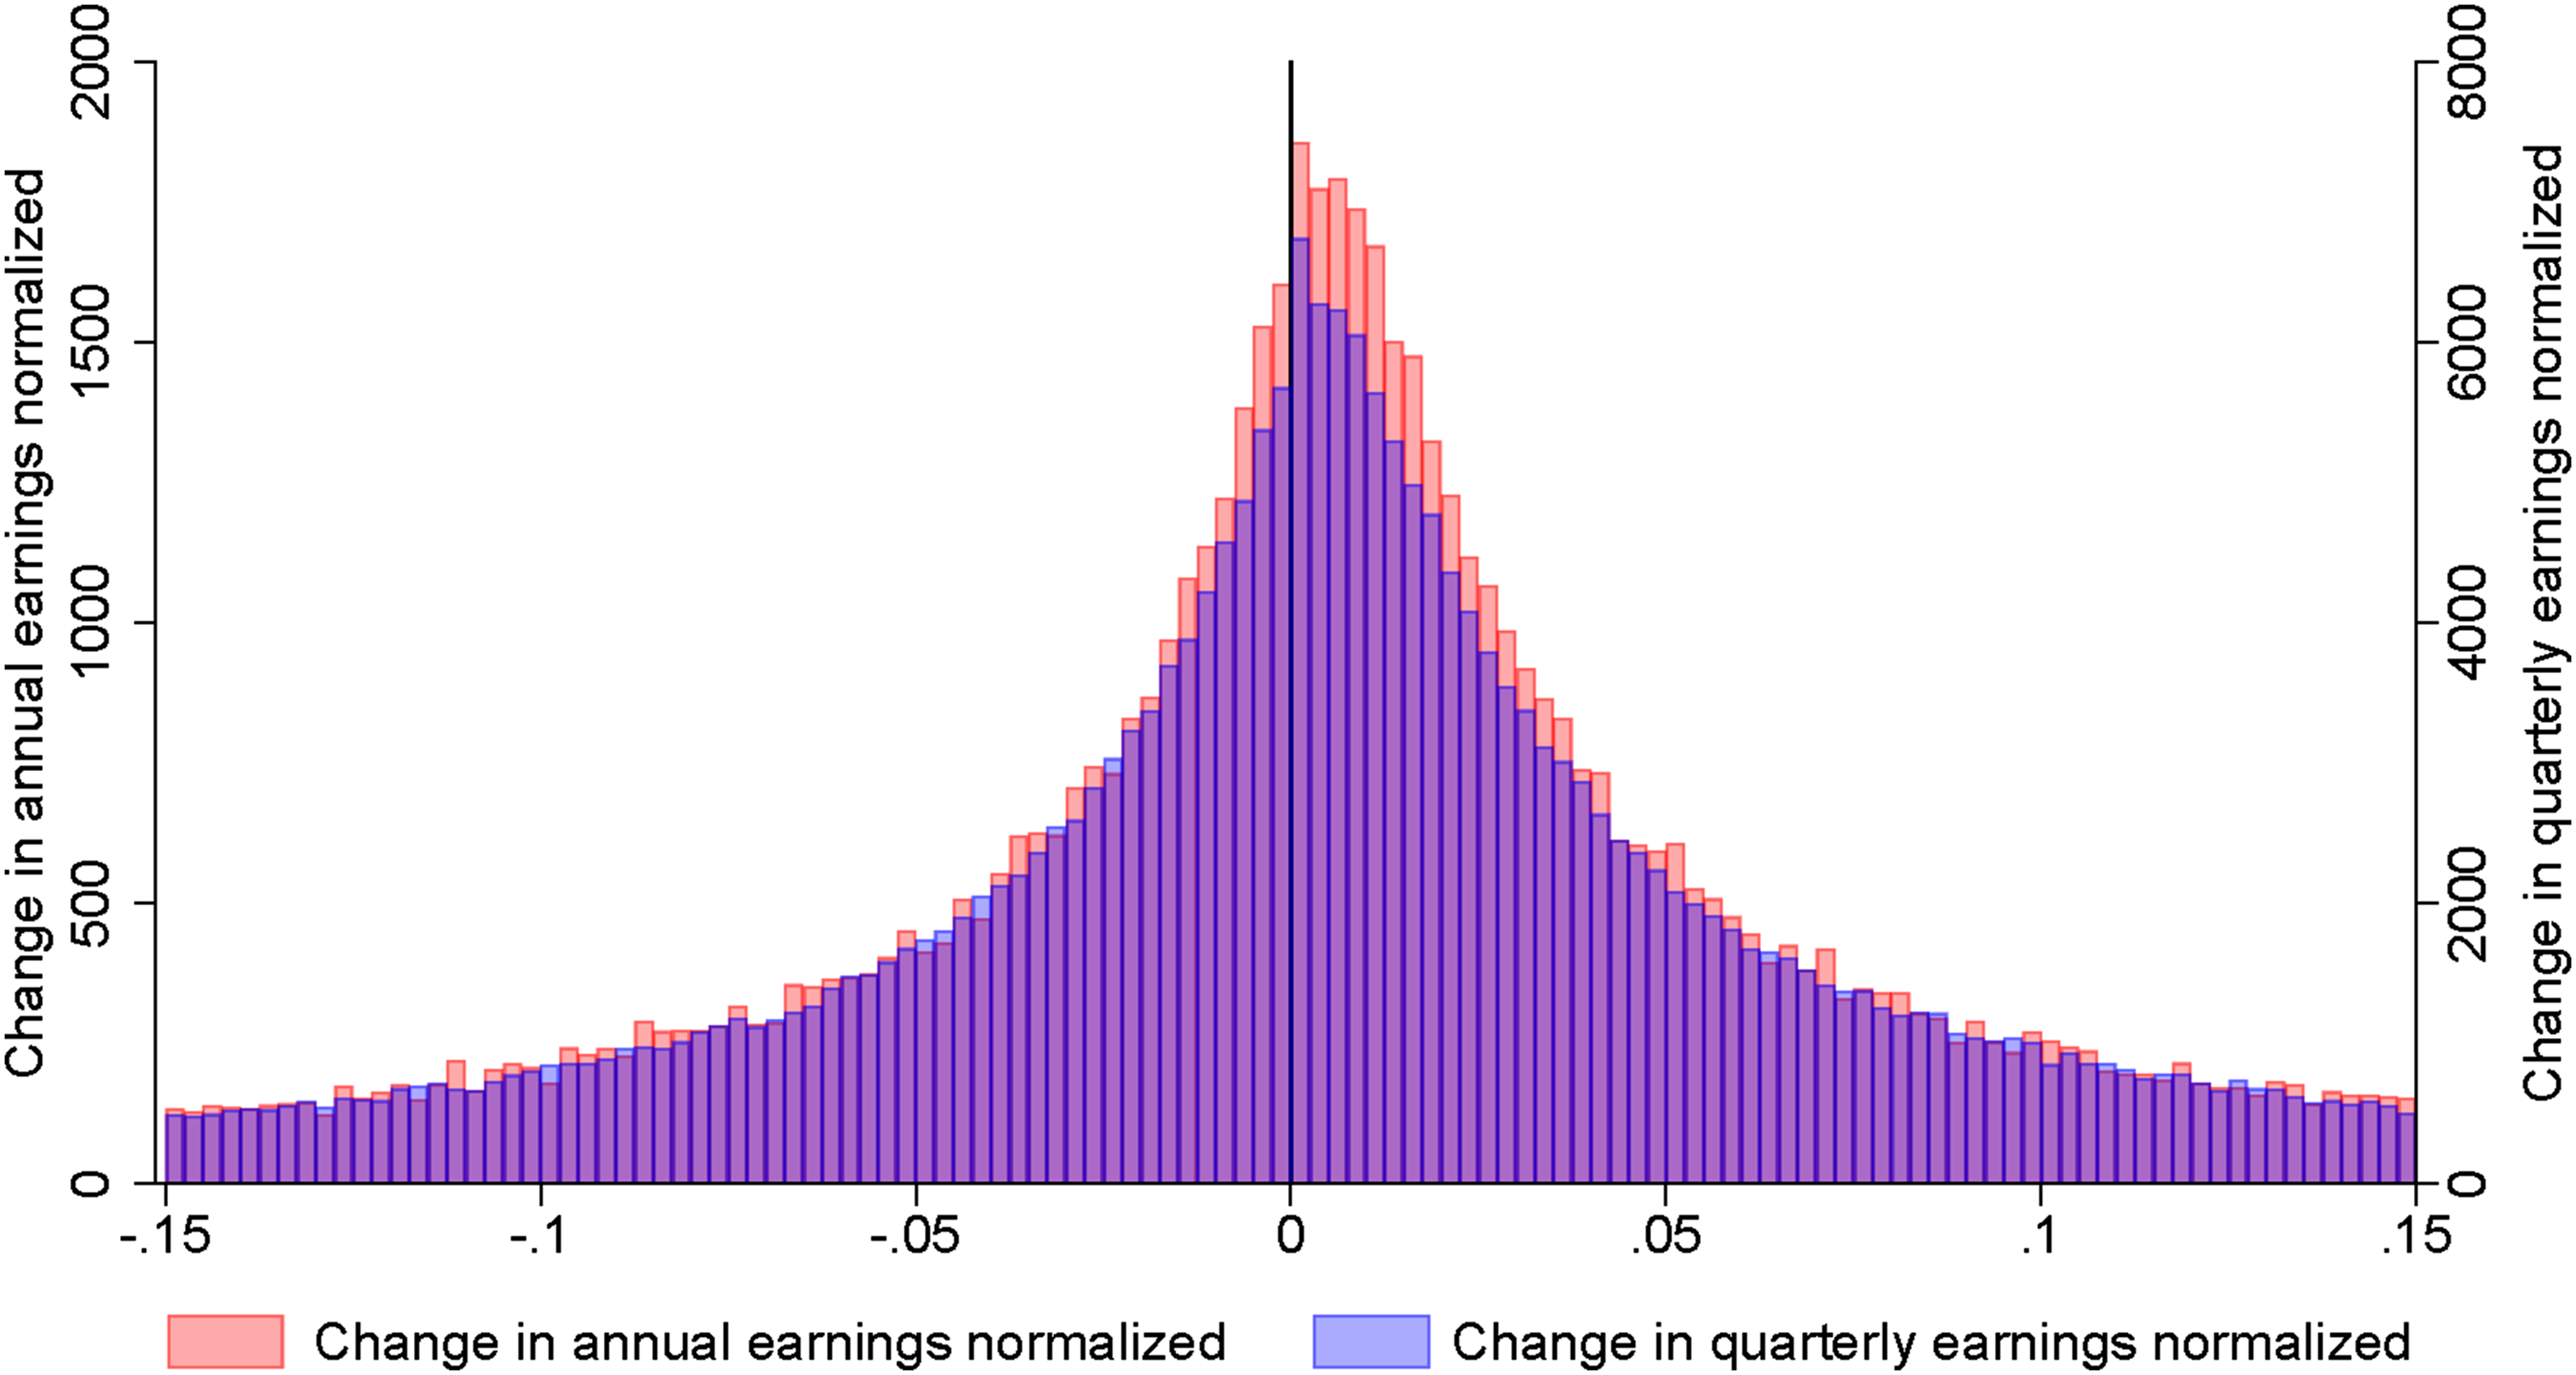
The BD and MT Tests for Changes in Annual and Quarterly Earnings Pre- and Post-SOX.
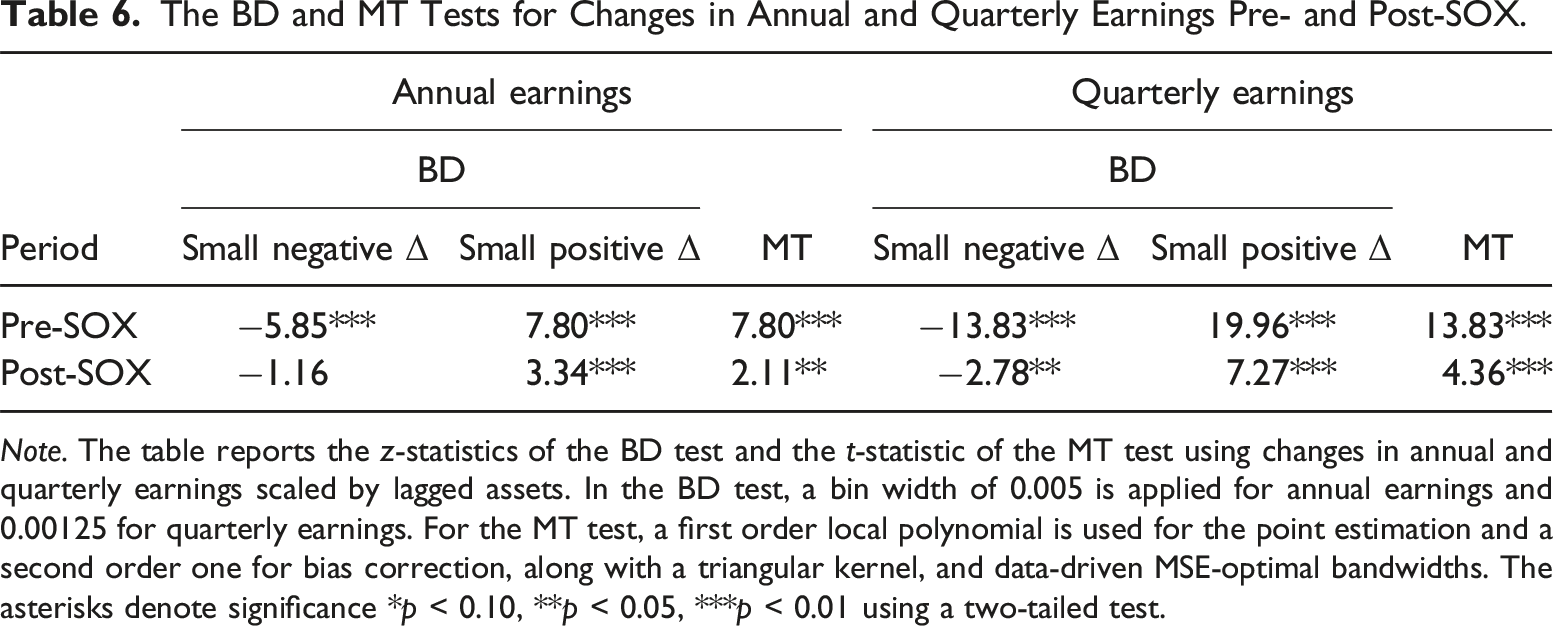
Note. The table reports the z-statistics of the BD test and the t-statistic of the MT test using changes in annual and quarterly earnings scaled by lagged assets. In the BD test, a bin width of 0.005 is applied for annual earnings and 0.00125 for quarterly earnings. For the MT test, a first order local polynomial is used for the point estimation and a second order one for bias correction, along with a triangular kernel, and data-driven MSE-optimal bandwidths. The asterisks denote significance *p < 0.10, **p < 0.05, ***p < 0.01 using a two-tailed test.
For changes in quarterly earnings, the BD z-statistics for the discontinuity around zero in the pre- and post-SOX periods are −13.83 and −2.78 for small negative changes, respectively, and 19.96 and 7.27 for small positive changes, respectively. These findings align with those from the MT test, which yields z-statistics in the pre- and post-SOX periods of 13.83 and 4.36, respectively. This suggests, similarly to our findings using earnings scaled by lagged assets, that the discontinuity for changes in quarterly earnings persists after the adoption of SOX, whereas it generally disappears for changes in annual earnings. The discontinuities for changes in earnings are generally smaller in magnitude compared to those in earnings scaled by lagged assets, which is consistent with prior research (e.g., Burgstahler and Dichev (1997)). This is likely due to changes in earnings generally being smaller and more volatile than earnings in levels.
To obtain additional insights, we lastly examine how the discontinuity around zero changes in earnings evolves over time. We employ the BD and MT tests independently for each year and pool the four quarters together to ensure comparability. Due to the discontinuity being smaller in magnitude compared to annual earnings scaled by lagged assets (Burgstahler & Dichev, 1997), we expect the findings to be weaker although qualitatively similar compared to when we use earnings scaled by lagged assets. We find (untabulated) that the discontinuity for changes in annual earnings generally exists prior to the adoption of SOX, after which it disappears. For changes in quarterly earnings, the discontinuity persists after the adoption for small positive changes. This aligns with our prior findings, suggesting that firms are likely to manage quarterly earnings to meet and beat the previously reported quarterly earnings after the adoption of SOX. Moreover, we find that the discontinuity for changes in quarterly earnings largely disappears around 2013, consistent with our findings using earnings scaled by lagged assets. Altogether, the findings using changes in earnings are consistent with our results using earnings scaled by lagged assets and support our explanation that the discontinuity persists in quarterly earnings likely due to the absence of an auditor in ensuring compliance with SOX.
Analysts’ Earnings Forecast Errors
We next investigate the discontinuity in analysts’ earnings forecast errors. Figure 6 presents the annual and quarterly earnings forecast errors in the post-SOX period. Similarly to earnings and changes in earnings, the number of small negative (positive) forecast errors is lower (higher) than what would be expected under continuity. Hence, the discontinuity around zero appears to persist, similar to the findings for earnings and changes in earnings. Analysts’ annual and quarterly earnings forecasts errors post-SOX. Note: The figure depicts the histograms of analysts’ annual and quarterly earnings forecast errors around zero from 2003 to 2020. Observations in the range of [−0.15; 0.15] are presented and grouped into intervals of size 0.0025 leading to 120 bins. The histogram colored in red displays annual earnings forecast errors, while the histogram colored in blue displays quarterly earnings forecast errors. The left hand side axis represents the frequency of annual earnings forecast errors, whereas the right hand side axis represents the frequency of quarterly earnings forecast errors. Quarterly earnings forecast errors are divided by 4 to ensure comparability.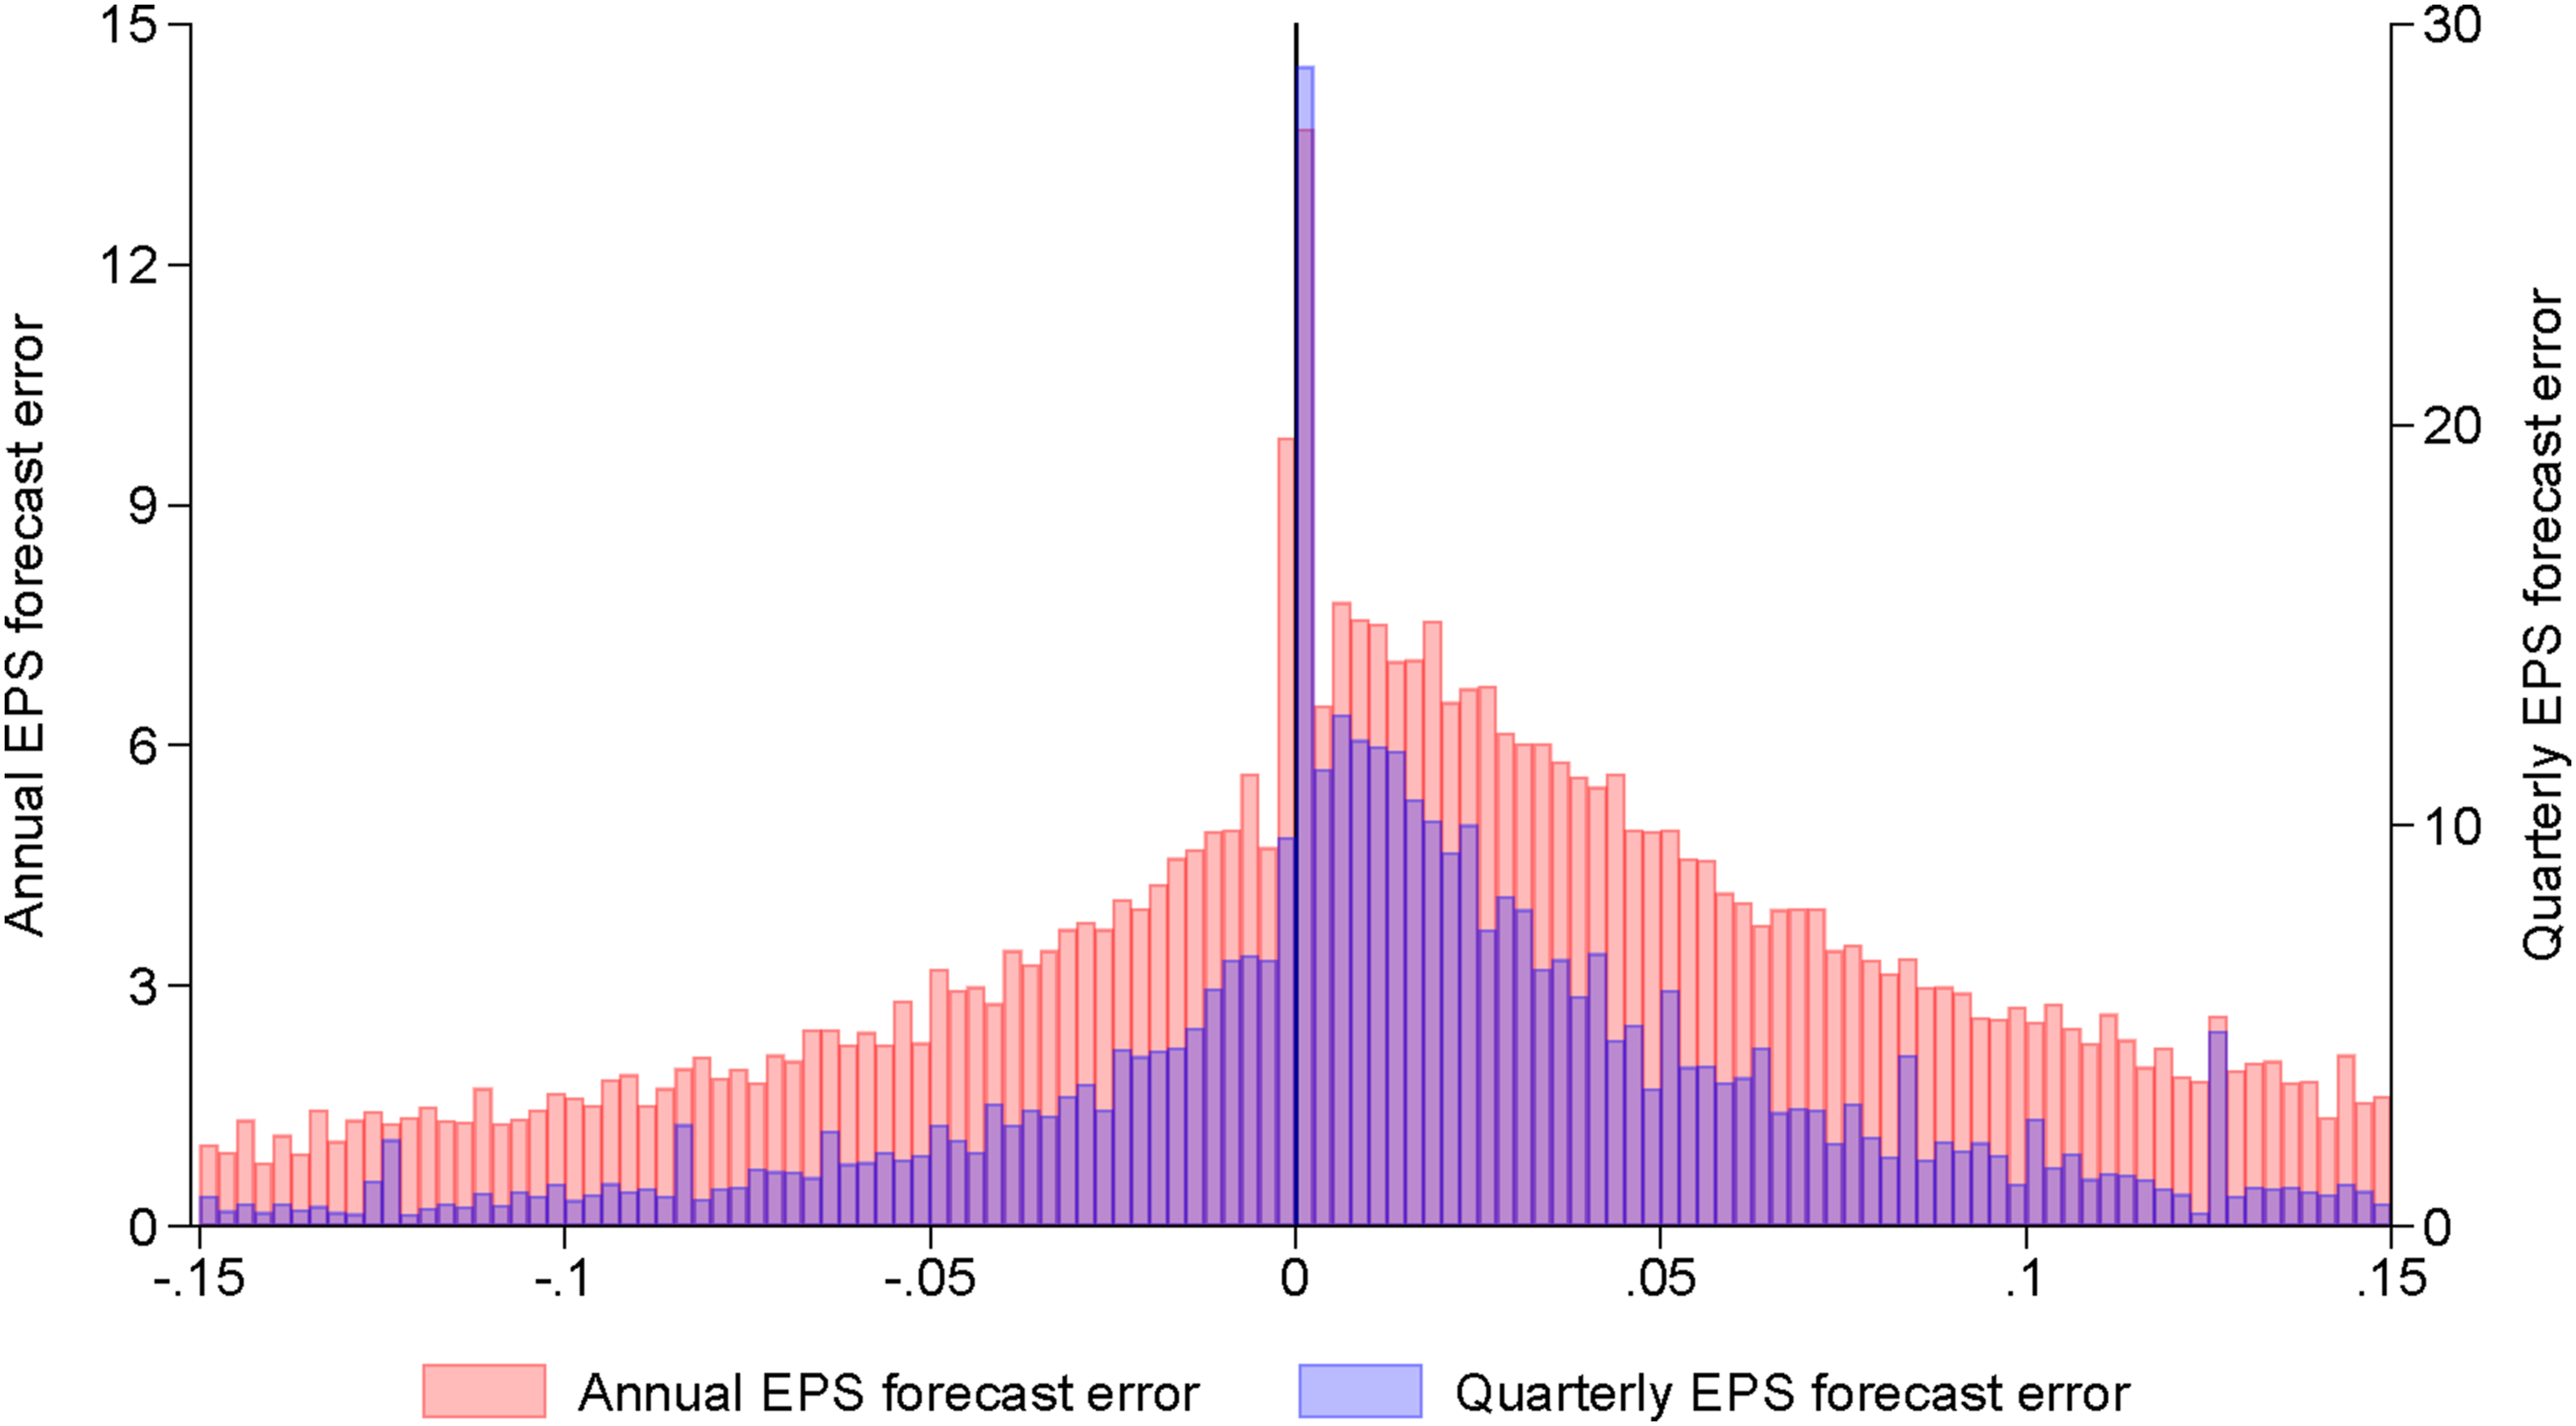
The BD and MT Tests for Analysts’ Annual and Quarterly Earnings Forecast Errors Pre- and Post-SOX.
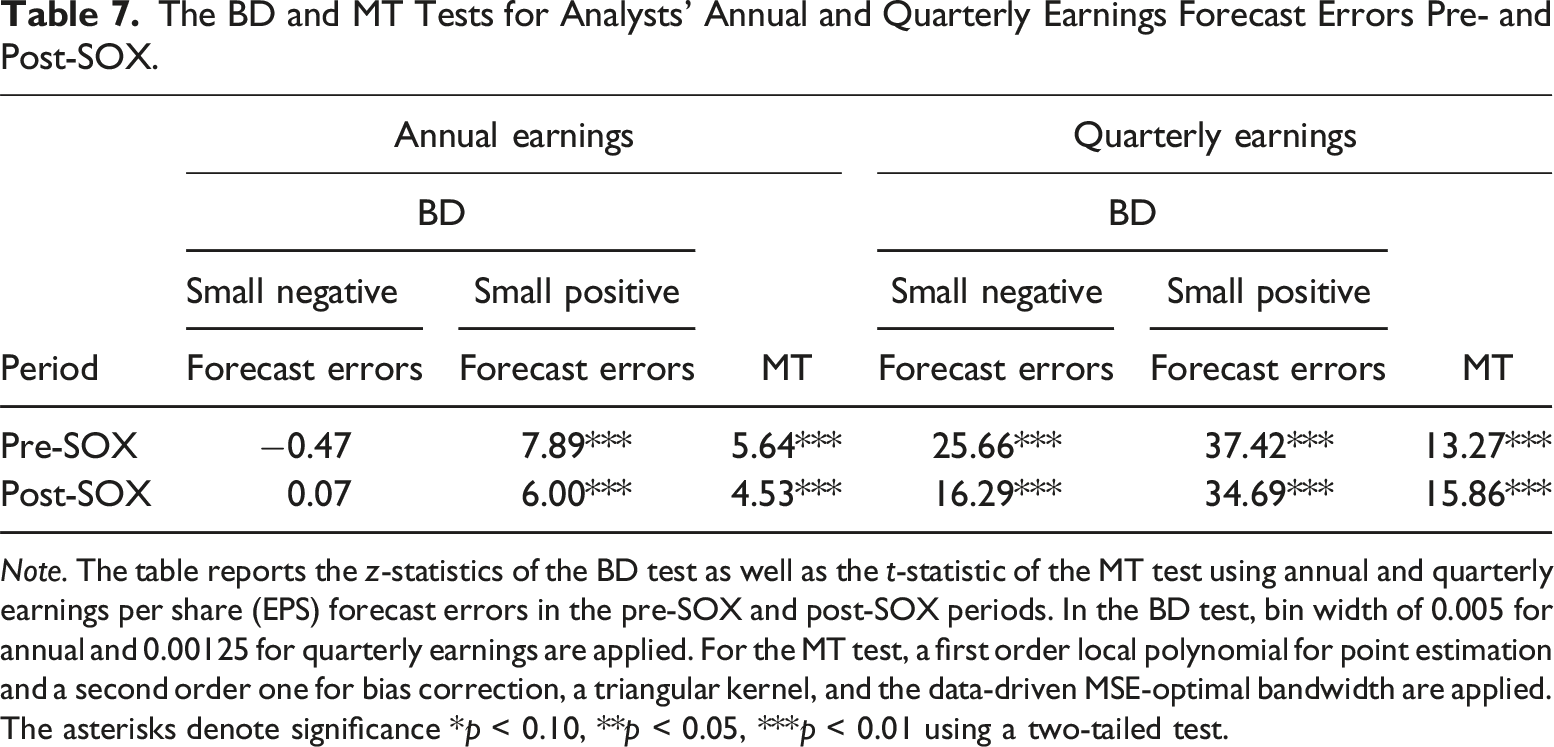
Note. The table reports the z-statistics of the BD test as well as the t-statistic of the MT test using annual and quarterly earnings per share (EPS) forecast errors in the pre-SOX and post-SOX periods. In the BD test, bin width of 0.005 for annual and 0.00125 for quarterly earnings are applied. For the MT test, a first order local polynomial for point estimation and a second order one for bias correction, a triangular kernel, and the data-driven MSE-optimal bandwidth are applied. The asterisks denote significance *p < 0.10, **p < 0.05, ***p < 0.01 using a two-tailed test.
Robustness Tests
Cross-Sectional Tests and Measurement
To address the concerns that our results might be influenced by methodological choices, we conduct a battery of sensitivity tests.
The BD and MT Tests for Annual and Quarterly Earnings for Small and Large Firms Pre- and Post-SOX.
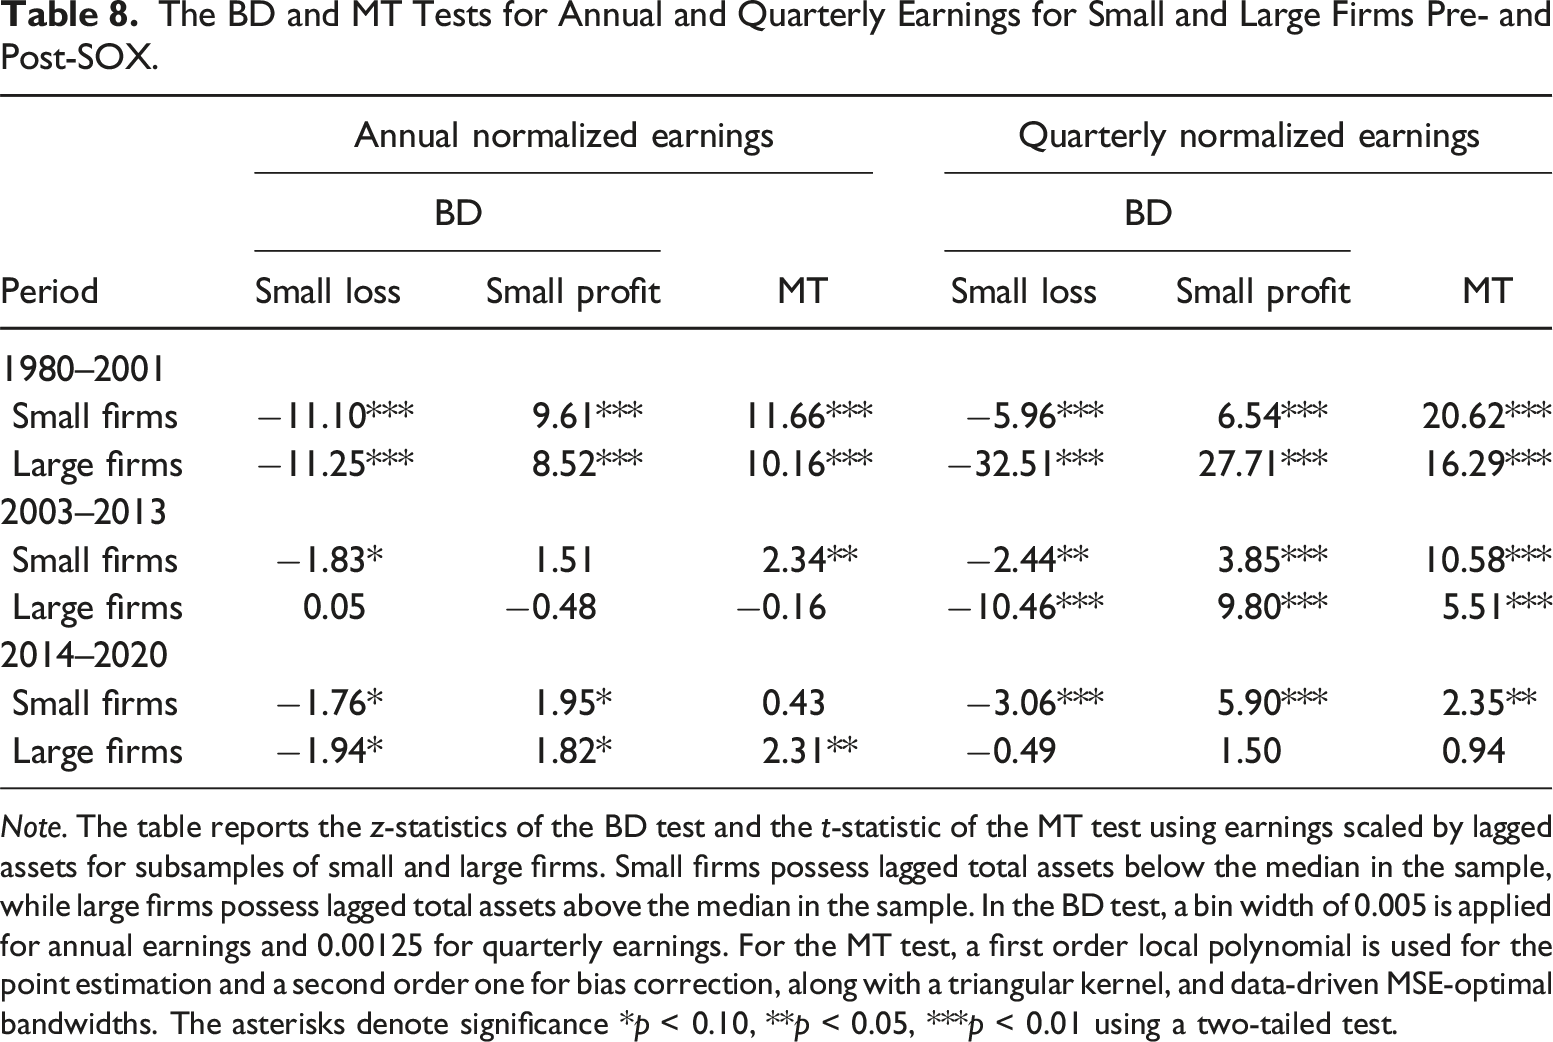
Note. The table reports the z-statistics of the BD test and the t-statistic of the MT test using earnings scaled by lagged assets for subsamples of small and large firms. Small firms possess lagged total assets below the median in the sample, while large firms possess lagged total assets above the median in the sample. In the BD test, a bin width of 0.005 is applied for annual earnings and 0.00125 for quarterly earnings. For the MT test, a first order local polynomial is used for the point estimation and a second order one for bias correction, along with a triangular kernel, and data-driven MSE-optimal bandwidths. The asterisks denote significance *p < 0.10, **p < 0.05, ***p < 0.01 using a two-tailed test.
To further address the concern that firm size influences our findings, we, following the recommendation by Burgstahler and Chuk (2013), investigate the zero-earnings discontinuity in unscaled earnings. We partition firms in the pre- and post-SOX period, respectively, into four quantile subsamples based on their total assets, with firms exhibiting the smallest (largest) total assets into the first (fourth) subsample. We restrict the sample to firm-year observations between 1991 and 2013 to eliminate the effects of the disappearance of the zero-earnings discontinuity after 2013 and to ensure the number of fiscal years pre- and post-SOX is identical following the literature (e.g., Gilliam et al. (2015)). Consistent with their recommendation, we adopt progressively larger interval widths for firms in larger subsamples. Following Gilliam et al. (2015), we adopt an earnings interval width of $80,000 ($120,000), $350,000 ($650,000), and $2,000,000 ($3,000,000) for annual unscaled earnings and one fourth of that for quarterly earnings in the pre- (post-)SOX period. We find (untabulated), consistent with the prior findings, that the zero-earnings discontinuity disappears in annual earnings after the adoption of SOX, whereas it persists in quarterly earnings throughout all subsamples.
The BD and MT Tests for Annual and Quarterly Earnings Scaled by Lagged Market Capitalization Pre- and Post-SOX.
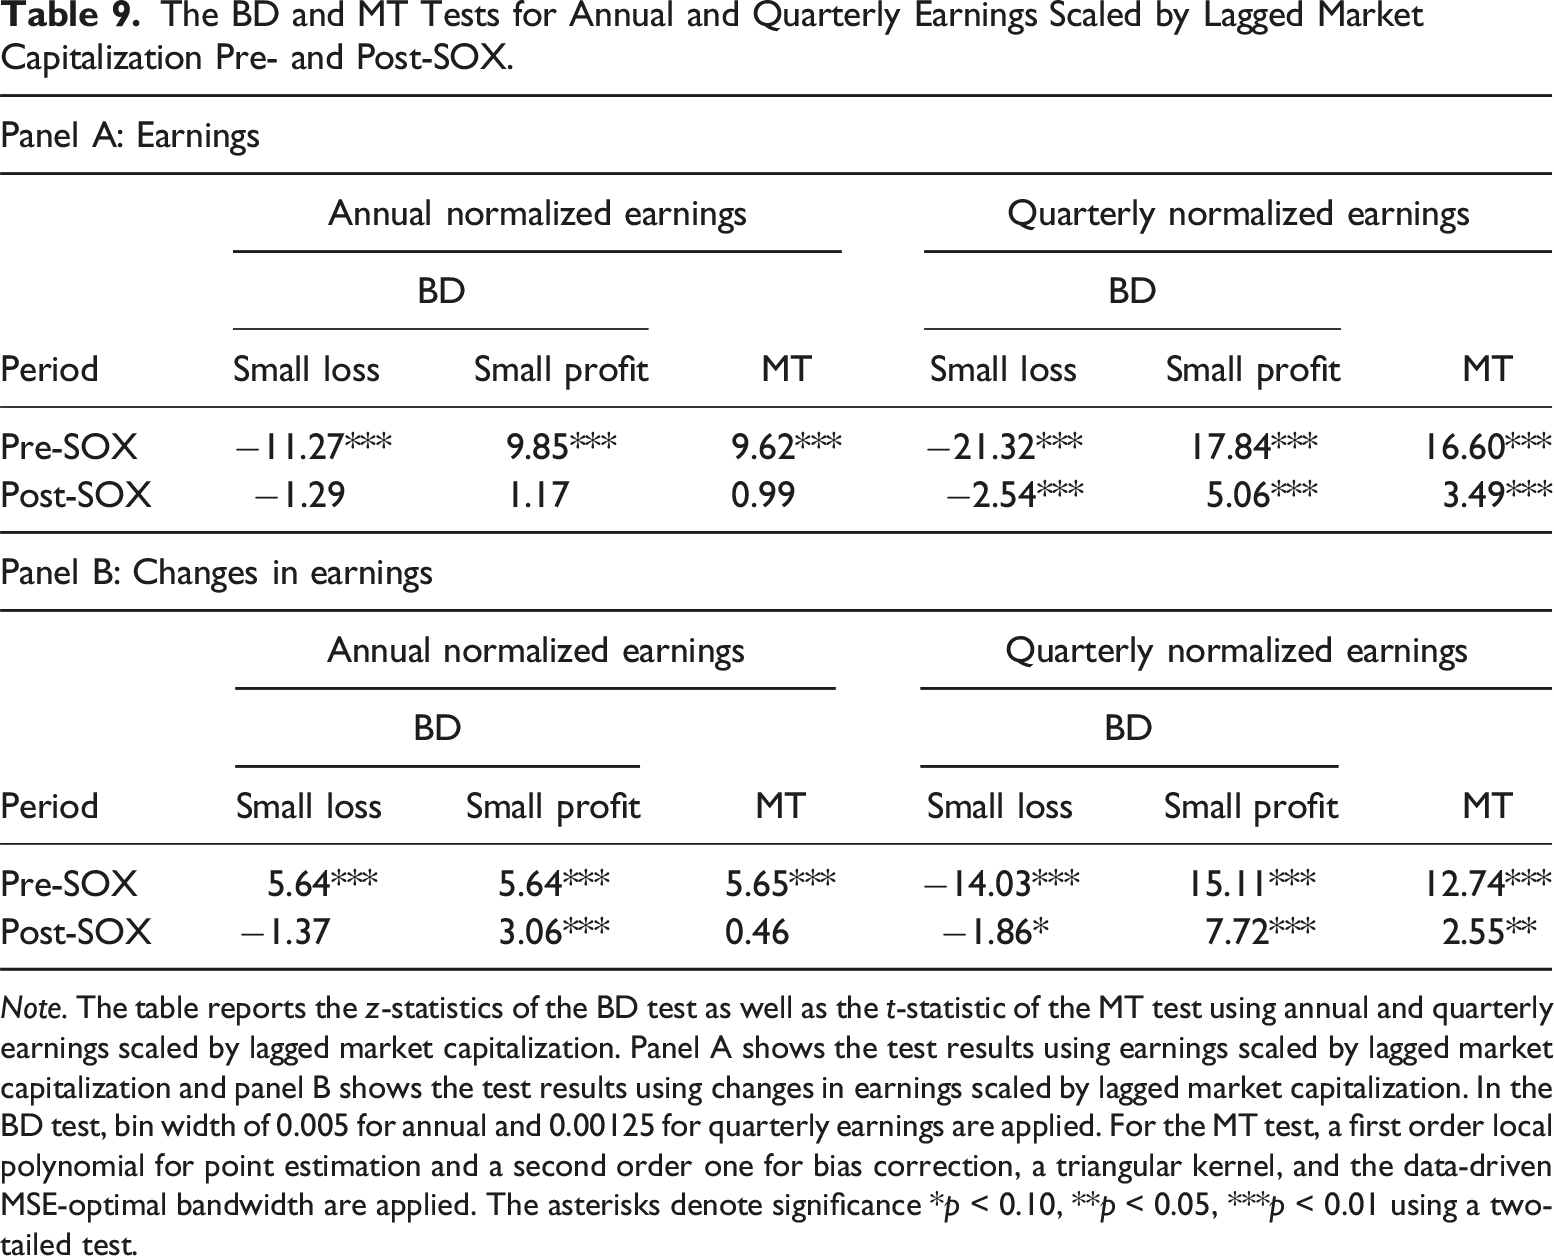
Note. The table reports the z-statistics of the BD test as well as the t-statistic of the MT test using annual and quarterly earnings scaled by lagged market capitalization. Panel A shows the test results using earnings scaled by lagged market capitalization and panel B shows the test results using changes in earnings scaled by lagged market capitalization. In the BD test, bin width of 0.005 for annual and 0.00125 for quarterly earnings are applied. For the MT test, a first order local polynomial for point estimation and a second order one for bias correction, a triangular kernel, and the data-driven MSE-optimal bandwidth are applied. The asterisks denote significance *p < 0.10, **p < 0.05, ***p < 0.01 using a two-tailed test.
Relative Magnitude of the Discontinuity for Annual Compared to Quarterly Earnings Scaled by Lagged Market Capitalization.
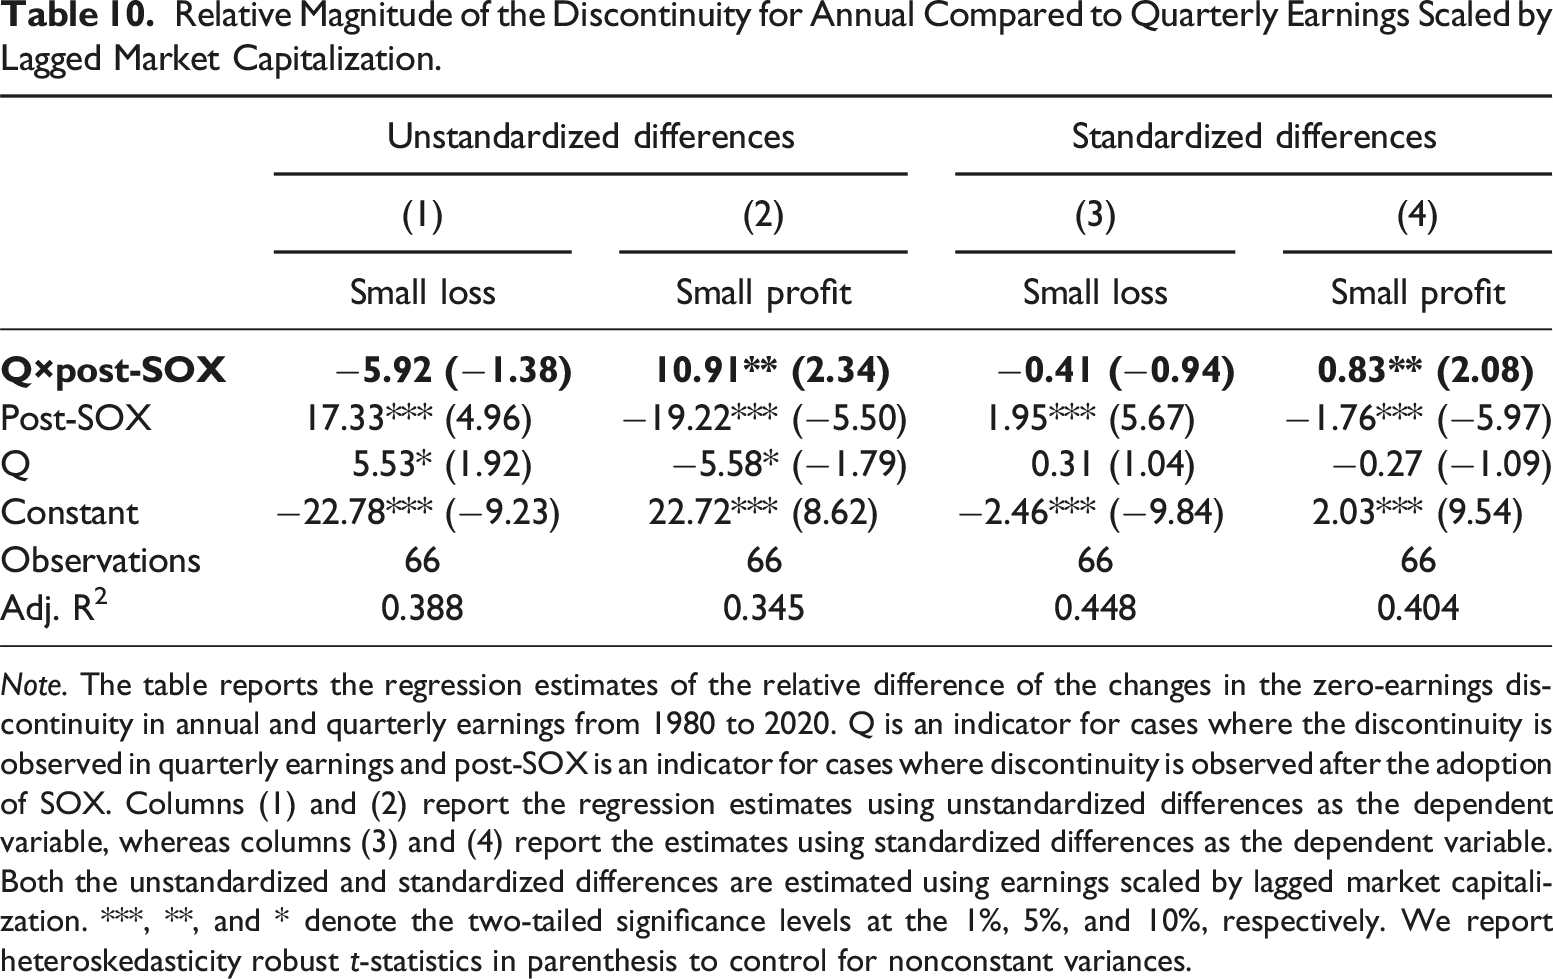
Note. The table reports the regression estimates of the relative difference of the changes in the zero-earnings discontinuity in annual and quarterly earnings from 1980 to 2020. Q is an indicator for cases where the discontinuity is observed in quarterly earnings and post-SOX is an indicator for cases where discontinuity is observed after the adoption of SOX. Columns (1) and (2) report the regression estimates using unstandardized differences as the dependent variable, whereas columns (3) and (4) report the estimates using standardized differences as the dependent variable. Both the unstandardized and standardized differences are estimated using earnings scaled by lagged market capitalization. ***, **, and * denote the two-tailed significance levels at the 1%, 5%, and 10%, respectively. We report heteroskedasticity robust t-statistics in parenthesis to control for nonconstant variances.
Sample Selection
Changes in sample composition over time are speculated to contribute to the zero-earnings discontinuity (e.g., Durtschi and Easton (2005) and Durtschi and Easton (2009)). To address this concern, we follow prior studies (e.g., Gilliam et al. (2015)) and rerun the analyses on a subsample of firms that file annual and quarterly financial statements in all five years surrounding the adoption of SOX, namely, from 2000 to 2001 and from 2003 to 2004. This ensures that our sample of firms remains stable throughout the adoption of SOX. Our findings remain unaffected with little to no impact on the estimates.
Next, we test whether sample selection and the exclusion of 2002 simultaneously drive our findings. To address this, we follow prior studies (e.g., Gilliam et al. (2015)) and rerun our tests on a subsample of firms in the period from 1997 to 1998 and from 2000 to 2001, respectively. We restrict our sample to firms that file financial statements in all years sequentially to ensure the sample remains stable. Moreover, we also rerun the analysis on a subsample of firms in the period from 2003 to 2004 and from 2006 to 2007, respectively, under the same conditions. The zero-earnings discontinuity exists in both annual and quarterly earnings in both subsamples prior to the adoption of SOX. Consistent with our findings, the discontinuity only persists for the subsample of quarterly earnings following the adoption.
Model Specification
The zero-earnings discontinuity is speculated to be driven by tax and special items (e.g., Beaver et al. (2007)). To address this concern, we follow Gilliam et al. (2015) and rerun our tests using earnings before taxes and earnings before tax-adjusted special items, 14 respectively, both scaled by lagged assets. Tax-adjusted special items are measured by multiplying the firms’ special items by their respective effective tax rate, which is calculated as their income tax divided by their earnings before taxes. The findings remain largely robust, although the variable of interest becomes insignificant in our difference-in-difference design when adopting earnings before tax-adjusted special items. As such, tax items appear to have only a weak impact on our findings.
Next, we perform a series of robustness checks on the BD test. The BD test is likely sensitive to the subjective choice of bin size. Previous studies (e.g., Burgstahler and Dichev (1997) and Gilliam et al. (2015)) commonly use a bin size of 0.005 for annual earnings. To test the robustness of our results toward bin size, we rerun our tests using bin sizes of 0.003, 0.004, 0.006, and 0.007 for annual earnings, and one-fourth of that for quarterly earnings, respectively. The test statistics (untabulated) remain largely unaffected, although larger bin sizes lead to larger test statistics. Furthermore, we adopt a variance correction (Beaver et al., 2007) when estimating the BD test to ensure valid inference. As a comparison, we rerun our tests without this correction. We find that the test statistics remain stable, though slightly inflated in the absence of the correction, with the largest inflation occurring for the largest test statistics.
Next, we perform a set of robustness checks on the MT test. One of its key advantages is the automatic adoption of MSE-optimal bandwidths. In general, larger bandwidths tend to increase statistical power, but also induce bias. As such, our findings may be sensitive to the choice of bandwidth. To address this concern, we rerun the test using bandwidths that are slightly smaller and slightly larger than the MSE-optimal bandwidths. It is challenging to determine ex ante how the choice of bandwidth affects the results, as it directly affects the point estimate of the discontinuity and not only the standard error. We find that the test statistics are insensitive to the choice of bandwidth, although we observe the largest changes when replicating Table 2. The MT test adopts a robust bias correction to control for the bias involved in estimating MSE-optimal bandwidth. To assess the impact of the bias correction, we rerun our tests without it. Excluding the bias correction is likely to inflate test statistics, and, thus cause an overrejection of the null hypothesis. Consistently herewith, our findings remain unaffected although our test statistics (untabulated) are substantially larger than when excluding the bias correction.
The MT test requires a local polynomial order for both the point estimate and the bias correction. While we follow the convention and adopt a first order polynomial for the point estimate and a second order polynomial for the bias correction to limit the risk of overfitting (Cattaneo et al., 2019a), our results might remain sensitive to our choices. Our findings (untabulated) remain robust toward higher order robust bias corrected local polynomials, although the discontinuity becomes insignificant in some of the individual years at the beginning of the post-SOX. As our last sensitivity check for the MT test, we examine the robustness of the variance estimator. Since the jackknife and plugin variance estimators are commonly used, we rerun our results using both, individually, and find virtually no changes in our results.
Prior studies commonly exclude earnings observations of exact zero due to suspected misreporting (e.g., Burgstahler and Dichev (1997)). While zero earnings may be a salient reporting goal (de la Rosa & Lambertsen, 2022) and more likely for firms whose earnings are managed, we rerun our tests excluding observations of net income of exactly zero. Our results (untabulated) are highly insensitive to the exclusion, suggesting that exact zero earnings observations are unlikely to drive our findings.
Altogether, the tests suggest that our findings are highly robust to measurement choices, sample selection behavior, and model specifications.
Conclusion
We investigate the impact of the Sarbanes-Oxley Act in 2002 on the zero-earnings discontinuity in annual and quarterly earnings. Prior literature finds that the zero-earnings discontinuity in annual earnings disappears following the adoption. We hypothesize that the disappearance may not generalize to quarterly earnings, as quarterly financial statements are unaudited, and hence, lack an auditor to verify whether the firms comply with SOX.
Consistent with this, we find that the zero-earnings discontinuity in quarterly earnings persists after the adoption of the Act. The persistence is driven by SOX coinciding with a reduction in the zero-earnings discontinuity that is smaller in magnitude for quarterly earnings compared to that for annual earnings. This fits with our explanation that SOX is less able to restrict earnings management in quarterly earnings compared to annual earnings. The findings are robust to a battery of tests including commonly raised concerns in the literature as to whether the discontinuity is artificially driven.
Our findings are consistent with the explanation that the adoption of SOX is less able to restrict earnings management in quarterly financial statements compared to annual financial statements due to the absence of an auditor to ensure compliance. However, we do not claim causal inference and caution the readers to attribute our findings solely to SOX, as many factors are likely to impact the discontinuity around the adoption of SOX (Gilliam et al., 2015).
Footnotes
Acknowledgements
We thank Rong Huang and two anonymous reviewers whose valuable feedback has benefited the paper greatly, and seminar participants at Aarhus University for helpful suggestions and constructive comments. All errors are our own.
Declaration of conflicting interests
The author(s) declared no potential conflicts of interest with respect to the research, authorship, and/or publication of this article.
Funding
The author(s) received no financial support for the research, authorship, and/or publication of this article.