
Abstract
We examine the relation between director excess compensation and corporate investment efficiency, and the role of accounting quality in this association. We utilize a cost-minimization stochastic frontier approach to estimate director excess compensation. On average, over the 2007–2018 period, directors are paid approximately $59,455 more than their efficient compensation level. We find that overpaying directors aggravates agency problems and exacerbates overinvestment. Next, using an accounting quality index based on five accounting quality proxies pertaining to earnings management, value relevance, and asymmetric timely loss recognition, we document that accounting quality moderates the detrimental impact of director excess compensation on corporate investment. Our study adds to the literature on the negative effects of director excess compensation and the positive economic role of accounting.
Keywords
Director compensation has now soared to a level that inevitably makes pay a subconscious factor affecting the behavior of many non-wealthy members. Warren Buffett, chairman and CEO of Berkshire Hathaway, quoted in his annual letter to shareholders, 2020.
Introduction
We investigate the association between director excess compensation and investment efficiency, and the implications of accounting quality for this relation. In a contracting setting, the board of directors resides at the apex of the corporate structure and is legally regarded as the highest authoritative body relating to firm functionality and decision-making. The board is expected to actively monitor and advise firm executives, and thereby restrict moral hazard and mitigate the conflict between ownership and control (Adams et al., 2010; Armstrong et al., 2010). However, although directors are elected to safeguard shareholders’ well-being, their interests may be more aligned with those of firm executives. This notion is especially true when the CEO has substantial influence over the nomination and appointment of board members (Coles et al., 2014; Hermalin & Weisbach, 1998; Shivdasani & Yermack, 1999). Management also may have considerable authority over the determination of director pay (Bebchuk et al., 2010), which is likely to constrain board members from opposing and monitoring opportunistic managerial decisions. The additional layer of friction between the interests of directors and market participants exacerbates agency problems, thus adversely influencing organizational operations and further undermining owners’ welfare. In this sense, prior literature emphasizes the detrimental effect of excessive director pay on the soundness of corporate governance and performance. The extant literature suggests that excessive director pay highlights a board environment predicated on “cronyism,” that is, a mutual back-scratching association between board members and the firm’s CEO (Bebchuk et al., 2010; Brick et al., 2006; Dah & Frye, 2017).
Given the documented influence of the functionality and attributes of corporate boards on the efficacy of internal governance (Coles et al., 2014; Armstrong et al., 2010) and the formulation of investment strategy (Edmans et al., 2022; Gillan, 2006; Kim et al., 2014; Kor, 2006), we investigate the association between director excess pay and investment efficiency. Excessively compensated directors are less likely to confront management and may be more consumed with the extraction of private benefits at the expense of the firm’s well-being. The presence of a cronyistic board culture may hamper board functionality and oversight, thus exacerbating agency problems. Director excess pay, as a sign of the alignment of private benefits between directors and management, may weaken the corporate governance mechanism due to the failure or unwillingness of directors to devote necessary efforts towards their advising and monitoring responsibilities. As self-serving directors may be less concerned about a firm’s well-being and more tempted to free-ride, poor counseling and engagement on the part of the board may imply ill-advised investment decisions. Although management is better informed with regards to firm-specific operations as compared to outside directors, the added value from experienced board advising and consulting is not to be discounted. 1 Moreover, impaired board monitoring may pave the way for opportunistic management teams to engage in self-centered investment decisions in pursuance of maximizing personal gains. That is, entrenched boards may induce opportunistic managers to take on value-destroying projects and divert firm resources towards inefficient investment allocations (Jensen, 1986; Morck et al., 1990). For all the above reasons, we expect director excess compensation to hinder the efficiency of firms’ investment allocations and decisions.
Also, in the corporate setting, Jensen (1986) and Myers and Majluf (1984) suggest that the financial information environment could significantly impact investment decisions. More recently, several studies suggest that financial reporting quality is positively associated with a firm’s investment efficiency (Biddle et al., 2009; Biddle & Hilary, 2006; Roychowdhury et al., 2019). An improvement in accounting quality mitigates adverse selection and moral hazard frictions ensuing from information asymmetry between firm management and market participants (Lambert, 2001). High accounting quality is manifested in more transparent, timely, and value-relevant financial reporting, which makes managerial decisions more visible to market participants (Leuz & Wysocki, 2016). Although corporate executives and board members are responsible for shaping the corporate information environment, external stakeholders also exhibit informational demands that significantly influence accounting quality (Beyer et al., 2010). That is, accounting quality is partly determined by factors that are exogenous to the firm. Prior studies document that equity and debt investors impose significant pressure by demanding higher quality accounting information (Christensen et al., 2016; Goh et al., 2017). In this sense, accounting quality serves as a monitoring tool that improves compensation and debt contracting efficiency (Gox & Wagenhofer, 2009). Catering to the informational demands of investors induces a sound corporate governance structure and mitigates agency conflicts relating to investment policy (Garcia Lara et al., 2016), which fortifies the firm’s accounting environment against possible opportunistic behavior. Accordingly, our research investigates the implications of a firm’s accounting quality for the association between director excess compensation and investment efficiency. We expect accounting quality to mitigate the negative impact of board members’ excess compensation on investment decisions.
Unlike prior research that estimates excess compensation as the difference between actual and expected compensation (Brick et al., 2006; Dah & Frye, 2017), we employ a cost-minimization stochastic frontier approach (SFA) to estimate excess compensation as the deviation of actual compensation from the efficient compensation frontier. 2 Traditional excess compensation measurement is prone to embedded bias arising from estimation error since the error term may not only capture excess compensation but also statistical noise. An important advantage of SFA is that it distinguishes between excess compensation and random noise in the error term. 3 We proxy for accounting quality using an index (AQ index hereafter) that is composed of five measures of accounting attributes capturing earnings management, value relevance, and asymmetric timely loss recognition (e.g., Barth et al., 2008). We compute all the proxy measures cross-sectionally to boost the explanatory power of the models employed, restrict the influence of extreme values arising from small estimation samples, and mitigate concerns arising from survivorship bias induced by time-series estimations (Jones et al., 2008; Kothari, 2001).
Using a sample of S&P 1500 firms, we start by investigating the efficiency of director total compensation. Our SFA results show that directors are paid an average of $59,455 in excess of their efficient compensation level over the 2007–2018 period. Consistent with our expectations, we find that excess compensation is significantly associated with increased investment levels among overinvesting firms. 4 We generally do not observe a significant association between director excess compensation and firm investment among underinvesting firms. Moreover, Biddle et al. (2009) demonstrate that financial reporting quality positively impacts investment efficiency. We first confirm the main findings of Biddle et al. (2009) using our AQ index and then show that accounting quality weakens the association between director excess compensation and the likelihood of overinvestment. Our findings hold for the AQ index as well as for each of its five components.
In additional analysis, we find that director excess compensation significantly hampers investment efficiency for firms in the bottom three quintiles of accounting quality, but not for firms in the top two quintiles. In other words, the unfavorable impact of excess compensation on overinvestment is most pronounced when accounting quality is at its lowest and diminishes with the rise of accounting quality. We subject our results to additional analyses to examine the components of director compensation, control for potential endogeneity concerns, and employ alternative measures of director excess compensation and investment inefficiency.
We contribute to the literature by showing that director excess compensation carries adverse implications that extend beyond merely CEO compensation and job security (Bebchuk et al., 2010; Brick et al., 2006; Chen et al., 2019; Dah & Frye, 2017). Our findings present an original take on the significance of director compensation in shaping the firm’s strategic decisions. We shed light on the complex boardroom dynamics in which overpaid directors compromise their board duties and act as self-serving agents, thereby supporting opportunistic investment allocations.
Our study further adds to the literature on the relation between accounting quality and investment efficiency. We highlight the positive role of sound accounting practices in constraining the opportunistic behavior of entrenched directors and managers, thereby reducing agency problems and advancing investment efficiency. In addition to the existing evidence on the direct implications of accounting quality for investment efficiency (e.g., Biddle et al., 2009), our findings highlight the favorable moderating influence of the accounting environment in addressing corporate governance challenges and compensating for the shortage in board oversight.
We also make methodological contributions in the areas of director compensation and accounting quality. We utilize a novel estimation method to distinguish between director overcompensation and random noise. Our findings highlight the significance of SFA over the conventional residual-based estimation method. Around 51% of the variation in the composite error term is attributable to director excess pay, with the remainder arising from random noise. In addition, we comprehensively assess the quality of the corporate financial information environment by developing a composite accounting index that captures major financial reporting attributes.
Our findings have significant ramifications for boards in setting director pay, shareholders in ensuring heightened director independence and accountability, and regulators in constraining managerial opportunism and enhancing transparency. We highlight the importance of corporate monitoring mechanisms in restraining board members’ self-serving activities and emphasize the significance of carefully designing director incentives to better align their interests with those of shareholders. Accordingly, we call for stronger governance mechanisms to limit managerial influence over directors’ monetary and non-monetary benefits, fostering stronger stewardship in board functionality. In addition, our study stresses the importance of the corporate information environment in mitigating agency problems and enhancing investment efficiency through the governance channel.
The remainder of the paper is structured as follows. Section 2 reviews the literature and develops our hypotheses. Section 3 describes the methodology and sample selection. Section 4 presents the main results. Section 5 discusses additional analyses. Section 6 concludes.
Motivation and Hypothesis Development
Director Compensation and Corporate Investment
Biddle and Hilary (2006) define efficient investing as a firm’s ability to invest in all positive-NPV projects. Thus, investing in negative-NPV projects (i.e., overinvestment) or failing to invest in positive-NPV projects (i.e., underinvestment) are both deemed inefficient decisions. Agency theory proposes that the extraction of private benefits may induce managers to allocate capital towards negative net present value (NPV) investments (Jensen & Meckling, 1976). Although it is theoretically permissible for firms to funnel excess cash to owners via dividends or stock buybacks, opportunistic CEOs may favor investments that allow them to extract rent. Specifically, they may overinvest in diversifying acquisitions (Morck et al., 1990) and empire-building projects (Jensen, 1986), as well as subsidize failing business lines (Berger & Hann, 2003), consume expensive perks (Jensen & Meckling, 1976), or receive opportunistically timed stock options and stock buybacks (Bebchuk et al., 2010; Edmans et al., 2022). In that sense, boards serve a pivotal role in monitoring investment allocations, ensuring that they align with shareholders’ long-term value creation objectives rather than serving as a means for managerial rent extraction. However, although directors are elected by shareholders to protect their stakes, CEOs play a significant role in appointing directors (Bebchuk & Fried, 2003; Hermalin & Weisbach, 1998) and setting director compensation (Adams et al., 2010; Bebchuk et al., 2010). Directors thus risk losing a lucrative salary, as well as a prestigious position, if they opt to confront CEOs and challenge their decisions. As a result, directors may act as self-serving agents, which compromises governance mechanisms and leads to inefficient investment allocations (Chen et al., 2019).
The extant literature on director excess compensation suggests that high levels of director compensation reflect board entrenchment and inefficient board oversight, characterized by opportunistic socialization and mutual back-scratching between managers and directors (Bebchuk et al., 2010; Brick et al., 2006; Chen et al., 2019; Dah & Frye, 2017). Although directors are expected to protect shareholders’ interests by scrutinizing managerial actions, excess compensation reflects unfavorable monetary and social ties to firm management, compromising directors’ ability to challenge managerial decisions. Consequently, director excess compensation serves as an indication of reduced board independence, enabling managers to pursue unchecked opportunistic endeavors. Brick et al. (2006) show a positive association between the excess compensation of the CEO and the directors. The authors provide evidence that excessively compensating managers and directors has an adverse effect on firm performance. Dah and Frye (2017) propose that overcompensating directors signals a poorly functioning and entrenched board culture that does not allow constructive criticism. They show that overpaying directors is directly related to managerial job security and compensation. Likewise, Chen et al. (2019) find that excessive director compensation is negatively related to CEO turnover-performance sensitivity. Lastly, Hope et al. (2019) suggest that overpaying directors results in deficient board oversight. Overpaying board members may highlight mutual back-scratching and collusion with entrenched firm management, prioritizing their private benefits over those of shareholders. Accordingly, opportunistic investment decisions are expected to be more pronounced when directors receive excessive pay.
Although director excess compensation may lead to both overinvestment and underinvestment, we propose that its effect is more prominent for overinvestment. Overinvestment is driven by entrenched managers who take advantage of inefficient and collaborating directors to pursue opportunistic investments, including negative-NPV projects. Underinvestment, however, often results from managerial risk-aversion. Self-centered managers might bypass risky but value-adding projects to preserve job security and reputation. Overpaid board members may be more inclined to pave the way for opportunistic CEOs to misallocate resources toward exploitative business ventures rather than constrain investments in positive-NPV projects. Underinvestment decisions are generally affiliated with CEO risk-aversion and outside restrictions, which may not necessitate extensive director monitoring and consent as opposed to exploitative and resource-intensive overinvestment. In other words, (ineffective) board monitoring is expected to be more inherently related to visible managerial actions of overinvestment, such as empire building and unnecessary acquisitions, than to the non-visible inaction of foregoing valuable projects. Moreover, since inefficient internal monitoring is measured through director excess compensation—typically linked to director opportunism and mutual back-scratching with managers (e.g., Brick et al., 2006)—it is expected to reflect a collusive environment rather than a lack of effort. Thus, director excess compensation is more likely associated with CEO exploitative behavior and rent extraction, rather than an inability or unwillingness to prevent risk-averse CEOs from underinvesting. We therefore hypothesize the following:
(H1): Ineffective board monitoring exacerbates overinvestment.
The Role of Accounting Quality
A growing body of research highlights the positive influence of accounting quality on the soundness of corporate governance structures (Armstrong et al., 2010). In a contracting setting, agency conflicts exacerbate when one party has an informational advantage over the other, allowing for the rise of moral hazard and adverse selection problems (Bushman & Smith, 2001; Leuz & Verrecchia, 2000). Accounting theory posits that financial reporting can reduce the imbalance of information by providing different stakeholders with relevant and timely information (Frankel & Li, 2004), which reduces the informational gap between contracting parties and thus mitigates agency conflicts (Bushman et al., 2004; Bushman & Smith, 2001; Lambert, 2001). On the other hand, opacity in financial reporting impedes public scrutiny and deters market participants from holding managers accountable for their actions, which results in suboptimal outcomes for different stakeholders (Shleifer & Vishny, 1989). Guest et al. (2022) show that large positive non-GAAP earnings adjustments, an indication of opportunistic accounting behavior, predict abnormally high executive pay.
Executives and directors are not the only determinants of the firm’s accounting quality; external stakeholders also play a significant role in shaping a firm’s information environment. Regulatory requirements, investor demands, auditor scrutiny, and pressure from other stakeholders also influence the soundness of a firm’s accounting quality (Beyer et al., 2010; Christensen et al., 2016). For instance, despite a board’s ineffectiveness, shareholders may insist on strict and transparent reporting procedures to maintain a healthy and trustworthy information environment. Hence, outside forces can uphold reliable accounting practices and foster a transparent firm culture, mitigating the detrimental impacts of inadequate board oversight and CEO opportunistic behavior. 5 Moreover, although accounting quality and director monitoring are interrelated, they do not necessarily move in tandem. Firms install various costly governance mechanisms to safeguard against the shortcomings of any of the mechanisms, attempting to attain an acceptable level of oversight. The justification for retaining several governance mechanisms and incurring supplementary costs would be compromised if they all perform well or poorly simultaneously. Hence, these procedures offer protection by diversifying monitoring duties. In that sense, examining the interaction between accounting quality and director excess compensation provides insights into how different governance agents act and how one mechanism may compensate for the shortcomings of another. We investigate whether sound accounting mechanisms can balance the shortcomings of director oversight with respect to efficient investment allocations.
Nonetheless, we acknowledge that the inherent relationship between accounting quality and director excess compensation is complex, which allows for competing explanations for the effect of accounting quality and director excess compensation on investment efficiency. On the one hand, entrenched directors, as proxied by director excess compensation, may contribute to lower accounting quality, which in turn would lead to less efficient investment allocation (Biddle et al., 2009). On the other hand, the presence of high-quality accounting serves as a control mechanism, enriching corporate information and reducing information asymmetry, which increases scrutiny over entrenched directors and executives while limiting their ability to indulge in opportunistic behavior. Recognizing the interconnection between accounting quality and director excess compensation (as a proxy for ineffective board monitoring), our analysis mainly addresses the ability of accounting quality to moderate the unfavorable relation between director excess compensation and investment efficiency. High accounting quality could compensate, at least partially, for boardrooms compromised by the presence of overpaid board members. Accordingly, we hypothesize the following:
(H2): Accounting quality moderates the unfavorable association between ineffective board monitoring and overinvestment. Nevertheless, an alternative argument can imply that accounting quality might fail to moderate the implications of inefficient internal monitoring. That is, the effectiveness of accounting quality as a monitoring tool is reliant on backup from external active forces, such as institutional investors and other stakeholders, as well as sound internal governance mechanisms. Even if external pressures are successful in heightening accounting quality, the effect of accounting quality could be minimal in a compromised governance setting. In such a context, even sound accounting quality might not be sufficient to outweigh inefficient and potentially collusive director oversight. Accordingly, the influence of accounting quality on the association between director excess compensation and investment efficiency is not straightforward and warrants empirical investigation.
Data and Methodology
Sample Selection
We utilize various databases to construct our sample. We obtain firms’ financial information from Compustat, stock returns from CRSP, data related to CEO compensation/attributes and director compensation from ExecuComp, and director and board characteristics from the Institutional Shareholder Services (ISS) database. Our sample comprises public firms listed on the S&P1500 index and spans the 2007–2018 period. In 2006, the Securities and Exchange Commission (SEC) amended executive and director disclosure rules to better align with the accounting changes adopted by the Financial Accounting Standards Board (FASB). Therefore, we start our sample period in 2007. After merging data from the four databases, excluding financial and utility firms, and computing all variables and measures employed in our analyses, our final sample comprises 11,690 firm-year observations.
Estimating the Likelihood of Underinvestment and Overinvestment
A longstanding literature uses the accelerator model of corporate investments to estimate investment efficiency (e.g., Biddle et al., 2009; McNichols and Stubben, 2008; Richardson, 2006). The theoretical underpinning is that the expected benefit of an investment should be the sole determinant of the decision-making process, where the expected benefit is determined by forecasted product demand and future growth. The main assumption of the accelerator model is that future investment is related to the current level of output. Thus, investment is a function of revenue growth—a proxy for growth in demand. Chen et al. (2011) suggest incorporating a piece-wise linear specification in the accelerator model, thereby allowing the relation between investment and change in revenue to vary across declining and increasing revenues. Additionally, McNichols and Stubben (2008) highlight that internal financing plays a vital role in shaping investment decisions and suggest incorporating operating cash flow in the accelerator model. Equation (1) below depicts the model specification.

Estimating Director Excess Compensation
Consistent with the literature, our analysis focuses on the excess compensation of outside directors (e.g., Dah & Frye, 2017). This focus arises from the notion that outside directors are expected to enhance board oversight, and excess compensation can signal deficient monitoring on their part. Traditionally, director excess compensation is measured by the residuals from a regression of director total compensation on its hypothesized determinants (Brick et al., 2006; Dah & Frye, 2017), allowing the error term to be either positive or negative. However, given the general consensus that directors are overcompensated, the literature largely ignores director undercompensation, treating upward variations in the residual term as a divergence from the predicted compensation level (Brick et al., 2006; Chen et al., 2019; Hope et al., 2019). To the best of our knowledge, the only study to split the residual measure into overcompensated and undercompensated directors is that of Dah and Frye (2017); nevertheless, the authors document no significant effect of director undercompensation on corporate governance efficiency. More importantly, the conventional residual-based method fails to differentiate between the amount of excess compensation and the amount of random noise. Accordingly, to the extent that firms strive to minimize costs given a specific set of objectives and constraints, we employ SFA to identify director excess compensation. Cost-minimizing SFA provides a method to estimate the compensation function of a fully efficient firm, that is, the efficient compensation frontier. A compensation level is at maximum efficiency if its actual compensation is equal to its efficient compensation; in other words, its actual compensation level lies on the efficient compensation frontier. However, if the compensation level lies above the efficient compensation frontier, then compensation is said to be technically inefficient. Specifically, SFA is a maximum likelihood technique that splits the error term into a systematic one-sided inefficiency term (i.e., director excess compensation) and a stochastic error term. Our analysis follows prior studies (e.g., Brick et al., 2006; Chen et al., 2019; Dah & Frye, 2017) in identifying the determinants of director actual compensation. We provide a detailed discussion on the application of the SFA methodology to estimate director excess compensation in the Online Supplemental Appendix S1.
Estimating Accounting Quality
We develop a comprehensive measure of accounting quality (AQ_Index) that includes accruals and real earnings management, value relevance of accounting numbers, and asymmetric timeliness of loss recognition. Specifically, the AQ index incorporates (1) a proxy for accruals earnings management (Dechow et al., 1995; Kothari et al., 2005), (2) a proxy for the extent to which working capital accruals map into operating cash flows (Dechow & Dichev, 2002; McNichols, 2002), (3) a proxy for real-activity earnings management (Cohen & Zarowin, 2010; Roychowdhury, 2006), (4) a proxy for the value relevance of accounting numbers (Hand & Landsman, 2005; Ohlson, 2001), 7 and (5) a proxy for asymmetric timely loss recognition (Basu, 1997; Khan & Watts, 2009).
We first compute the five proxy measures for each firm-year and then take the absolute value of each residual-based measure (except for the asymmetric timely loss recognition measure, which is non-residual-based), in which accounting quality increases in one direction (i.e., the higher the value the better the accounting quality). Next, we sort each measure from the lowest to the highest accounting quality and assign observations into decile ranks for each measure separately. We use deciles to reduce potential estimation error and mitigate concerns relating to nonlinearities (Garcia Lara et al., 2016). Then, for each firm-year observation, we sum the decile ranks of its accounting measures to compute an aggregate accounting quality index rank. Therefore, any firm in a given year can score a minimum of 5 (if the firm falls within the lowest decile rank of all accounting items) and a maximum of 50 (if the firm falls within the highest decile rank of all accounting items). Finally, we standardize our index so that it ranges between zero and one. We present an extensive discussion on the construction of the AQ_Index in the Online Supplemental Appendix S2.
Empirical Models
To test hypothesis H1, we examine the relation between director excess compensation and the investment efficiency of overinvesting firms and underinvesting firms. We develop the model in equation (2) below that expresses the firm’s total investment as a function of the propensity to overinvest, director excess compensation (a proxy for ineffective board monitoring), and their interaction.

We follow prior studies and control for a vector of financial variables and board characteristics, Firm_Controls, that explain the variation in corporate investment (e.g., Biddle et al., 2009). We control for economic factors that determine investment decisions, such as firm size (SIZE), investment opportunities (MTB), financial leverage (LEV), asset tangibility (PPE), profitability (ROA), dividend paying status (DIVDUM), bankruptcy risk (Z_Score), and idiosyncratic economic shocks (ECON). Prior research on corporate investment (e.g., Richardson, 2006) finds that investments increase in investment opportunities, asset tangibility, and profitability, and decrease in firm size, financial leverage, dividends, and bankruptcy. Moreover, we include controls for innate factors that determine investing decisions, such as the standard deviation of operating cash flow (SDOCF) and the standard deviation of sales (SDSALE). Further, we control for governance and board characteristics, namely, managerial entrenchment (E_Index), firm age (AGE), number of employees (EMPL), board size (BODSIZE), percentage of insider directors (%INSIDER), percentage of shares held by the CEO (%CEOSH), pay-for-performance sensitivity (DELTA), and CEO duality (CEODUAL). Lastly, we include industry-year fixed effects to control for time- and industry-specific unobservable factors.
Biddle et al. (2009) examine the effect of financial reporting quality on investments conditional on the firm’s propensity to overinvest. We adapt the model of Biddle et al. (2009) to fit our research setting and employ the model in equation (3) below to establish the validity of the AQ_Index and examine the role of accounting quality in investing decisions.

We define all variables in the Appendix. If accounting quality curbs underinvestment, then we expect β 2 , the coefficient on AQ_Index, to be positive. This finding would imply that the extent of underinvestment decreases (and hence investment efficiency increases) with accounting quality. If accounting quality curbs overinvestment, then we expect β 2 + β 3 , the sum of the coefficients on AQ_Index and OVERINV×AQ_Index, to be negative, indicating that the extent of overinvestment decreases (and hence investment efficiency increases) with accounting quality.
To test hypothesis H2, we examine whether accounting quality weakens the hypothesized negative association between director excess compensation and investment efficiency. We employ the model in equation (4) below for the underinvesting and overinvesting subsamples separately. The model expresses the firm’s total investment as a function of director excess compensation (a proxy for ineffective board monitoring), accounting quality, and their interaction.

The coefficient on the interaction term EXCOMP×AQ_Index in equation (4) estimates the change in the relation between investment and director excess compensation per unit change in AQ_Index. For the underinvestment subsample, if accounting quality weakens the impact of director excess compensation (i.e., increases investment efficiency), then we expect a positive coefficient on the interaction term. By contrast, for the overinvesting subsample, if accounting quality weakens the impact of director excess compensation (i.e., increases investment efficiency), then we expect a negative coefficient on the interaction term.
Descriptive Statistics
Summary Statistics for the Total, Efficient, and Excess Components of Director Compensation (in US Dollars).
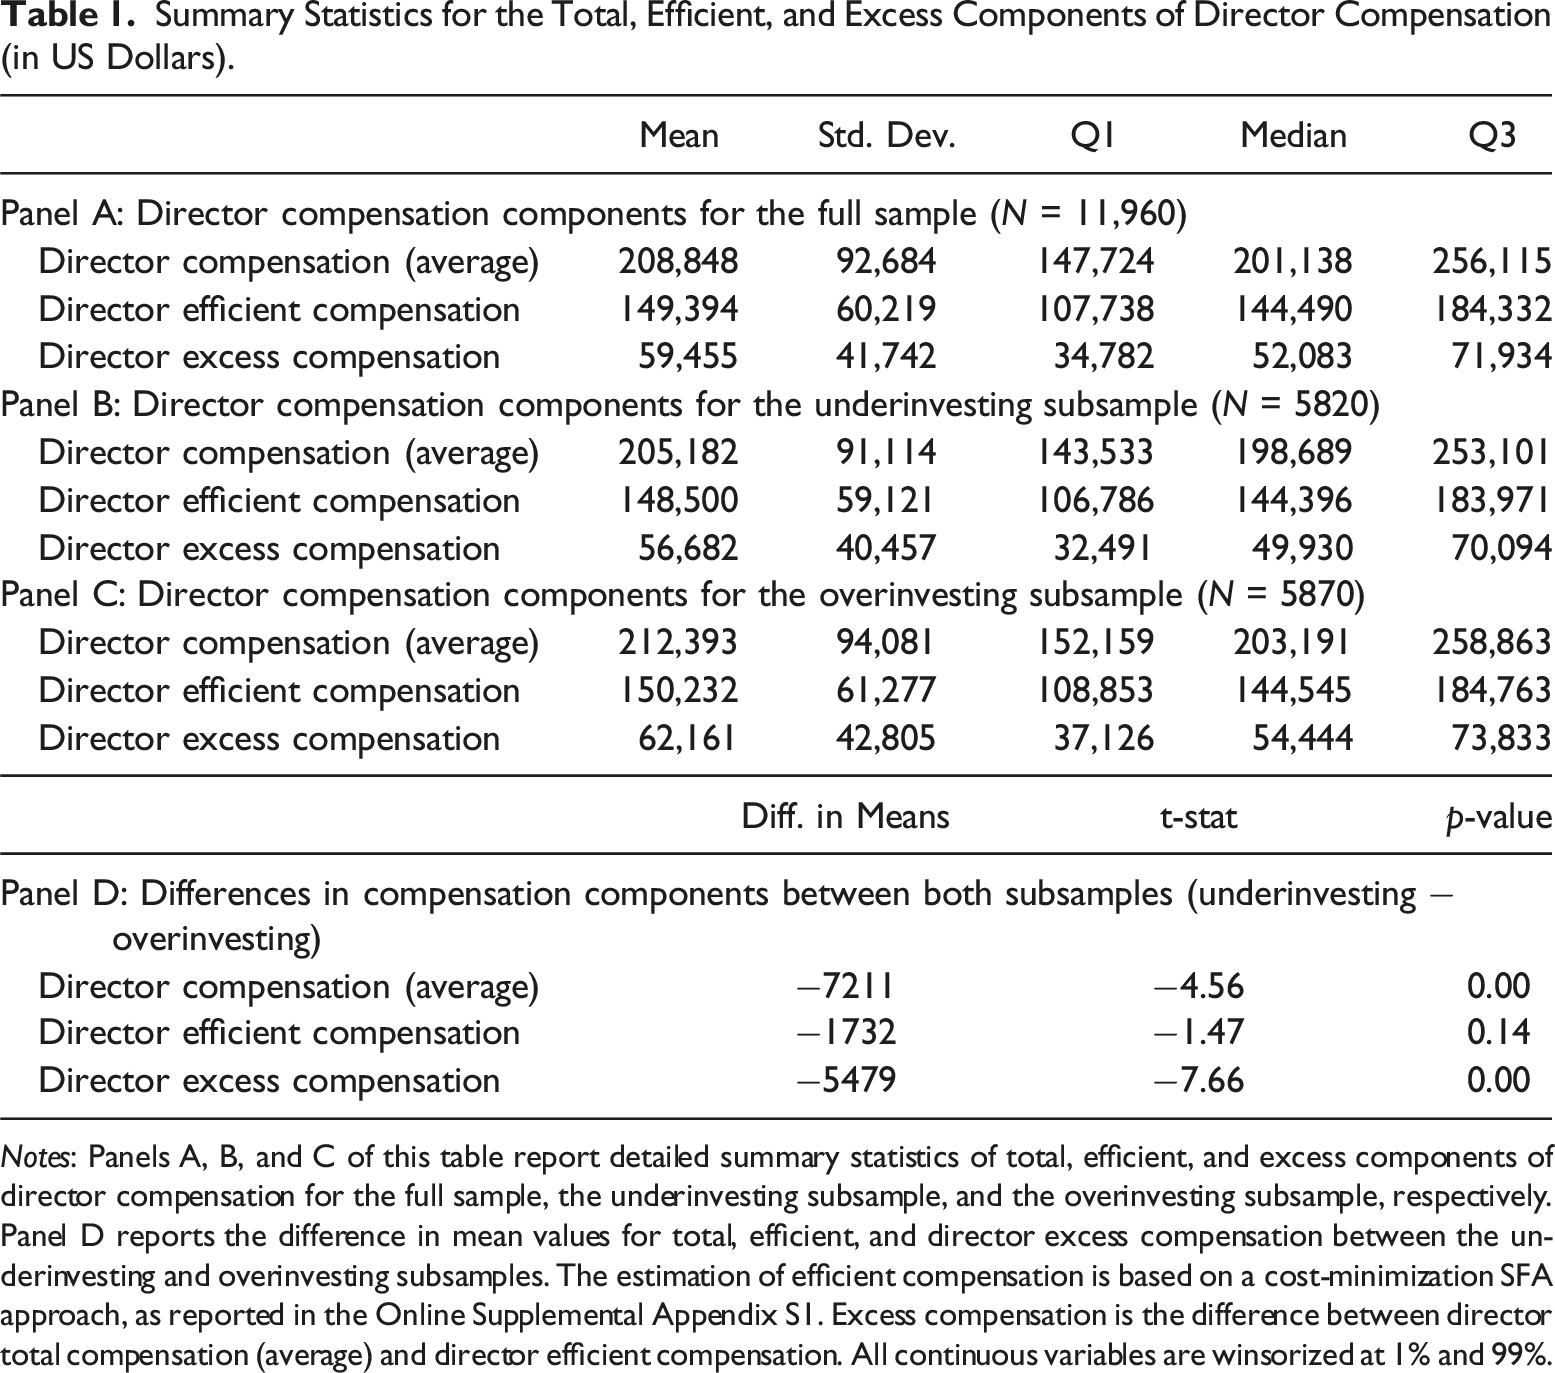
Notes: Panels A, B, and C of this table report detailed summary statistics of total, efficient, and excess components of director compensation for the full sample, the underinvesting subsample, and the overinvesting subsample, respectively. Panel D reports the difference in mean values for total, efficient, and director excess compensation between the underinvesting and overinvesting subsamples. The estimation of efficient compensation is based on a cost-minimization SFA approach, as reported in the Online Supplemental Appendix S1. Excess compensation is the difference between director total compensation (average) and director efficient compensation. All continuous variables are winsorized at 1% and 99%.
Table 1 Panels B and C show that directors in overinvesting firms receive significantly higher average total and excess compensation ($212,393 and $62,161, respectively) than directors of firms in the underinvesting subsample ($205,182 and $56,682, respectively). 11 Table 1 Panel D reports t-tests for the difference in means of the three compensation components for the under and overinvesting subsamples. We observe that the difference in total compensation between the two subsamples arises mainly from the excess compensation component.
Summary Statistics for the AQ Index and its Individual Components.
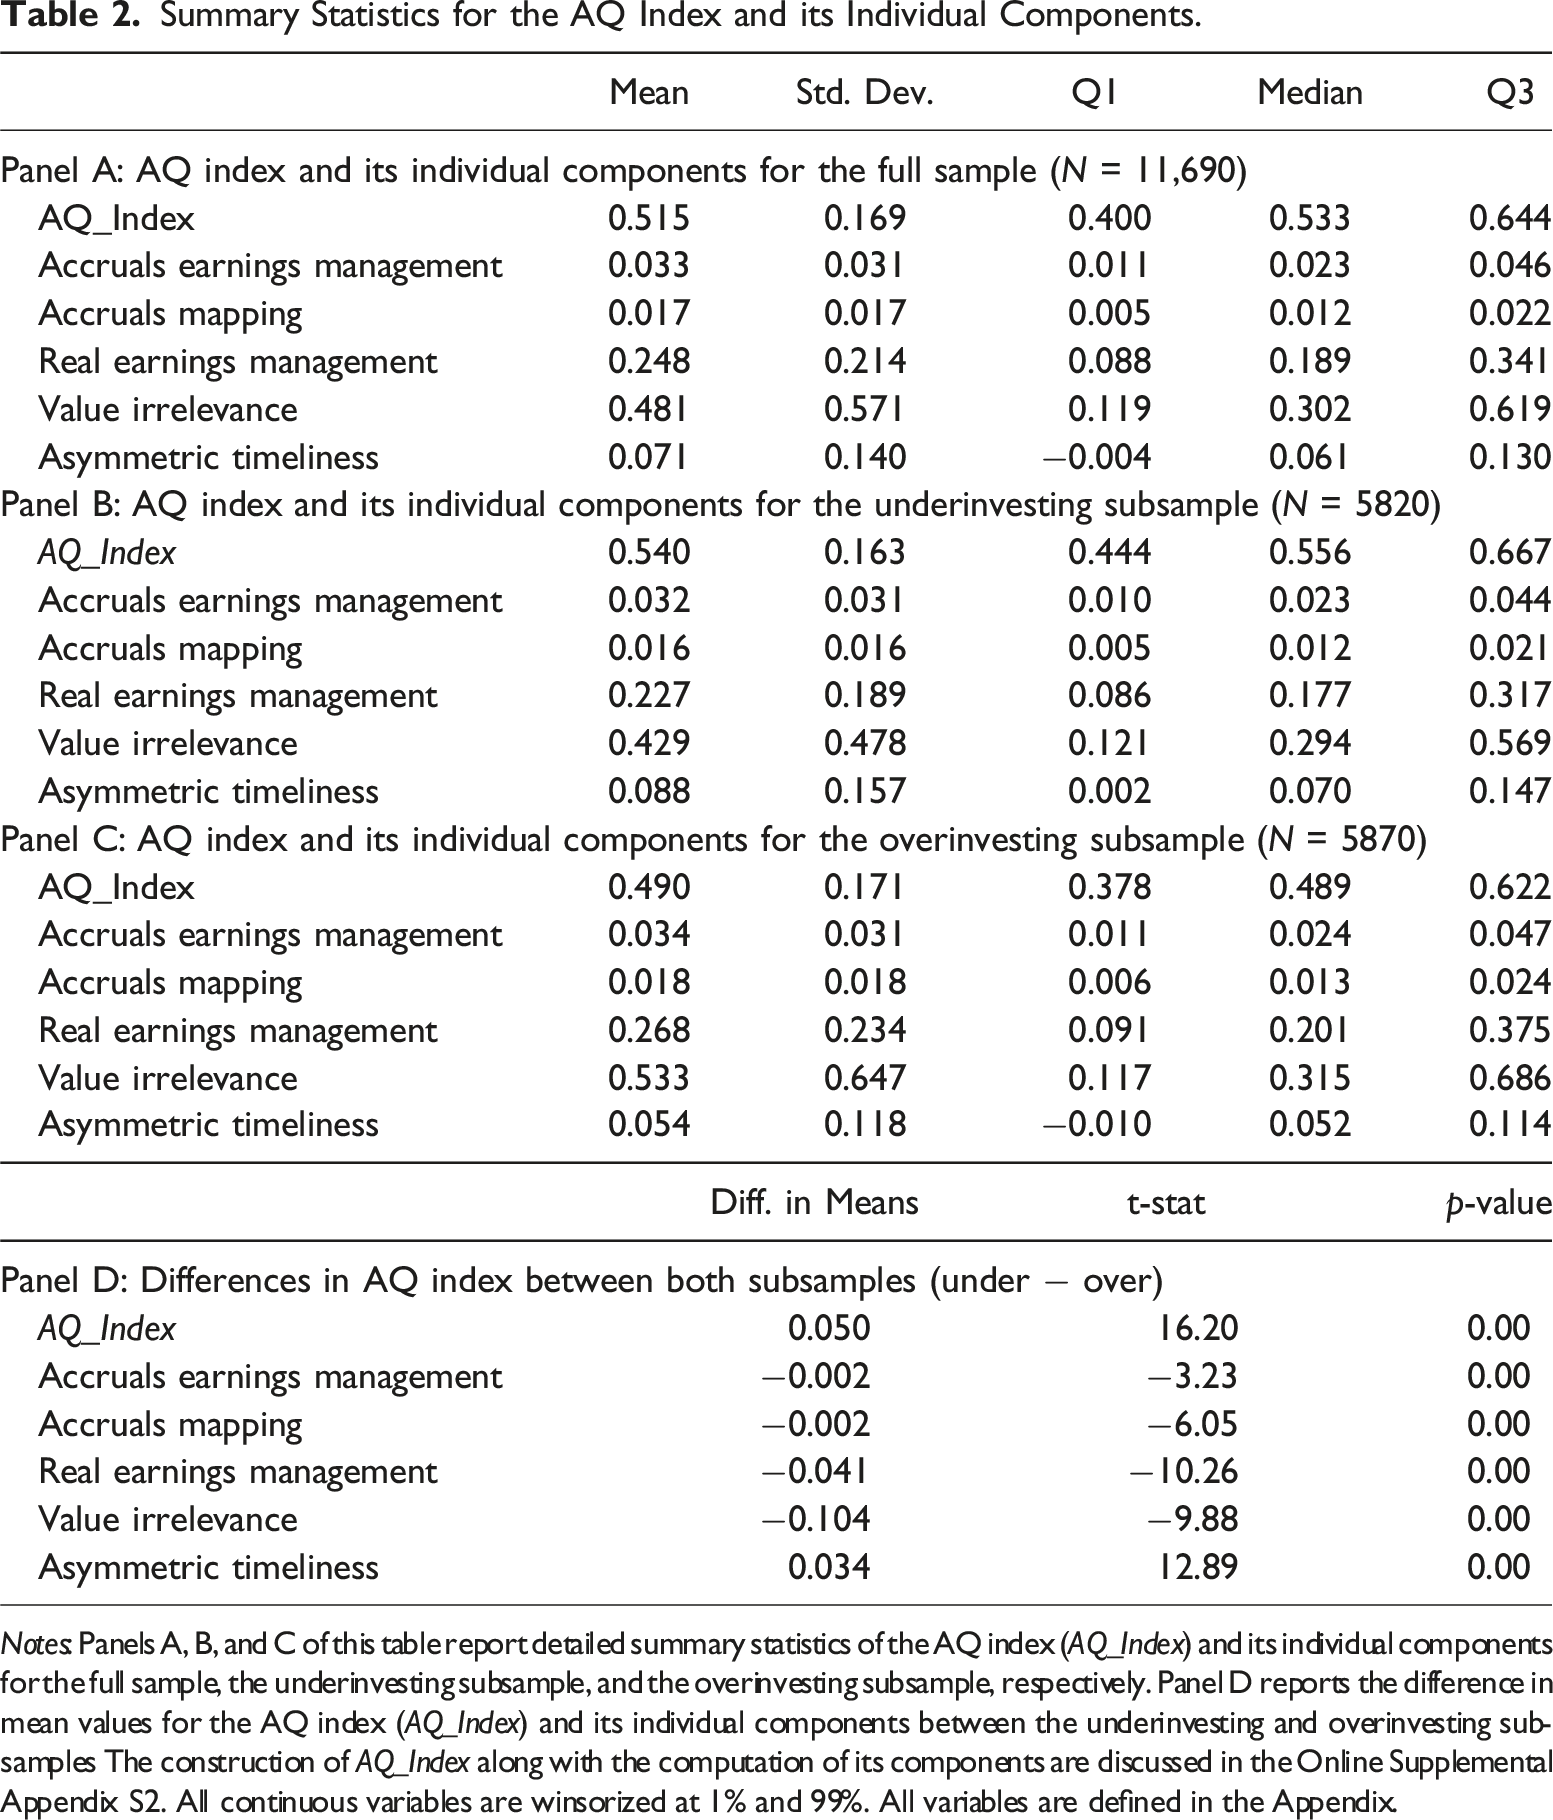
Notes: Panels A, B, and C of this table report detailed summary statistics of the AQ index (AQ_Index) and its individual components for the full sample, the underinvesting subsample, and the overinvesting subsample, respectively. Panel D reports the difference in mean values for the AQ index (AQ_Index) and its individual components between the underinvesting and overinvesting subsamples The construction of AQ_Index along with the computation of its components are discussed in the Online Supplemental Appendix S2. All continuous variables are winsorized at 1% and 99%. All variables are defined in the Appendix.
Summary Statistics for Regression Variables.
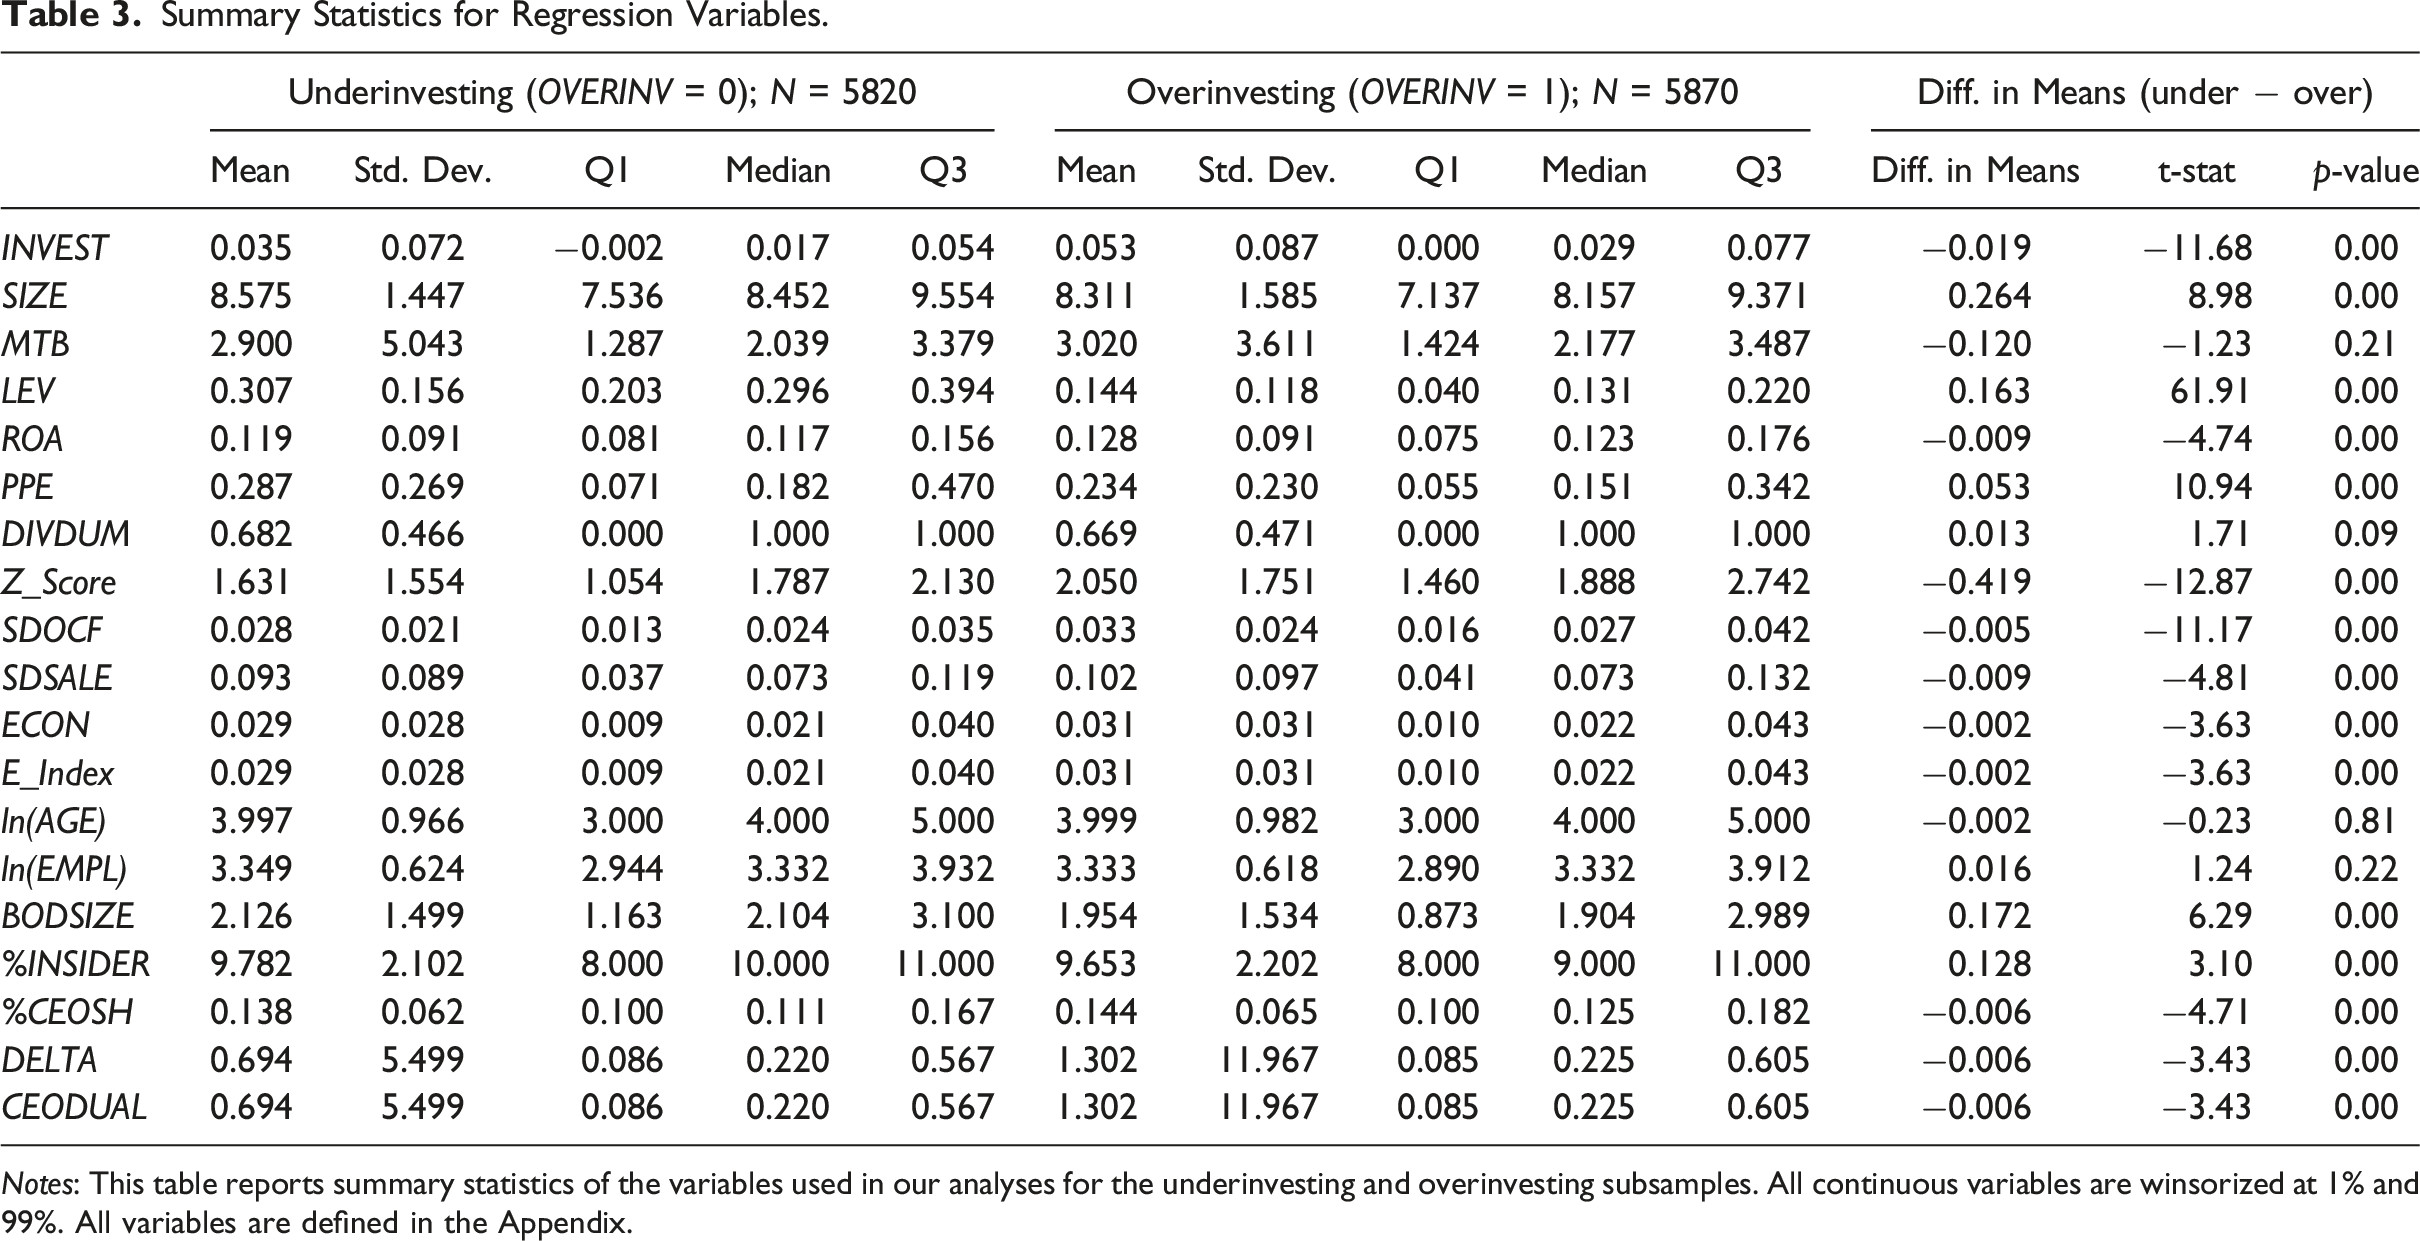
Notes: This table reports summary statistics of the variables used in our analyses for the underinvesting and overinvesting subsamples. All continuous variables are winsorized at 1% and 99%. All variables are defined in the Appendix.
Results
Association Between Director Excess Compensation and Investment Efficiency (H1)
We start our empirical analysis by examining the relation between director excess compensation and investment efficiency. We first provide a graphical representation of the association between director excess compensation and total investment, and how it varies with the likelihood of overinvesting. Figure 1 shows that the association between director excess compensation and total investment intensifies as the likelihood of overinvesting increases, that is, as we move from underinvestment to overinvestment. The effect of director excess compensation on firm’s investment level. Notes: This figure depicts the effect of the interaction between director excess compensation and abnormal investment on firm’s investment level.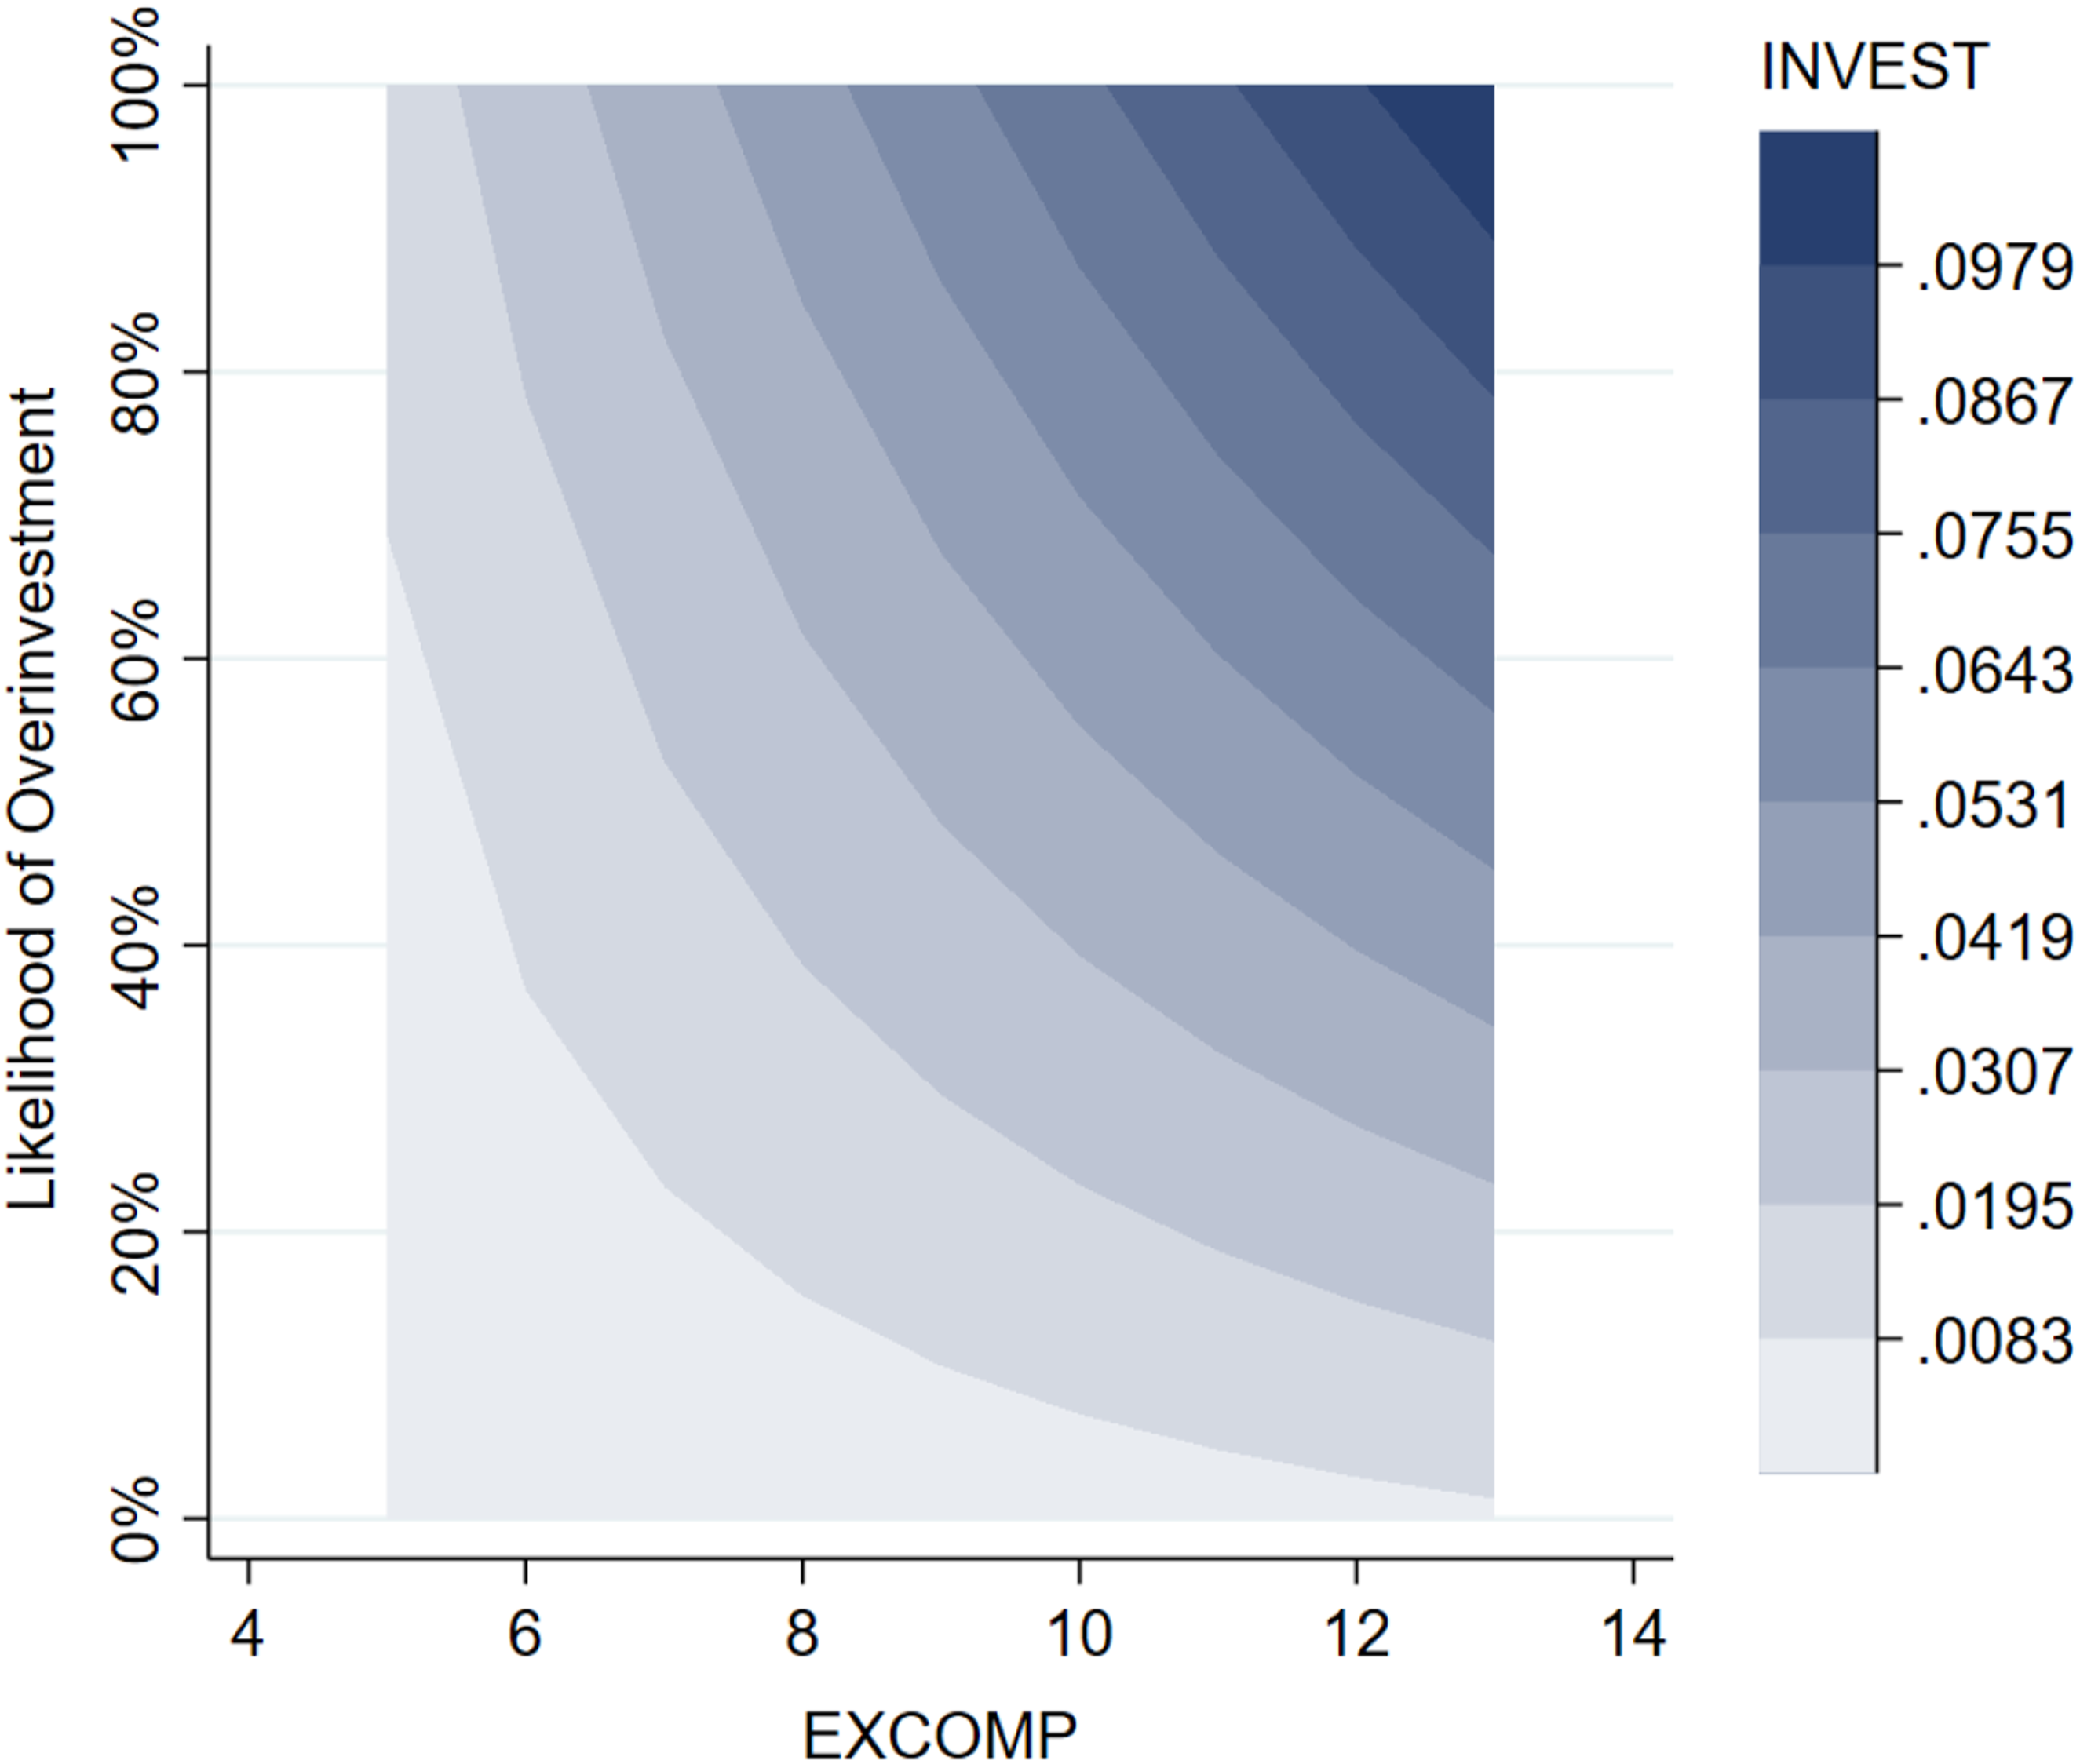
Director Excess Compensation and Total Investment.
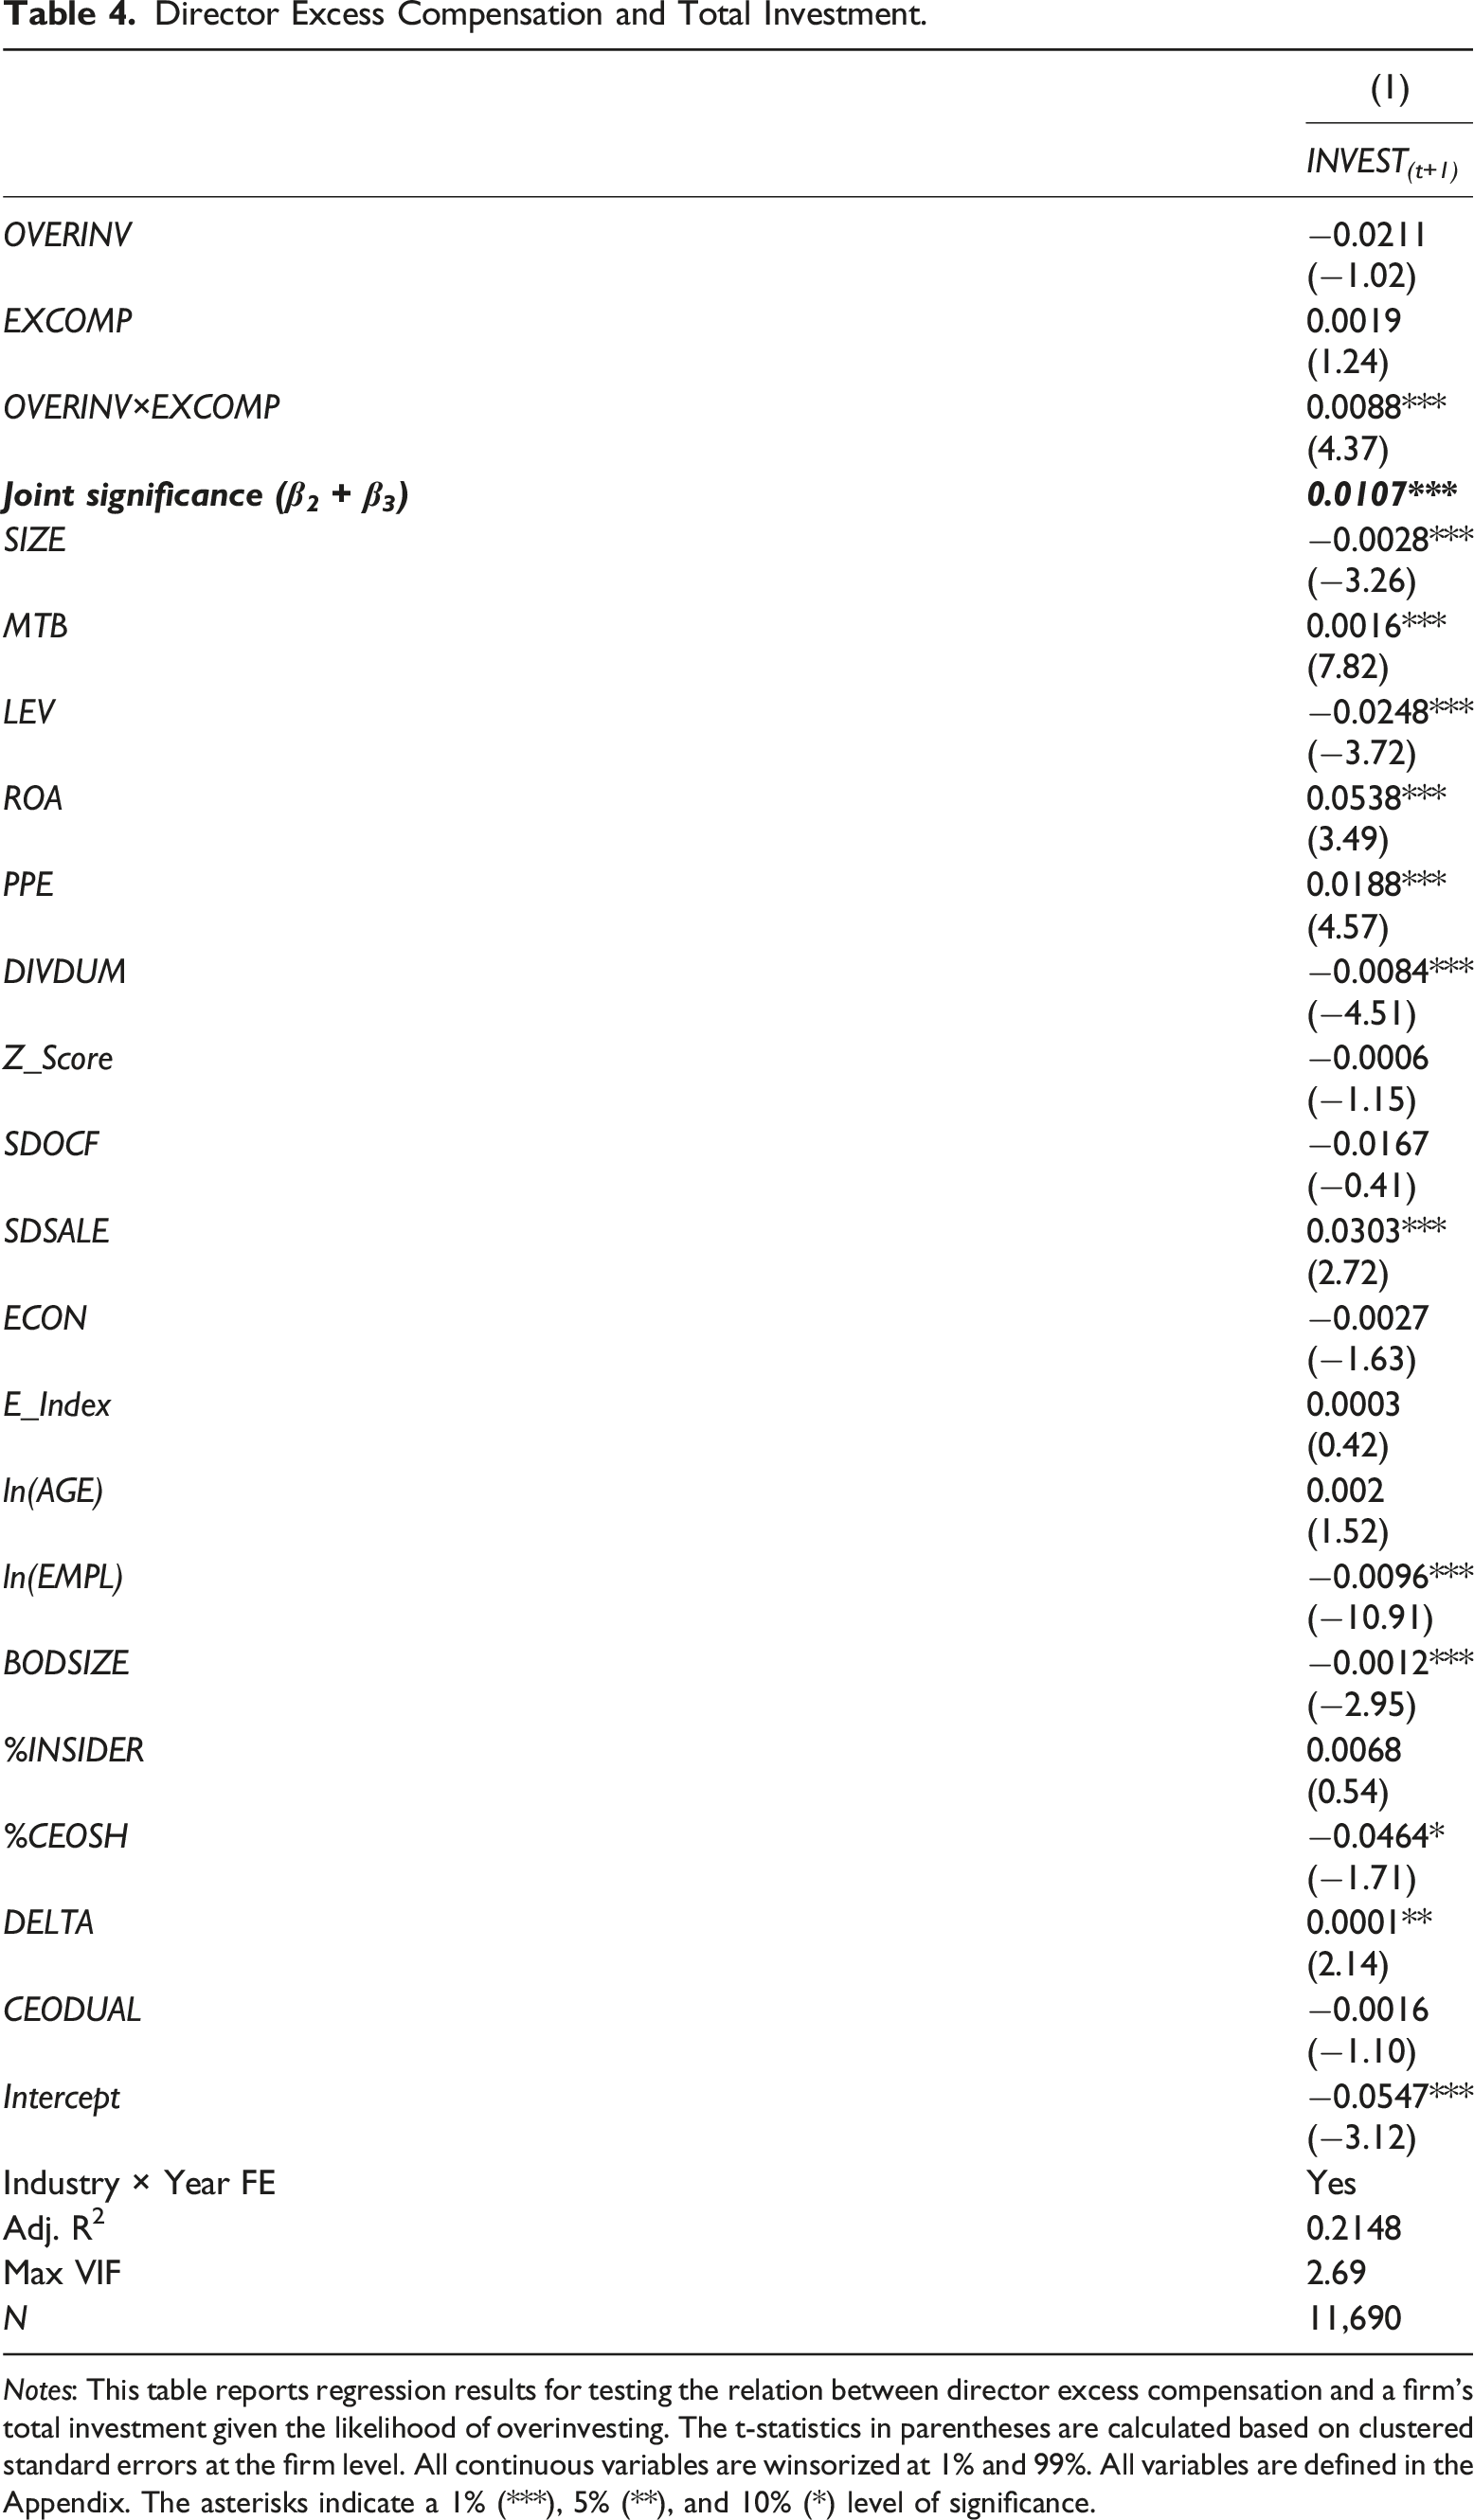
Notes: This table reports regression results for testing the relation between director excess compensation and a firm’s total investment given the likelihood of overinvesting. The t-statistics in parentheses are calculated based on clustered standard errors at the firm level. All continuous variables are winsorized at 1% and 99%. All variables are defined in the Appendix. The asterisks indicate a 1% (***), 5% (**), and 10% (*) level of significance.
The results show that the coefficient on EXCOMP is not reliably different from zero, indicating that director excess compensation does not significantly affect investment efficiency for underinvesting firms. 12 The results further show that the sum of the coefficients on EXCOMP and the interaction term OVERINV × EXCOMP is significantly positive. Specifically, the sum of the coefficient estimates is 0.0107 (significant at the 1% level), indicating that overinvesting firms tend to invest even more inefficiently as director excess pay increases. In other words, director excess compensation further exacerbates investment inefficiency for firms that are more prone to overinvest. Thus, the results support our first hypothesis and highlight that the investment inefficiency induced by director overcompensation is specific to overinvesting firms.
There are fundamental distinctions in the settings and drivers that may explain the contribution of director excess compensation to overinvestment but not to underinvestment. Whereas overinvestment often entails exploitative CEOs leveraging complicit directors to engage in self-centered projects, underinvestment is generally induced by CEOs’ aversion to risk, which typically calls for less director involvement and approval. That is, board oversight is often more strongly associated with visible overinvestment decisions than with the non-visible inaction of passing up positive-NPV projects.
The coefficients on the control variables are generally consistent with the previous literature. We find a significantly negative relation between total investment and firm size (SIZE), leverage (LEV), and the propensity to paying dividends (DIVDUM) (Ramalingegowda et al., 2013), and a significantly positive relation between total investment and investment opportunity (MTB), profitability (ROA), and volatility of sales (SDSALE) (Biddle et al., 2009).
Association Between AQ and Investment Efficiency
Construct Validity of the Accounting Quality Index: Replication of the Findings of Biddle et al. (2009).
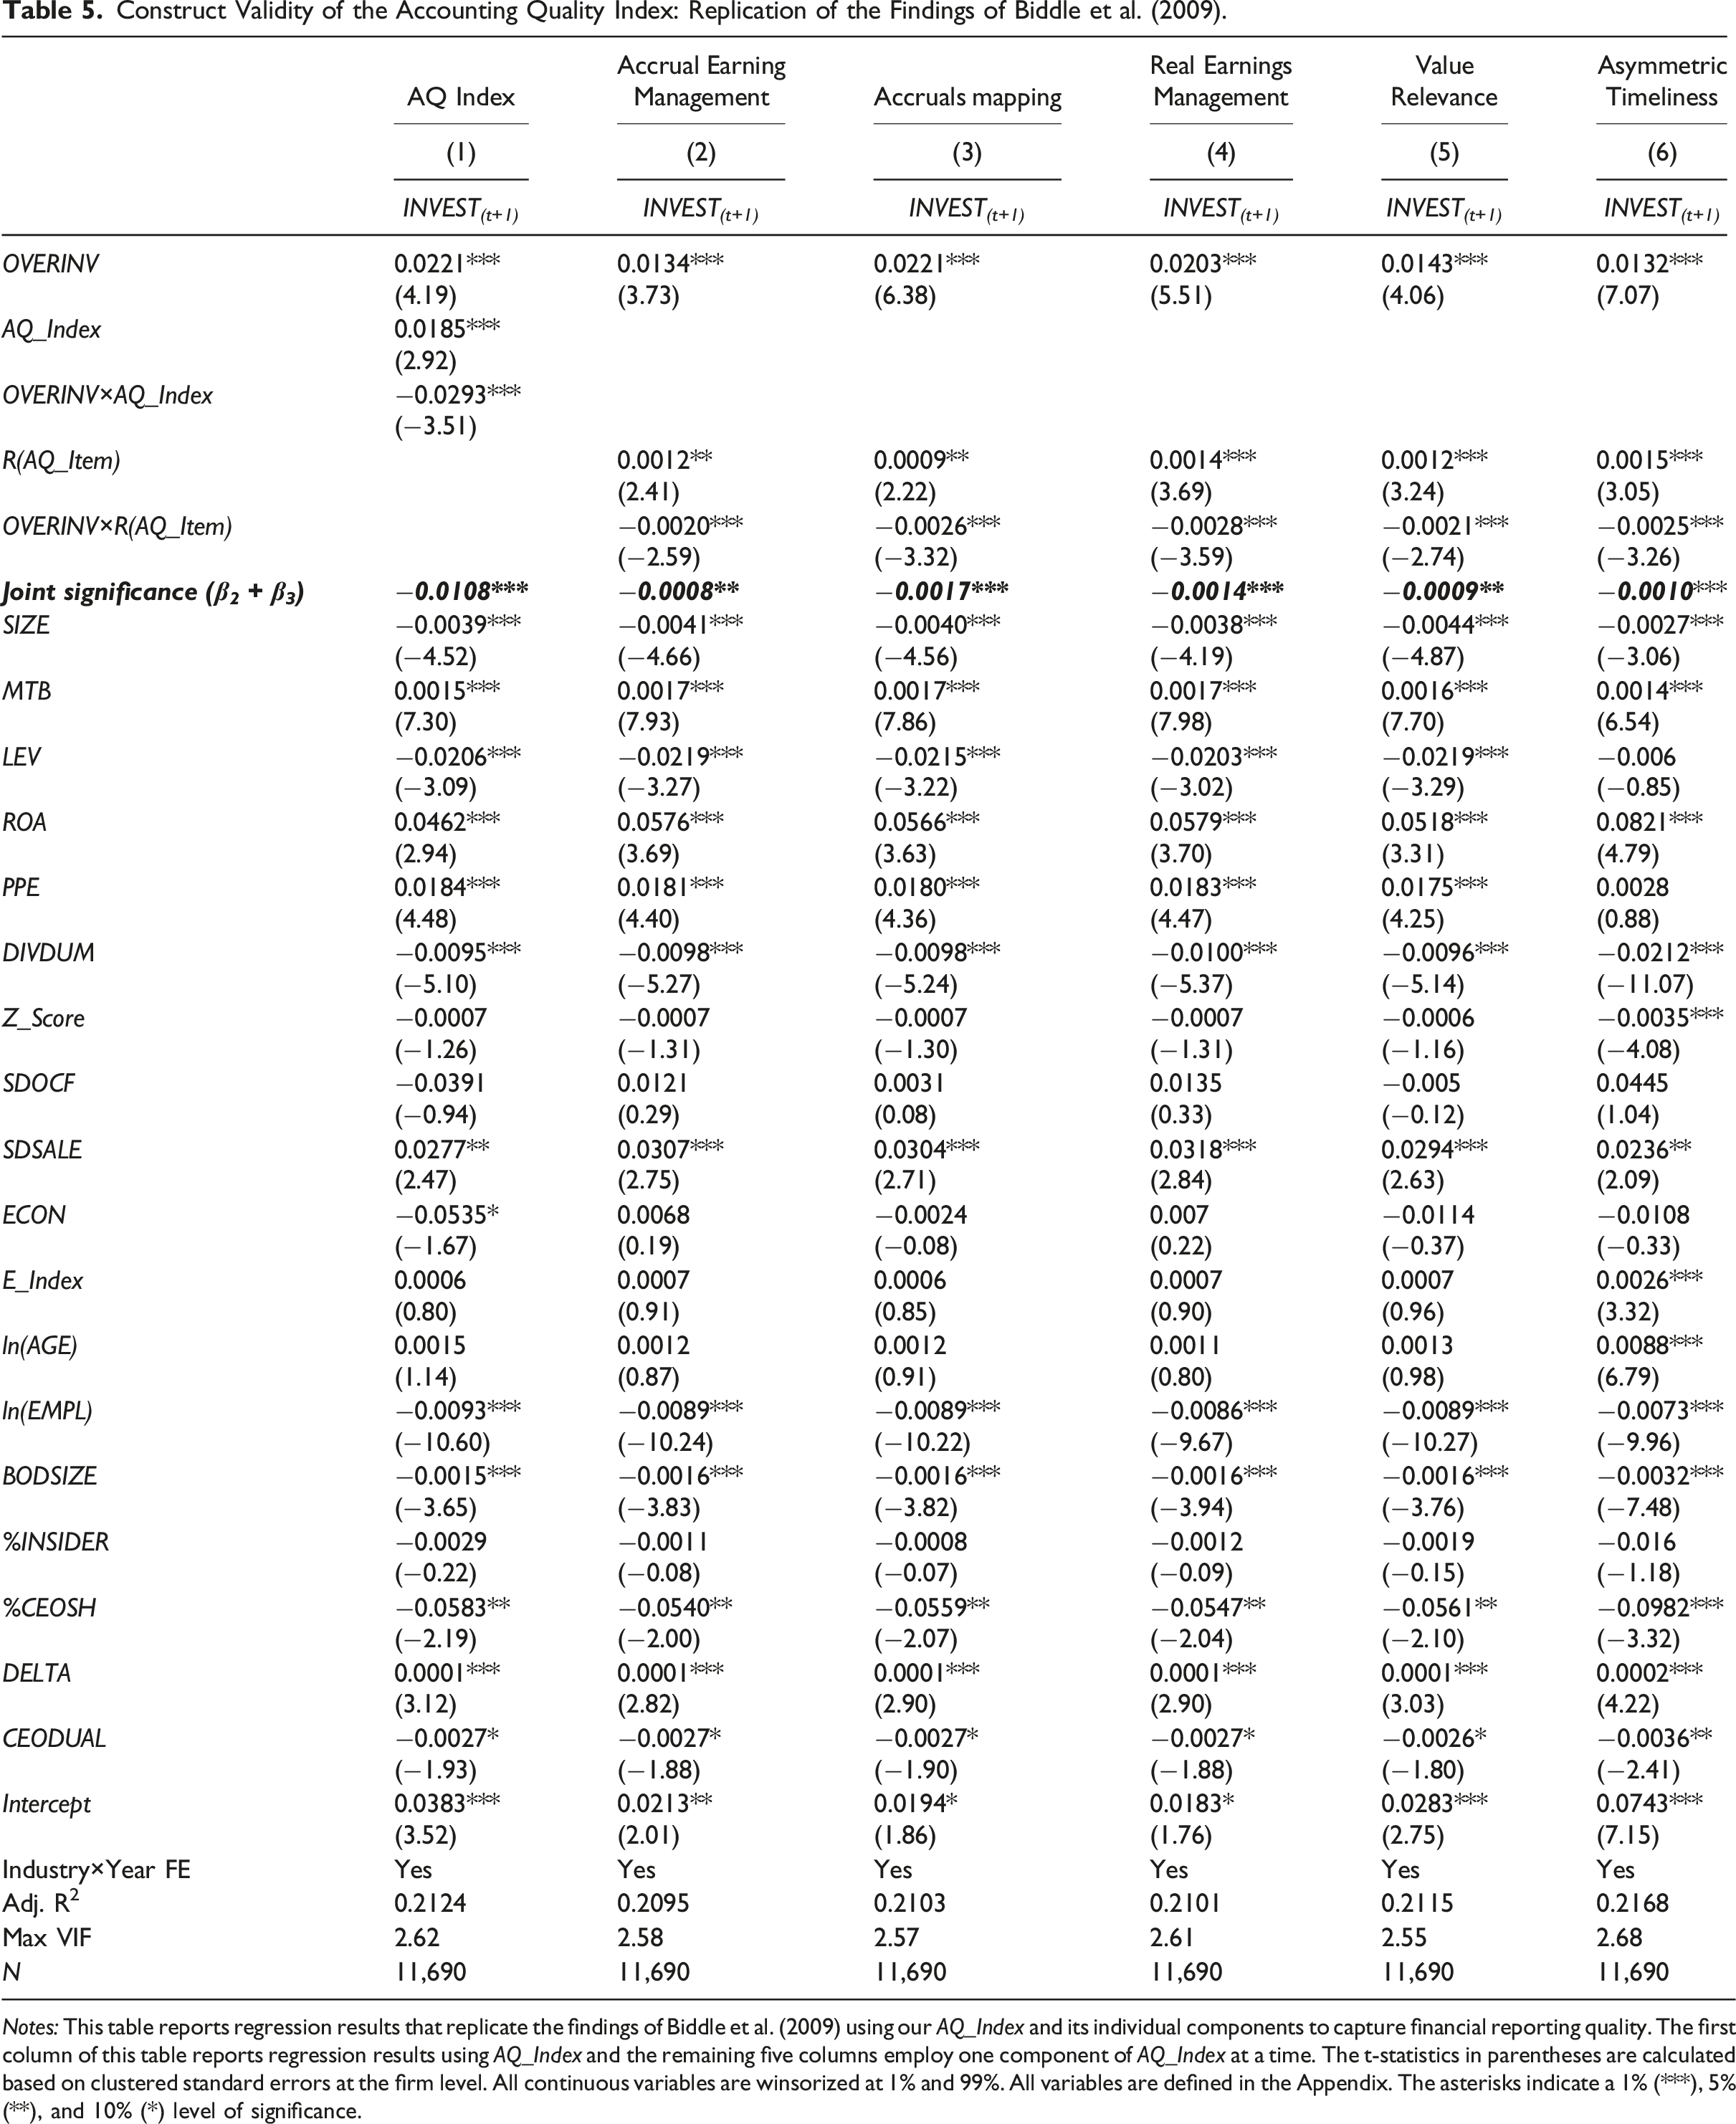
Notes: This table reports regression results that replicate the findings of Biddle et al. (2009) using our AQ_Index and its individual components to capture financial reporting quality. The first column of this table reports regression results using AQ_Index and the remaining five columns employ one component of AQ_Index at a time. The t-statistics in parentheses are calculated based on clustered standard errors at the firm level. All continuous variables are winsorized at 1% and 99%. All variables are defined in the Appendix. The asterisks indicate a 1% (***), 5% (**), and 10% (*) level of significance.
Moderating Role of Accounting Quality (H2)
We next test hypothesis H2, that a firm’s accounting quality moderates the unfavorable relation between director excess compensation and investment efficiency, for the underinvesting and the overinvesting subsamples. We start with a graphical analysis as shown in Figure 2, which displays the relation between director excess compensation and the firm’s total investment given different accounting quality levels. Figure 2 Panel A shows that, for underinvesting firms, accounting quality does not seem to have a significant impact on the relation between director excess compensation and the firm’s investment level. In contrast, Figure 2 Panel B shows that, for overinvesting firms, the highest level of total investment occurs when director excess compensation is at its highest and accounting quality is at its lowest. Further, as the level of accounting quality increases, the association between director excess compensation and total investment decreases. This observation suggests that, for overinvesting firms, accounting quality is likely to mitigate the unfavorable relation between director excess compensation and total investment. The effect of accounting quality on the association between director excess compensation and firm’s investment level. Panel A: The effect of director excess compensation for underinvesting firms (OVERINV = 0). Panel B: The effect of director excess compensation for overinvesting firms (OVERINV = 1). Notes: Panels A and B of this figure depict the effect of the interaction between director excess compensation and AQ index on firms’ investment level for the underinvesting and overinvesting subsamples, respectively.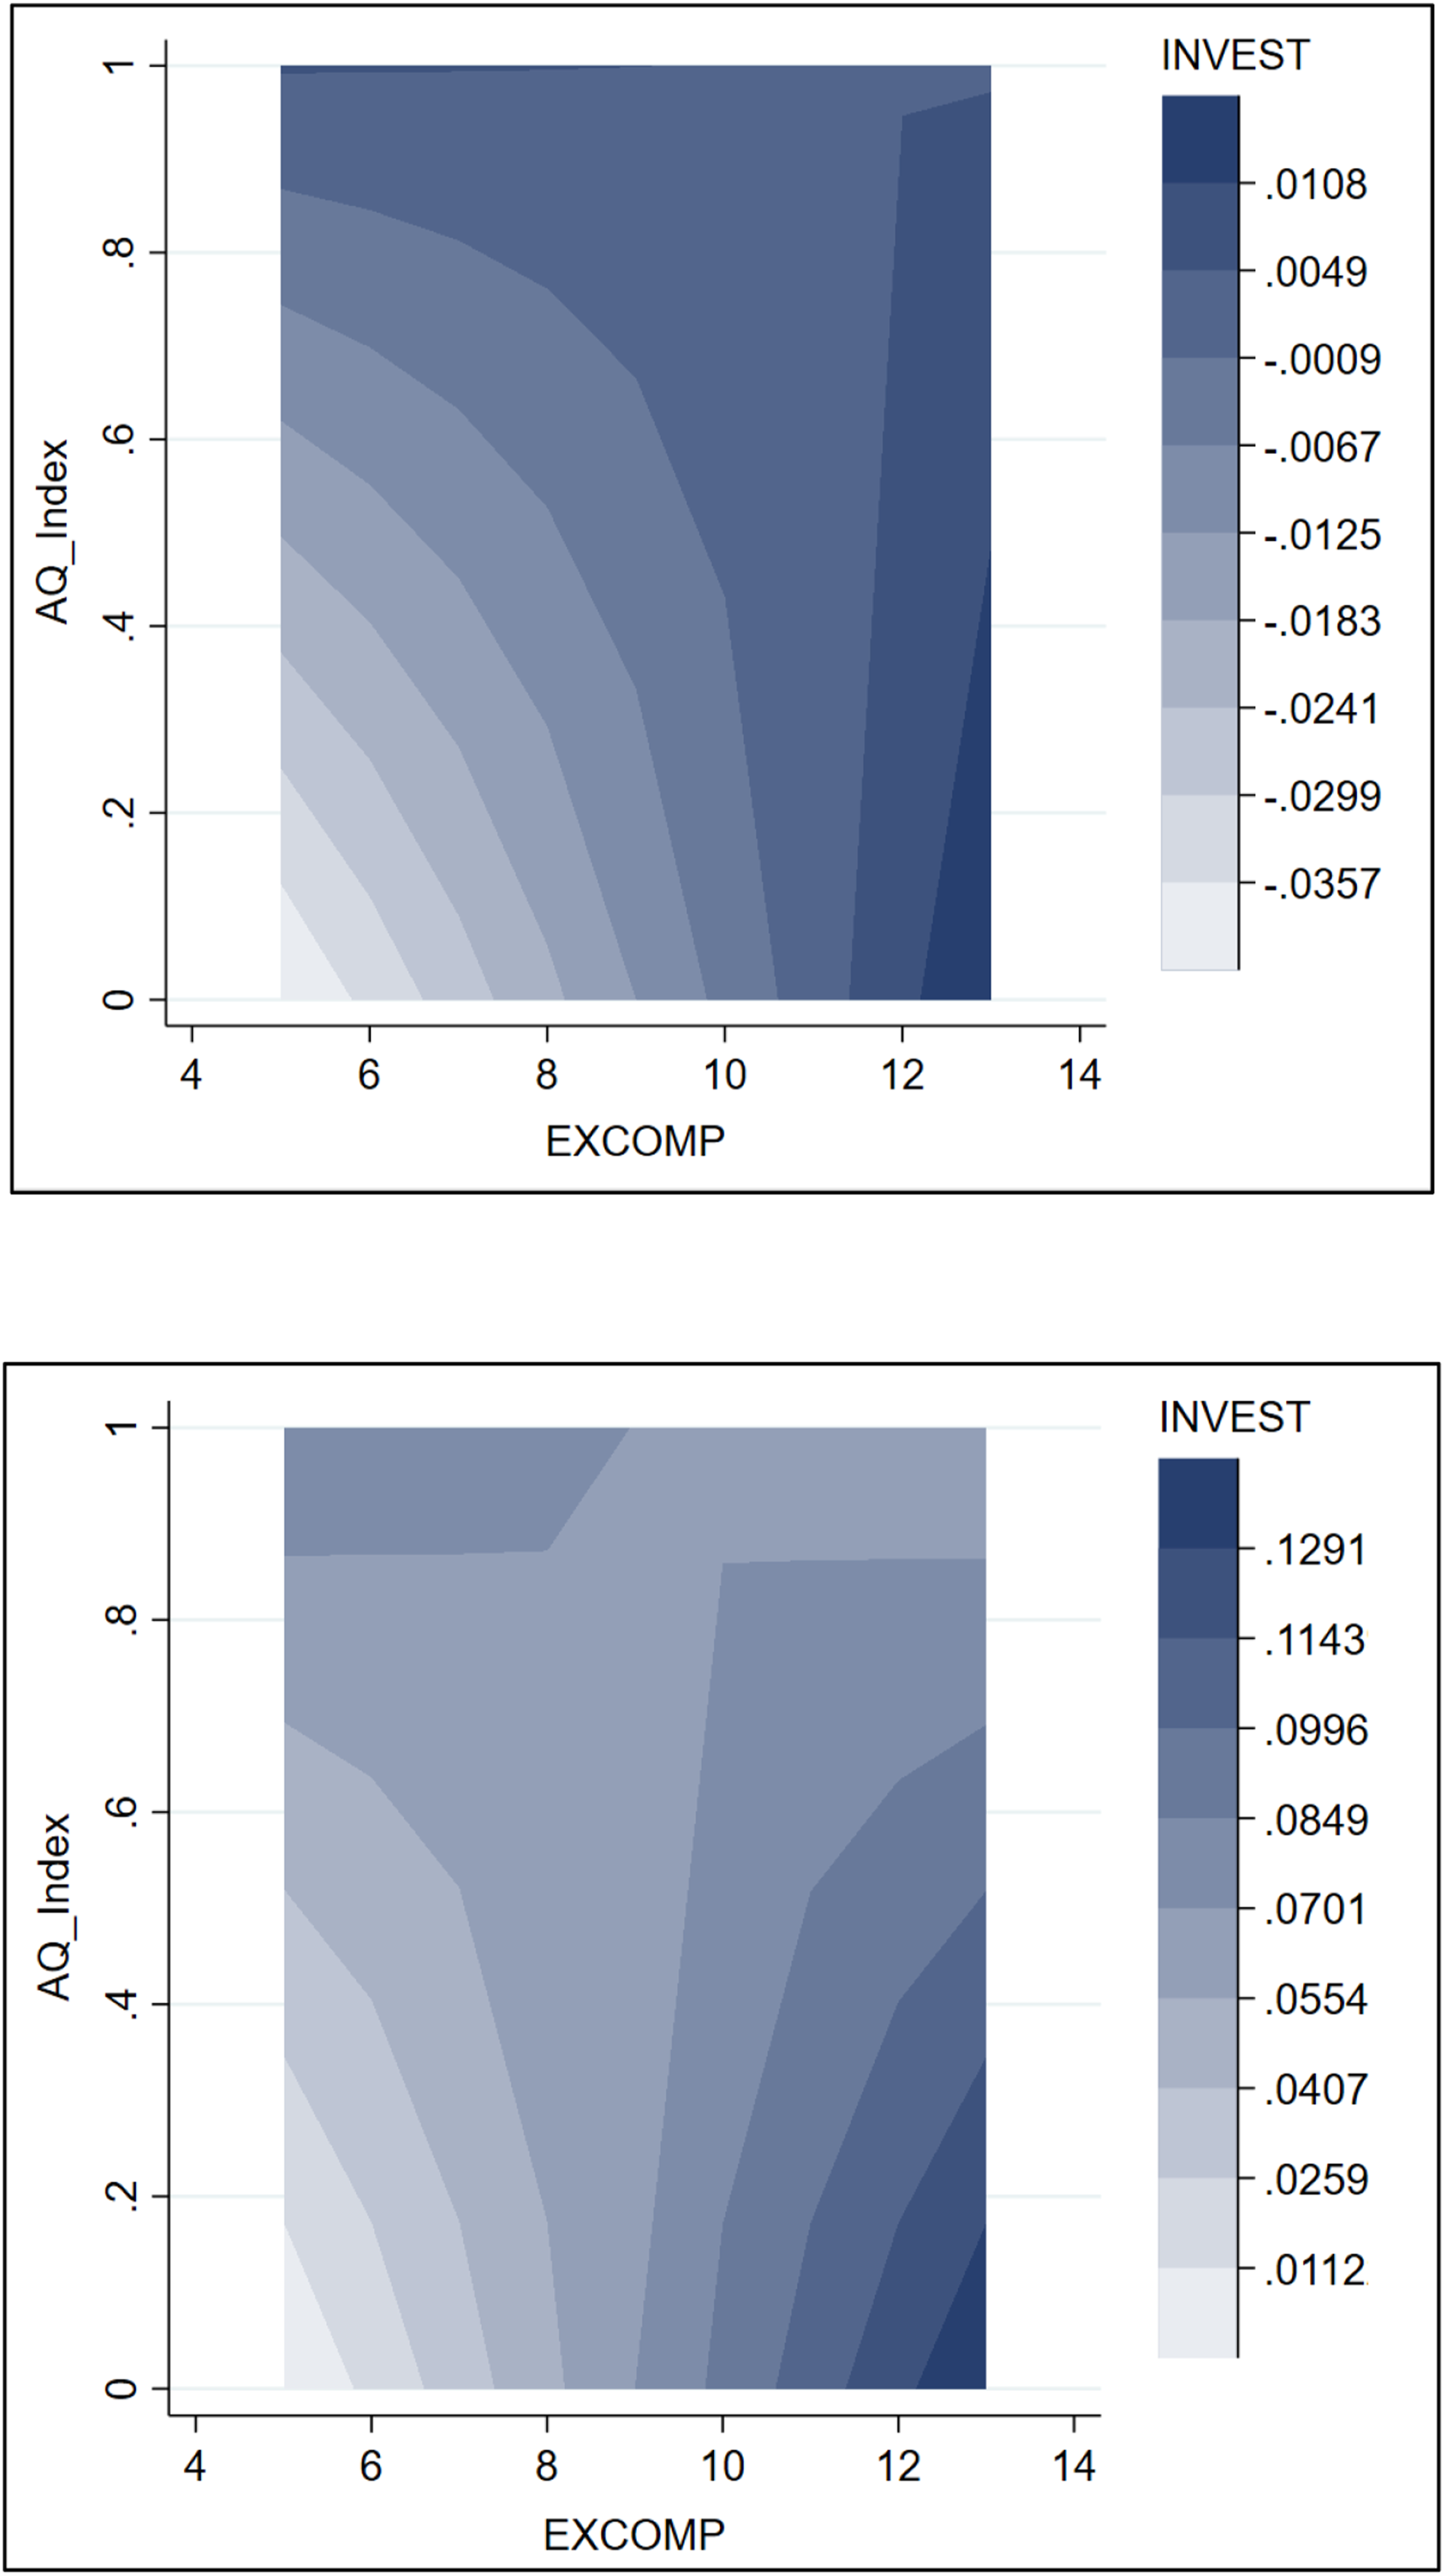
Moderating Role of Accounting Quality.
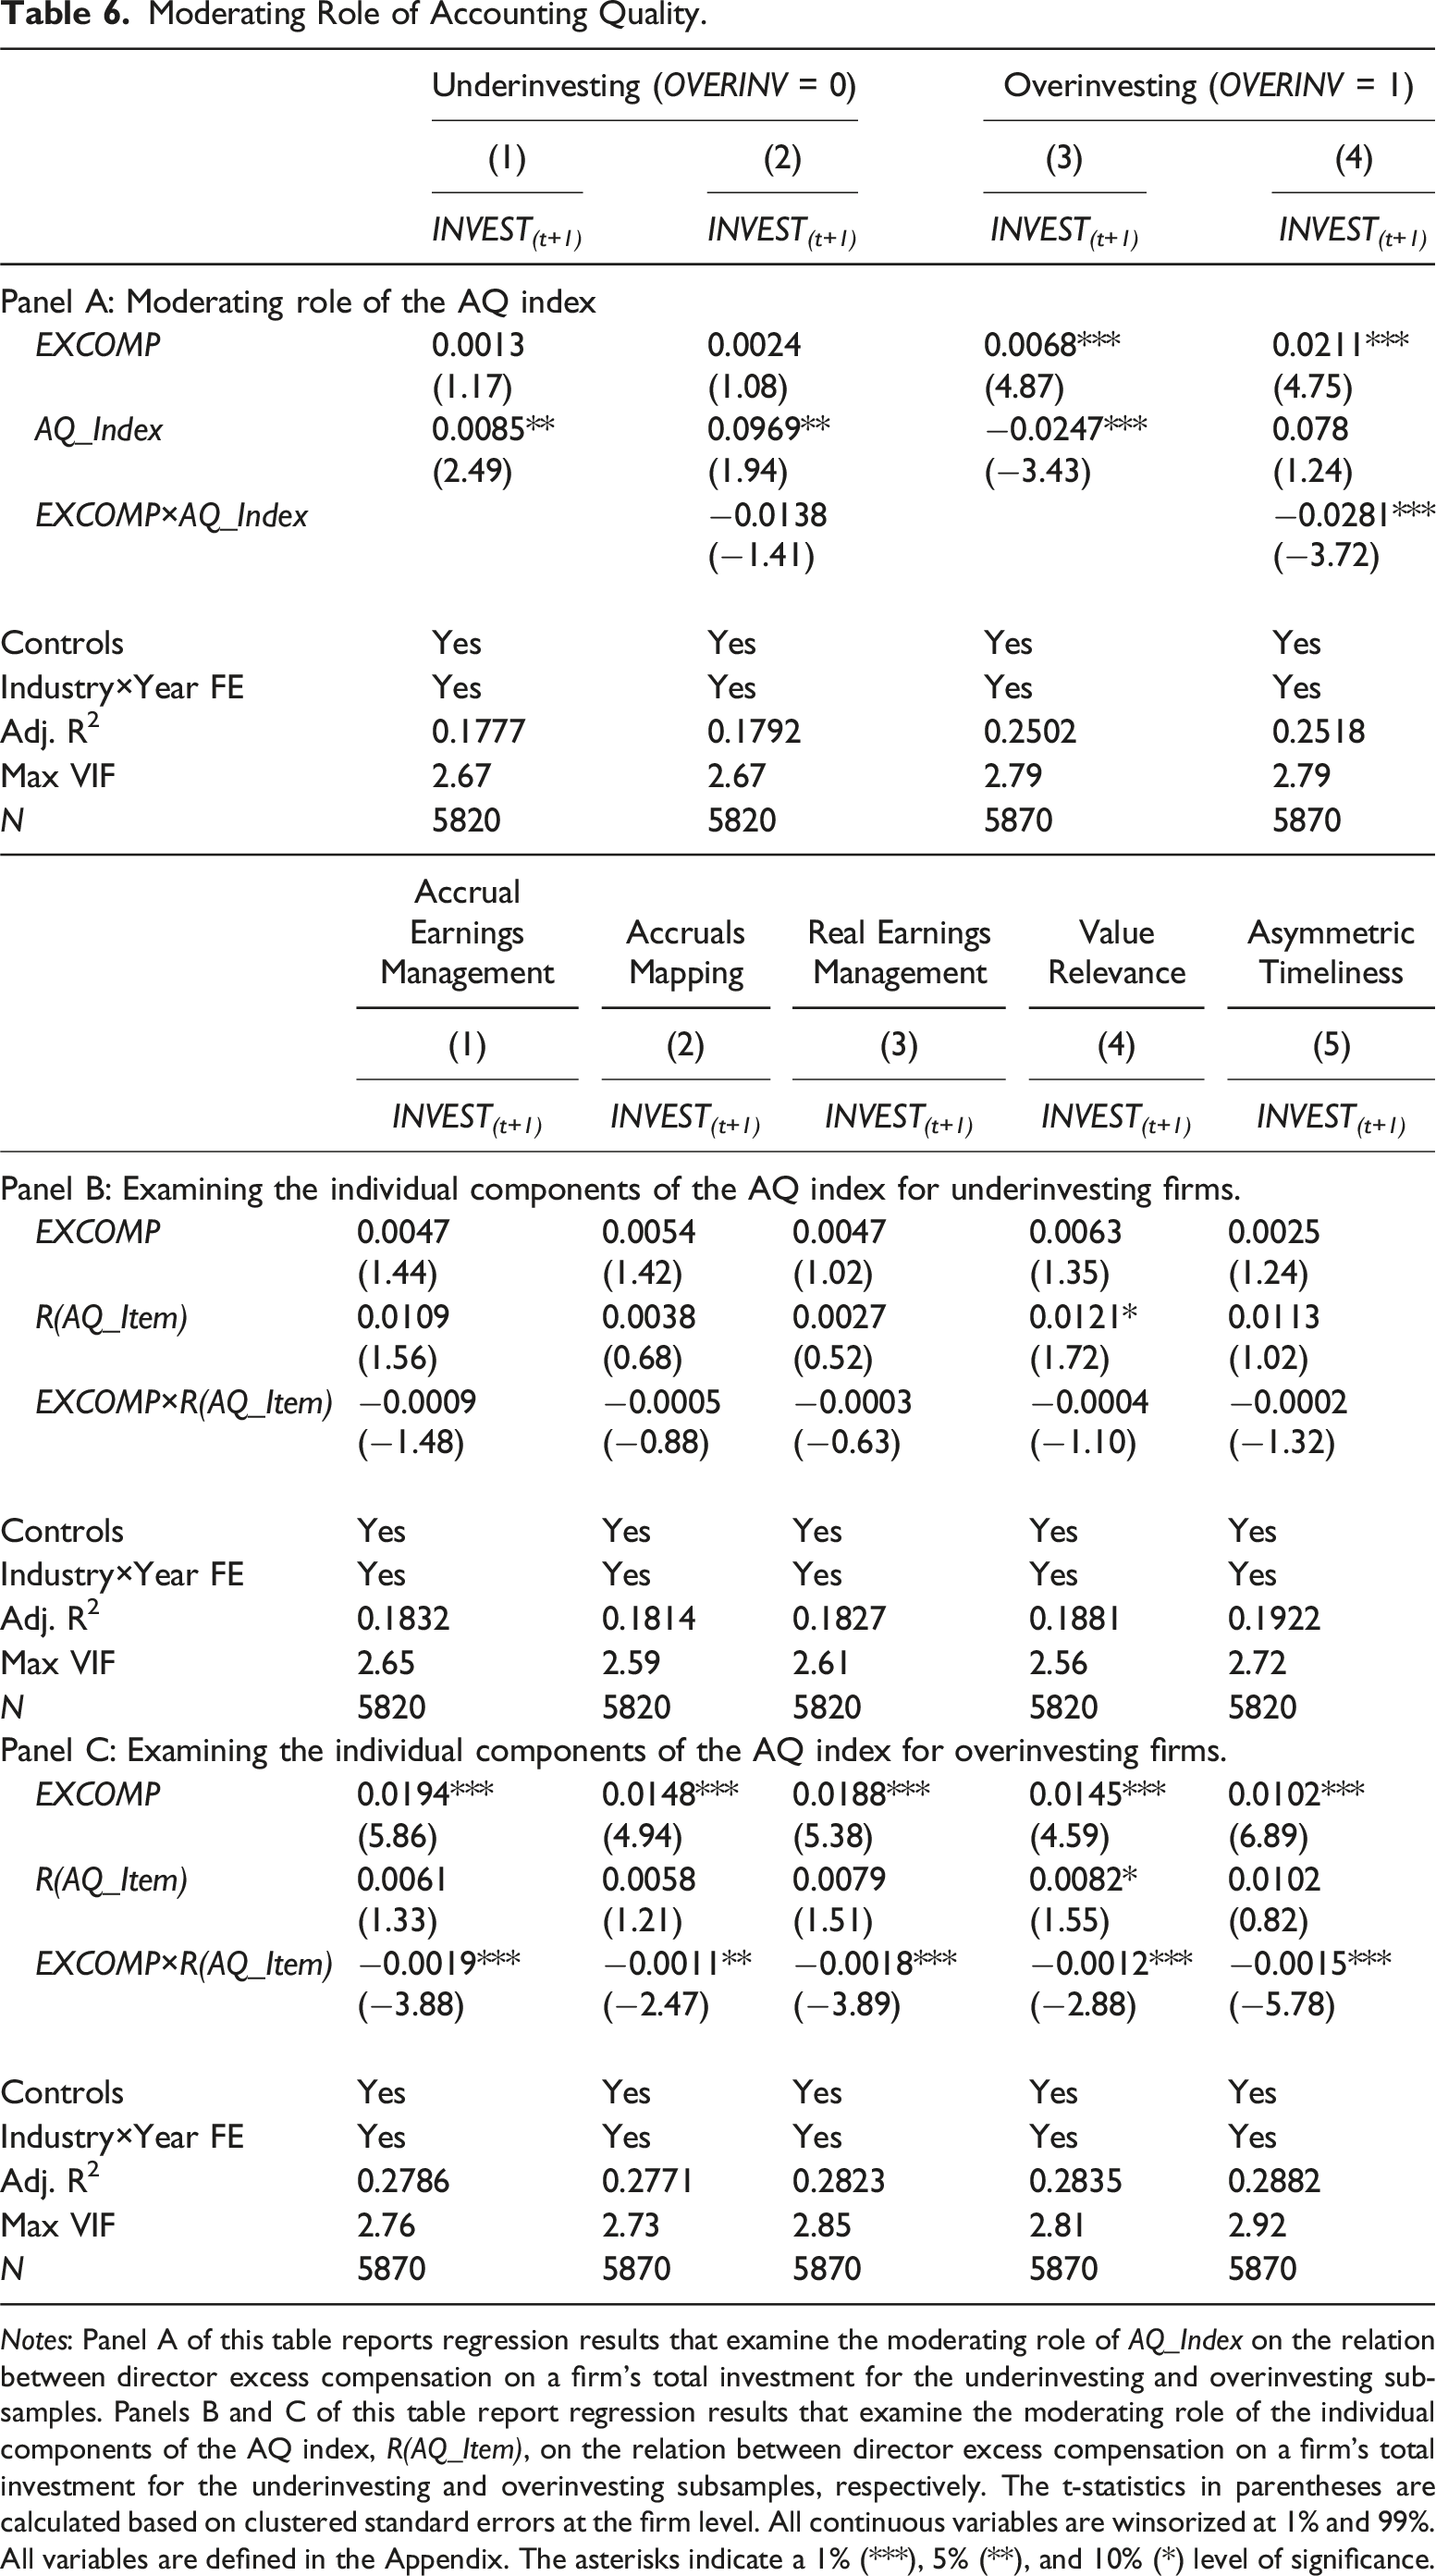
Notes: Panel A of this table reports regression results that examine the moderating role of AQ_Index on the relation between director excess compensation on a firm’s total investment for the underinvesting and overinvesting subsamples. Panels B and C of this table report regression results that examine the moderating role of the individual components of the AQ index, R(AQ_Item), on the relation between director excess compensation on a firm’s total investment for the underinvesting and overinvesting subsamples, respectively. The t-statistics in parentheses are calculated based on clustered standard errors at the firm level. All continuous variables are winsorized at 1% and 99%. All variables are defined in the Appendix. The asterisks indicate a 1% (***), 5% (**), and 10% (*) level of significance.
In order to test whether the results from Table 6 Panel A are driven by the individual components of the AQ index, we re-estimate the model in equation (4) using the components and present the results for the underinvesting and the overinvesting firms in Table 6 Panels B and C, respectively. Consistent with the results in Panel A for the underinvesting subsample, Panel B shows that the coefficient on the interaction term EXCOMP×AQ_Item is insignificant for all five AQ index components. For the overinvesting subsample, the results in Panel C for all five AQ index components are consistent with our findings in Panel A for the composite AQ index. That is, all five accounting quality measures contribute to mitigate the detrimental effect of director excess compensation on investment efficiency.
Cross-Sectional Variation Across AQ Quintiles.
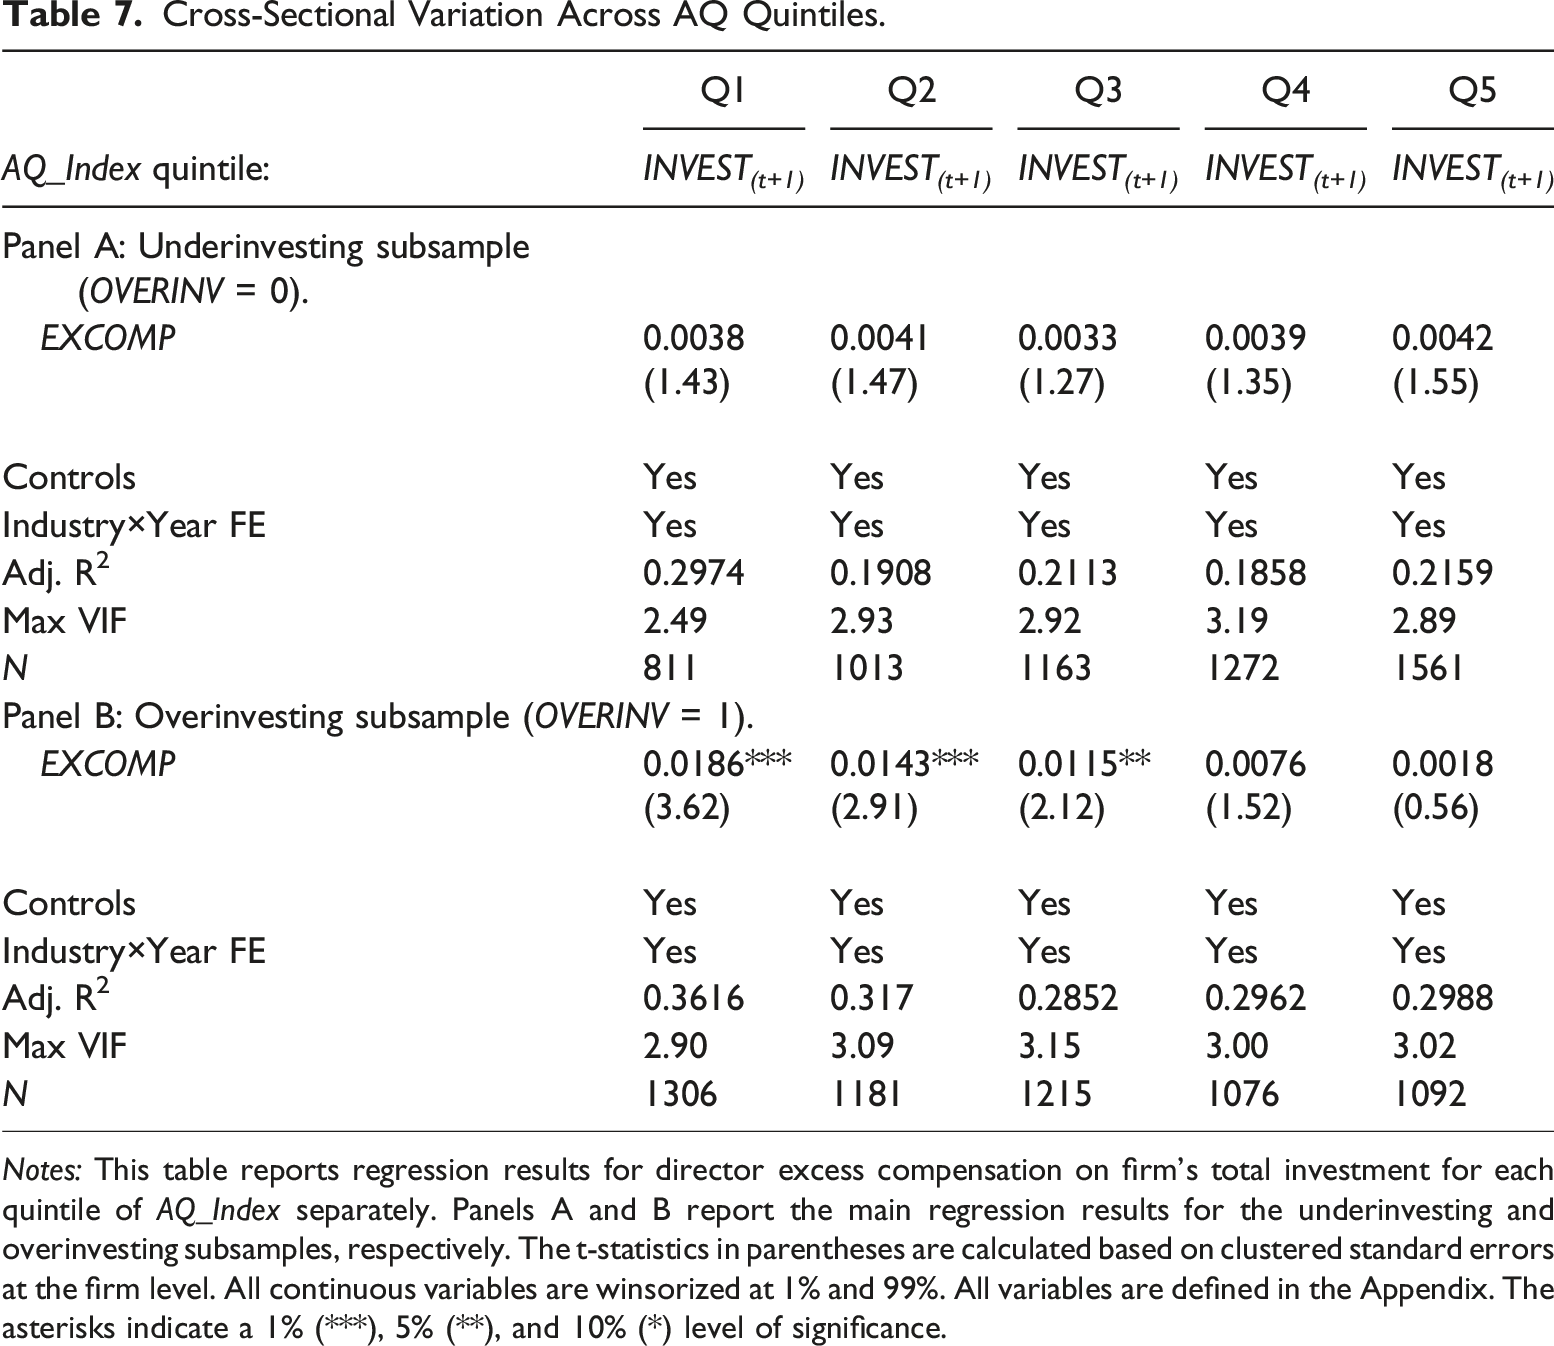
Notes: This table reports regression results for director excess compensation on firm’s total investment for each quintile of AQ_Index separately. Panels A and B report the main regression results for the underinvesting and overinvesting subsamples, respectively. The t-statistics in parentheses are calculated based on clustered standard errors at the firm level. All continuous variables are winsorized at 1% and 99%. All variables are defined in the Appendix. The asterisks indicate a 1% (***), 5% (**), and 10% (*) level of significance.
In general, we do not observe a significant relation between director excess compensation and investment efficiency for the different levels of accounting quality in the underinvesting subsample. By contrast, the results for the overinvesting subsample show a favorable impact of accounting quality on the association between director excess compensation and investment efficiency. The unfavorable impact of director excess compensation on investment efficiency is greatest in the lowest quintile of accounting quality and monotonically decreases as accounting quality increases from quintile Q1 to quintile Q5. This result is evident from the coefficient on EXCOMP, which decreases from 0.0186 in quintile Q1 to 0.0018 in quintile Q5. Also of interest in Table 7 are the coefficients on EXCOMP for quintiles Q4 and Q5, which are both insignificant. These findings suggest that for firms in quintiles Q4 and Q5, the effect of accounting quality offsets the unfavorable impact of director excess compensation on investment efficiency so that these firms no longer exhibit (over)investment inefficiency. Overall, the results in Table 7 provide additional support for hypothesis H2 that accounting quality moderates the unfavorable impact of director excess compensation on investment efficiency for overinvesting firms.
Additional Analyses
Cash and Equity Excess Compensation
Equity and Cash Components of Director Excess Compensation.
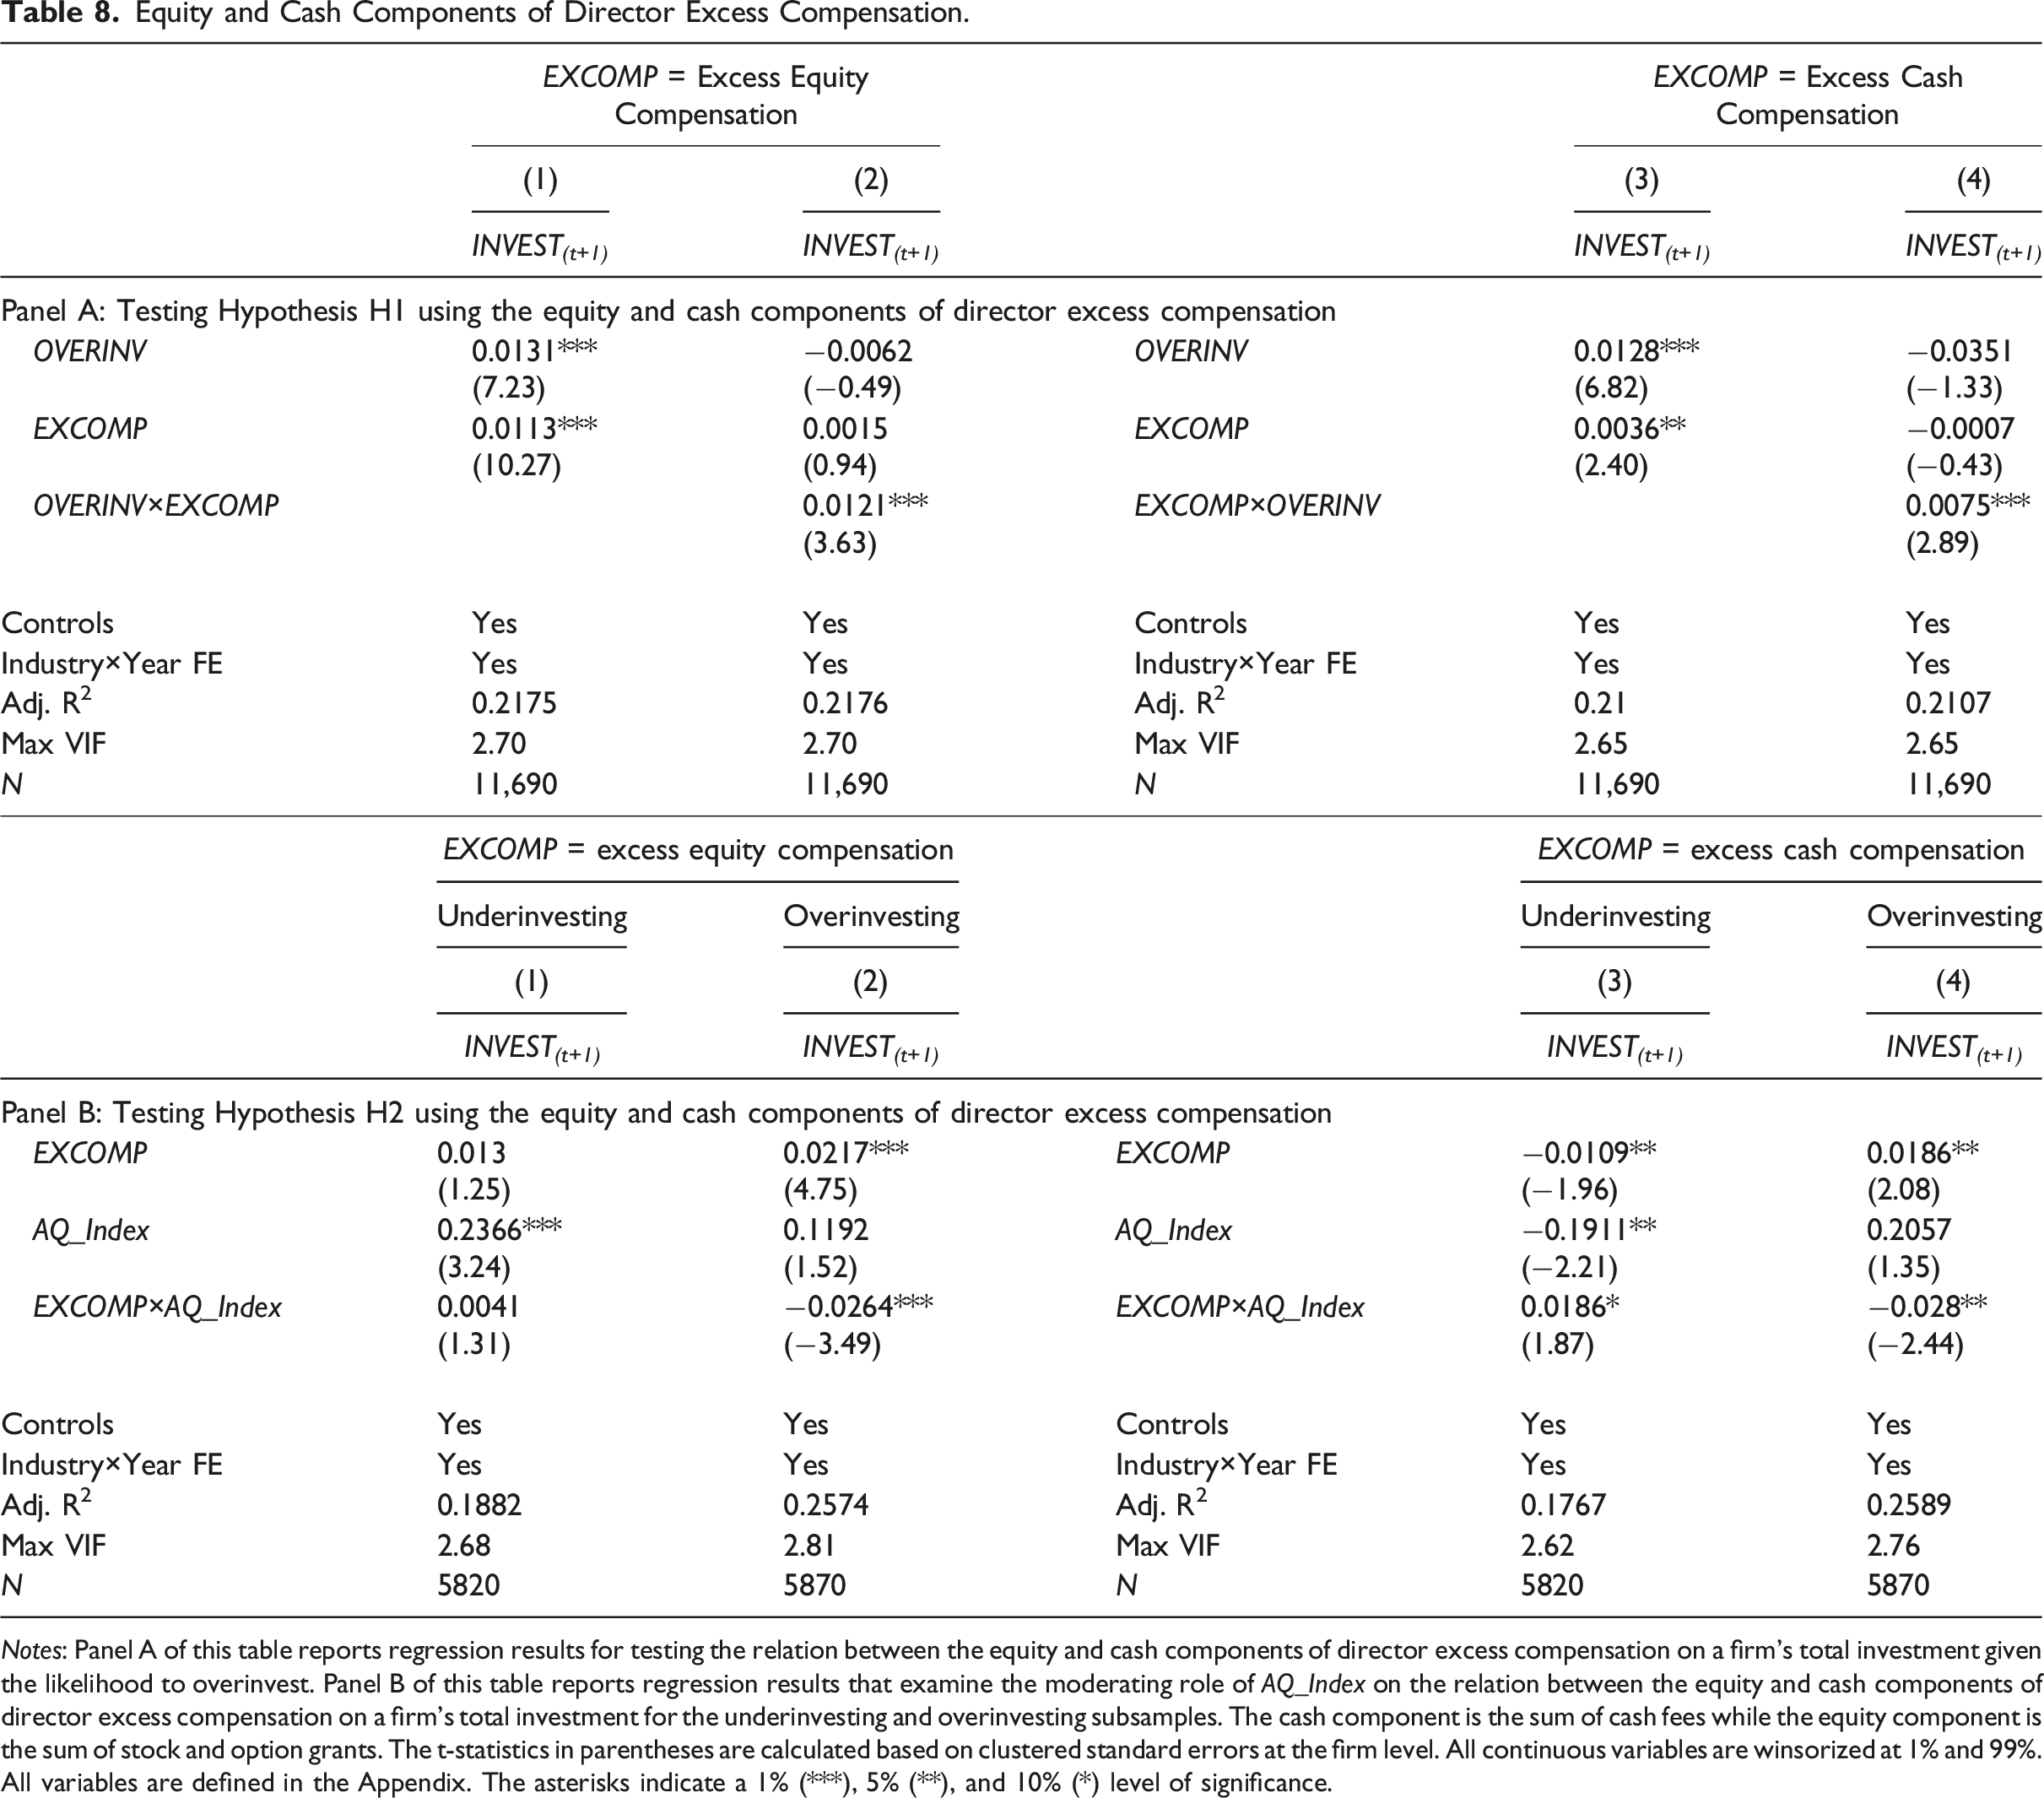
Notes: Panel A of this table reports regression results for testing the relation between the equity and cash components of director excess compensation on a firm’s total investment given the likelihood to overinvest. Panel B of this table reports regression results that examine the moderating role of AQ_Index on the relation between the equity and cash components of director excess compensation on a firm’s total investment for the underinvesting and overinvesting subsamples. The cash component is the sum of cash fees while the equity component is the sum of stock and option grants. The t-statistics in parentheses are calculated based on clustered standard errors at the firm level. All continuous variables are winsorized at 1% and 99%. All variables are defined in the Appendix. The asterisks indicate a 1% (***), 5% (**), and 10% (*) level of significance.
The results show that both components of director excess compensation exhibit significant results, yet the economic (and statistical) significance of the coefficients of interest is more salient for the equity component. The results complement our prior findings in Tables 4 and 6 While Panel A highlights the unfavorable effect of excess compensation on overinvestment, Panel B confirms the favorable impact of accounting quality in moderating this relation. These findings are consistent with Dah and Frye (2017) who document a negative relation between excess equity compensation and board efficiency, and with Biddle et al. (2009) who highlight the favorable impact of financial reporting quality on investment allocations.
Controlling for Endogeneity
In this section, we employ a dynamic generalized method of moments (GMM) approach to alleviate potential endogeneity concerns and increase the robustness of our findings (Wintoki et al., 2012). OLS and fixed effect estimations may lead to a bias in estimated coefficients in the presence of endogeneity. Following Arellano and Bover (1995), our system GMM estimation facilitates evaluation of the effect of accounting quality, director excess compensation, and their interaction, on investment efficiency in both levels and first differences contemporaneously. GMM addresses the following three endogeneity factors: dynamic endogeneity, simultaneity, and unobservable heterogeneity. Dynamic endogeneity relates to the probable impact of past investment decisions on prevailing governance arrangements pertaining to monitoring measures and directorship incentives. For example, managers with an opportunistic overinvestment track record may want to sustain these endeavors and private gains by overpaying board members and adopting less transparent accounting practices. Simultaneity implies that the firm’s governance structure and investment allocations may be mutually determined. In that sense, an entrenched governance environment might simultaneously and adversely shape the firm’s resource allocation, director pay, and accounting practices. Alternatively, well-performing companies may overcompensate board members while engaging in more aggressive investments, suggesting potential biases. Unobservable heterogeneity refers to the presence of unobservable factors and characteristics affecting both the firm’s corporate governance environment and investment efficiency. In this context, hidden elements such as managerial personal traits, firm culture, and outside forces may influence the firm’s investment allocations and governance practices.
Addressing Endogeneity Concerns.
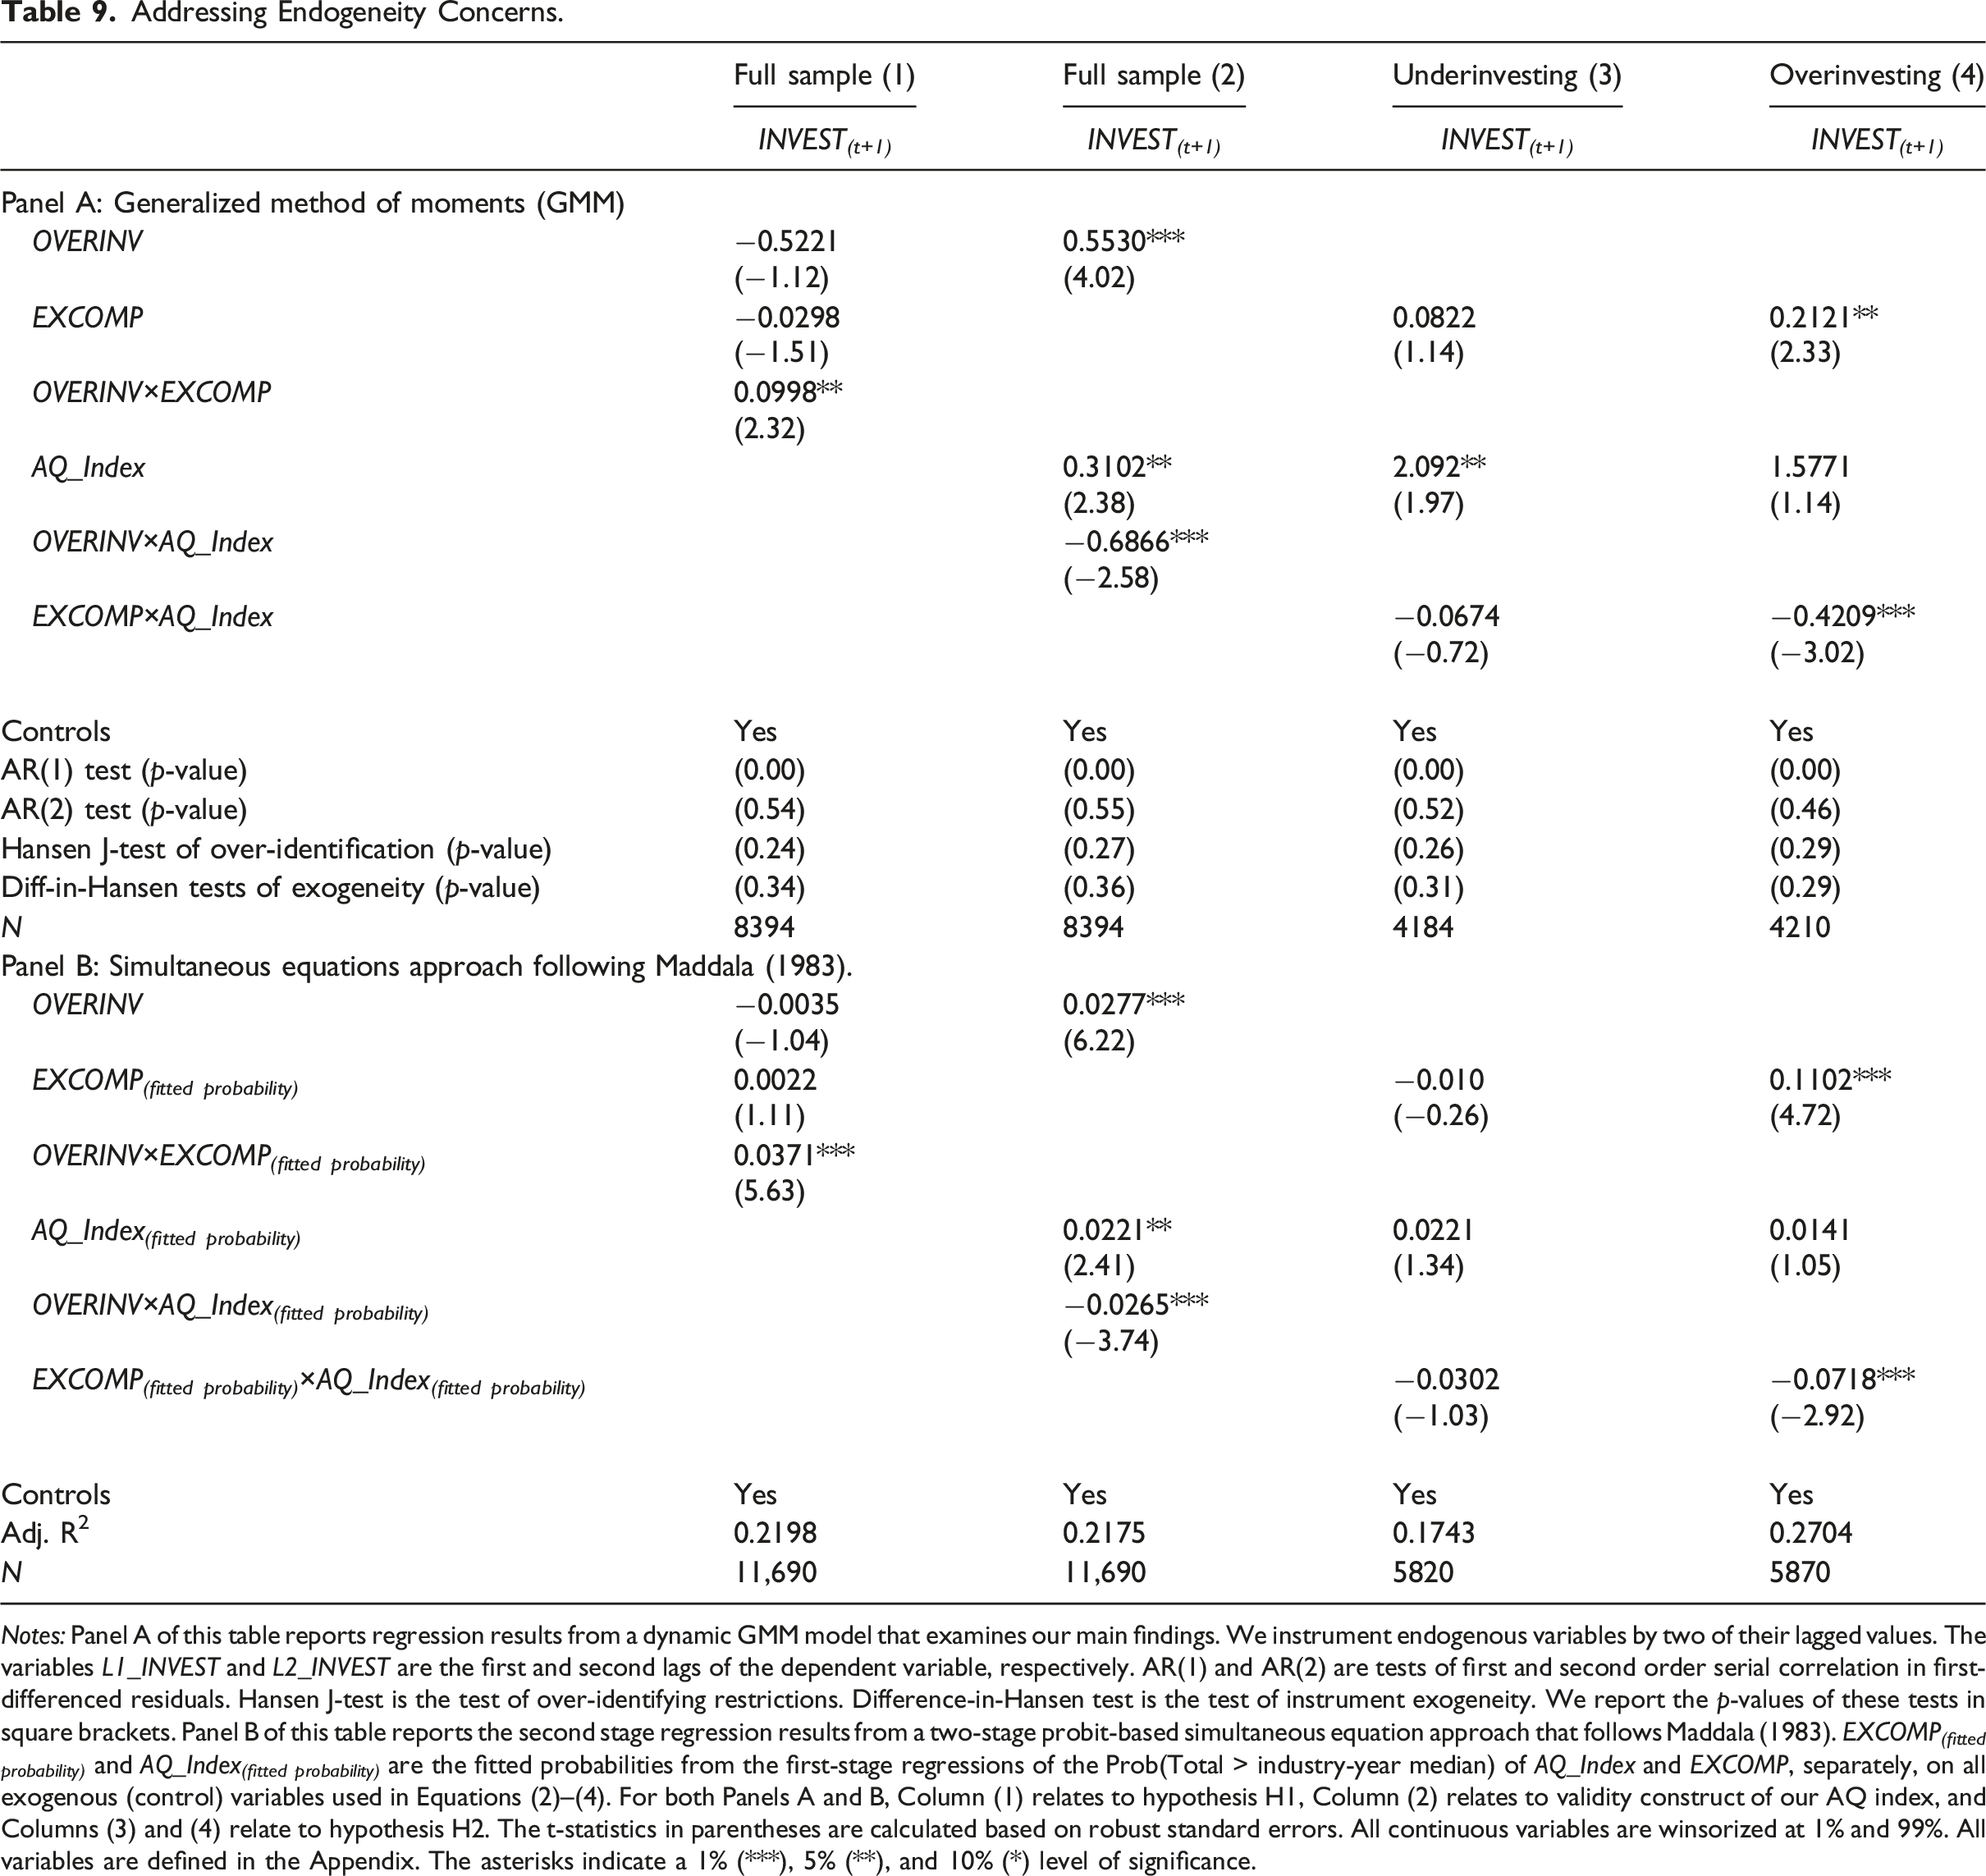
Notes: Panel A of this table reports regression results from a dynamic GMM model that examines our main findings. We instrument endogenous variables by two of their lagged values. The variables L1_INVEST and L2_INVEST are the first and second lags of the dependent variable, respectively. AR(1) and AR(2) are tests of first and second order serial correlation in first-differenced residuals. Hansen J-test is the test of over-identifying restrictions. Difference-in-Hansen test is the test of instrument exogeneity. We report the p-values of these tests in square brackets. Panel B of this table reports the second stage regression results from a two-stage probit-based simultaneous equation approach that follows Maddala (1983). EXCOMP (fitted probability) and AQ_Index (fitted probability) are the fitted probabilities from the first-stage regressions of the Prob(Total > industry-year median) of AQ_Index and EXCOMP, separately, on all exogenous (control) variables used in Equations (2)–(4). For both Panels A and B, Column (1) relates to hypothesis H1, Column (2) relates to validity construct of our AQ index, and Columns (3) and (4) relate to hypothesis H2. The t-statistics in parentheses are calculated based on robust standard errors. All continuous variables are winsorized at 1% and 99%. All variables are defined in the Appendix. The asterisks indicate a 1% (***), 5% (**), and 10% (*) level of significance.
In all four models, we present the p-values for the Hansen J-test of over-identifying restrictions, the Arellano and Bond (1991) test of first and second order autocorrelation in first-differenced residuals (AR(1) and AR(2)), and the Difference-in-Hansen test of instrument exogeneity. The reported test statistics endorse the specification of our models and the validity of the employed instruments. The insignificance of the Hansen J-test of over-identifying restrictions suggests that the validity of our instruments cannot be rejected. While the test statistic on AR(1) suggests the presence of first order serial correlation in first differences, the test statistic on AR(2) cannot reject the null hypothesis of no autocorrelation. Lastly, the insignificance of the Difference-in-Hansen test affirms the instruments’ validity as the null hypothesis of exogeneity of utilized instruments cannot be rejected.
To further alleviate endogeneity concerns, we utilize a two-stage probit-based approach introduced by Maddala (1983) and detailed in Wooldridge (2010). This approach involves a first-stage probabilistic transformation of the endogenous variable, after which the transformed variable is regressed on all exogenous variables. In the second stage, the main regression of interest is performed using the fitted probabilities from the first-stage regression (e.g., Coles et al., 2006; Leuz & Verrecchia, 2000; Vermeer et al., 2014). 13 Table 9 Panel B reports regression results that mimic those reported in Panel A while using the two-stage simultaneous estimation approach of Maddala (1983). The results confirm the unfavorable impact of director excess compensation on investment efficiency, the favorable effect of accounting quality in curbing overinvestment, and the moderating role of accounting quality on the overcompensation–investment efficiency association among overinvesting firms.
Unobserved Time-Invariant Heterogeneity.
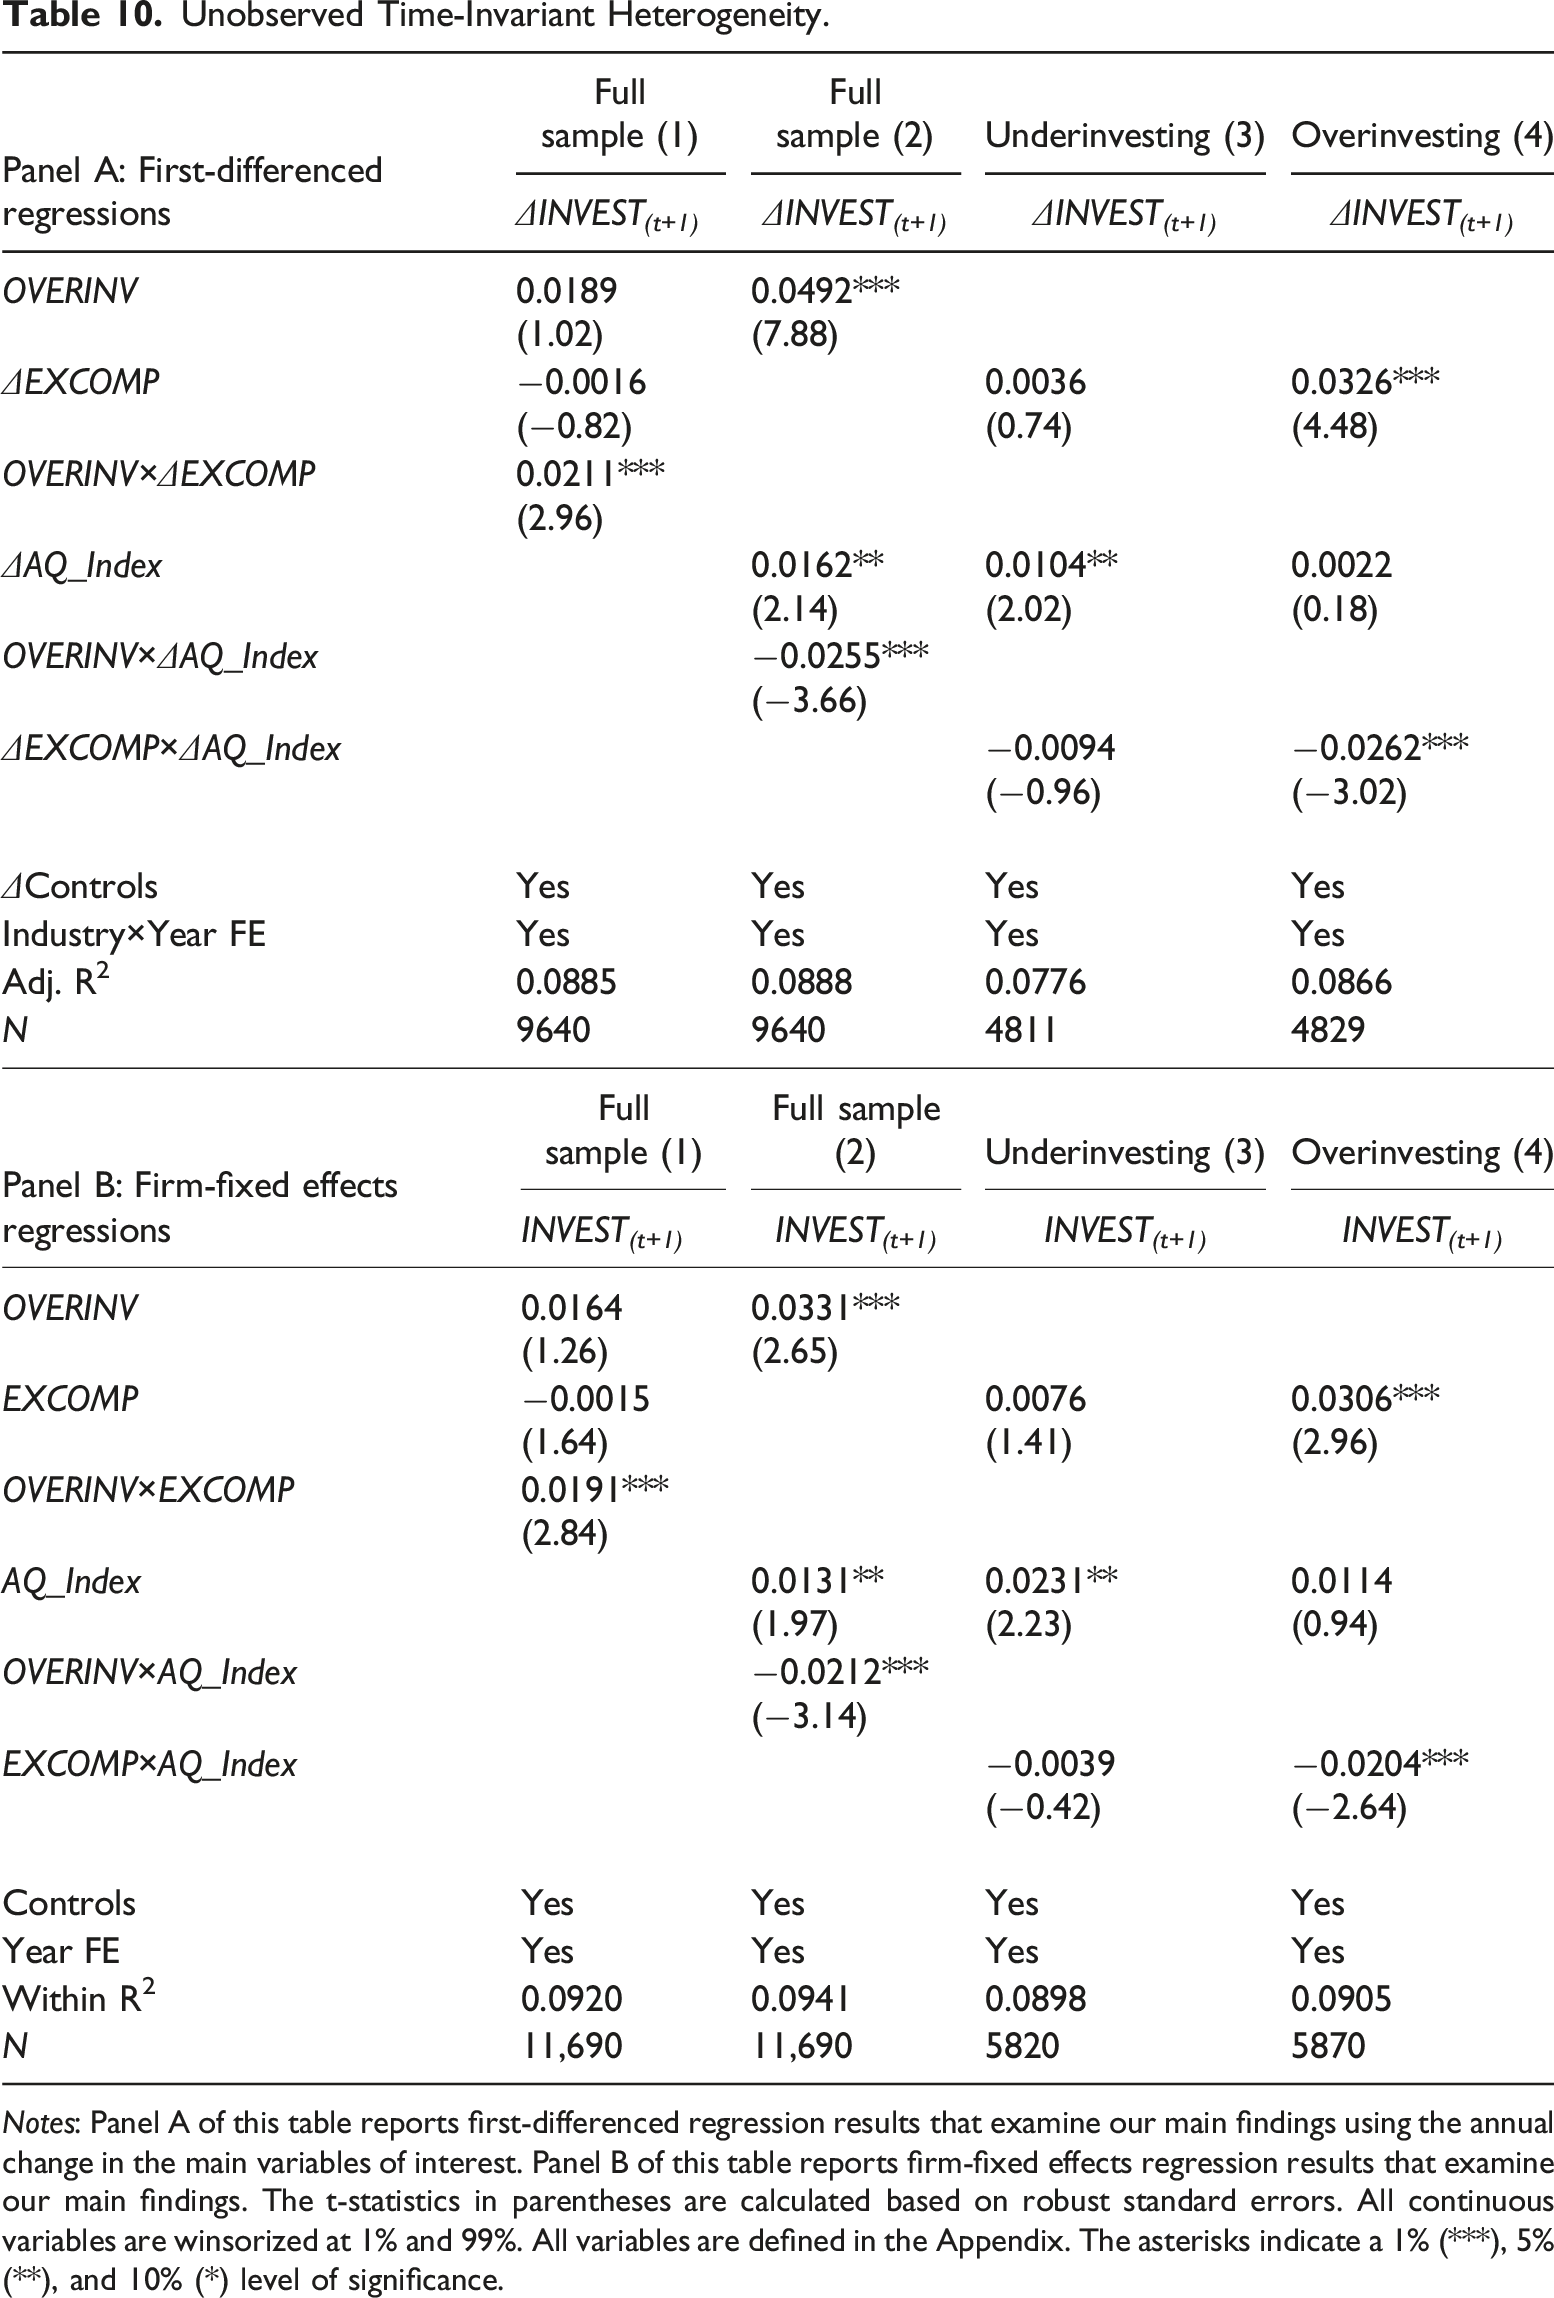
Notes: Panel A of this table reports first-differenced regression results that examine our main findings using the annual change in the main variables of interest. Panel B of this table reports firm-fixed effects regression results that examine our main findings. The t-statistics in parentheses are calculated based on robust standard errors. All continuous variables are winsorized at 1% and 99%. All variables are defined in the Appendix. The asterisks indicate a 1% (***), 5% (**), and 10% (*) level of significance.
Additional Tests
Stochastic frontier analysis, as with all econometric models, faces its own constraints and challenges. A limitation of cost-minimization SFA is its inability to identify undercompensated board members as actual compensation is restrained to lie on or above the unobservable efficient compensation frontier. However, the significance of the pros and cons of both OLS and SFA is not easily quantifiable. In that sense, identifying the superiority of one methodology over the other relies on the specific empirical setting and, in many cases, is a matter of conception. Given our paper’s emphasis on overpaid directors, SFA’s advantageous statistical features in isolating random noise, and the fact that the extant literature largely focuses on director overcompensation and its negative consequences on the corporate governance mechanism (Brick et al., 2006; Chen et al., 2019; Dah & Frye, 2017; Hope et al., 2019), we utilize SFA to compute director excess compensation in our main analysis, as opposed to the traditional residual-based estimation method.
Nonetheless, in this section, we repeat our empirical analyses using the residual-based method (Brick et al. 2006; Dah and Frye 2017) to estimate director excess compensation. That is, we define excess compensation as the residuals from an OLS regression of director total compensation on its hypothesized determinants. In estimating residuals, we employ the same director total compensation determinants reported in Table S1 of the Online Supplemental Appendix S1. Our untabulated results confirm the robustness of our main findings for H1 and H2. Specifically, the OLS residual-based findings highlight the opportunistic impact of director excess compensation on investment policy and show that accounting quality alleviates the adverse impact of director excess compensation on overinvestment.
In addition, to better comprehend the drivers of director excess compensation and the consequent associated director behavior, we now estimate the director compensation determinant model at the director-level instead of the firm level. Specifically, we first compute director excess compensation for each director and then average the excess compensation values at the firm level. In doing so, we incorporate director characteristics (gender, age, interlocks, and financial expertise) and committee memberships (audit committee, compensation committee, and governance committee) as additional determinants of director pay. The results are reported in Table S3.2 of the Online Supplemental Appendix S3 and are consistent with our main findings.We next investigate whether our findings hold when employing an alternative proxy for overinvestment. Following Biddle et al. (2009), we proxy for the likelihood of overinvestment using a ranked variable based on the firm’s cash balance and financial leverage.
We expect the likelihood of overinvesting to increase in the available cash balance and decrease in the level of financial leverage. As such, we rank firms into deciles based on cash and leverage (we multiply leverage by minus one so that both variables are increasing in the likelihood of overinvestment). A higher (lower) rank suggests that the firm is more (less) likely to overinvest. Then, we divide firms into two groups based on their likelihood of overinvesting. Unreported results confirm that our inferences hold when using this alternative proxy for overinvestment.
Lastly, we address possible multicollinearity concerns in our empirical analysis by reporting the maximum variance inflation factor (VIF) in all our regressions. All VIF values are well below the critical threshold of 5, alleviating the concern with multicollinearity. Although the VIFs do not suggest any concerning multicollinearity in our regression models, we further address the interrelation between director excess compensation and accounting quality by orthogonalizing the two variables. Specifically, we regress accounting quality on director excess compensation and vice versa, utilizing the residuals from both regressions—that is, orthogonalized accounting quality and orthogonalized director excess compensation—in all main regressions. The unreported results are consistent with our prior findings, suggesting that accounting quality moderates the unfavorable relation between director excess compensation and investment efficiency.
Conclusions
We present evidence that the functionality of corporate boards is compromised when directors are overcompensated. In this context, our study also highlights the significance of the corporate information environment in strengthening firms’ governance mechanisms and limiting directors’ opportunistic behavior.
The elected board members may sacrifice shareholders’ interests to appease firm management and extract private benefits. Socialization and collusion between directors and firm executives exacerbate agency problems and moral hazard. Consequently, weak governance structures pave the way for director and manager rent extraction by diverting firm resources towards self-benefiting investments. In this study, we examine whether excessively compensated directors influence firms’ investing decisions. Moreover, given that accounting reports are the primary means of communication between insiders and shareholders (Lambert, 2001; Leuz & Wysocki, 2016), we further investigate the implications of accounting quality for the association between director overcompensation and corporate investment efficiency. To examine our research questions, we employ a novel cost-minimization stochastic frontier approach analysis to compute director excess compensation and a composite accounting quality index that captures accruals and real earnings management activities, value relevance of accounting numbers, and asymmetric timeliness in loss recognition.
Using a sample of S&P 1500 firms spanning the period 2007–2018, we show that director excess compensation has a detrimental effect on corporate investment efficiency. Specifically, our findings highlight a direct association between director excess compensation and overinvestment. In addition, we demonstrate that accounting quality alleviates the unfavorable impact of director excess compensation on investment allocations. The beneficial role of accounting is more salient for overinvesting firms, where that role reaches its peak somewhere between the third and the fourth quintiles of the AQ index, after which it reaches a state of equilibrium. In effect, the adverse effect of director excess compensation on investment efficiency is nullified at high levels of accounting quality.
We subject our results to a battery of additional tests that examine the components of director compensation, address potential endogeneity concerns, and utilize alternative measures of director excess compensation and the likelihood of overinvestment. Our findings call for careful assessment of director compensation packages and their consequent impact on board monitoring and firm investments. We also emphasize the fundamental economic role of accounting quality in strengthening governance structure and mitigating agency problems.
Supplemental Material
Supplemental Material - Director Excess Compensation and Investment Efficiency: The Economic Role of Accounting
Supplemental Material for Director Excess Compensation and Investment Efficiency: The Economic Role of Accounting by Bilal Al Dah, Mustafa Dah, Mostafa Harakeh, and Gerald J. Lobo in Journal of Accounting, Auditing & Finance.
Footnotes
Acknowledgments
We thank Stephannie Larocque, the associate editor, and three anonymous referees for their constructive comments and suggestions. We are also grateful for helpful comments of Anwer Ahmed, John Hand, Kevin Keasy, Edward Lee, Stergios Leventis, Mohamed Ghaly, Lakshmanan Shivakumar, Konstantinos Stathopoulos, Nikolaos Tsileponis, Martin Walker, and Steven Young, as well as participants of the seminar presentation at the American University of Beirut (Beirut, Lebanon).
Declaration of Conflicting Interests
The author(s) declared no potential conflicts of interest with respect to the research, authorship, and/or publication of this article.
Funding
The author(s) received no financial support for the research, authorship, and/or publication of this article.
Supplemental Material
Supplemental material for this article is available online.
Notes
Variable definitions
Variable (sorted)
Definition
%CEOSH
Percentage of shares held by the CEO
%INSIDER
Percentage of insider directors on the board
ADV
Advertising expenditure divided by total assets. Missing values are replaced with 0
ADV_ZD
Dummy variable that equals 1 if ADV is non-zero, and 0 otherwise
AGE
Firm age, computed as the difference between the current year and the IPO date
AQ_Index
Accounting quality index constructed at the firm level, includes five accounting quality measures, and ranges in value between 0 and 1. The five measures proxy for accruals earnings management, the extent to which working capital accruals map into operating cash flows, real-activity earnings management, value relevance of accounting numbers, and asymmetric timely loss recognition
AQ_Index
(fitted probability)
Fitted probabilities from regressing the Prob(Total > industry-year median) of AQ_Index on all exogenous (control) variables used in equations (2)–(4)
BODSIZE
Number of directors on the board
CAPX
Capital expenditure divided by total assets
CEOCOMP
CEO total compensation, defined as the sum of the CEO salary, bonus, the Black-Scholes value of options granted, the value of restricted stock granted, long-term incentive payouts, and all other compensation
CEODUAL
Dummy variable that equals 1 if the CEO is also the chairman of the board, and 0 otherwise
DELTA
Change in the dollar value of the executive’s wealth (in millions) for a one percentage change in stock price (Coles et al., 2006)
DCOMP
Total director compensation reported in SEC filings, defined as the sum of the director’s cash fees, stock grants, option grants, and all other compensation
DIVDUM
Dummy variable that equals 1 if the firm pays dividends, and 0 otherwise
E_Index
Ordinal variable that ranges from 0 to 6 following Bebchuk et al. (2009)
ECON
Mean squared errors of the residuals from the regression of the firm’s stock return on industry and market stock returns using 2 years of monthly data (year t and year t−1)
EMPL
Number of employees
EXCOMP
Natural logarithm of excess mean directors’ compensation, computed as the value above minimum compensation using a cost-minimizing stochastic frontier approach
EXCOMP
(fitted probability)
Fitted probabilities from regressing the Prob(Total > industry-year median) of EXCOMP on all exogenous (control) variables used in equations (2)–(4).
INVEST
Sum of research and development expenditure, capital expenditure, and acquisition expenditure less cash receipts from sale of property, plant, and equipment at the end of year t divided by total assets
LEV
Long-term debt divided by total assets
MTB
Market value to book value of equity
OCF
Cash flow from operating activities divided by total assets
OVERINV
Dummy variable that equals 1 if the residual value from the investment efficiency regression is above the annual median value, and 0 otherwise
PPE
Fixed assets (property, plant, and equipment) divided by total assets
Q
Proxy for Tobin’s Q, computed following Chung and Pruitt (1994)
R(AQ_Item)
Decile rank of each component of the accounting quality index
RND
Research and development expenditure divided by total assets. Missing values are replaced with 0 if capital expenditure is not missing
RND_ZD
Dummy variable that equals 1if RND is non-zero, and 0 otherwise
ROA
Net income before extraordinary items divided by total assets
SALES
Total net sales divided by total assets
SDOCF
Standard deviation of cash flow from operations divided by average total assets estimated over years t-5 to t-1
SDSALE
Standard deviation of sales divided by average total assets estimated over years t-5 to t-1
SEG
Number of business segments
SIZE
Natural log of total sales
Z_Score
Proxy measure for financial distress, computed following Altman (1968)
Author Biographies
References
Supplementary Material
Please find the following supplemental material available below.
For Open Access articles published under a Creative Commons License, all supplemental material carries the same license as the article it is associated with.
For non-Open Access articles published, all supplemental material carries a non-exclusive license, and permission requests for re-use of supplemental material or any part of supplemental material shall be sent directly to the copyright owner as specified in the copyright notice associated with the article.