
Abstract
With a surge in debt due to a fiscal stimulus after 2008, the Chinese government rolled out a “deleveraging” program in 2015, which, through tightening monetary policies, restricting credit flows, and regulating shadow banks, significantly increased firms’ cost of debt and the incentive to deleverage. We find that high-tax-rate firms reduce leverage to a lesser extent than low-tax-rate firms after the initiation of the deleveraging program. This effect is stronger for nonstate-owned firms and firms with fewer nondebt tax shields. More importantly, by retaining more debt, high-tax-rate firms reduce dividends, switch to equity financing to a lesser extent, and cut fewer investments in fixed assets, R&D and human capital. We conclude that taxes constitute an important factor in shaping the microeconomic consequences of a credit crunch and that economic incentives and property rights interact to affect capital structure.
Keywords
Introduction
Debt crises significantly impact the real economy. Eggertsson and Krugman (2012), in the wake of the global financial crisis, develop a model to explain the debt-driven economic slump by allowing some agents to be forced into rapid deleveraging. In addition to the global financial crisis, debt crises have occurred at other points in time, in different forms, and in different countries, notably the Great Depression (Benmelech et al., 2019), the junk bond crisis (Lemmon & Roberts, 2010), Japan’s “lost decade” (Koo, 2008), and episodes of banking crises across the world (Dell’Ariccia et al., 2008). The emerging literature has attempted to explain why debt crises arise and how they affect the real economy (Babina et al., 2023; Danielsson et al., 2023; Doerr et al., 2022; Greenwood et al., 2022; Liu et al., 2024).
The evolving literature on debt crises, however, has focused primarily on how adverse credit shocks affect firm performance (e.g., investment, employment, and growth) because of weakened balance sheets and a looming reduction in liquidity, that is, the balance sheet approach to macro shock transmissions (Bernanke & Gertler, 1989). In our research, we take a novel perspective by investigating the role of corporate taxes in debt crises. Two reasons suggest a potentially important tax effect. First, debt crises, by their nature, present direct and substantial shocks to firms’ cost of debt, a major form of external finance. Second, debt enjoys a tax shield that becomes more valuable during crises.
To foster identification, we exploit a large-scale government-initiated 2015 deleveraging program in China. Building on the classic tax-leverage link (Fischer & Jensen, 2019; Gordon & Lee, 2001; Graham, 1996; Heider & Ljungqvist, 2015; Miller, 1977; Modigliani & Miller, 1958, 1963; Rajan & Zingales, 1995; Wu & Yue, 2009), we start by addressing firms’ capital structure adjustments in response to the program, shaped by their marginal tax rates. Furthermore, and more importantly, we investigate whether the tax-leverage link has implications for firms’ ecosystem of corporate policies, including payout, financing and investment decisions.
The level of debt in China increased rapidly after the 2008 global financial crisis. The surge in debt was at least partially the result of a fiscal program that sent an RMB four-trillion stimulus package to counteract the impact of the global financial crisis on China’s economy (Chen et al., 2020). With the stimulus, investments increased, yet resource allocation efficiency and productivity did not improve. From 2008 to 2015, the debt-to-GDP ratio increased from 1.2 to 2.1 (Song & Xiong, 2018). A high level of debt ultimately became a significant concern for the government. In October 2015, the government rolled out the “deleveraging” program, which, through tightening monetary policies, restricting credit flows, and regulating shadow banks, significantly increased firms’ cost of debt and thus the incentive to deleverage.
Using a difference-in-differences approach based on this leverage regime change, we examine a sample of Chinese listed firms (also known as A-share firms) during 2012–2017. 1 We estimate firms’ marginal corporate tax rates at the end of 2014. We find that firms with high marginal corporate tax rates (high-tax-rate firms) reduce leverage to a lesser extent than firms with low marginal corporate tax rates (low-tax-rate firms). This differential deleveraging effect is economically significant. For a high-tax-rate firm (marginal tax rate = 0.250, the third quartile) and a low-tax-rate firm (marginal tax rate = 0.132, the first quartile), the former’s reduction in leverage is 1.05% (0.089 × (0.250–0.132)) lower than the latter, corresponding to 25.61% (1.05%/4.1%) of the deleveraging program’s unconditional effect on corporate leverage (4.1%). Therefore, the expected benefit of the debt tax shield significantly reduces the deleveraging program’s effect on firms’ capital structure adjustments, supporting a tax-leverage link.
The validity of the deleveraging program in our difference-in-differences strategy requires a parallel trend. That is, high-tax-rate and low-tax-rate firms should exhibit a similar leverage trend, absent the deleveraging program. We find the parallel trend to be valid. Upon its initiation however, the deleveraging program exerts diverging effects on firms’ leverage, induced by their different marginal corporate tax rates. Furthermore, as high-tax-rate firms and low-tax-rate firms can be fundamentally different and thus react to the deleveraging program differently for nontax reasons, we use propensity score matching (PSM) and entropy-balanced methods to remove differences in firm characteristics. We obtain similar results.
China’s institutional feature of state ownership provides us with an opportunity to test the differential manifestations of the tax-leverage link in two categories of firms: (1) state-owned firms and (2) nonstate-owned firms. State-owned firms, normally expecting easier access to loans from state-owned banks and, more importantly, ultimate government bailouts, have a limited financial distress risk to trade off against the tax benefit of debt (Wu & Yue, 2009). Furthermore, seeking tax shields to lower the tax burden is less of an incentive for state-owned firms (Bradshaw et al., 2019). These forces, combined, result in the tax-leverage link being weaker for state-owned firms than for nonstate-owned firms, which rely more on the market mechanisms. We find that while the differential effect of the deleveraging program induced by the corporate tax exists for both state-owned and nonstate-owned firms, it is weaker for state-owned firms, especially central state-owned firms.
We further predict a role for nondebt tax shields in mitigating the effect of corporate tax on firms’ capital structure adjustments in response to deleveraging. We find that, when firms expect more depreciation and amortization in future years, their marginal tax rates matter less for their capital structure adjustment decisions.
Our next line of investigation addresses the implications of the tax-leverage link for the “eco-system” of firms’ corporate policies (Farre-Mensa et al., 2014, 2025). We delve into the mechanisms through which firms carry out deleveraging. Specifically, we consider dividend payouts and equity/debt financing choices. First, firms can reduce leverage by paying off existing debt. A cut in dividends retains more internal capital that can be used to meet this objective. We find that high-tax-rate firms, compared with low-tax-rate firms, cut dividends to a lesser extent during the deleveraging program. Second, deleveraging can be carried out through switching from debt financing to equity financing. We show that high-tax-rate firms switch from debt financing to equity financing to a lesser extent, compared with low-tax-rate firms, during the deleveraging program. 2 Finally, we determine whether the differential effect of the deleveraging program on firms’ capital structure, induced by firms’ varying marginal tax rates, is transmitted to corporate investment decisions. We find that by reducing leverage to a lesser extent, high-tax-rate firms are less likely to reduce their investments in fixed assets, research and development, and human capital, compared with low-tax-rate firms. Overall, the tax-leverage link yields significant implications for firms’ payout, financing and investment decisions.
We make the following contributions by connecting the literature on debt crisis with the literature on tax and capital structure. First, the existing debt crisis literature has addressed the consequences of debt crises such as corporate investments (Almeida et al., 2011; Duchin et al., 2010) and employment (Benmelech et al., 2019; Chodorow-Reich, 2014; Giroud and Mueller, 2017). We add to this literature by proposing a corporate tax channel. Using China’s 2015 deleveraging program as a quasinatural experiment, we find that high-tax-rate firms deleverage less relative to low-tax firms. Furthermore, the tax shield helps firms weather debt crises by maintaining investments.
Second, our study contributes to the rich strand of literature on tax and capital structure. Although the literature has explored how corporate tax regime shifts impact capital structure (Gordon & Lee, 2001; Heider & Ljungqvist, 2015; Rajan & Zingales, 1995; Wu & Yue, 2009), it does not differentiate credit crisis and noncrisis periods. We show that with a government-initiated credit crunch, high-tax-rate firms, responding to economic incentives associated with interest expense deduction, find it easier to maintain their leverage ratios. Our findings reveal how the traditional theory of tax and leverage manifests when credit supply is severely constrained.
Finally, our research provides unique insights into the interaction between property rights and firms’ tax incentives. We show that in China, which is the largest developing economy, and characterized by a large government sector (Fan et al., 2007; Piotroski & Zhang, 2014), the effect of corporate tax on leverage is more applicable to nonstate-owned enterprises, but less applicable to state-owned enterprises. The government’s dual role as both a shareholder and a tax claimant weakens state-owned firms’ tax incentives (Bradshaw et al., 2019). Furthermore, soft budget constraints render financial constraints less of a concern for state-owned firms, and financing resources are usually tilted favorably to state-owned firms (Allen et al., 2023; Allen et al., 2005). These two forces reduce the applicability of the trade-off theory for firms with state ownership. Therefore, although Booth et al. (2001) propose that capital structure determinants are very similar across different countries, our findings based on a developing and transitional economy reveal, to a certain extent, the difference in capital structure decisions between developed and developing economies.
Institutional Background
Fiscal Stimulus and a Looming Debt Crisis After 2008
As an economy that relies heavily on exports, China was severely affected by the 2008 global financial crisis, and its GDP growth rate declined from 15% in 2007 to 10% in 2008. To mitigate the effect of the global financial crisis, China launched an RMB four-trillion fiscal stimulus package. This package, a typical countercyclical government intervention, was aimed at rejuvenating the economy.
A credit expansion followed the initiation of the stimulus package. With easier access to capital, rising leverage emerged in the corporate sector, local governments and households. The corporate sector was the main driver of the excessive credit creation (IMF, 2016). Zhong et al. (2016) show that the debt of nonfinancial firms substantially increased after the stimuli, and that even zombie firms, that is, firms that could not cover their existing debt with current profits (Caballero et al., 2008), were able to obtain loans as banks were instructed by the government to support distressed industrial firms.
Apart from the direct effect of cheap debt, corporate leverage also increased because of a crowding-in effect caused by increased government spending. With the fiscal stimulus, local governments increased public spending through borrowing. Although the 1994 Budget Law disallowed local governments to run with fiscal deficits and to seek external financing, Provision 92 issued by the China Banking Regulatory Commission in March 2009 permitted local governments to set up local government financing vehicles (LGFVs) to raise capital, essentially bypassing the budget law. 3 Local governments’ spending was highly concentrated in infrastructure projects, crowding in the demand from industrial firms and thus further pushing up corporate debt (Zhang & Pu, 2018).
The ensuing elevated corporate leverage promoted investment but distorted resource allocation. Credit went mostly to firms or projects with low productivity, such as heavy manufacturing industries and infrastructure projects (Cong et al., 2019). From 2008 to 2015, total debt in China experienced an annual growth rate of 20%, and the debt-to-GDP ratios increased from 1.2 to 2.1 (Song & Xiong, 2018). High debt and low productivity increased the likelihood of a debt crisis.
2015 Deleveraging Program
In October 2015, the central committee of the Chinese government held its fifth plenary meeting, which saw the passage of The 13 th Five-Year Plan for National Economy and Social Development. The plan set deleveraging as a primary economic objective for China. The corporate sector, the main driver of excessive debt in China (IMF, 2016), became a major target in the deleveraging program. The Chinese government deployed a series of measures to meet the deleveraging objectives, including (1) implementing tightening monetary policies; (2) restructuring troubled state-owned firms through mixed ownership, debt-to-equity swaps, and public‒private partnerships; (3) disciplining local government financing vehicles (LGFVs, also viewed as corporations) from overborrowing; (4) preventing banks (the largest banks in China are state-owned) from lending money to selected industries (those with overcapacity and the real estate industry); and (5) regulating China’s shadow banking sector (banks’ wealth-management industry). These measures were applied to all provinces and to all firms simultaneously and not in phases.
In summary, by tightening monetary policies and discouraging banks’ lending and clamping down the shadow banking sector, the deleveraging program substantially increased firms’ cost of debt and thus the incentive to deleverage. We utilize this policy-induced deleveraging shock to investigate how firms with varying marginal tax rates respond through capital structure adjustments.
Corporate Income Tax Law of China
Like in many other countries, China’s corporate tax code employs accrual-based reporting, which, compared with cash-based tax reporting, allows the government to access more stable and predictable corporate tax revenues (Goncharov & Jacob, 2014). The standard statutory corporate tax rate has been set at 25% since 2008, when the tax law combined two separate categories of firms, namely, domestically invested firms and foreign invested firms, into one. However, significant heterogeneity in statutory tax rates exists across firms. Firms in selected industries or regions can enjoy lower tax rates. The most frequent low tax rate is 15%, applicable to high-tech firms meeting rules prescribed by the tax law (e.g., a sufficiently high ratio of research and development expenses to revenue). Expenses, such as depreciation, amortization, advertising, research and development, are tax deductible, albeit with restrictions imposed on or with additional tax credits provided for certain types. Importantly, debt interest expenses are fully tax deductible.
Hypotheses Development
Hypotheses Concerning Corporate Deleveraging
Marginal Corporate Tax Rate and Deleveraging
Debt confers a tax benefit through interest expense deduction when firms compute taxable income. This tax advantage of debt implies a positive link between the corporate tax rate and leverage.
We take a novel approach by exploiting China’s 2015 deleveraging program. Instead of using tax policies to goad firms into reducing debt or leverage, the Chinese authorities are capable of directly influencing firms’ leverage. Although China has opened up and reformed its economic system since 1978, its economy, to a large extent, is still a command and planned economy overseen by the communist party and the government. Administrative orders are direct tools that the government uses to quickly regulate the economy. For example, for troubled state-owned firms (zombie firms) and local government financing vehicles (LGFVs), the program ordered precise measures for deleveraging such as debt-for-equity swaps or restructuring.
On the other hand, there is sufficient room for the effects of market mechanisms. In addition to administrative actions, the government introduced measures that affected a broad spectrum of industries/firms, for example, tightening monetary policies, discouraging banks’ lending to selected industries and clamping down on the shadow banking sector. Upon the inception of the deleveraging program, firms were incentivized to reduce leverage. However, those with a high marginal corporate tax rate see a greater cost of leverage reduction associated with the loss of the debt tax shield. These high-tax-rate firms are thus more reluctant to reduce leverage during the deleveraging program than low-tax-rate firms. We propose our first hypothesis below:
During the deleveraging program, leverage decreases less for firms with a high marginal corporate tax rate than for firms with a low marginal corporate tax rate.
Property Rights and the Tax-Leverage Link
In trade-off theory, a major cost that balances the tax benefit of debt is financial distress. Under such a theory, the tax-leverage link should manifest differently between state-owned firms (SOEs) and nonstate-owned firms (NSOEs). First, SOEs are known to enjoy implicit government guarantees that they will not enter into de facto financial distress, regardless of their risk-taking and financial status, owing to easier access to credit provided by state-owned banks, large amounts of government subsidies, and faith in ultimate government bailouts (Faccio et al., 2006). The cost of financial distress therefore features less prominently in SOEs’ corporate decisions. Second, with respect to tax planning, SOEs have a lower incentive to shield taxes because of the dual role of the state as both the controlling shareholder and the tax claimant. Consistent with this notion, Bradshaw et al. (2019) document that, in China, SOEs avoid taxes to a lesser extent than NSOEs. Further, Xiao and Shao (2020) find that the enhanced tax enforcement in China, owing to the tax authority’s adoption of an improved information system, is more prominent for NSOEs than for SOEs. Using debt to shield taxes is therefore less of an incentive for SOEs. This affects the extent of deleveraging for SOEs relative to NSOEs. We propose our second hypothesis below:
The negative effect of the marginal corporate tax rate on deleveraging is more pronounced for nonstate-owned firms than for state-owned firms.
Among SOEs, those owned by the central government, compared with those owned by local governments, are more likely to receive implicit government guarantees and exhibit a lower incentive to avoid taxes. China has long been characterized as a regionally decentralized centrally governed regime (Huang et al., 2017; Xu, 2011). Centralization induces central SOEs to be more influenced by government interventions, while decentralization allows local SOEs to be more market-oriented. Therefore, within SOEs, we also expect the tax-leverage link to be less evident for central SOEs than for local SOEs.
Hypotheses Concerning Payout, Financing, and Investment Policies
An important goal of our study is the examination of the implications of the tax-leverage link for corporate policies associated with payout, financing, and investment decisions. These implications will significantly enrich our understanding of the role of taxes in influencing corporate behaviors in response to credit crunches.
Dividend and Equity/Debt Financing Choices
To achieve deleveraging, firms have to resort to specific mechanisms. We consider two important decisions: (1) the level of payout and (2) the form of financing. These mechanisms are also differentially affected by the deleveraging program for high-tax-rate and low-tax-rate firms.
With respect to payouts, we expect that to engage in leverage reduction, firms reduce dividend payouts to retain more internal capital. Such a notion shares the spirit of the “ecosystem” view in (Farre-Mensa et al., 2014, 2025) that dividend and capital structure are interrelated. Firms can raise debt according to their dividend needs (Farre-Mensa et al., 2025). In our context, firms can lower dividend payouts to deleverage.
Regarding financing, firms can deleverage through paying off more existing debt, taking on less new debt, or both. The conventional view of pecking order theory postulates that firms normally prefer debt over equity (Myers, 1984). The deleveraging program increases the probability that some firms find this order disrupted and even reversed. Deleveraging firms are more likely to seek financing in the form of equity instead of debt during the deleveraging program.
Taken together, lowering dividend payouts and switching from debt financing to equity financing are two mechanisms through which firms deleverage. High-tax-rate firms, compared with low-tax-rate firms, are less likely to engage in either mechanism during the deleveraging program. We propose our third hypothesis below:
High-tax-rate firms, compared with low-tax-rate firms, are less likely to reduce dividends or to switch from debt financing to equity financing during the deleveraging program.
Corporate Investments
Our final prediction is related to the implications of the 2015 deleveraging program for corporate investments. In standard models of investments with financing frictions (Holmstrom & Tirole, 1997; Stiglitz & Weiss, 1981), adverse shocks to capital supply constrain corporate investments. Empirical evidence consistently supports this notion. For example, in their survey of corporate managers, Campello et al. (2010) find that managers forego profitable investment opportunities during the mortgage crisis. Relatedly, both Duchin et al. (2010) and Almeida et al. (2011) find evidence suggesting that corporate investments significantly decline following the onset of the 2008 financial crisis. Furthermore, firms with more debt maturing around the onset of the crisis and less financial slack to fund profitable investments are affected to a greater extent.
Following this line of literature, we explore the implications of the deleveraging program for corporate investments. Unlike the existing studies, however, we incorporate firms’ tax status. Deleveraging substantially increases financing frictions for firms. However, compared with low-tax-rate firms, high-tax-rate firms tend to maintain greater leverage because of the debt tax benefit. Retaining more debt increases high-tax-rate firms’ ability to fund profitable investment opportunities. Additionally, adopting a tax perspective, Li and Lin (2021) find that cash holdings driven by tax benefits (e.g., R&D tax credits) encourage innovative firms to invest more. We state our final hypothesis below:
High-tax-rate firms, compared with low-tax-rate firms, are less likely to cut corporate investments during the deleveraging program.
For our empirical analysis, we consider three dimensions of corporate investment: capital expenditure (investment in fixed assets), investment in research and development, and investment in human capital.
Sample, Identification, and Measurement
Data and Sample Formation
We retrieve from the China Stock Market & Accounting Research (CSMAR) database a sample consisting of 17,689 observations for domestically listed Chinese firms (also known as A-share firms) from 2012 to 2017. Such a sample period comprises three predeleveraging years (2012–2014) and three postdeleveraging years (2015–2017). We apply the following filters to the initial sample. First, the computation of a firm’s marginal corporate tax rate in 2014 requires a minimum of five historical firm-year observations. With this requirement, we exclude 7,639 firm-years with fewer than five observations during 2008–2014. We do not use information from years earlier than 2008, as China’s current Corporate Income Tax Law came into effect on January 1, 2008. Second, we exclude 144 observations in the financial industry. Third, missing values for key variables in our empirical analyses leave out 63 observations. Our final sample comprises 9,843 observations of 1,651 unique firms.
Estimating Marginal Corporate Tax Rates
We use a difference-in-differences approach to pick up incremental leverage decisions due to the deleveraging program. A firm’s incremental leverage decision is determined by its marginal corporate tax rate rather than the statutory corporate tax rate or its effective tax rate (Graham, 1996). Following Graham (1996) and Graham and Mills (2008), we estimate a firm’s marginal tax rate at the end of 2014 using a simulation approach. 4
First, for each firm, we estimate its historical taxable income during 2008–2014. Taxable income is defined as the pretax income before extraordinary items during a year minus the deferred tax expense, divided by the firm’s applicable statutory income tax rate. 5
Second, using information from the end of 2014, we forecast a firm’s future taxable income from 2015 to 2019. We do not project taxable income for years beyond 2019, as China’s Corporate Income Tax Law allows firms to carry forward incurred losses only within 5 years, and 2019 is the last year eligible for offsetting a firm’s 2014 loss. We assume that taxable income follows a random-walk-with-drift process. To estimate the drift and the distribution of the error term, we compute the mean and the standard deviation of a firm’s historical ΔTI (the annual difference in taxable income) from 2008 to 2014. We require at least four nonmissing ΔTI for a firm (a minimum of five firm-year observations of original data). We then simulate firms’ taxable income for 2015–2019.
Third, for each simulated stream of taxable income during 2015–2019, we compute the present value of the corresponding tax liabilities during the same period. We discount each year’s tax liability (taxable income × applicable statutory income tax rate) with the average corporate bond yield of investable bonds at the end of 2014, compiled by the China Bond Information Network (https://www.chinabond.com.cn), as the discount rate.
Fourth, we add RMB 10,000 to 2014’s taxable income and reestimate the future taxable income, future tax liabilities and their present value as of the end of 2014. The difference between the two present values of tax liabilities, divided by 10,000, denotes an estimate of the firm’s marginal tax rate. 6
Finally, we repeat the above simulation and estimation procedure 50 times. We take the average of the 50 estimates of a firm’s simulated marginal tax rates and define it as its marginal tax rate at the end of 2014. This simulated rate corresponds to a firm’s postfinancing MTR, which, as suggested in Graham and Mills (2008), best suits research on firms’ incremental financing decisions.
Identification and Variable Measurement
To determine whether and how the marginal corporate tax rate resists deleveraging, we estimate equation (1) below:

Summary Statistics and Correlations
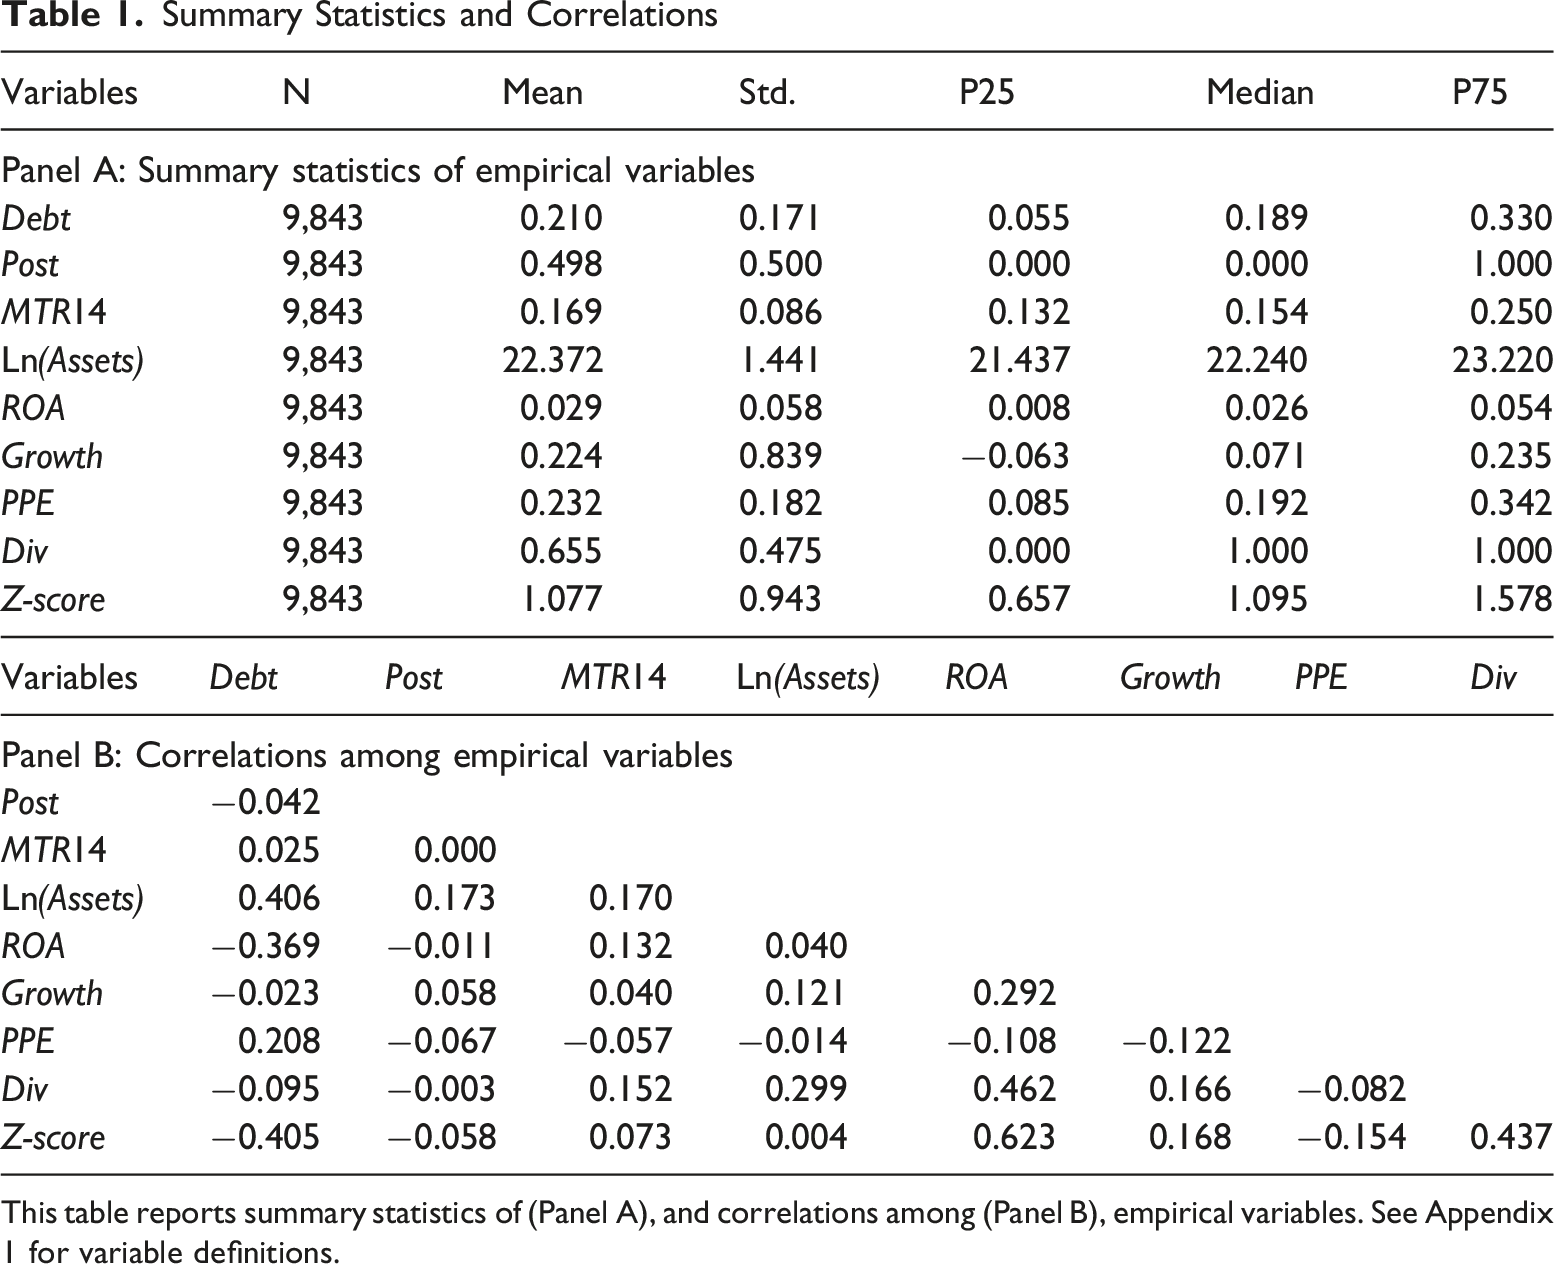
This table reports summary statistics of (Panel A), and correlations among (Panel B), empirical variables. See Appendix 1 for variable definitions.
Empirical Analyses
Leverage During the 2015 Deleveraging Program
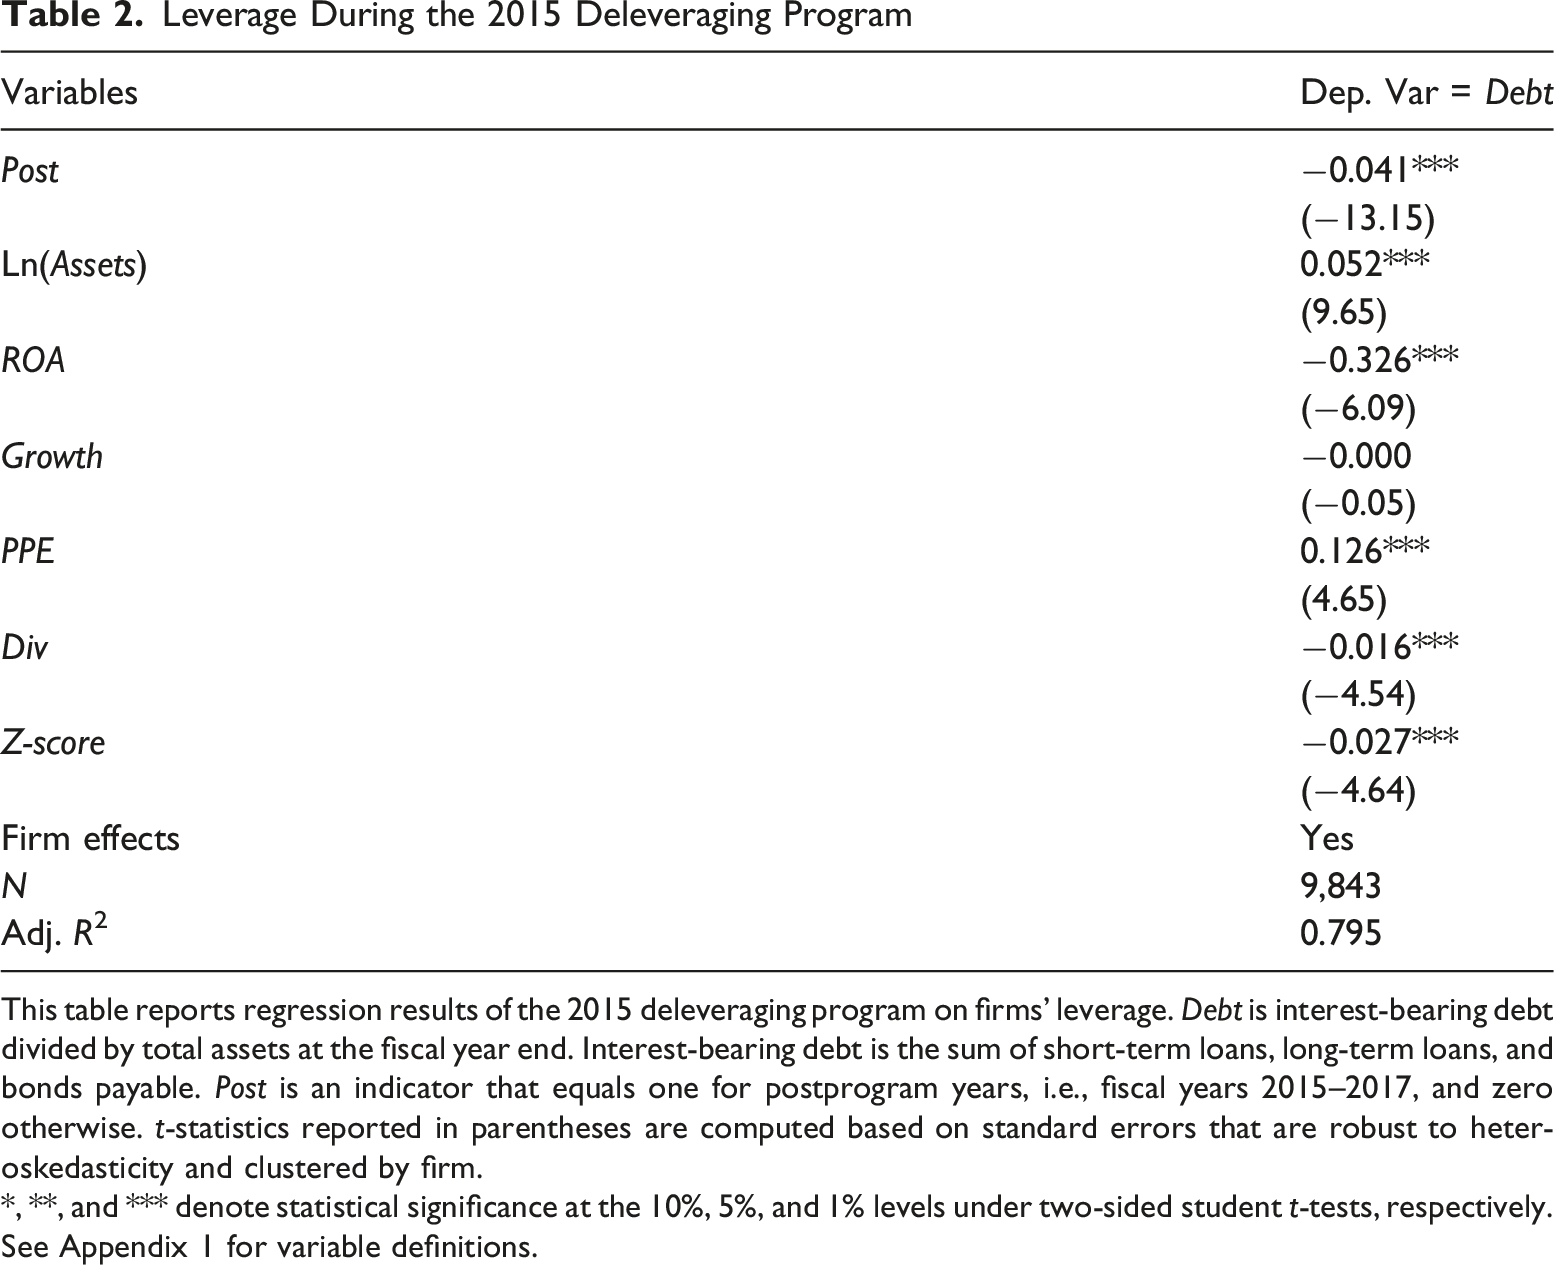
This table reports regression results of the 2015 deleveraging program on firms’ leverage. Debt is interest-bearing debt divided by total assets at the fiscal year end. Interest-bearing debt is the sum of short-term loans, long-term loans, and bonds payable. Post is an indicator that equals one for postprogram years, i.e., fiscal years 2015–2017, and zero otherwise. t-statistics reported in parentheses are computed based on standard errors that are robust to heteroskedasticity and clustered by firm.
*, **, and *** denote statistical significance at the 10%, 5%, and 1% levels under two-sided student t-tests, respectively. See Appendix 1 for variable definitions.
Tax and Deleveraging
Main Difference-in-Differences Analysis
Hypothesis 1 addresses how the marginal corporate tax rate affects the effect of the deleveraging program on firms’ leverage adjustment. That is, whether high-tax-rate firms, compared with low-tax-rate firms, are more likely to resist deleveraging to retain the benefit of the tax shield provided by interest expenses’ tax deductions.
To test Hypothesis 1, we begin with a visual illustration. We plot the annual mean and median of Debt for firms with different marginal corporate tax rates at the end of 2014, that is, the fiscal year end before the deleveraging program. We categorize firms into two subgroups: (1) a “High MTR” subgroup comprising firms whose marginal tax rates at the end of 2014 are higher than or equal to the median of all firms’ 2014 marginal tax rates; and (2) a “Low MTR” subgroup comprising firms whose marginal tax rates in 2014 are lower than the median of all firms’ marginal tax rates.
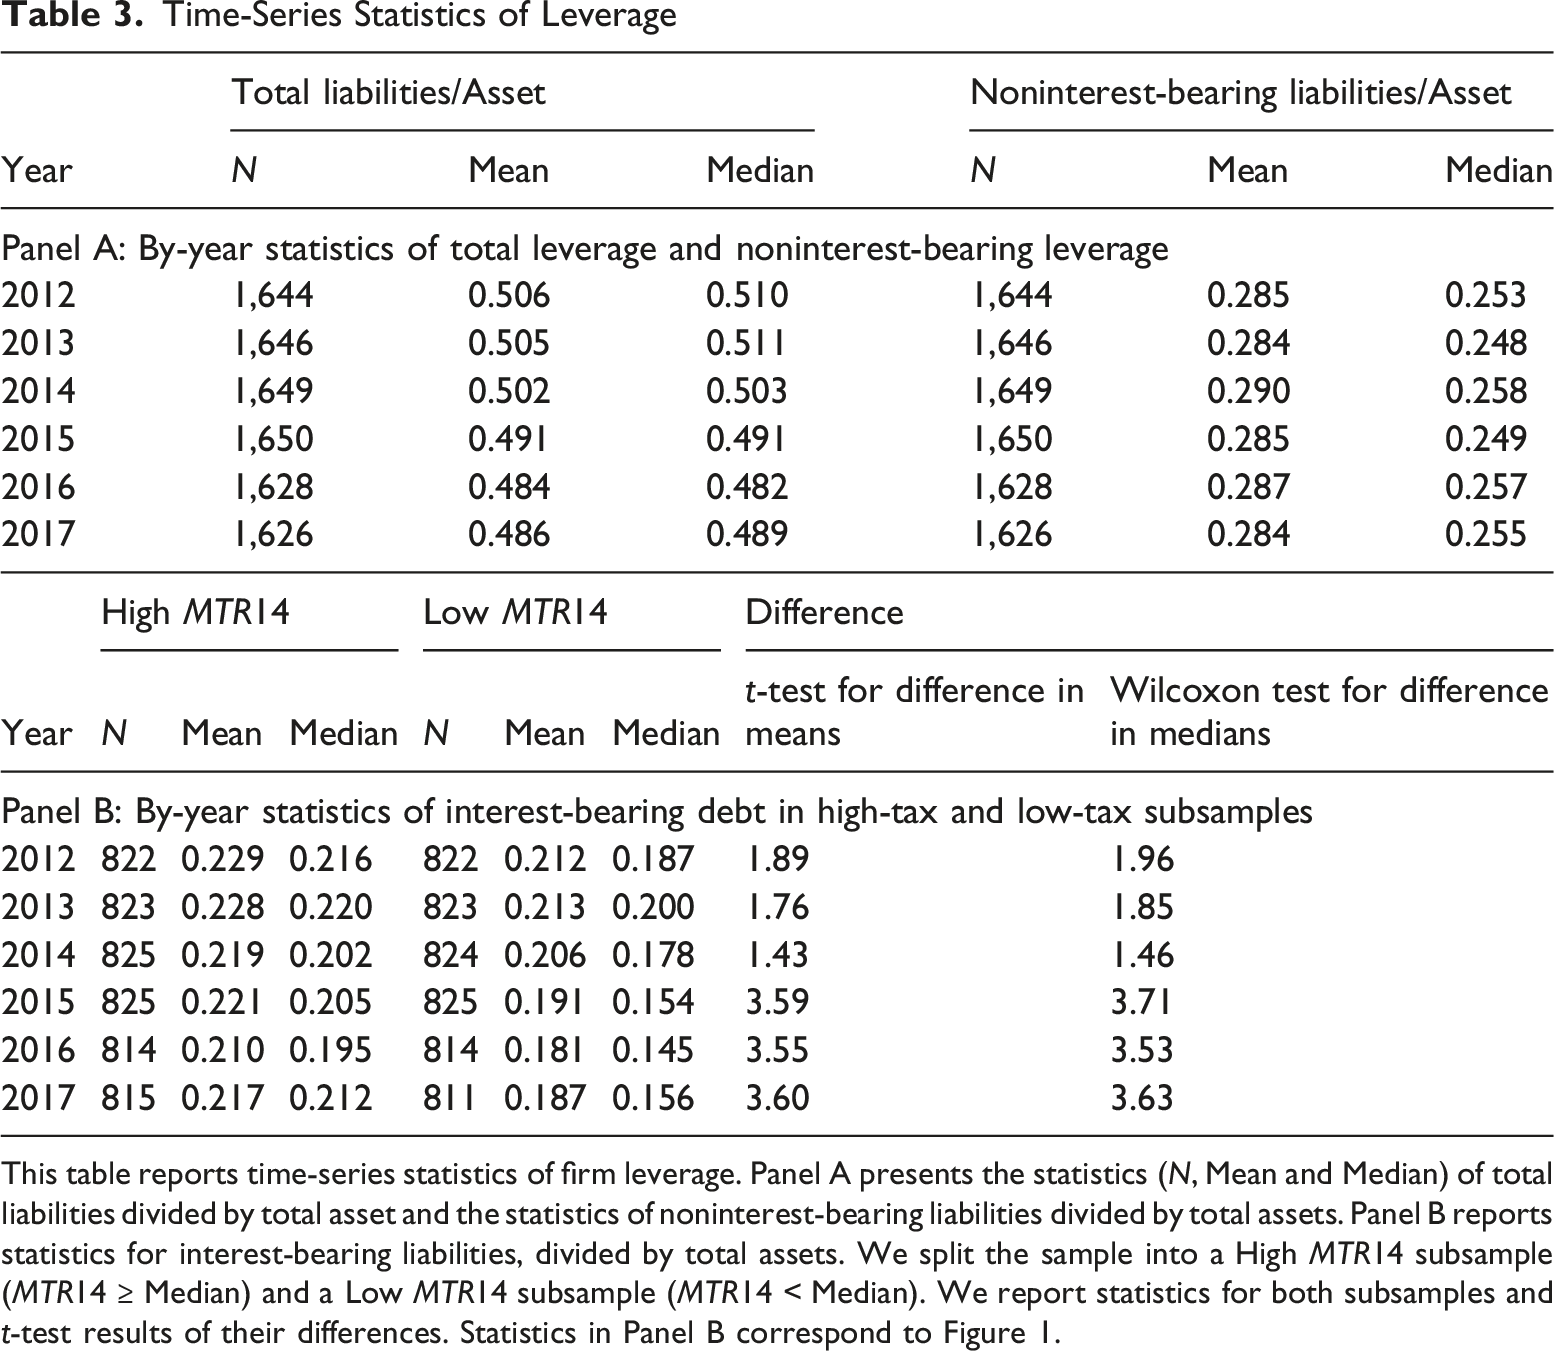
Figure 1(A) plots the annual mean of Debt for each subgroup. We find that the two subgroups’ annual means of Debt move in a parallel fashion from 2012 to 2014. However, starting from the inception of the deleveraging program in 2015, Low MTR firms reduce leverage to a greater extent relative to High MTR firms. Figure 1(B) plots the annual median of Debt for each subgroup. We observe a pattern similar to that in Figure 1(A). Corroborating statistics for Figure 1(A) and (B) appear in Table 3. Collectively, our evidence supports the notion that, during the deleveraging program, firms with high marginal tax rates are less likely to cut the level of interest-bearing debt than those with low marginal corporate tax rates, supporting the tax-shield view of corporate debt and Hypothesis 1. Furthermore, from Figure 1, we also observe a dip in leverage in 2014. As discussed earlier, to mitigate the effect of the global financial crisis in 2008, China launched an RMB four-trillion fiscal stimulus package. While this package was aimed at rejuvenating the economy, credit expansion followed the stimulus package (IMF, 2016; Song & Xiong, 2018; Zhong et al., 2016), which went mostly to firms or projects with low productivity (Cong et al., 2019). Therefore, in 2014, one year before the initiation of the deleveraging program, firms might have, to a certain extent, anticipated some form of forthcoming government intervention and accordingly organized their financing in partial anticipation of a credit shock (Fahlenbrach et al., 2021). Yearly interest-bearing debt for high-tax-rate and low-tax-rate firms. (A) Mean of interest-bearing debt. (B) Median of interest-bearing debt. Time-Series Statistics of Leverage This table reports time-series statistics of firm leverage. Panel A presents the statistics (N, Mean and Median) of total liabilities divided by total asset and the statistics of noninterest-bearing liabilities divided by total assets. Panel B reports statistics for interest-bearing liabilities, divided by total assets. We split the sample into a High MTR14 subsample (MTR14 ≥ Median) and a Low MTR14 subsample (MTR14 < Median). We report statistics for both subsamples and t-test results of their differences. Statistics in Panel B correspond to Figure 1.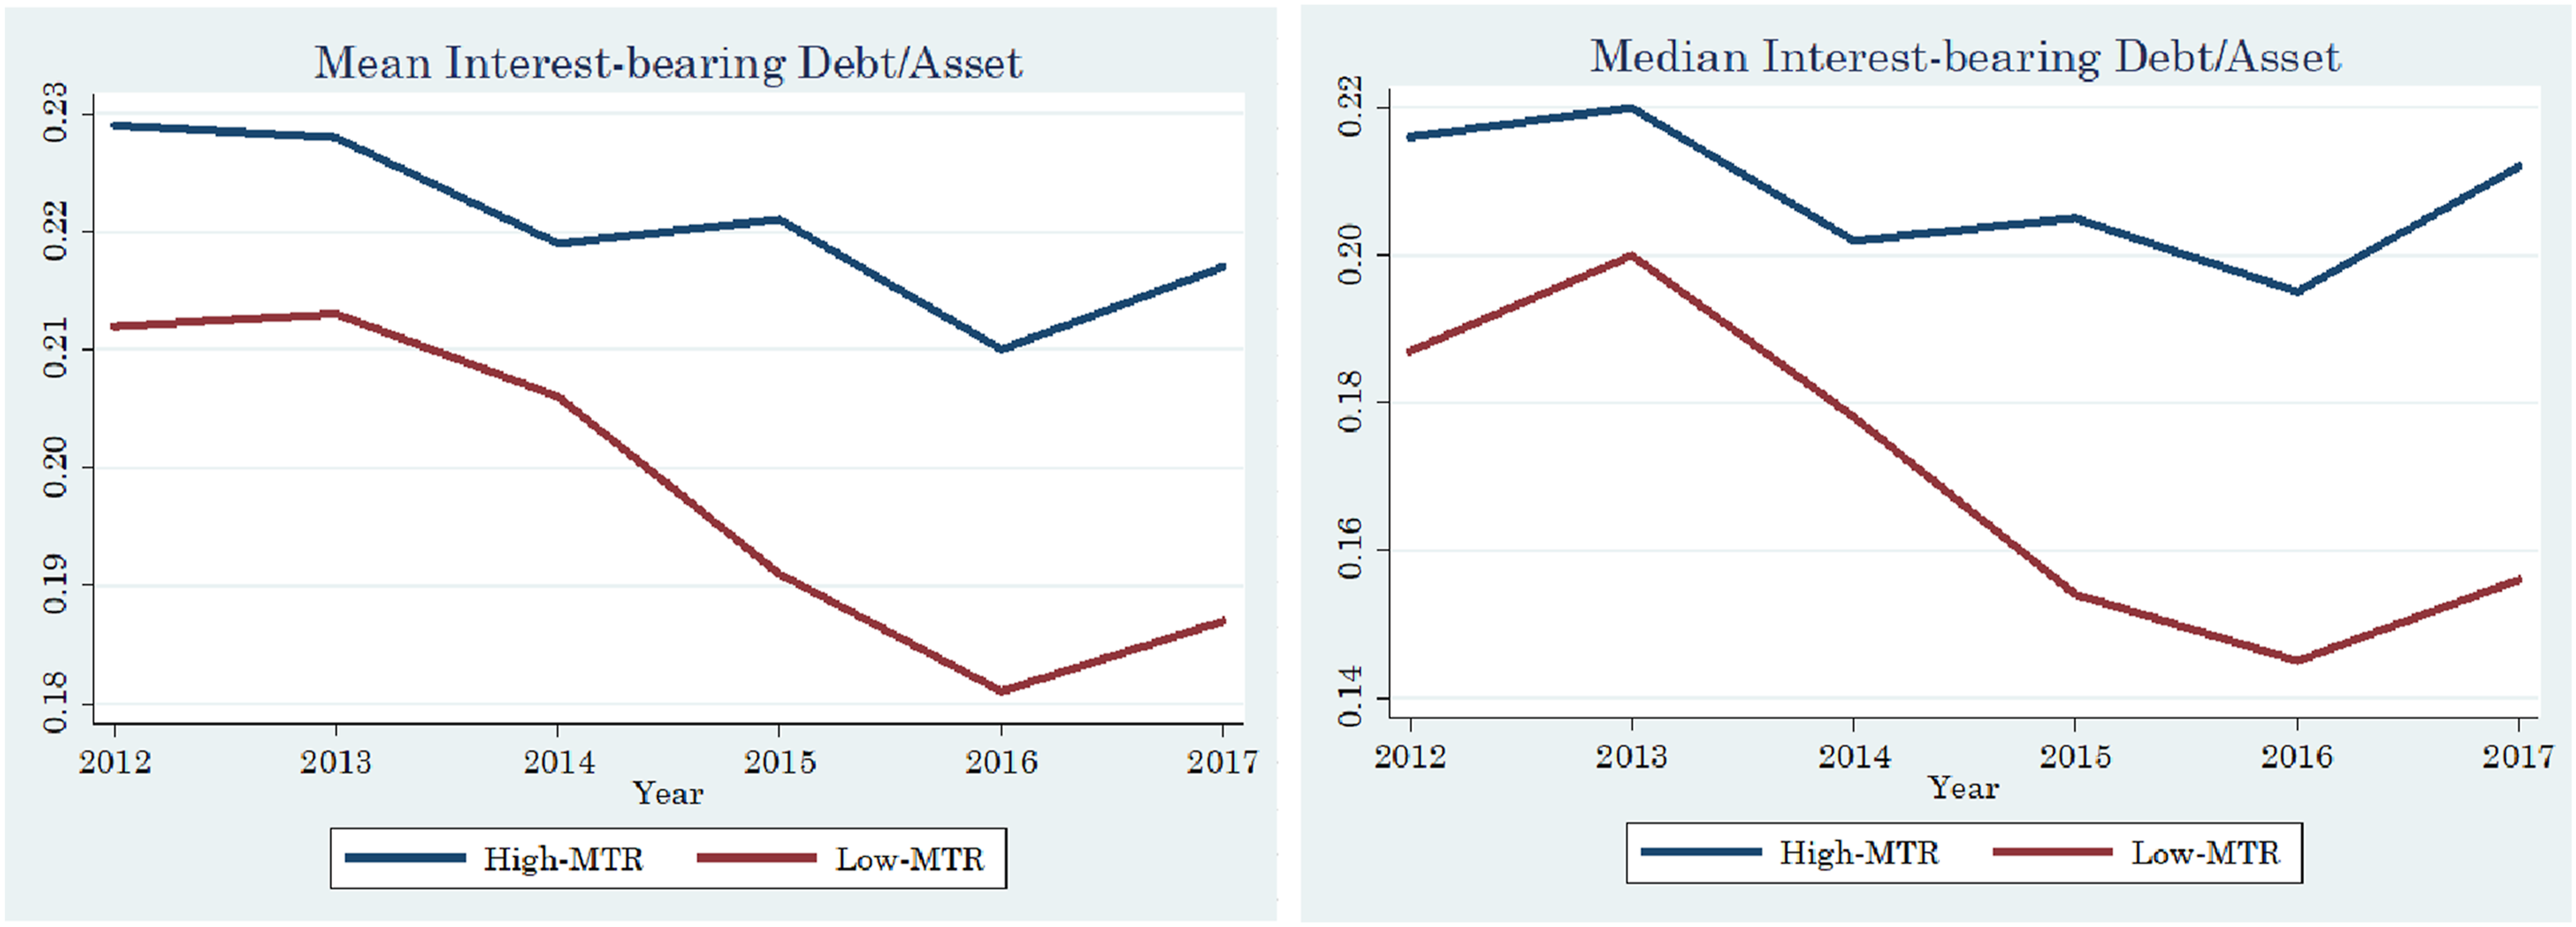
Taxes and Deleveraging
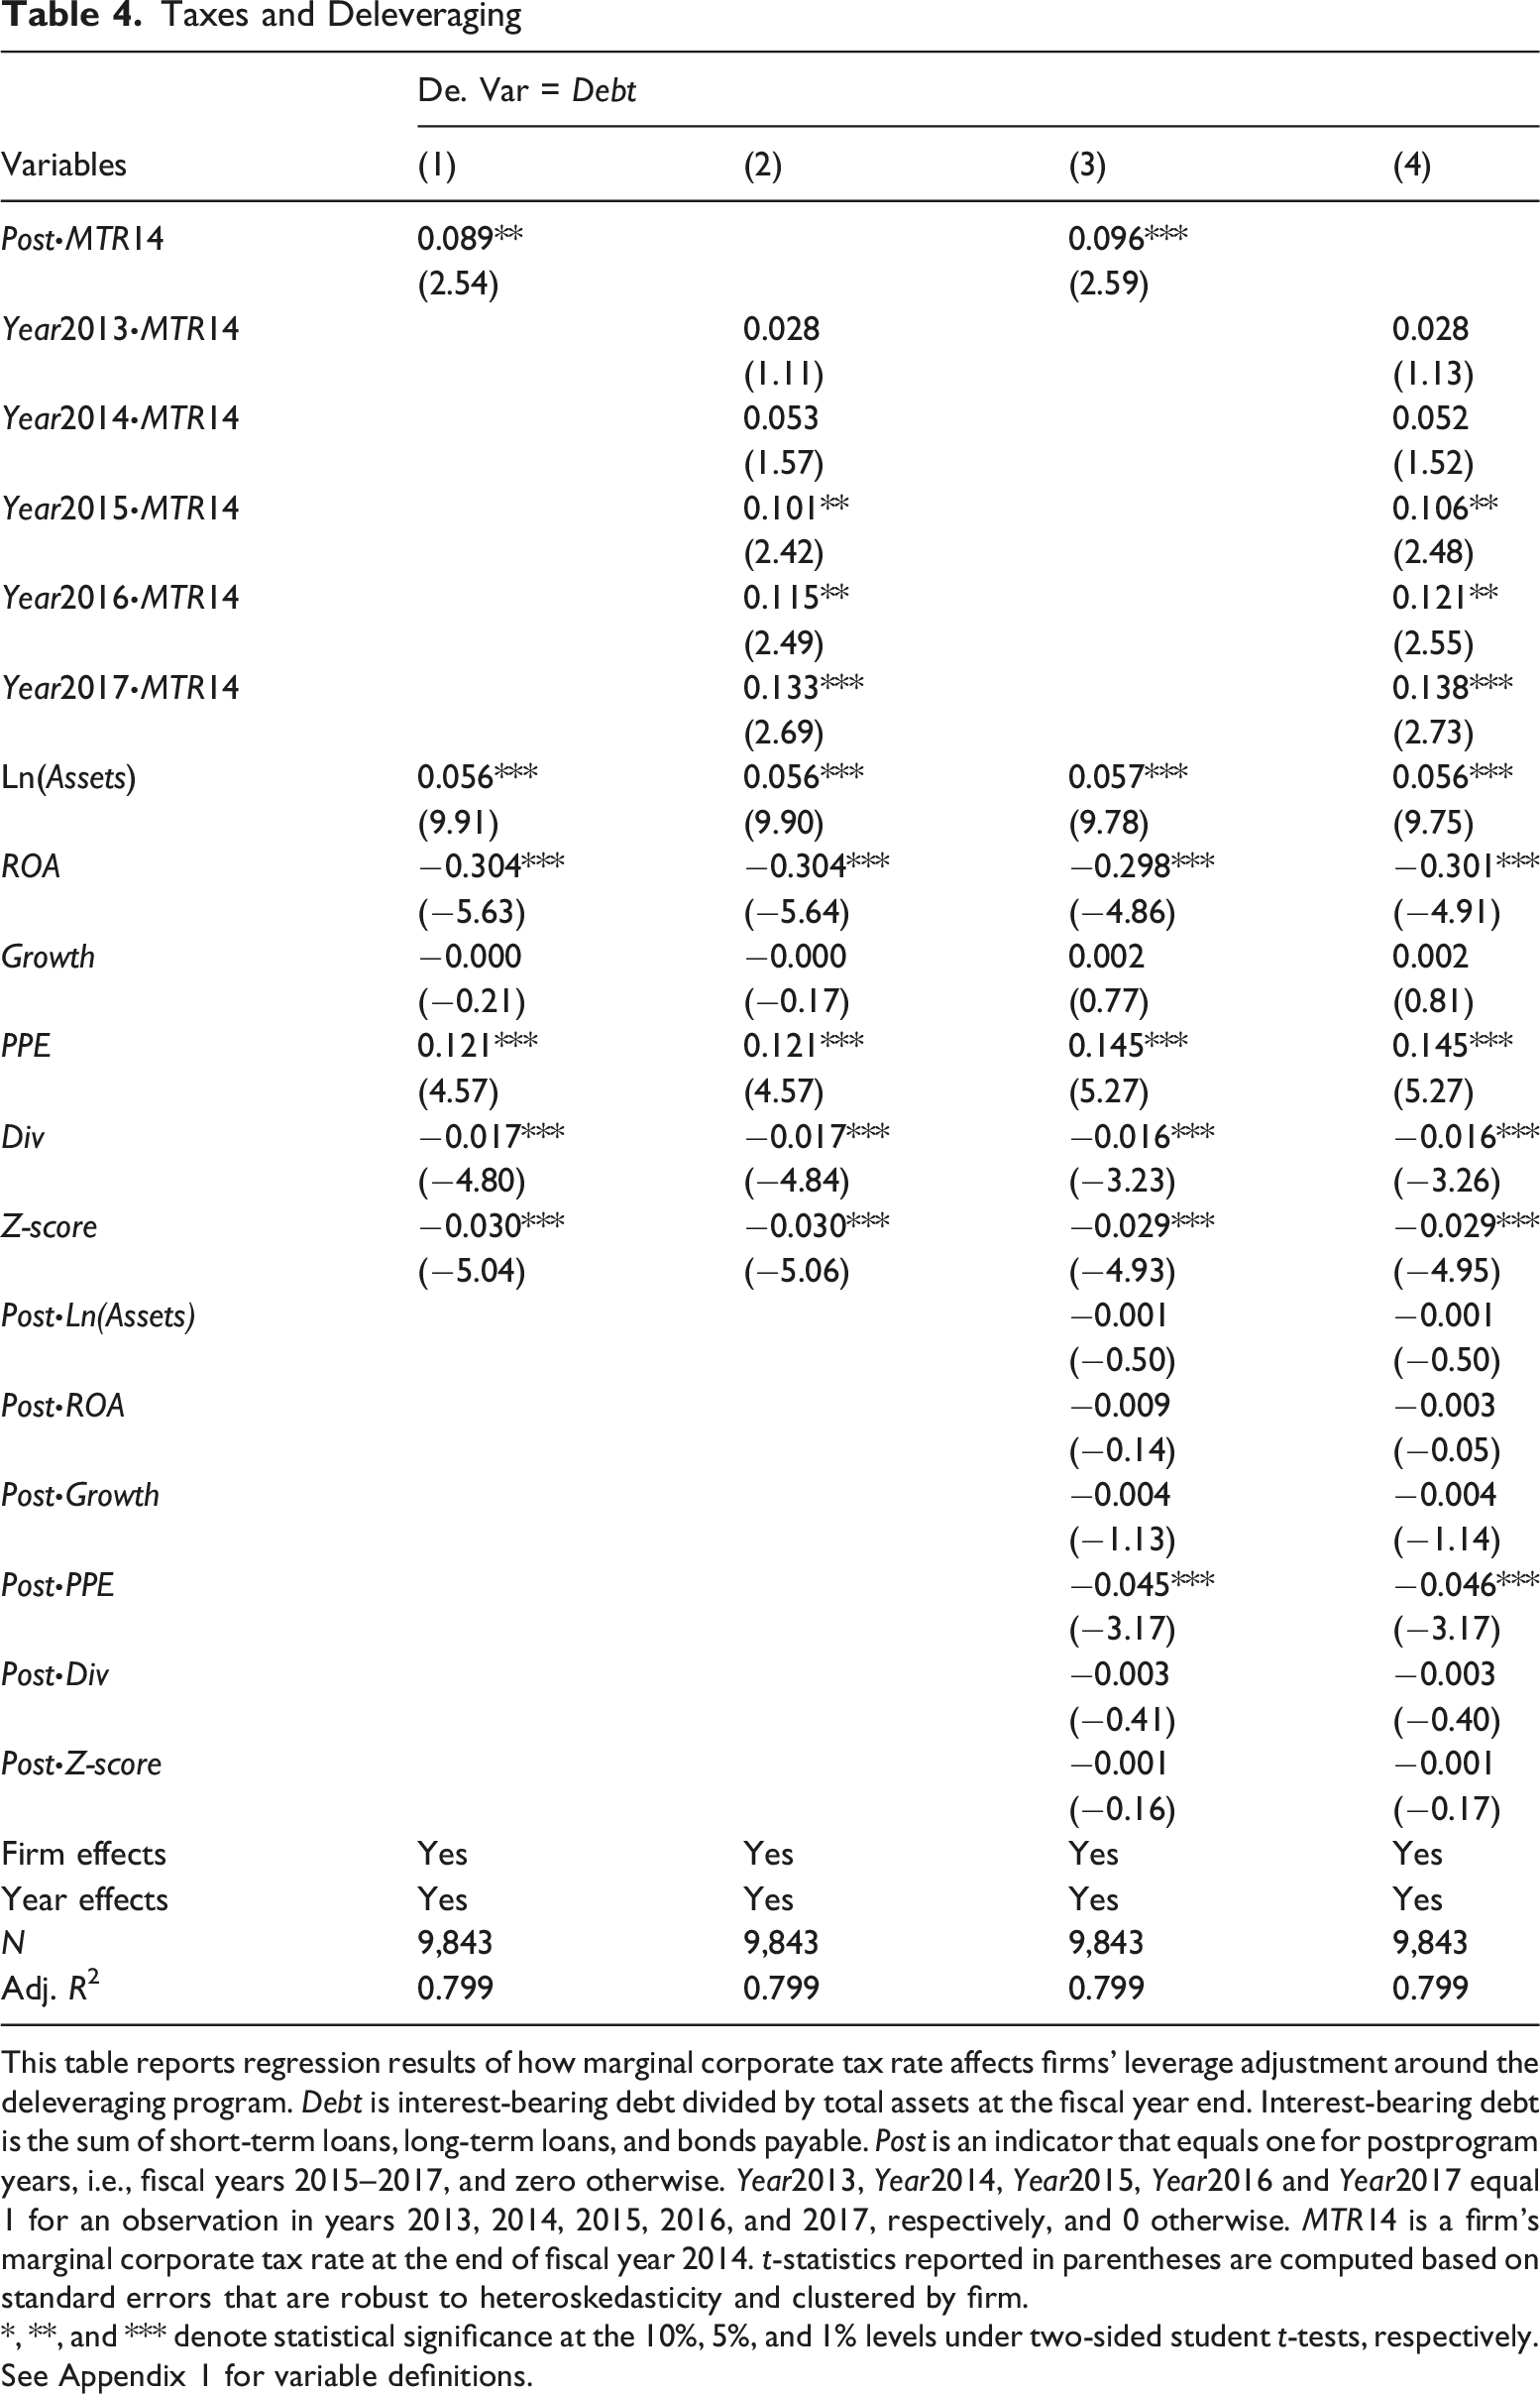
This table reports regression results of how marginal corporate tax rate affects firms’ leverage adjustment around the deleveraging program. Debt is interest-bearing debt divided by total assets at the fiscal year end. Interest-bearing debt is the sum of short-term loans, long-term loans, and bonds payable. Post is an indicator that equals one for postprogram years, i.e., fiscal years 2015–2017, and zero otherwise. Year2013, Year2014, Year2015, Year2016 and Year2017 equal 1 for an observation in years 2013, 2014, 2015, 2016, and 2017, respectively, and 0 otherwise. MTR14 is a firm’s marginal corporate tax rate at the end of fiscal year 2014. t-statistics reported in parentheses are computed based on standard errors that are robust to heteroskedasticity and clustered by firm.
*, **, and *** denote statistical significance at the 10%, 5%, and 1% levels under two-sided student t-tests, respectively. See Appendix 1 for variable definitions.
Validating a Parallel Trend
The validity of the deleveraging program serving as an exogenous shock to firms’ capital structure incentives relies on high-tax-rate and low-tax-rate firms displaying a similar leverage trend, absent treatment from deleveraging. This is known as the “parallel trend” in a difference-in-differences design. The leverage patterns in Figure 1 already provide suggestive evidence consistent with a parallel trend. To formally validate the parallel trend, we estimate the following regression model: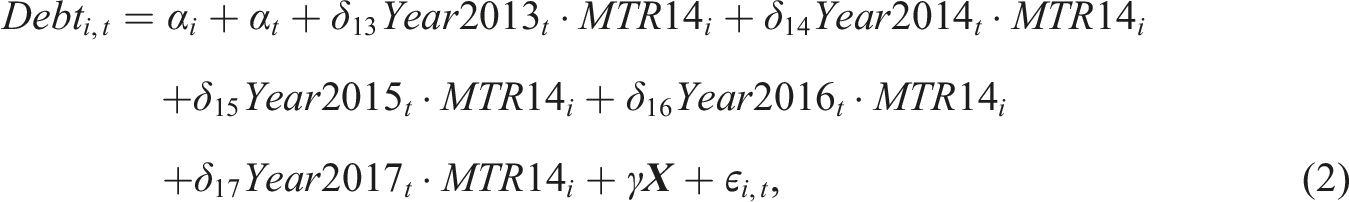
We report the results in Table 4, Column (2). We find that the coefficients on Year2013∙MTR14 (0.028) and Year2014∙MTR14 (0.053) are statistically insignificant, suggesting that the changes in leverage for high-tax-rate firms from 2012 to 2013 or 2014 are indistinguishable from those for low-tax-rate firms during the same period. The two groups of firms display a similar leverage trend before deleveraging.
Since the initiation of the deleveraging program in 2015, an immediate differential effect of the program on high-tax-rate firms relative to low-tax-rate firms emerges and lasts until the end of our sample period. The coefficients on Year2015∙MTR14 (0.101, t = 2.42), Year2016∙MTR14 (0.115, t = 2.49) and Year2017∙MTR14 (0.133, t = 2.69) are greater in economic magnitude and statistically significant, suggesting that firms with a high predeleveraging marginal corporate tax rate reduce leverage to a lesser extent since the inception of the deleveraging program. Furthermore, the three coefficients increase in magnitude. The smaller effect in 2015 is reasonable, as it is the transition year, a part of which lies during the preprogram period. When firms have sufficient time to adjust their capital structure, the tax effect becomes greater in 2016 and 2017.
In Columns (3) and (4), we further control for interactions between the Post indicator and the entire host of covariates. Doing so addresses the possibility that firms with varying fundamentals may respond differently to the deleveraging shock. The results on the effect of the marginal tax rate in resisting deleveraging are similar to those in Columns (1) and (2). 9
Taken together, the results support Hypothesis 1 that, after the initiation of the deleveraging program, firms with a high marginal corporate tax rate reduce leverage to a lesser extent because of their greater reluctance to forego the benefit of the tax shield relative to firms with a low marginal corporate tax rate. In short, corporate taxes influence firms’ leverage decisions.
Matching
High-tax-rate firms and low-tax-rate firms can be fundamentally different. To the extent that these observable differences can result in firms’ differential capital structure responses to the deleveraging program, our empirical estimates can be biased. To mitigate this concern, we perform analyses using PSM and entropy-balanced matching to create covariate-balanced samples. Both matching methods require us to categorize firms into high and low marginal tax rate subsamples. We define a treatment indicator High_MTR14 which equals one if a firm’s MTR14 is greater than or equal to the sample median and zero otherwise.
PSM requires that we first perform a probit model and identify treatment and control firms with a caliper (set to 0.1*standard deviation of the propensity score). This reduces our sample size by approximately 50%. Using the main leverage test as an example, Figure 2 shows that the kernel density distributions of the propensity scores of the treatment and control firms, which differ from each other before matching (Figure 2(A)), become indistinguishable from each other after matching (Figure 2(B)). The regression results are reported in Panel A, Table 5. The coefficients on Post·MTR14 are positive and significant (0.100, t = 2.12 with control variables and 0.111, t = 2.37 with control variables as well as Post and control variable interactions). If we consider a high-tax-rate firm with a third quartile MTR14 (0.250) and a low-tax-rate firm with a first quartile MTR14 (0.132), based on the estimate in Column (1), the former’s postdeleveraging reduction in Debt is 1.18% (0.110 × (0.250–0.132)) lower than that of the latter, accounting for 28.78% of the unconditional program effect (a 4.1% reduction (Table 2) in Debt for all firms). In the dynamic model, the coefficients on Year2013·MTR14 and Year2014·MTR14 are insignificant, indicating a parallel pretrend, whereas the coefficients on Year2016·MTR14 and Year2017·MTR14 are positive and significant, again supporting Hypothesis 1 that high-tax-rate firms reduce leverage to a lesser extent than low-tax-rate firms during the deleveraging program. Density distributions of propensity scores for high-tax-rate and low-tax-rate firms. (A) Prematching distributions; (B) Postmatching distributions Taxes and Deleveraging: Results Based on Matching This table repeats the main regression results using PSM and entropy matching. Debt is interest-bearing debt divided by total assets at the fiscal year end. Interest-bearing debt is the sum of short-term loans, long-term loans, and bonds payable. Post is an indicator that equals one for postprogram years, i.e., fiscal years 2015–2017, and zero otherwise. Year2013, Year2014, Year2015, Year2016 and Year2017 equal 1 for an observation in years 2013, 2014, 2015, 2016, and 2017, respectively, and 0 otherwise. MTR14 is a firm’s marginal corporate tax rate at the end of fiscal year 2014. t-statistics reported in parentheses are computed based on standard errors that are robust to heteroskedasticity and clustered by firm. *, **, and *** denote statistical significance at the 10%, 5%, and 1% levels under two-sided student t-tests, respectively. See Appendix 1 for variable definitions.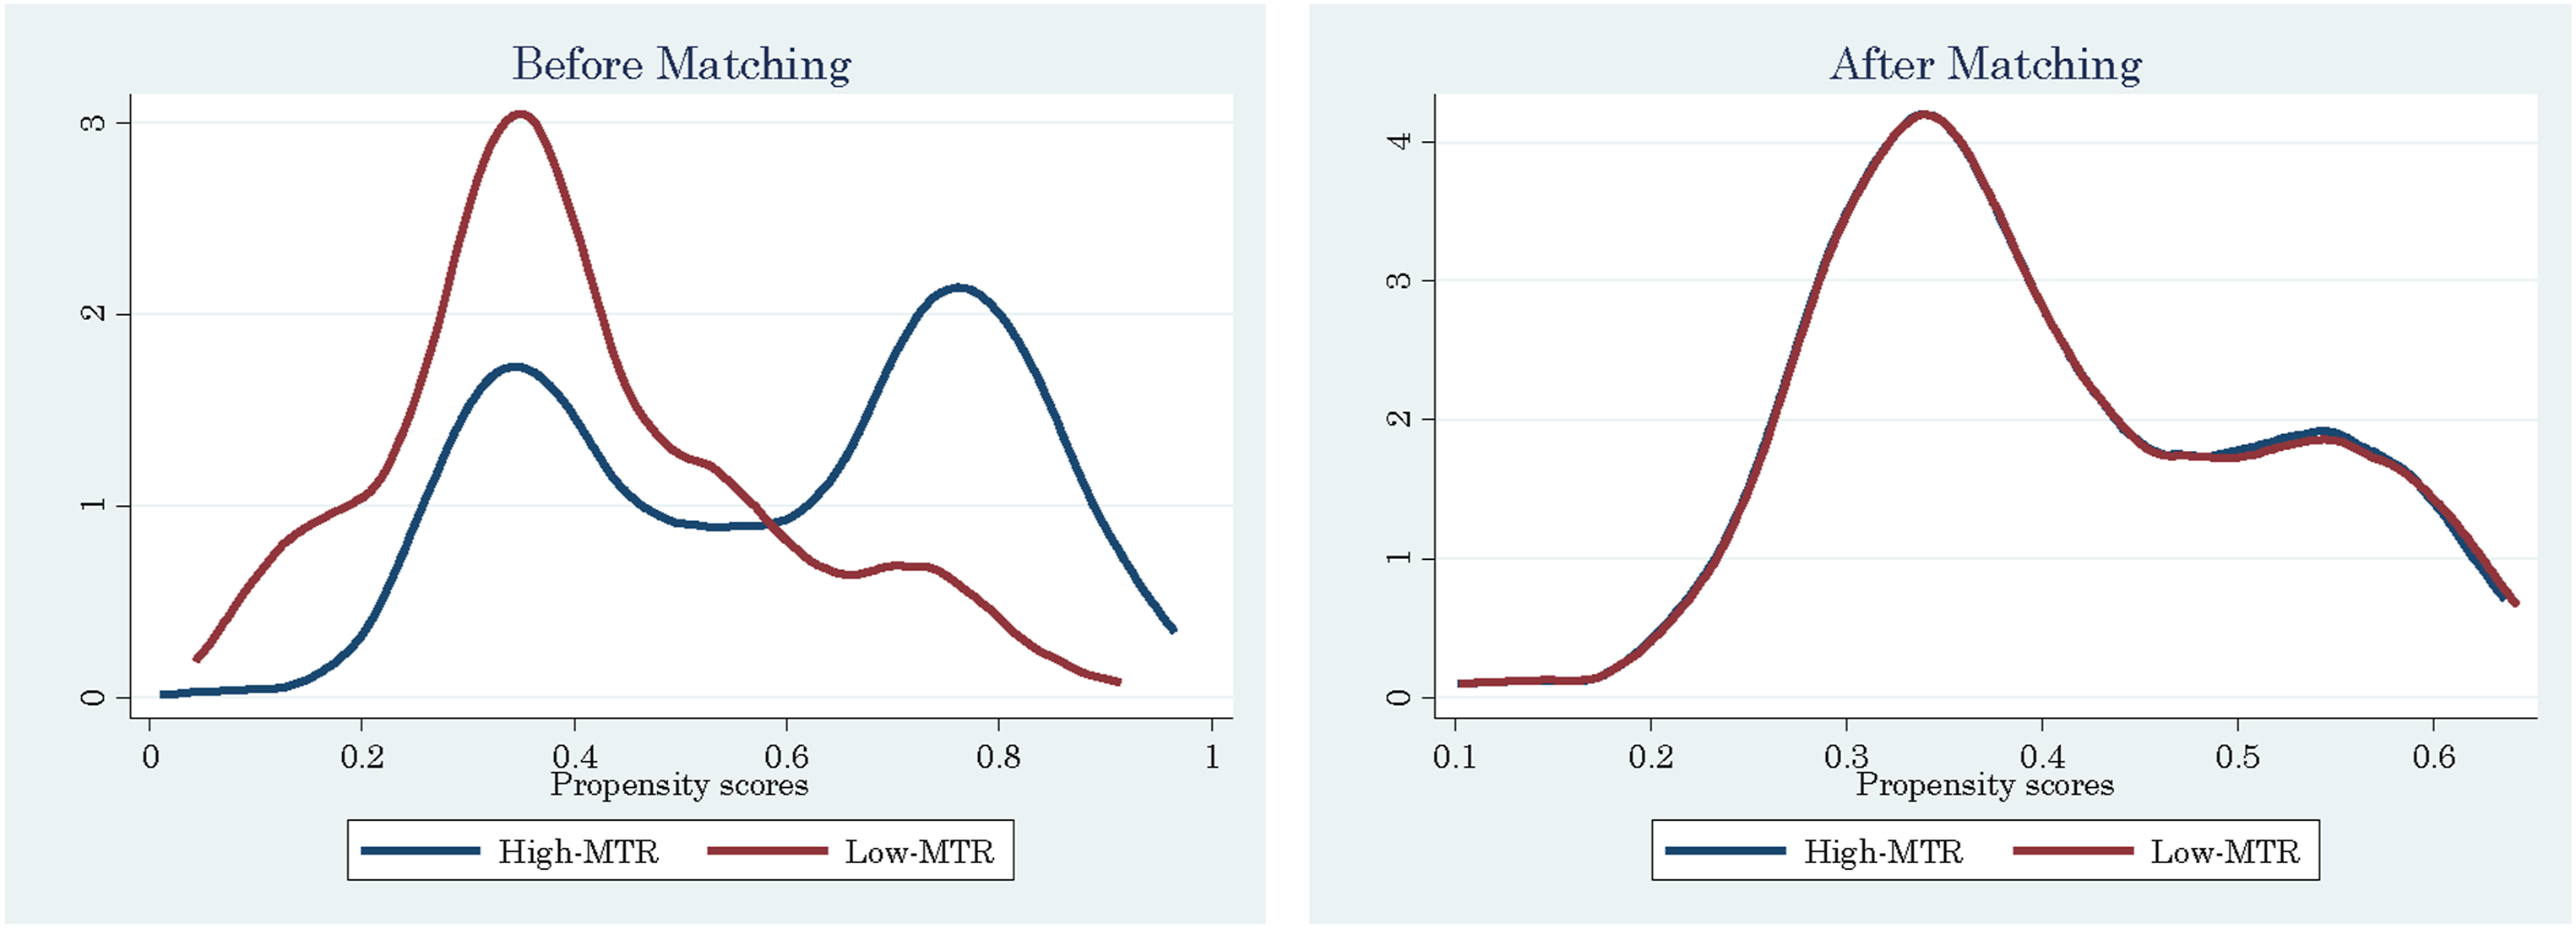
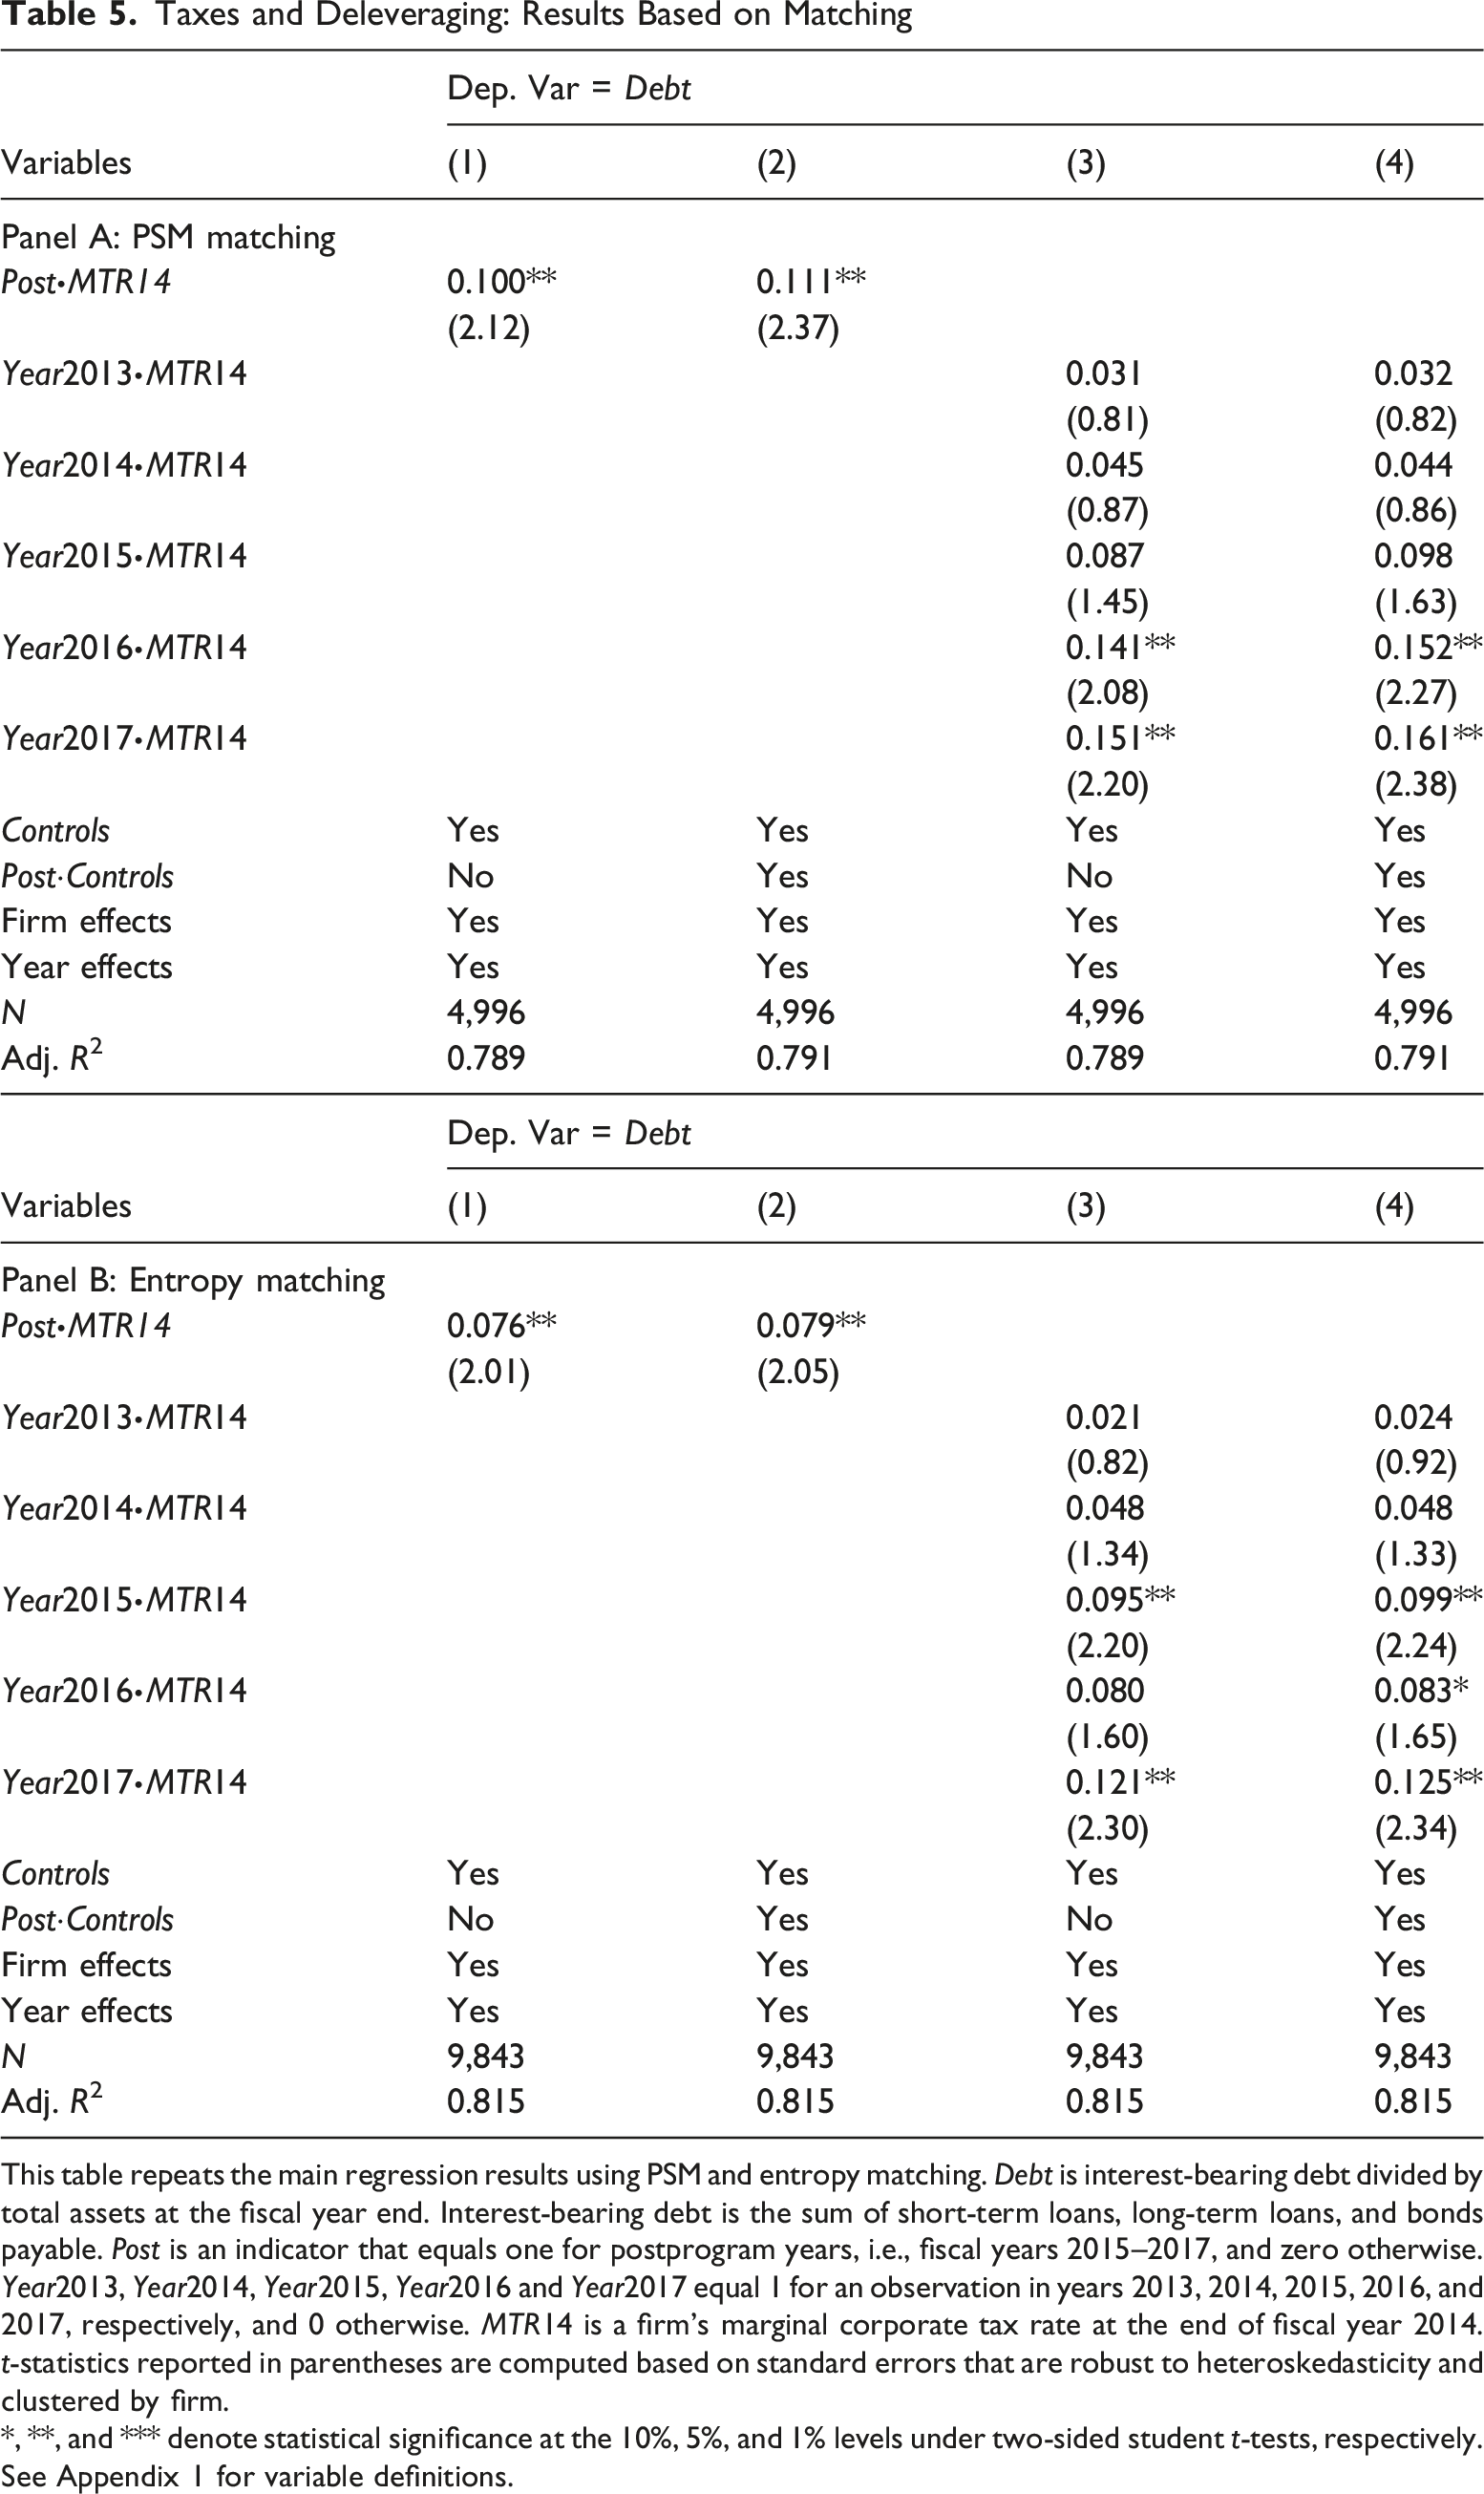
PSM causes the sample size to decrease. We alternatively use entropy-balanced matching to keep our sample intact. The regression results using the entropy-balanced sample are reported in Panel B, Table 5. The coefficients on Post·MTR14 are positive and significant (0.076, t = 2.01 with control variables and 0.079, t = 2.05 with control variables as well as Post and control variable interactions). Again, if we consider a high-tax-rate firm with a third quartile MTR14 (0.250) and a low-tax-rate firm with a first quartile MTR14 (0.132), based on the estimate in Column (1), the former’s postdeleveraging reduction in Debt is 0.90% (0.076 × (0.250–0.132)) lower than that of the latter, accounting for 21.87% of the unconditional program effect (a 4.1% reduction (Table 2) in Debt for all firms). In the dynamic model, the coefficients on Year2013·MTR14 and Year2014·MTR14 are insignificant, again indicating a parallel pretrend. The coefficients on interaction terms involving postprogram indicators are mostly positive and statistically significant. Again, empirical evidence supports Hypothesis 1.
Robustness—Controlling for Business Cycle and Dosage
Robustness Analysis
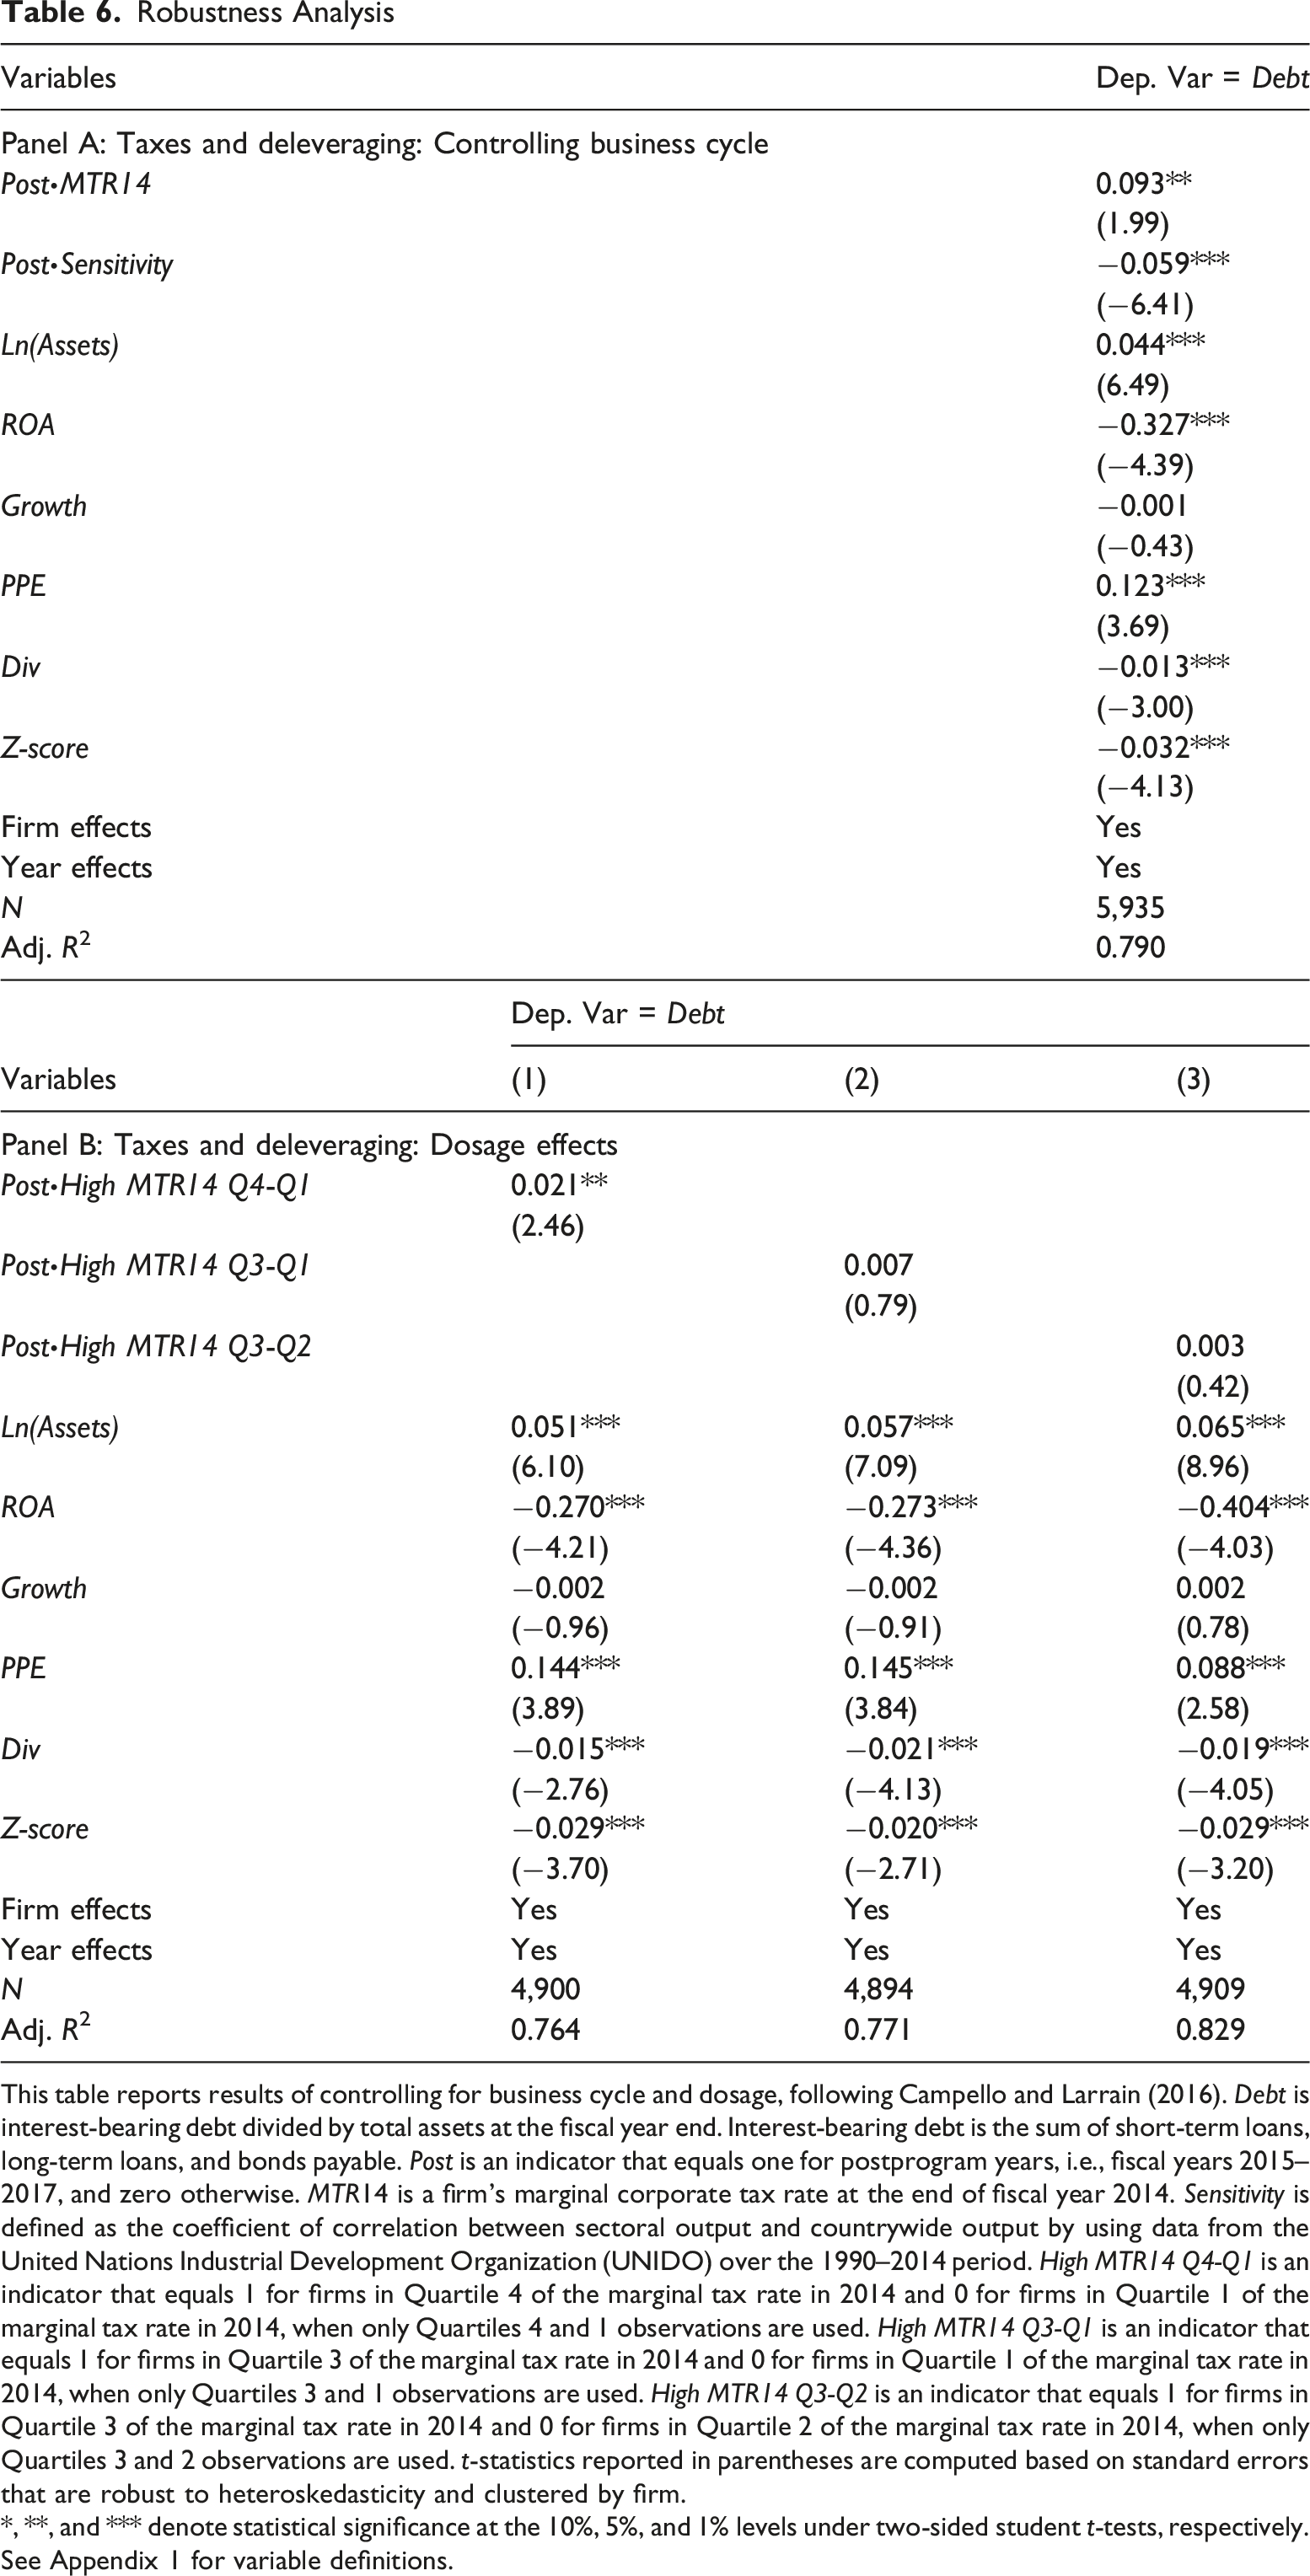
This table reports results of controlling for business cycle and dosage, following Campello and Larrain (2016). Debt is interest-bearing debt divided by total assets at the fiscal year end. Interest-bearing debt is the sum of short-term loans, long-term loans, and bonds payable. Post is an indicator that equals one for postprogram years, i.e., fiscal years 2015–2017, and zero otherwise. MTR14 is a firm’s marginal corporate tax rate at the end of fiscal year 2014. Sensitivity is defined as the coefficient of correlation between sectoral output and countrywide output by using data from the United Nations Industrial Development Organization (UNIDO) over the 1990–2014 period. High MTR14 Q4-Q1 is an indicator that equals 1 for firms in Quartile 4 of the marginal tax rate in 2014 and 0 for firms in Quartile 1 of the marginal tax rate in 2014, when only Quartiles 4 and 1 observations are used. High MTR14 Q3-Q1 is an indicator that equals 1 for firms in Quartile 3 of the marginal tax rate in 2014 and 0 for firms in Quartile 1 of the marginal tax rate in 2014, when only Quartiles 3 and 1 observations are used. High MTR14 Q3-Q2 is an indicator that equals 1 for firms in Quartile 3 of the marginal tax rate in 2014 and 0 for firms in Quartile 2 of the marginal tax rate in 2014, when only Quartiles 3 and 2 observations are used. t-statistics reported in parentheses are computed based on standard errors that are robust to heteroskedasticity and clustered by firm.
*, **, and *** denote statistical significance at the 10%, 5%, and 1% levels under two-sided student t-tests, respectively. See Appendix 1 for variable definitions.
Additionally, following Campello and Larrain (2016), we conduct a dosage test, which tells us how deleveraging is sensitive to the marginal tax rates conditional on the range of the tax rates. We define three indicators based on the subsamples that we use for our analysis. High MTR14 Q4-Q1 is an indicator that equals 1 for firms in Quartile 4 of the marginal tax rate in 2014 and 0 for firms in Quartile 1 of the marginal tax rate in 2014, when only Quartiles 4 and 1 observations are used. High MTR14 Q3-Q1 is an indicator that equals 1 for firms in Quartile 3 of the marginal tax rate in 2014 and 0 for firms in Quartile 1 of the marginal tax rate in 2014, when only Quartiles 3 and 1 observations are used. High MTR14 Q3-Q2 is an indicator that equals 1 for firms in Quartile 3 of the marginal tax rate in 2014 and 0 for firms in Quartile 2 of the marginal tax rate in 2014, when only Quartiles 3 and 2 observations are used. Panel B, Table 6 reports the results. Only the coefficient on Post·High MTR Q4-Q1 is positive and significant (0.021, t = 2.46). It appears that the marginal tax rate in mitigating deleveraging is the most pronounced when we compare the highest versus the lowest quartiles of the marginal tax rate distributions.
Property Rights and Tax-Leverage
The view that corporate taxes shape capital structure lies at the heart of the trade-off theory of capital structure. However, for state-owned enterprises (SOEs) in China, the trade-off theory suggests a weakened tax-leverage link. Implicit guarantees from the state suggest that SOEs have a lower financial distress cost to trade-off. Furthermore, seeking tax shields to lower their tax burden is also less of an incentive for SOEs (Bradshaw et al., 2019). Hypothesis 2 predicts a less pronounced effect of corporate tax on firms’ leverage adjustments during deleveraging for SOEs, compared with NSOEs.
State Ownership and the Tax Effect on Deleveraging
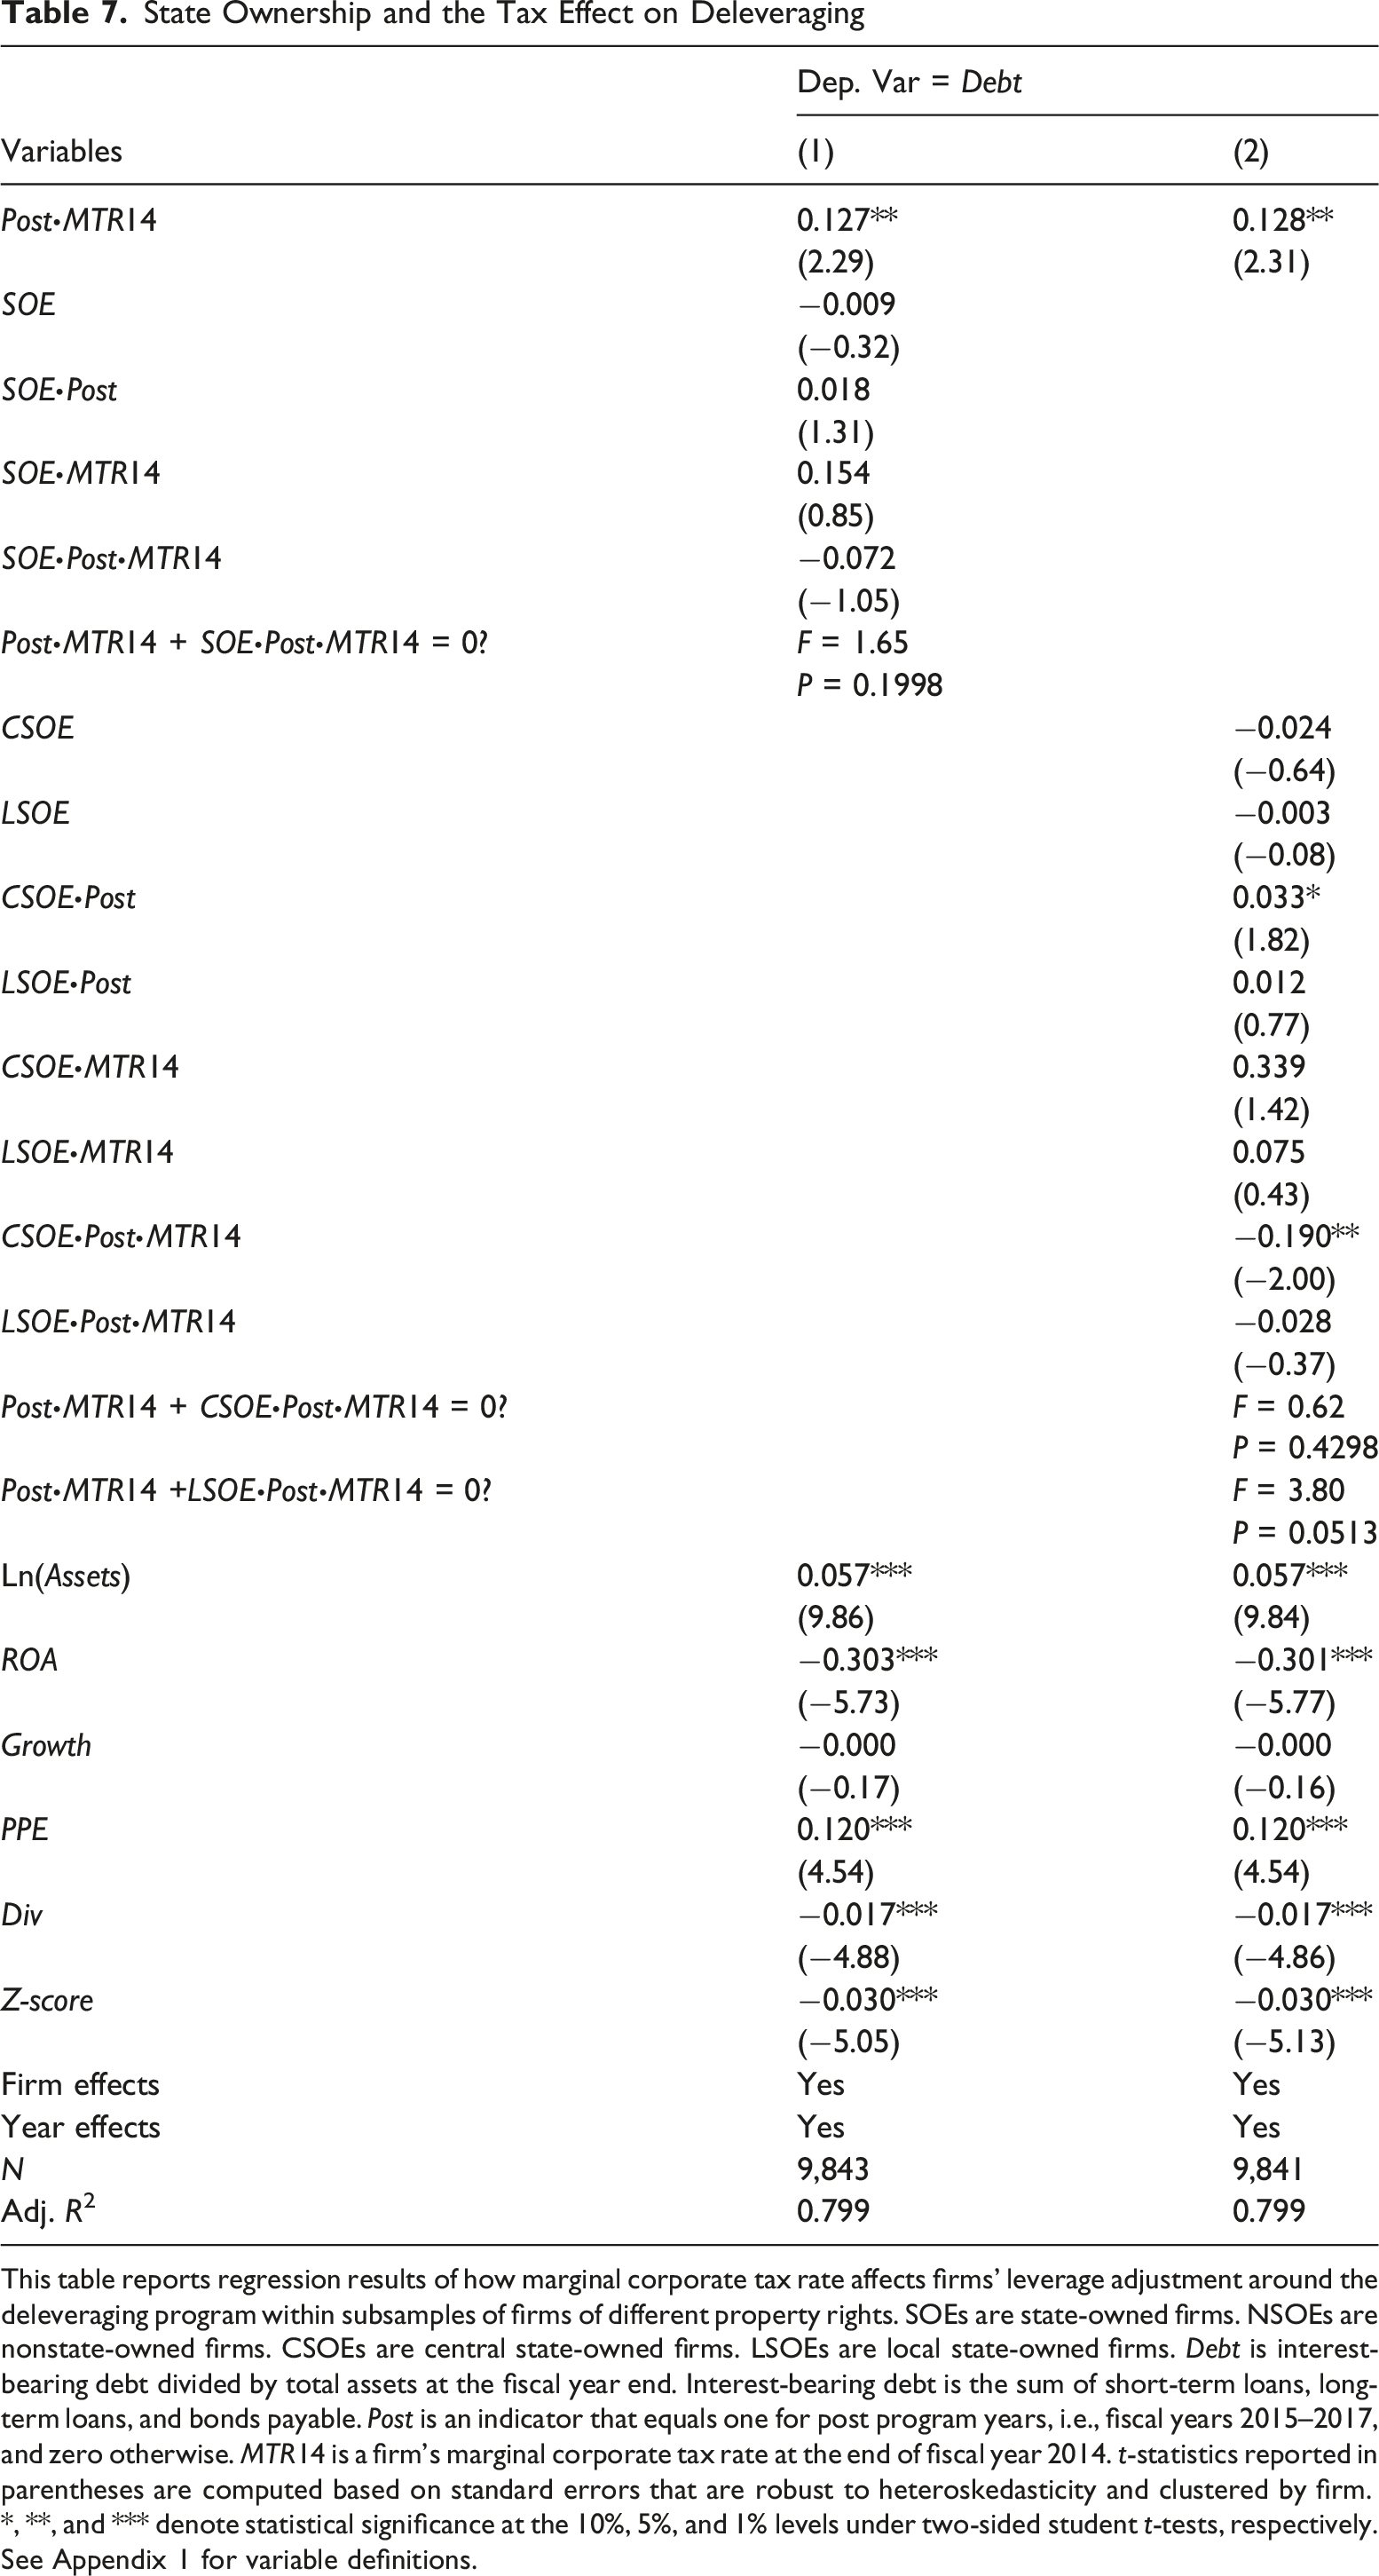
This table reports regression results of how marginal corporate tax rate affects firms’ leverage adjustment around the deleveraging program within subsamples of firms of different property rights. SOEs are state-owned firms. NSOEs are nonstate-owned firms. CSOEs are central state-owned firms. LSOEs are local state-owned firms. Debt is interest-bearing debt divided by total assets at the fiscal year end. Interest-bearing debt is the sum of short-term loans, long-term loans, and bonds payable. Post is an indicator that equals one for post program years, i.e., fiscal years 2015–2017, and zero otherwise. MTR14 is a firm’s marginal corporate tax rate at the end of fiscal year 2014. t-statistics reported in parentheses are computed based on standard errors that are robust to heteroskedasticity and clustered by firm.
*, **, and *** denote statistical significance at the 10%, 5%, and 1% levels under two-sided student t-tests, respectively. See Appendix 1 for variable definitions.
We further divide SOEs into those owned by the central government (CSOEs) and those owned by local governments (LSOEs). We add their interactions with Post·MTR14, Post and MTR14 to equation (1). Column (2) shows that the coefficient on CSOE·Post·MTR14 is negative and significant (−0.190, t = −2.00) and an F-test (p = 0.4298) cannot reject that the sum of the coefficients on Post·MTR14 and CSOE·Post·MTR14 is 0, suggesting that central SOEs’ deleveraging is not sensitive to their marginal tax rate. The coefficient on LSOE·Post·MTR14 is negative but statistically insignificant (−0.028, t = −0.37) and an F-test (p = 0.0513) rejects that the sum of the coefficients on Post·MTR14 and LSOE·Post·MTR14 is 0, suggesting that local SOEs’ deleveraging is also sensitive to their marginal tax rates, although to a lesser extent than of non-SOEs.
Overall, the above pattern supports Hypothesis 2 that the negative effect of the marginal corporate tax rate on deleveraging is more pronounced in nonstate-owned firms than in state-owned firms. However, local SOEs, which are farther from the central government, are more market oriented than central SOEs, and their deleveraging is also sensitive to their marginal tax rates, although to a lesser extent than that of nonstate-owned firms.
Nondebt Tax Shield and Tax-Leverage
Furthermore, we explore the potential heterogeneity in the effect of corporate taxes on firms’ capital structure adjustments during the deleveraging program caused by nondebt tax shields. If high marginal tax rate firms reduce leverage to a lesser extent to preserve the debt tax shield, the presence of nondebt tax shields should mitigate this effect. For firms with nondebt tax shields, the marginal tax benefit of taking on additional debt is lower. With a reduced benefit associated with the debt tax shield, firms with high marginal tax rates become less eager to resist deleveraging. We estimate the following equation:
Nondebt Tax Shields and the Tax Effect on Deleveraging
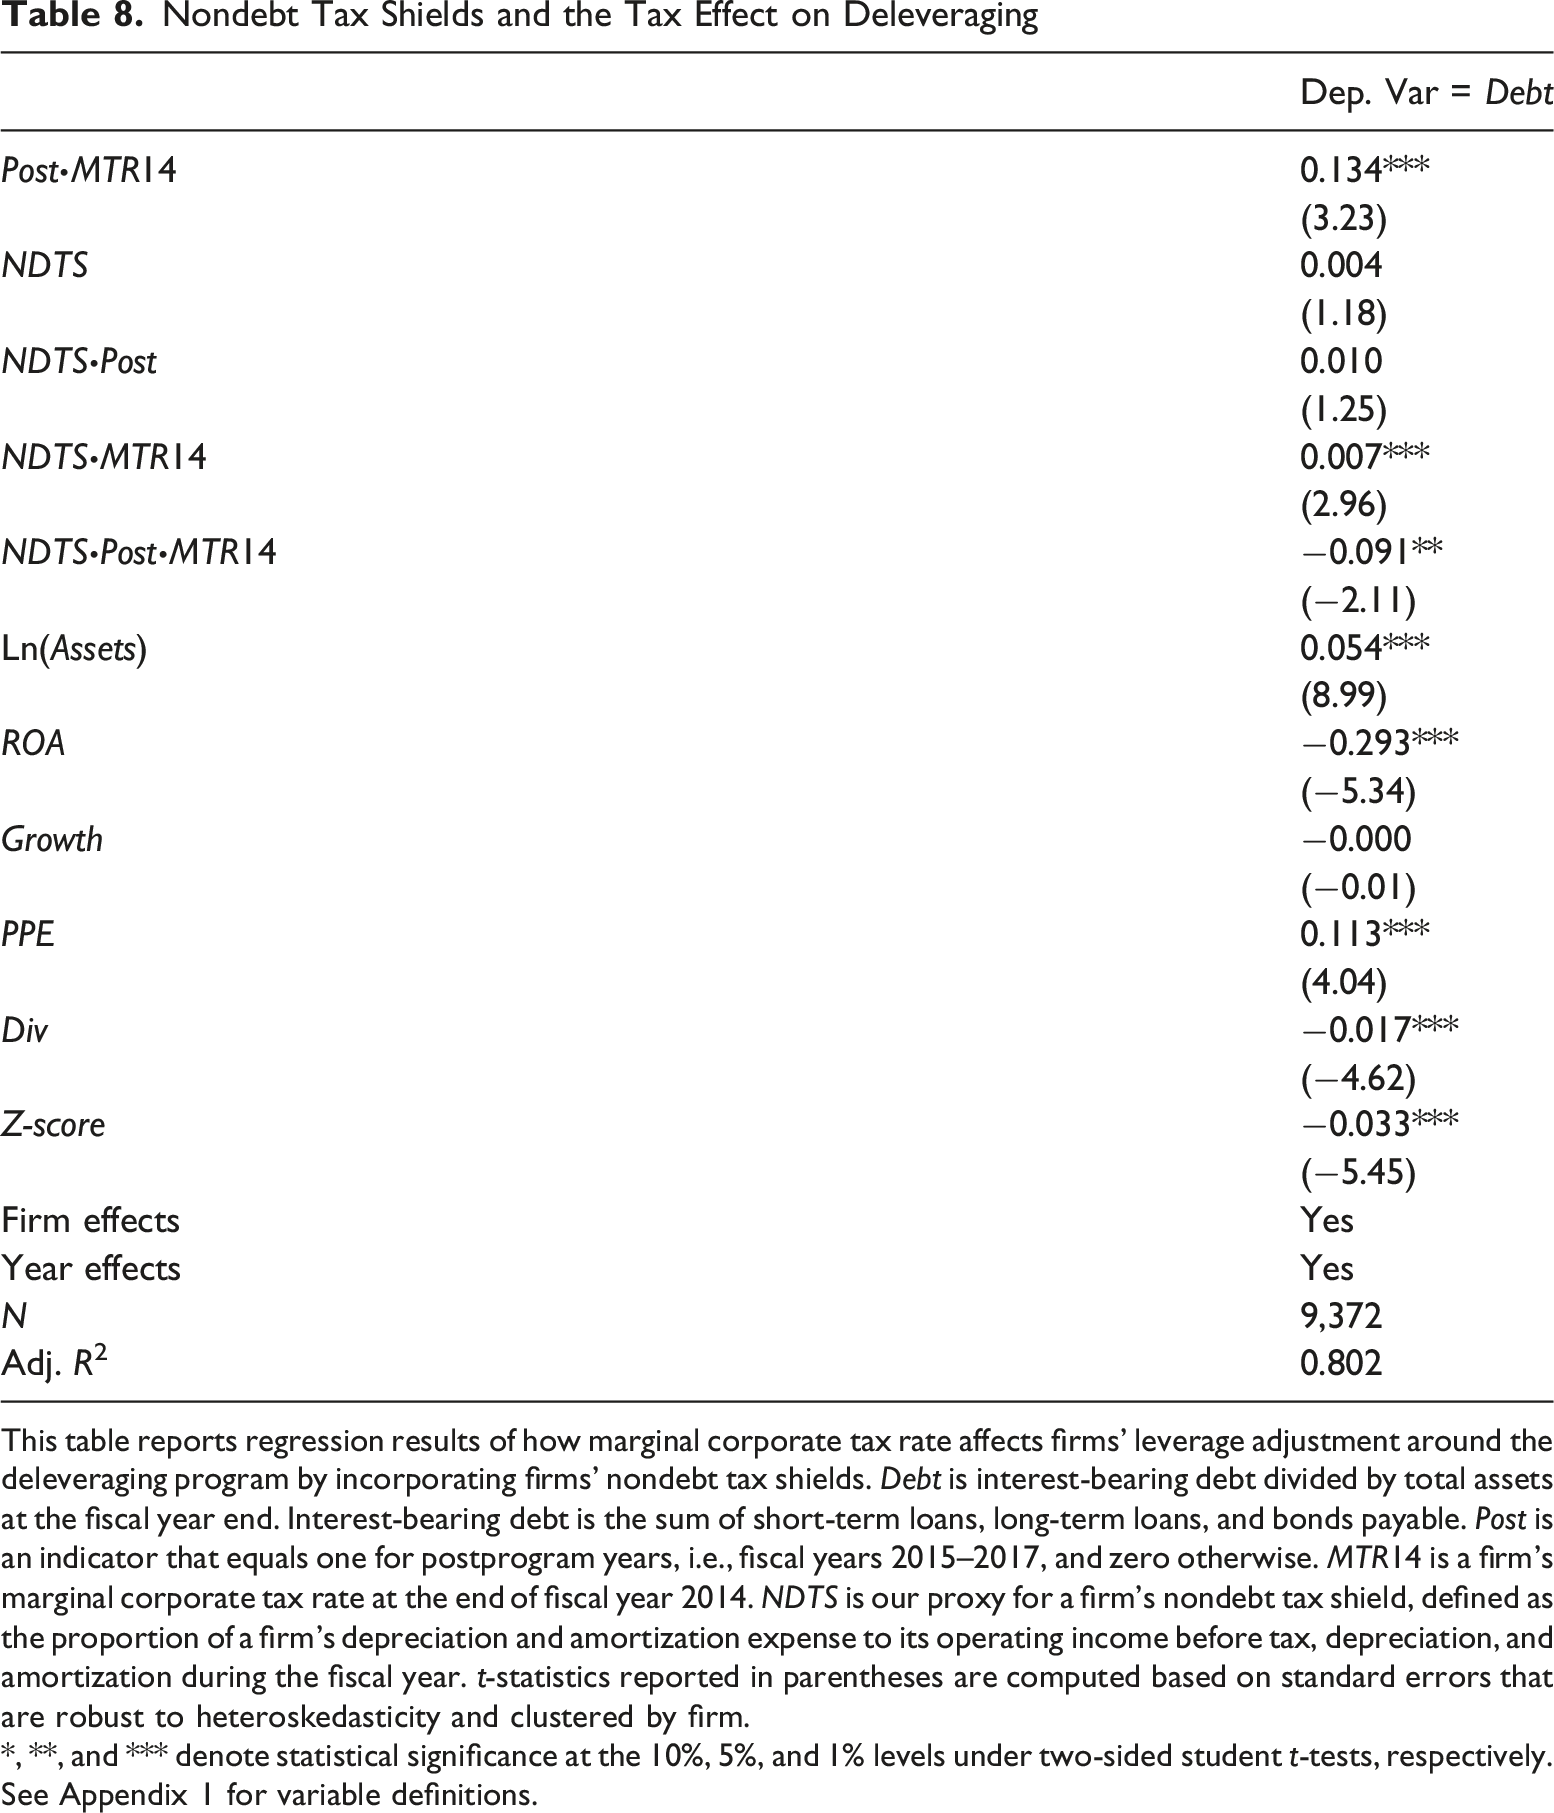
This table reports regression results of how marginal corporate tax rate affects firms’ leverage adjustment around the deleveraging program by incorporating firms’ nondebt tax shields. Debt is interest-bearing debt divided by total assets at the fiscal year end. Interest-bearing debt is the sum of short-term loans, long-term loans, and bonds payable. Post is an indicator that equals one for postprogram years, i.e., fiscal years 2015–2017, and zero otherwise. MTR14 is a firm’s marginal corporate tax rate at the end of fiscal year 2014. NDTS is our proxy for a firm’s nondebt tax shield, defined as the proportion of a firm’s depreciation and amortization expense to its operating income before tax, depreciation, and amortization during the fiscal year. t-statistics reported in parentheses are computed based on standard errors that are robust to heteroskedasticity and clustered by firm.
*, **, and *** denote statistical significance at the 10%, 5%, and 1% levels under two-sided student t-tests, respectively. See Appendix 1 for variable definitions.
Dividend and Equity/Debt Financing Choices
Thus far, we have shown that high-tax-rate firms, compared with low-tax-rate firms, experience a smaller reduction in leverage after the initiation of the deleveraging program. Here, we explore specific mechanisms through which firms reduce leverage. Importantly, we examine whether these mechanisms are also influenced by firms’ marginal tax rates.
Firms can reduce leverage through (1) paying off existing debt and (2) taking on less new debt. For the first mechanism, we examine firms’ dividend payouts. Reducing dividends retains more internal capital that can be used to pay off existing debt.
11
For the second mechanism, we examine whether firms seek more of their new capital in the form of equity instead of debt. We expect that high-tax-rate firms are less likely to reduce dividends or switch from debt financing to equity financing than low-tax-rate firms. We examine the above predictions by estimating the following equation:
Following Li et al. (2017) and Nessa (2017), we include Ln(Assets), ROA, Growth, Lev, Cash, Std_ROA, Return, and Invest as control variables when the dependent variable is a firm’s dividend payout. Ln(Assets), Growth, and ROA are as defined earlier. Lev is total liabilities divided by total assets as of the previous fiscal year end. Cash is cash divided by the book value of total assets as of the previous fiscal year end. Std_ROA is a firm’s standard deviation of ROA during the previous 3 years. Return is market-adjusted annual stock return during the previous fiscal year. Invest is cash payments for fixed assets, intangible assets, and other long-term assets from the cash flow statement divided by total assets during the previous fiscal year. The control variables are the same as those in equation (1) when the dependent variable is EquityFinanced% as it is a dynamic component of capital structure. The other model specifications are the same as those in equation (1). We predict
Dividend, Debt/Equity Financing, and the Tax Effect on Deleveraging
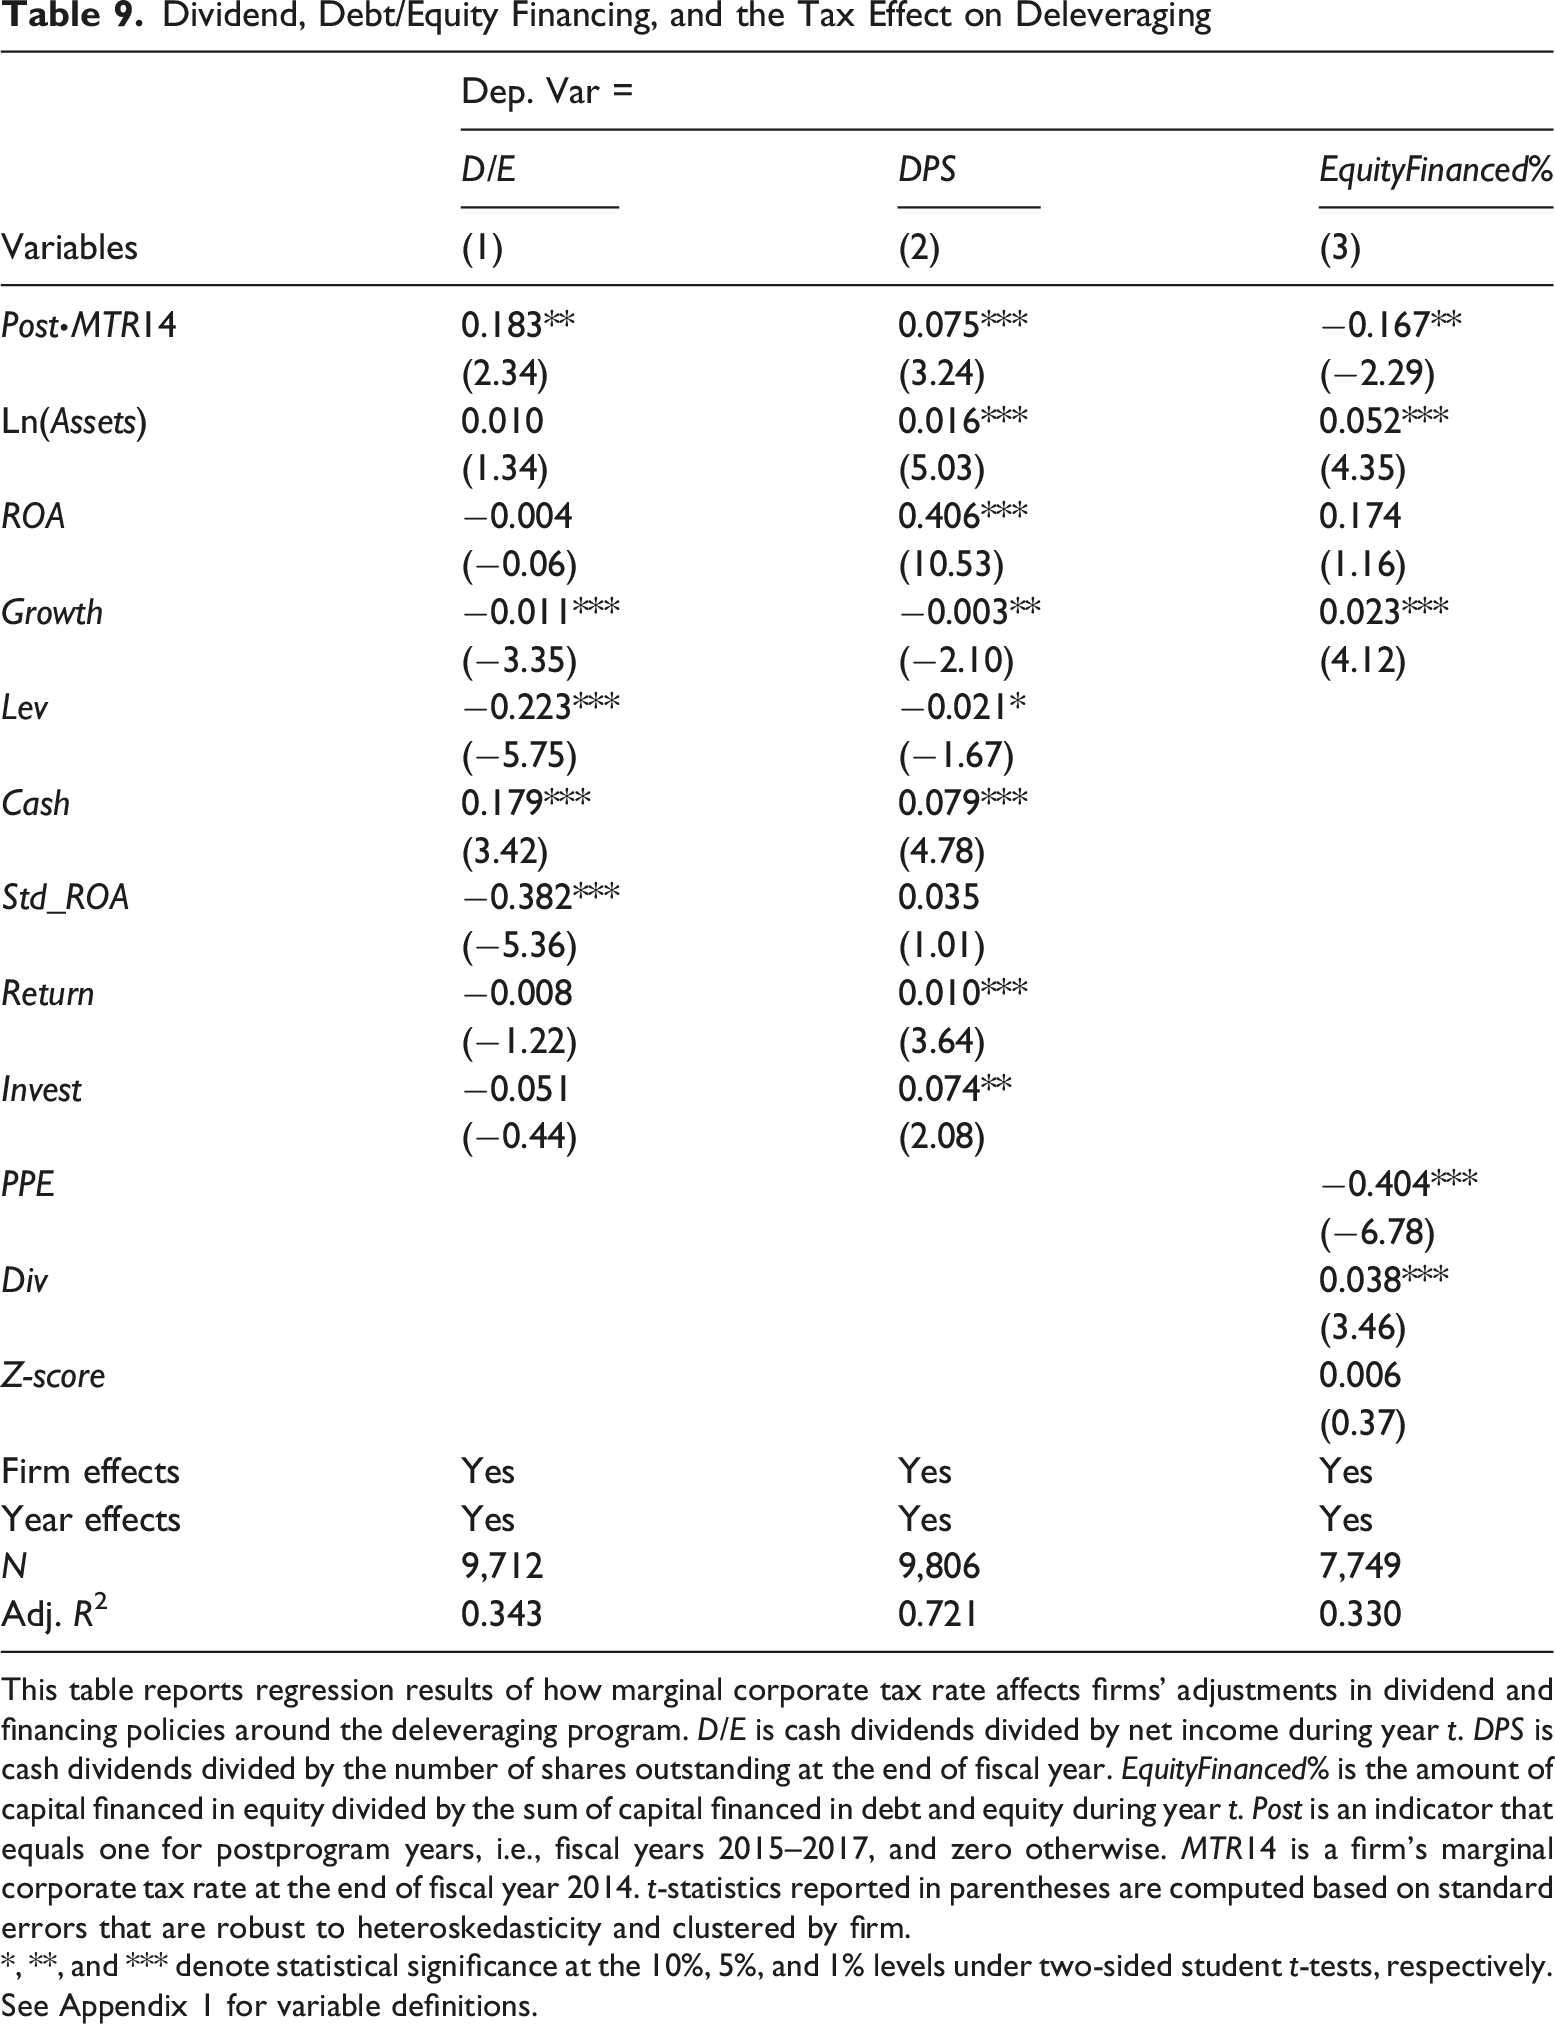
This table reports regression results of how marginal corporate tax rate affects firms’ adjustments in dividend and financing policies around the deleveraging program. D/E is cash dividends divided by net income during year t. DPS is cash dividends divided by the number of shares outstanding at the end of fiscal year. EquityFinanced% is the amount of capital financed in equity divided by the sum of capital financed in debt and equity during year t. Post is an indicator that equals one for postprogram years, i.e., fiscal years 2015–2017, and zero otherwise. MTR14 is a firm’s marginal corporate tax rate at the end of fiscal year 2014. t-statistics reported in parentheses are computed based on standard errors that are robust to heteroskedasticity and clustered by firm.
*, **, and *** denote statistical significance at the 10%, 5%, and 1% levels under two-sided student t-tests, respectively. See Appendix 1 for variable definitions.
With respect to firms’ financing decisions, EquityFinanced%, Column (3) shows a negative and statistically significant coefficient on Post∙MTR14 (−0.167, t = −2.29). In economic terms, a low-tax-rate firm with an MTR14 equal to 0.132 (first quartile) raises an additional 1.97% (0.167 × (0.250–0.132)) of new capital in the form of equity, compared with a high-tax-rate firm with an MTR14 equal to 0.250 (third quartile). Such an effect accounts for 13.78% (1.97%/14.30%) of the sample mean of EquityFinanced% and is therefore economically significant.
Overall, the results suggest that, compared with low-tax-rate firms, high-tax-rate firms are less likely to cut dividend payouts and less likely to switch from debt financing to equity financing, during the deleveraging program. This empirical evidence sheds light on how firms with differential marginal tax rates manage to adjust their capital structure in response to the deleveraging program.
Deleveraging, Tax and Corporate Investments
Our final hypothesis addresses the implications of the deleveraging program for corporate investments. As investments are funded with capital, we build on our main findings on the effect of marginal tax rates on firms’ capital structure decisions and predict a lower reduction in corporate investments for high-tax-rate firms, compared with low-tax-rate firms. We focus on corporate investments which represent the most important nonfinancial decision that affects firm value (Modigliani & Miller, 1958).
We consider multiple dimensions of corporate investment: (1) capital expenditure (investment in fixed assets), (2) investment in research and development, and (3) investment in human capital. By employing equation (1), we now replace Debt with our measures for corporate investment. Following Edmans et al. (2017), we include Q, Cash, Ret_Earn, Ln(Assets), ROA, Lev and Return as control variables. To measure investment opportunities, Q is the sum of the market value of equity and the book value of total liabilities divided by the book value of total assets as of the previous fiscal year end. Cash is cash divided by book value of total assets as of the previous fiscal year end. Ret_Earn is retained earnings divided by total assets as of the previous fiscal year end. Cash and Ret_Earn measure firms’ internal resources to fund investments. The other variables are as defined earlier.
Deleveraging, Tax and Corporate Investments
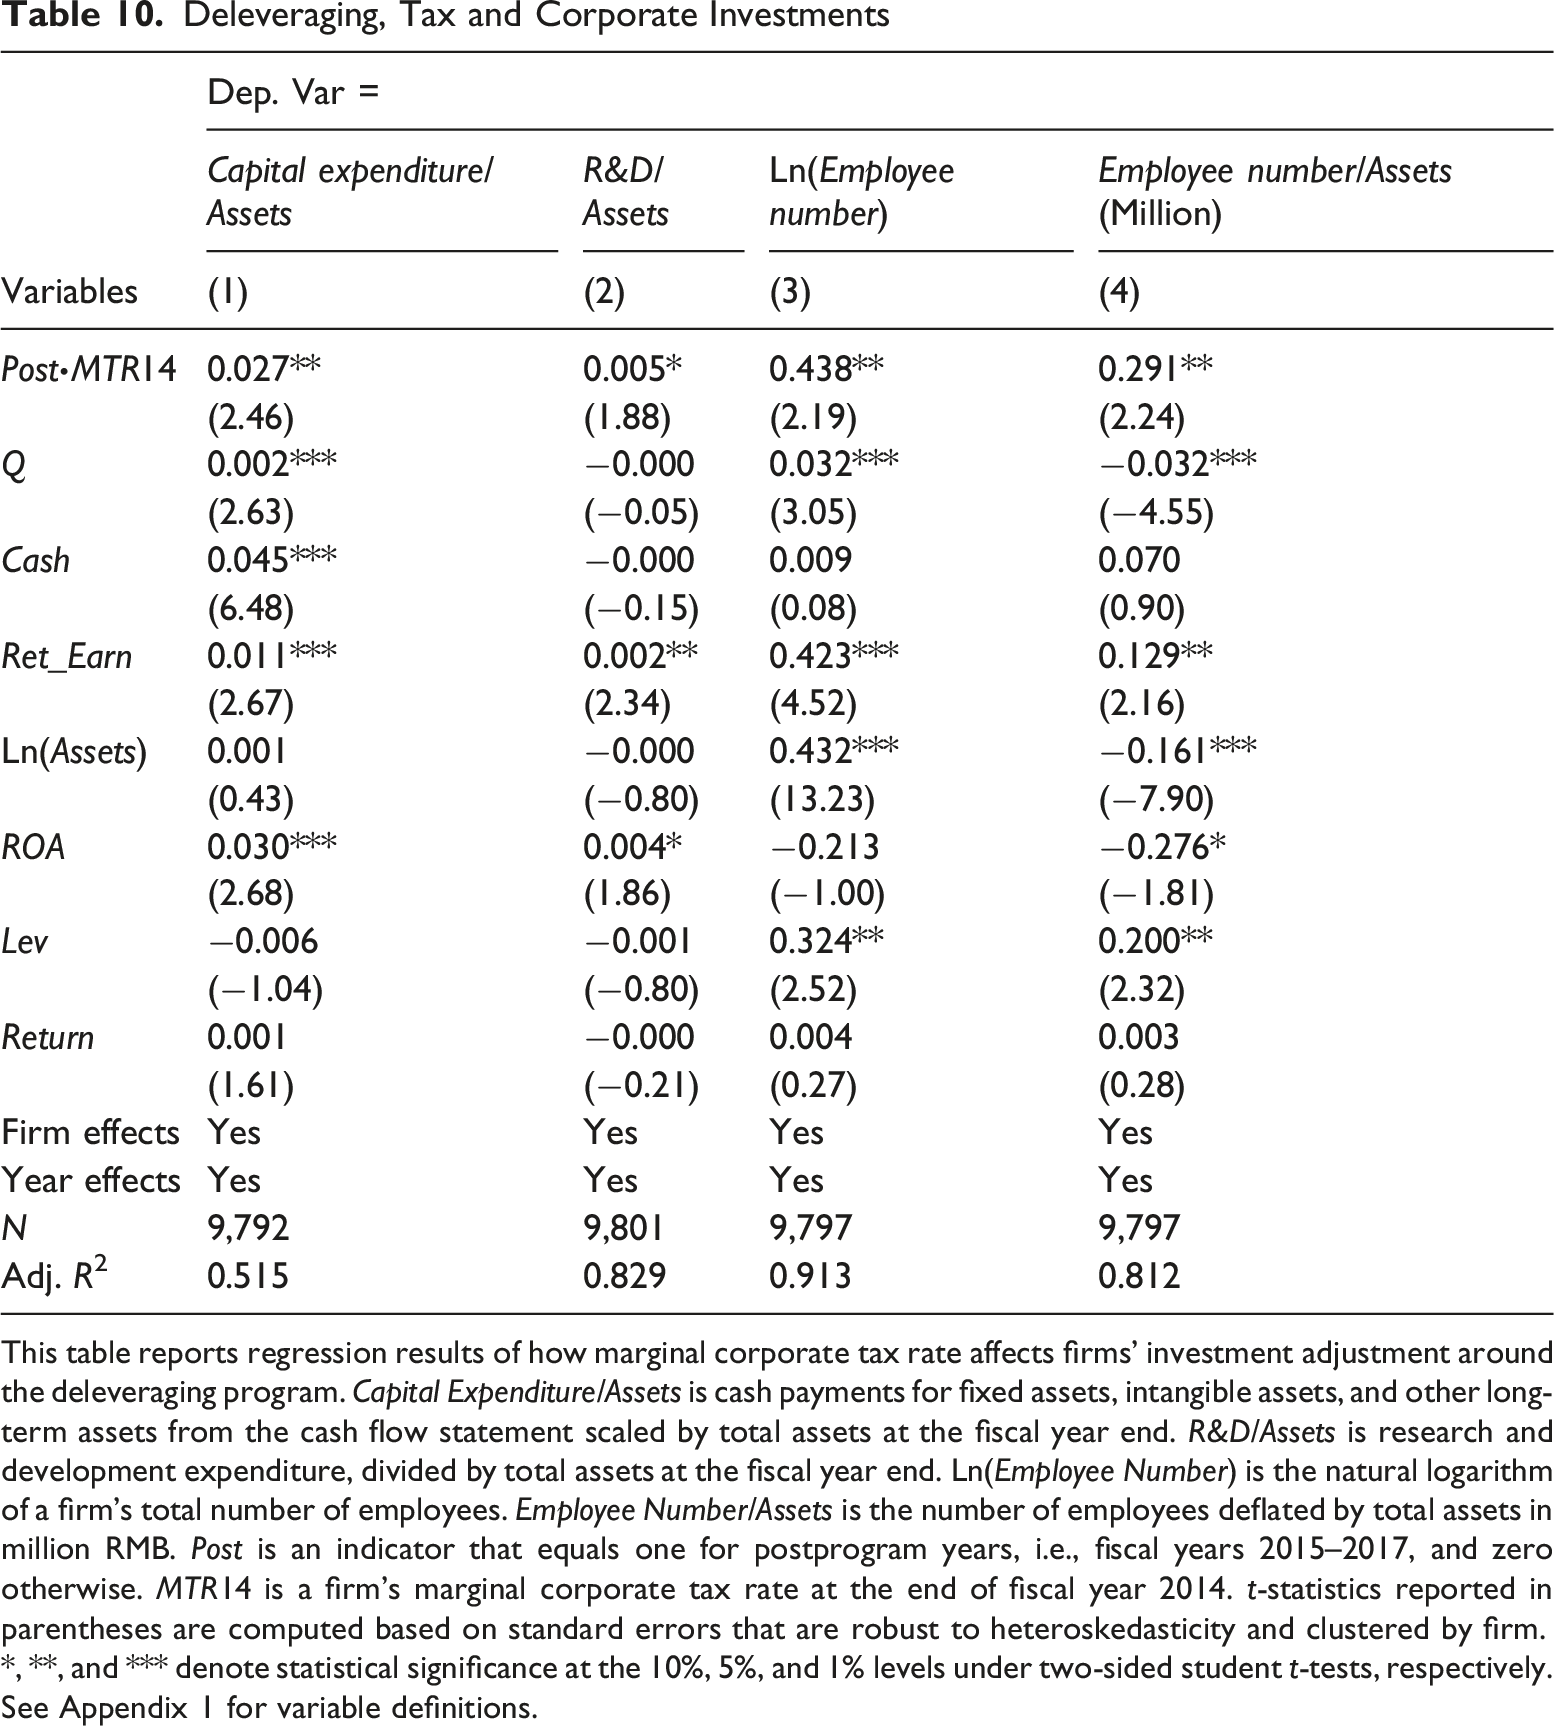
This table reports regression results of how marginal corporate tax rate affects firms’ investment adjustment around the deleveraging program. Capital Expenditure/Assets is cash payments for fixed assets, intangible assets, and other long-term assets from the cash flow statement scaled by total assets at the fiscal year end. R&D/Assets is research and development expenditure, divided by total assets at the fiscal year end. Ln(Employee Number) is the natural logarithm of a firm’s total number of employees. Employee Number/Assets is the number of employees deflated by total assets in million RMB. Post is an indicator that equals one for postprogram years, i.e., fiscal years 2015–2017, and zero otherwise. MTR14 is a firm’s marginal corporate tax rate at the end of fiscal year 2014. t-statistics reported in parentheses are computed based on standard errors that are robust to heteroskedasticity and clustered by firm.
*, **, and *** denote statistical significance at the 10%, 5%, and 1% levels under two-sided student t-tests, respectively. See Appendix 1 for variable definitions.
The results based on other investment measures are similar. Column (2) reports the results when the dependent variable is R&D/Assets, defined as a firm’s research and development expenditure, divided by its total assets at the fiscal year end. Again, the coefficient on Post∙MTR14 is positive and statistically significant (0.005, t = 1.88), suggesting that high-tax-rate firms are less likely to cut research and development expenditures during the deleveraging program. Columns (3) and (4) present the results for firms’ human capital investment. We construct two alternative variables: Ln(Employee Number), defined as the natural logarithm of a firm’s total number of employees, and Employee Number/Assets, defined as a firm’s number of employees, deflated by its total assets in million RMB. Using both measures, we find positive and statistically significant coefficients on Post∙MTR14 (0.438, t = 2.19 in Column (3); 0.291, t = 2.24 in Column (4)). Therefore, high-tax-rate firms are less likely to constrain their investment in human capital during the deleveraging program.
Taken together, the results support the notion that high marginal corporate tax rate firms, which reduce debt less, are able to cut investments to a lesser extent during the deleveraging program. In other words, by maintaining a tax shield, a high marginal corporate tax rate helps firms weather through a credit crunch.
Premise Validation—Cost of Debt During Deleveraging
We have argued that the deleveraging program significantly increases the cost for firms to access debt. Such a premise is consistent with the practices under the program that the government tightened monetary policies, restricted credit suppliers, and regulated the shadow banking sector. We now validate this premise. Empirically, we examine whether the cost of debt increases during the deleveraging program.
We construct the dependent variable COD i,t , defined as the interest payment, divided by the total amount of interest-bearing debt for firm i during year t. Our primary independent variable is the Post indicator. We follow Frank and Goyal (2009) and control for firm size (Ln(Assets)), profitability (ROA), firm growth (Growth), fixed investment (PPE), the dividend payment indicator (Div), and the Altman Z-score (Z_Score).
Cost of Debt During the 2015 Deleveraging Program
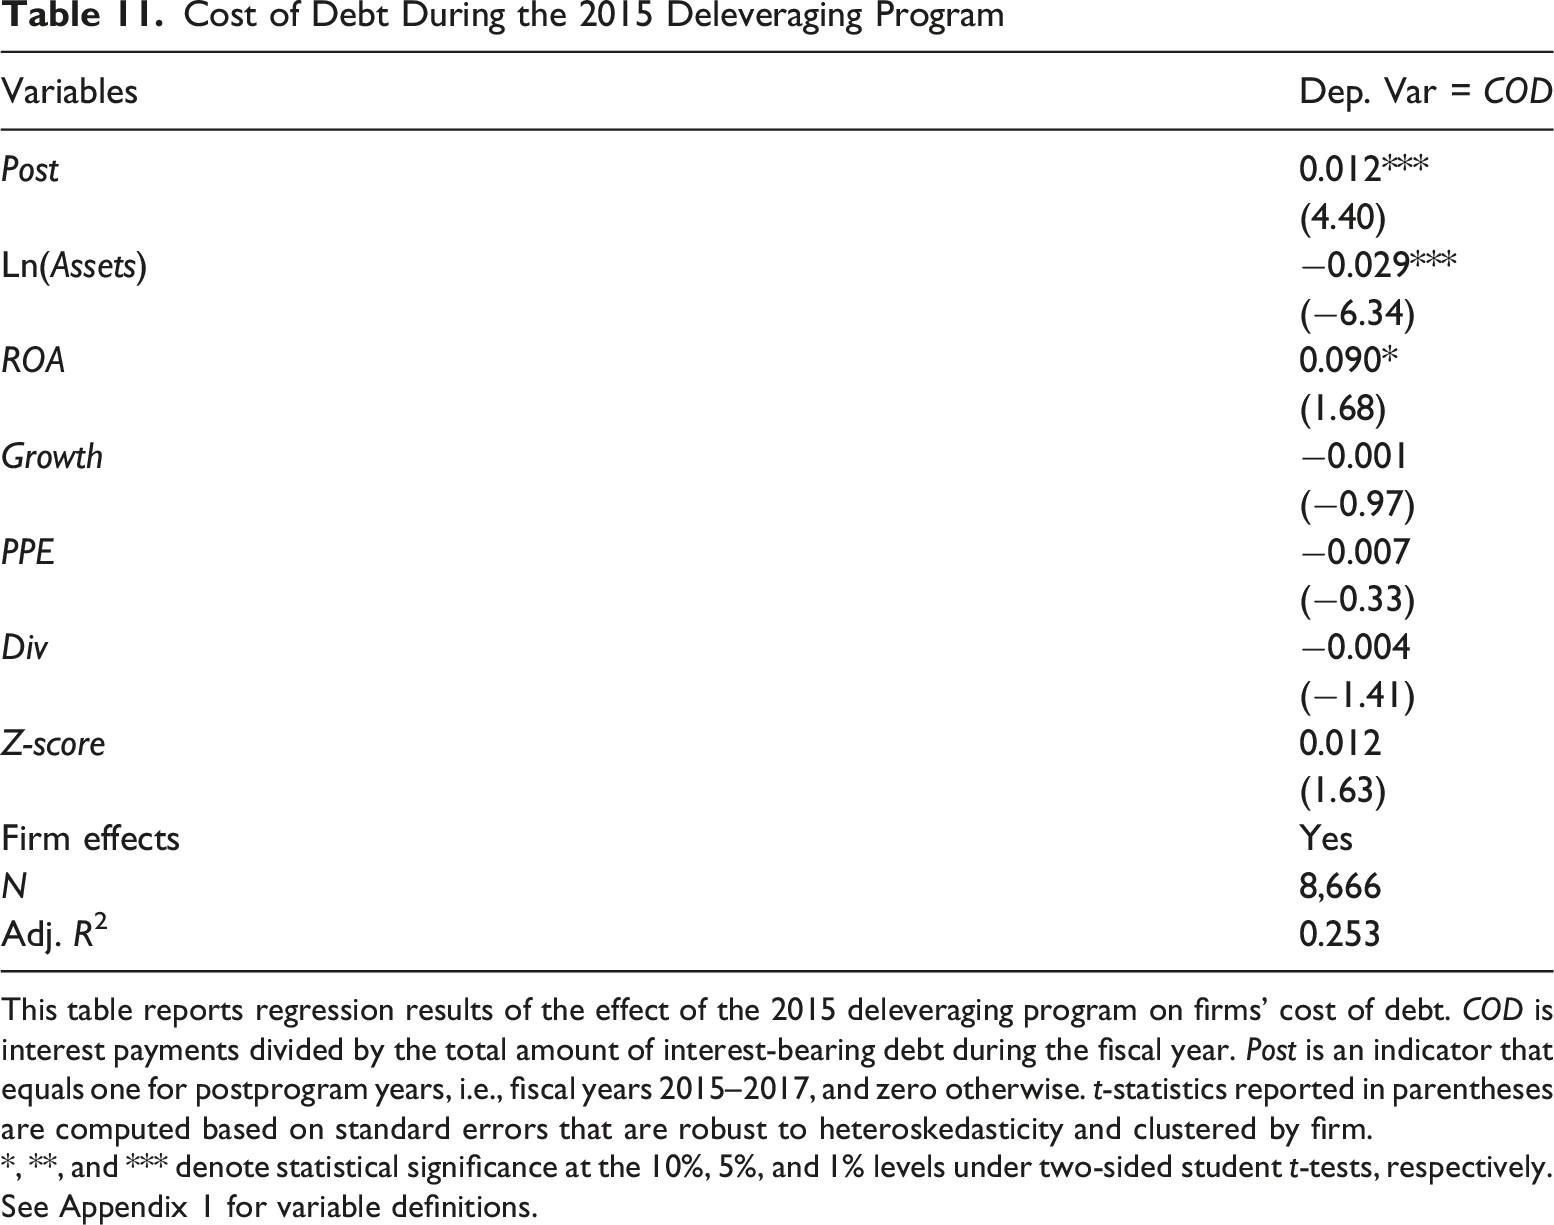
This table reports regression results of the effect of the 2015 deleveraging program on firms’ cost of debt. COD is interest payments divided by the total amount of interest-bearing debt during the fiscal year. Post is an indicator that equals one for postprogram years, i.e., fiscal years 2015–2017, and zero otherwise. t-statistics reported in parentheses are computed based on standard errors that are robust to heteroskedasticity and clustered by firm.
*, **, and *** denote statistical significance at the 10%, 5%, and 1% levels under two-sided student t-tests, respectively. See Appendix 1 for variable definitions.
We also perform tests related to the business cycle, dosage, ownership, nondebt tax shields, dividends, equity, investments and cost of debt using the PSM and entropy matching methods. The main inferences of our results remain unchanged, although the significance levels decrease in some instances. Notably, the coefficient on Post·MTR14 in the percentage of equity finance (EquityFinanced%) regression, although being negative and significant in the unmatched model, becomes insignificant (but directionally correct) with PSM or entropy matching. While reduced sample size can be one explanation, among many, for this insignificant result with PSM, it does not explain the change observed with entropy matching, as the sample size is kept intact. We therefore acknowledge that some mechanism test results are sensitive to matching. 12
Additional Analyses
Robustness Analyses of Market Leverage and Preprogram Average MTR
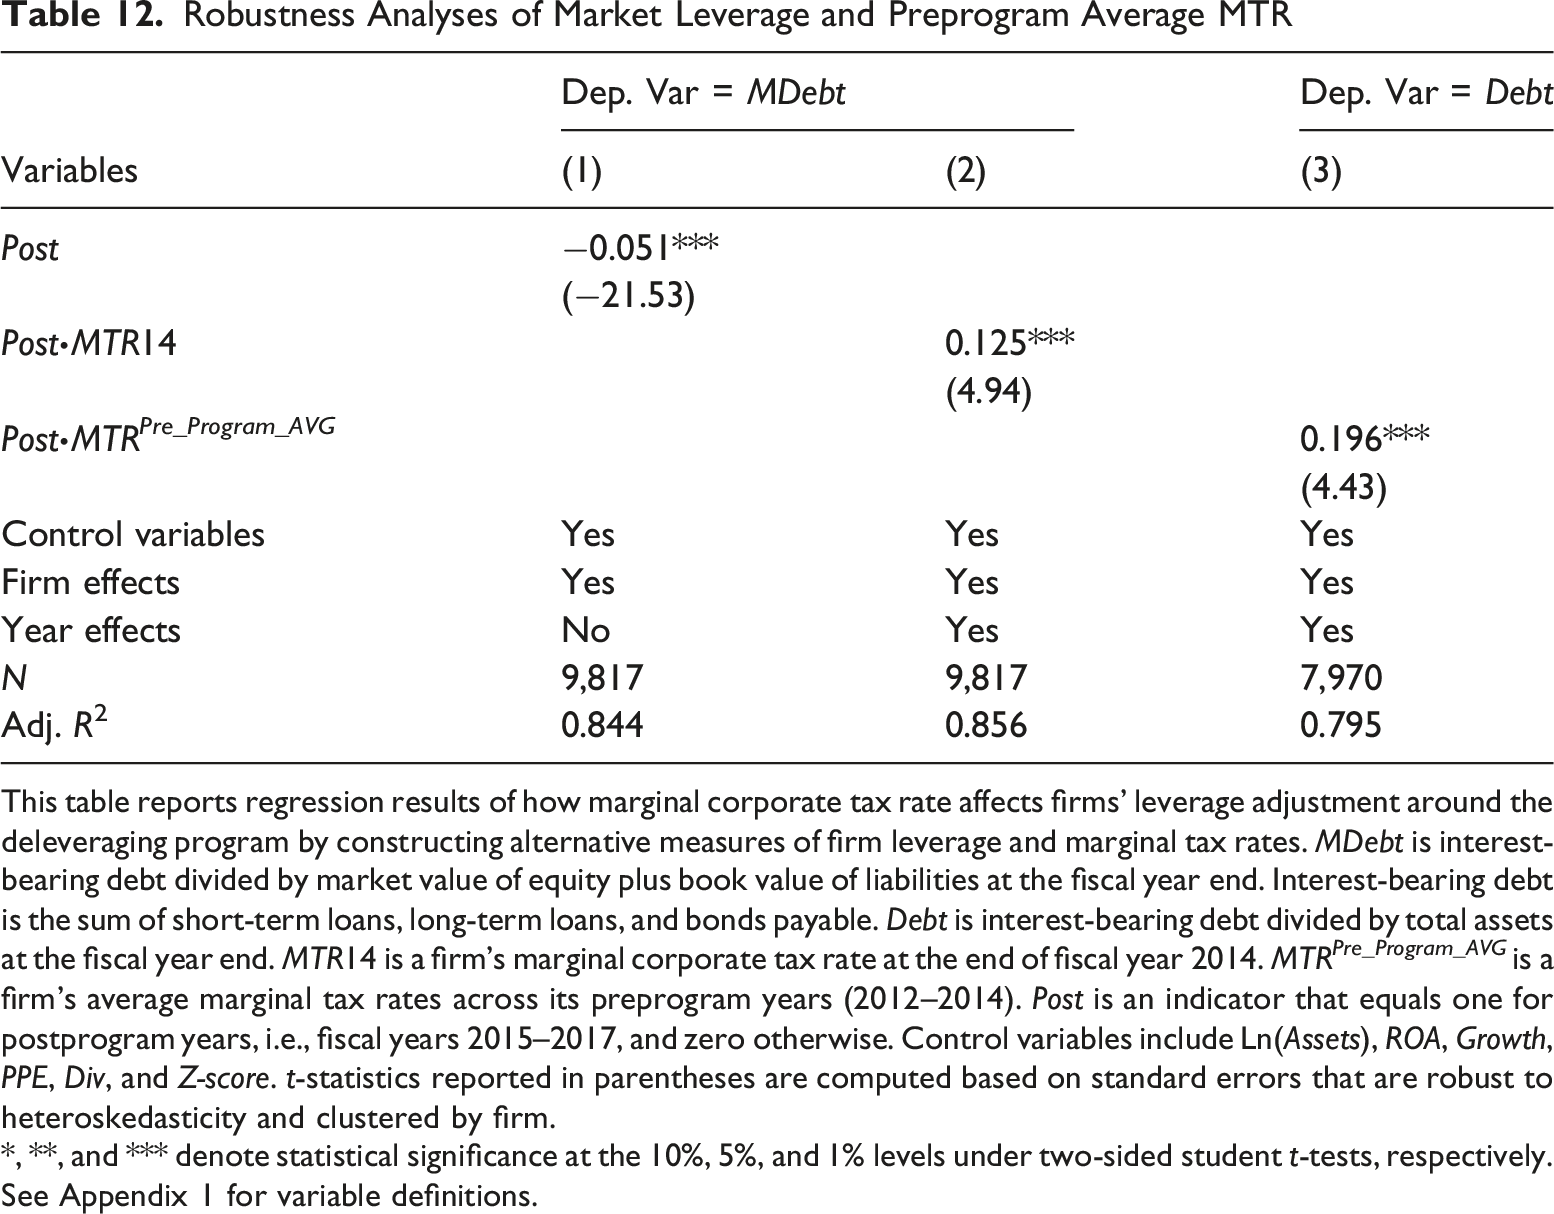
This table reports regression results of how marginal corporate tax rate affects firms’ leverage adjustment around the deleveraging program by constructing alternative measures of firm leverage and marginal tax rates. MDebt is interest-bearing debt divided by market value of equity plus book value of liabilities at the fiscal year end. Interest-bearing debt is the sum of short-term loans, long-term loans, and bonds payable. Debt is interest-bearing debt divided by total assets at the fiscal year end. MTR14 is a firm’s marginal corporate tax rate at the end of fiscal year 2014. MTR Pre_Program_AVG is a firm’s average marginal tax rates across its preprogram years (2012–2014). Post is an indicator that equals one for postprogram years, i.e., fiscal years 2015–2017, and zero otherwise. Control variables include Ln(Assets), ROA, Growth, PPE, Div, and Z-score. t-statistics reported in parentheses are computed based on standard errors that are robust to heteroskedasticity and clustered by firm.
*, **, and *** denote statistical significance at the 10%, 5%, and 1% levels under two-sided student t-tests, respectively. See Appendix 1 for variable definitions.
Marginal Tax Rates Averaged across Predeleveraging Years. We repeat our analysis employing a firm’s average marginal tax rate predeleveraging (2012–2014). The advantage of this average MTR measure derives from its ability to better capture a firm’s long-term tax status, as MTR can fluctuate. Its drawback, however, has to do with the possibility that MTR in earlier years may be less relevant for firms’ decisions during the deleveraging program. The results in Table 11 (Column (3)) show continued support for high marginal tax rate firms resisting deleveraging.
Excluding Observations During the Transition Year
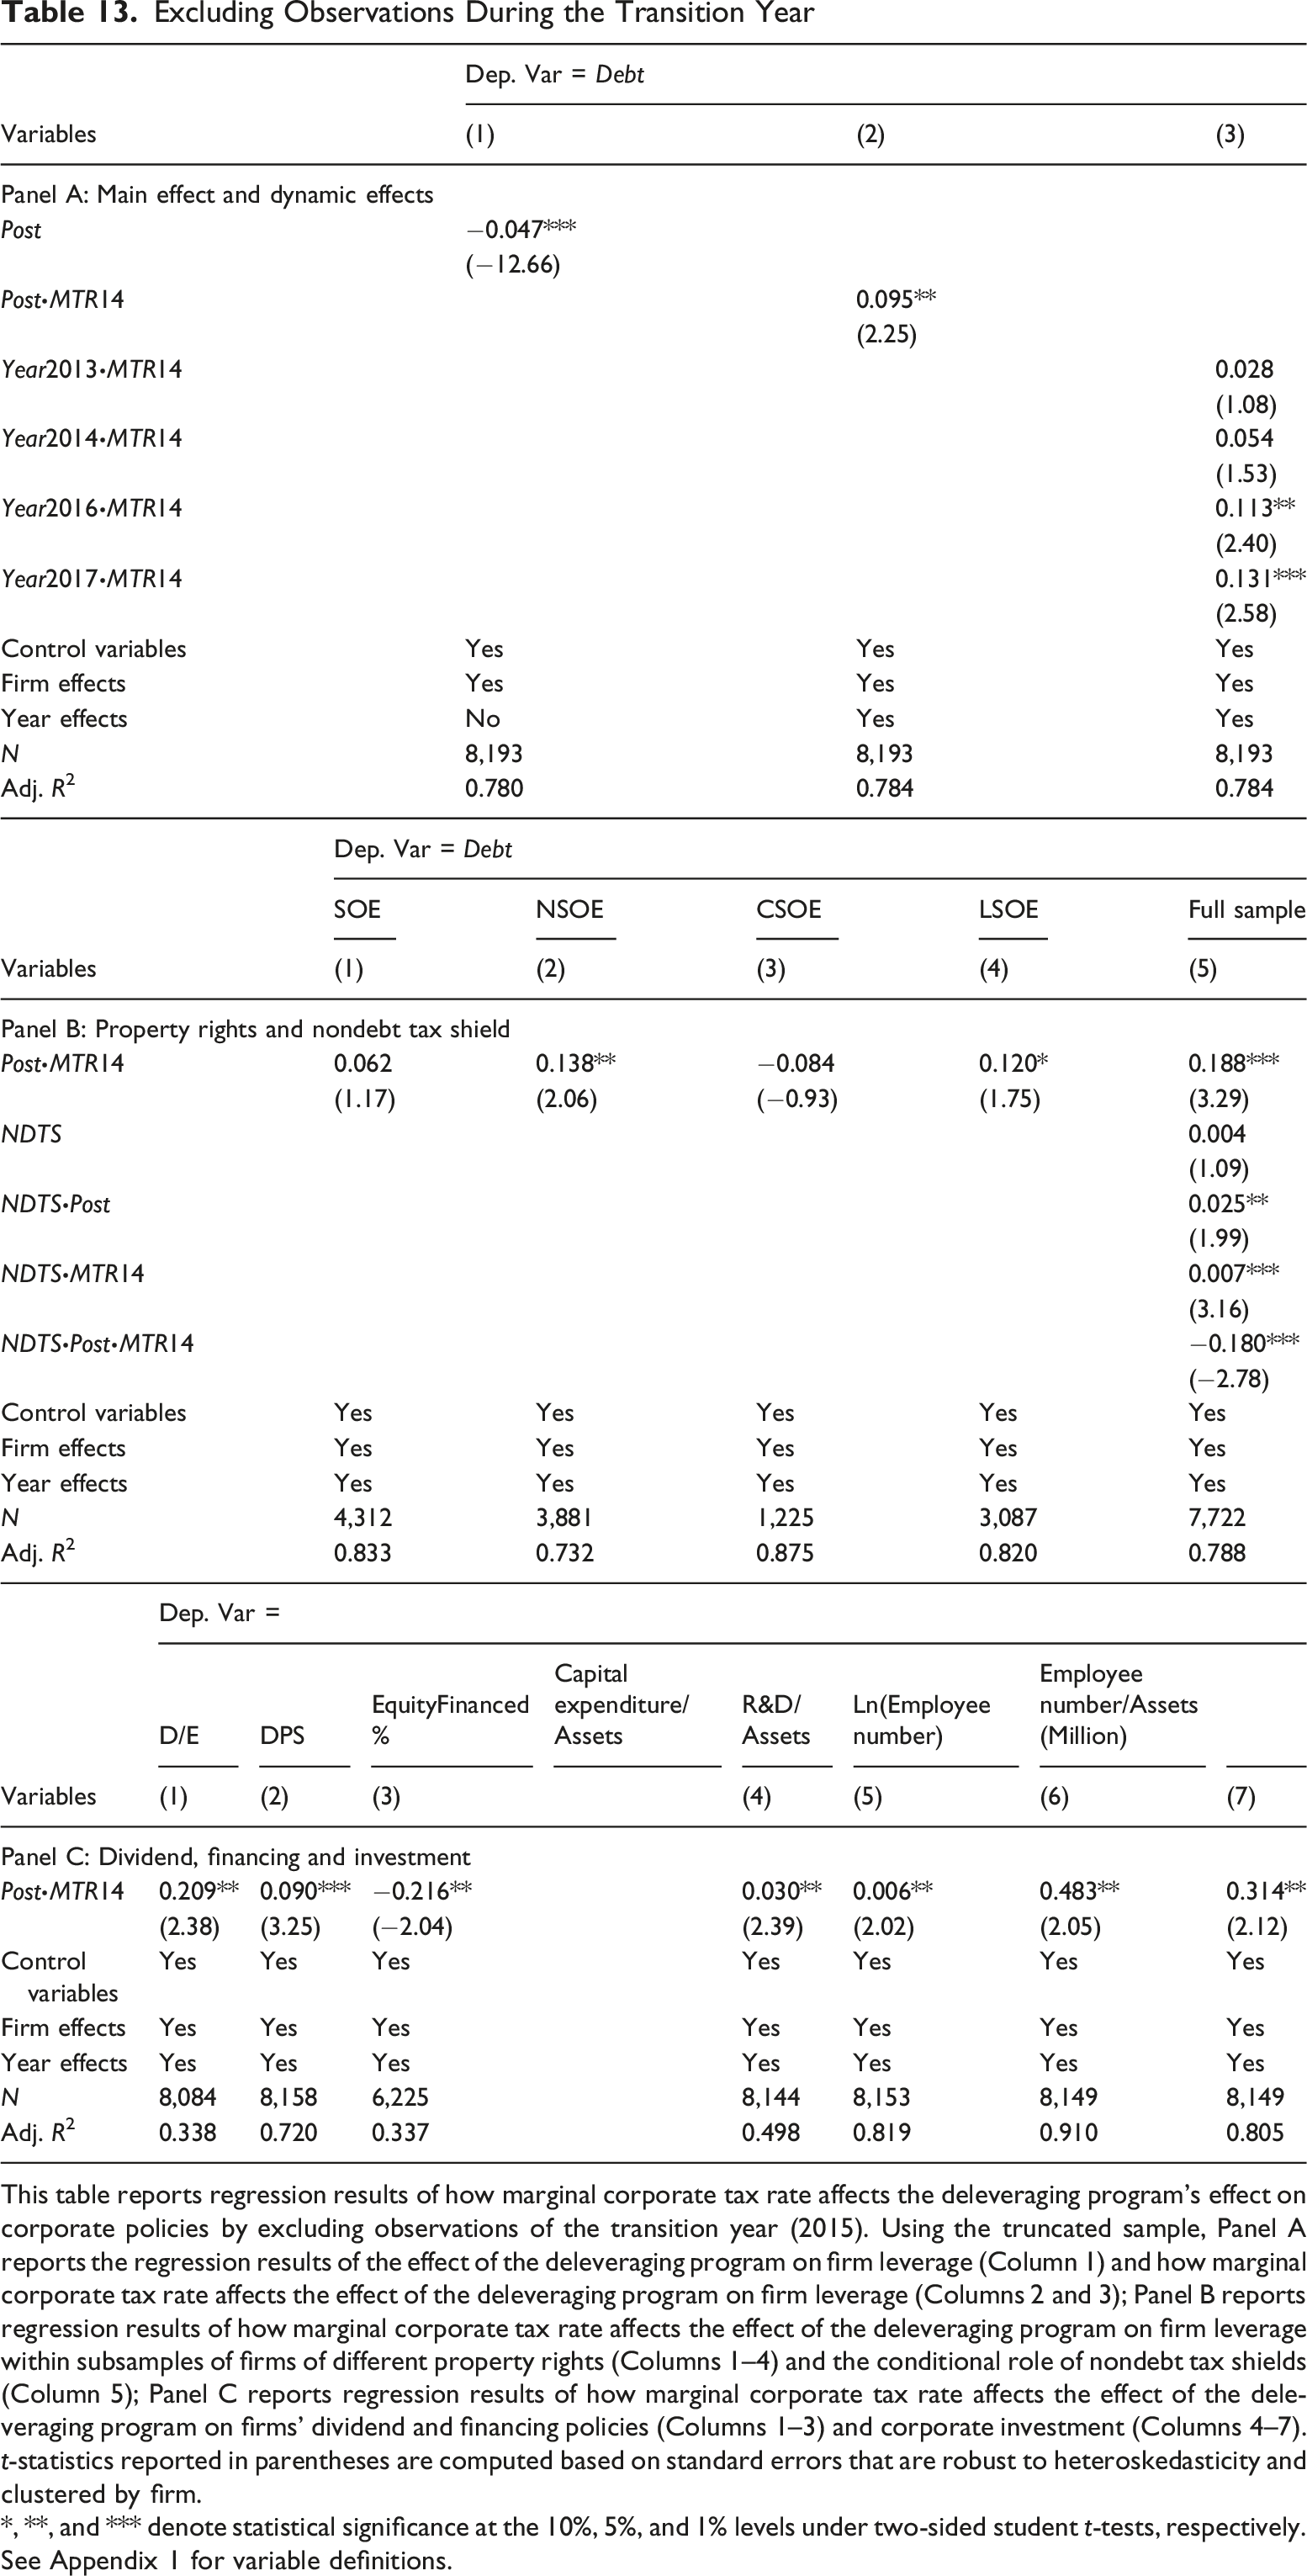
This table reports regression results of how marginal corporate tax rate affects the deleveraging program’s effect on corporate policies by excluding observations of the transition year (2015). Using the truncated sample, Panel A reports the regression results of the effect of the deleveraging program on firm leverage (Column 1) and how marginal corporate tax rate affects the effect of the deleveraging program on firm leverage (Columns 2 and 3); Panel B reports regression results of how marginal corporate tax rate affects the effect of the deleveraging program on firm leverage within subsamples of firms of different property rights (Columns 1–4) and the conditional role of nondebt tax shields (Column 5); Panel C reports regression results of how marginal corporate tax rate affects the effect of the deleveraging program on firms’ dividend and financing policies (Columns 1–3) and corporate investment (Columns 4–7). t-statistics reported in parentheses are computed based on standard errors that are robust to heteroskedasticity and clustered by firm.
*, **, and *** denote statistical significance at the 10%, 5%, and 1% levels under two-sided student t-tests, respectively. See Appendix 1 for variable definitions.
Conclusion
We examine the role of marginal corporate tax rates in shaping corporate policies around a regulatory credit crunch. We exploit China’s 2015 deleveraging program, which increased the overall stringency of debt financing, and examine the role of the marginal corporate tax rate in affecting firms’ corporate policies in response to deleveraging. We find that firms with high marginal tax rate reduce leverage to a lesser extent compared with firms with low marginal tax rate. This is consistent with high-tax-rate firms, which normally receive a high level of tax benefit from leverage, are more likely to resist deleveraging. The effect of the marginal tax rate on firms’ capital structure adjustments in response to deleveraging is the strongest among nonstate-owned firms, moderate for local state-owned firms, and the weakest for central state-owned firms. Furthermore, consistent with a tax-incentive story, the effect of the marginal tax rate in resisting deleveraging is mitigated for firms with nondebt tax shields.
More importantly, we examine the implications of the tax-leverage link for firms’ payout, financing and investment policies, as they adjust for a new equilibrium in their eco-system of corporate policies in response to the credit crunch. We find that high-tax-rate firms are less likely to reduce dividend payouts or switch from debt to equity financing during deleveraging, compared with low-tax-rate firms. In addition, high-tax-rate firms, by resisting deleveraging, cut investments in fixed assets, research and development and human capital to a lesser extent, compared with low-tax-rate firms.
While acknowledging that some of our mechanism test results can be sensitive to matching, we believe that our research reveals a novel and important factor shaping the way firms handle credit shocks. Linking tightened credit market conditions with firms’ tax incentives, our findings suggest differential consequences of firms’ financial and operating choices determined by firms’ marginal tax rates. Adding to the literature on credit shocks/crises (Chodorow-Reich, 2014; Giroud and Mueller, 2017; Greenstone et al., 2020), our research enhances our understanding of microeconomic consequences of credit shocks.
Footnotes
Acknowledgments
We thank workshop participants at City University of Hong Kong, Dongbei University of Finance and Economics, Fudan University, National University of Singapore, and Shanghai Lixin University of Accounting and Finance for their helpful comments.
Funding
The authors disclosed receipt of the following financial support for the research, authorship, and/or publication of this article: Ni acknowledges support from the National Natural Science Foundation of China (72322012). Liu acknowledges support from the National Natural Science Foundation of China (72272025, 72572029). Li acknowledges support from NUS and NUSRICQ. Huang, Li, Liu, and Ni contribute equally to this research.
Declaration of Conflicting Interests
The authors declared no potential conflicts of interest with respect to the research, authorship, and/or publication of this article.
Notes
Author Biographies
Variable Definitions
Variables
Definitions
Debt
Interest-bearing debt divided by total assets at the fiscal year end. Interest-bearing debt is the sum of short-term loans, long-term loans, and bonds payable.
Post
An indicator that equals one for postprogram years, i.e., fiscal years 2015–2017, and zero otherwise.
MTR14
A firm’s marginal corporate tax rate at the end of fiscal year 2014.
Ln(Assets)
The natural logarithm of total assets at the fiscal year end.
ROA
Net income during the fiscal year divided by total assets at the fiscal year end.
Growth
The difference between sales during the current fiscal year and the previous fiscal year, divided by sales during the previous fiscal year.
PPE
Fixed assets divided by total assets at the fiscal year end.
Div
An indicator that equals one if a firm pays cash dividend during the current fiscal year, and zero otherwise.
Z-score
The modified Altman’s Z-score, computed as 3.3 × EBIT/Total Assets + 1.0 × Sales/Total Assets + 1.4 × Retained Earnings/Total Assets + 1.2 × Working Capital/Total Assets.
Year2013
An indicator that equals one for observations in year 2013, and zero otherwise. Year2014, Year2015, Year2016 and Year2017 are defined accordingly.
High_MTR14
An indicator that equals one if a firm’s MTR14 is higher than or equal to the sample median, and zero otherwise.
NDTS
The proportion of a firm’s depreciation and amortization expense to its operating income before tax, depreciation, and amortization during the fiscal year.
D/E
Cash dividends divided by net income during the fiscal year.
DPS
Cash dividends divided by the number of shares outstanding at the fiscal year end.
EquityFinanced%
The amount of capital financed in equity divided by the sum of capital financed in debt and equity during the fiscal year.
Capital
Expenditure/Assets
Cash payments for fixed assets, intangible assets, and other long-term assets from the cash flow statement scaled by total assets at the fiscal year end.
R&D/Assets
Research and development expenditure, divided by total assets at the fiscal year end.
Ln(EmployeeNumber)
The natural logarithm of a firm’s total number of employees at the fiscal year end.
Employee
Number/Assets
The number of employees deflated by total assets (in million RMB) at the fiscal year end.
COD
Interest payments divided by the total amount of interest-bearing debt during the fiscal year.
MDebt
Interest-bearing debt divided by market value of equity plus book value of liabilities at the fiscal year end.
MTR
Pre_Program_AVG
A firm’s average marginal tax rates across its preprogram years (2012–2014).