






Abstract
Estimating outlier-robust regression models is challenging because model specification and outlier definition are interdependent, yet empirical research typically treat them separately. We propose a framework that jointly aligns a well-defined research question with appropriate model specification and robust estimation. Reexamining the relationship between CEO equity incentives and innovation, we show that conventional least-squares estimates produce unstable results: vega effects vary with functional forms, while delta effects are highly sensitive to influential observations. Our framework reconciles these inconsistencies, producing consistently positive and significant vega effects alongside generally insignificant delta effects, thereby highlighting the importance of a holistic approach.
Introduction
Regression estimates are well-known to be highly sensitive to outliers (Guthrie et al., 2012; Knez & Ready, 1997). To mitigate their influence, researchers often apply data treatments and robust estimators. By reviewing 41 corporate innovation studies published between 2000 and 2023, we find that winsorization (18 studies) and logarithmic transformation (17 studies) are the predominant approaches; with three studies employing median or quantile regressions as robustness checks. 1
These remedies, however, overlook the conditional nature of outliers: whether an observation qualifies as an outlier depends critically on the research question, model specification, and estimation method. We distinguish between univariate and conditional outliers. A univariate outlier is an extreme value in a single variable considered in isolation, whereas a conditional outlier is an extreme residual after accounting for multiple covariates. Neither type is necessary nor sufficient condition for the other. Detecting conditional outliers is inherently more challenging, as it requires specifying and estimating relationships among variables—a task grounded in a clearly defined research question, an appropriately specified model, and a suitable estimation method. 2
Consider the true model
The definition of a conditional outlier is determined by the research question, which directly governs the model
We classify firms as innovative or noninnovative using only industry-level characteristics and focus our analysis on the innovative group. This alignment reduces spurious outliers that can arise from model–sample mismatch—that is, applying a model to firms for which it is not well suited. To formally distinguish between groups, we adopt a mixture model:

Here,

Identification of conditional outliers requires a reasonable model specification, which in turn must be grounded in a well-defined research question. Applying
Operationally, we approximate
Our results highlight the value of the proposed 2D framework, which jointly addresses conditional outliers along two distinct but interconnected dimensions: model specification and parameter estimation. Along the specification dimension, model misspecification is a primary source of distortion. A single-equation model that pools innovative and noninnovative firms imposes a common structure on heterogeneous groups, spuriously generating conditional outliers. Restricting the sample to innovative firms aligns the model with the relevant economic mechanism and leads to substantial improvements in both goodness-of-fit and out-of-sample predictive accuracy.
Note that the model specification comprises two elements. First, and most importantly, is the use of a mixture model—that is,
Taken together, these findings underscore that neither improved specification nor robust estimation alone is sufficient. Within the proposed 2D framework, MM estimation—applied to a properly specified model—yields stable and interpretable results: vega effects are consistently positive and statistically significant, while delta effects remain uniformly insignificant across patent regressions.
Widespread reliance on univariate remedies—winsorization and logarithmic transformations—inadequately address conditional outliers, whose identification and impact depend fundamentally on aligning the research question, model specification, and estimation method. While each component of our 2D framework builds on existing insights, their integration is both novel and essential for credible empirical inference. We caution against employing so-called “robust” estimators as a standalone outlier treatment (e.g., Theil–Sen regressions in Ohlson & Kim, 2015; robust regressions in Leone et al., 2019; MM estimators in Adams et al., 2019)—as they often neglect the model dependence of conditional outliers.
This methodological gap helps explain the mixed evidence on CEO incentives and innovation. Among 41 innovation studies published between 2000 and 2023, 14 include delta as an explanatory variable for R&D intensity; half report negative effects, 14% report positive effects, and the remainder no significant effect. Our framework resolves these inconsistencies, demonstrating that vega effects are statistically significant and robust to conditional outliers, whereas delta effects fluctuate idiosyncratically and lack statistical significance.
Sample
Our sample draws on four primary data sources. Patent grant and citation data come from Kogan et al. (2017), covering all ultimately granted patents; whilst CEO equity incentive data are from Coles et al. (2006). 5 CEO compensation data are sourced from ExecuComp, and firm-level financial data from Compustat.
The sample spans 24 years across two symmetric 12-year windows around the mandatory adoption of SFAS No. 123(R) in 2005: a pre-FAS 123R period (1993–2004) and a post-FAS 123R period (2006–2017). The preperiod commences in 1993, coinciding with ExecuComp’s inception of stock option reporting, and ends in 2004, the fiscal year immediately preceding implementation. SFAS No. 123(R) mandated firms to expense stock options at fair value, substantially increasing the accounting cost of option-based compensation and prompting a broad shift from simple time-vested options toward more complex performance-vesting awards (Bettis et al., 2018; Hayes et al., 2012). The postperiod runs from 2006 through 2017. Fiscal year 2005 is excluded to avoid confounding effects arising from the transition.
Following standard practice, we exclude financial firms (one-digit SIC 6) and regulated utility firms (two-digit SIC 49) due to their distinct financial structures and regulatory environments. The resulting (unbalanced) panel comprises 26,976 firm-year observations across 2,719 unique firms.
Measures of Corporate Innovation
We use three standard innovation measures. The first is research and development expenditure scaled by book assets (R&D), an input-based metric capturing resources devoted to innovation. Following prior literature, missing R&D values are set to zero (Coles et al., 2006; Hirshleifer et al., 2012). 6 The second and third are patent grants (#patents) and patent citations (#patent_cites), output-based metrics proxying for the quantity and impact of innovative output, respectively. These measures are inherently limited, as they capture only a subset of innovation activity—firms frequently conceal technological advances for strategic reasons, and fewer than 40% file patents for their technological breakthroughs (Arundel & Kabla, 1998; Koh & Reeb, 2015).
Measures of CEO Equity Incentives
We measure CEO equity incentives using lagged delta (DELTA) and lagged vega (VEGA). DELTA is the sensitivity of CEO wealth to stock price, defined as the dollar change in CEO’s wealth per one-percentage-point change in the firm’s stock price over the prior year (Jensen & Murphy, 1990). VEGA is the sensitivity of CEO wealth to stock return volatility, defined as the dollar change in CEO’s wealth per 0.01 change in the annualized standard deviation of stock returns over the prior year (Coles et al., 2006). 7
Summary Statistics
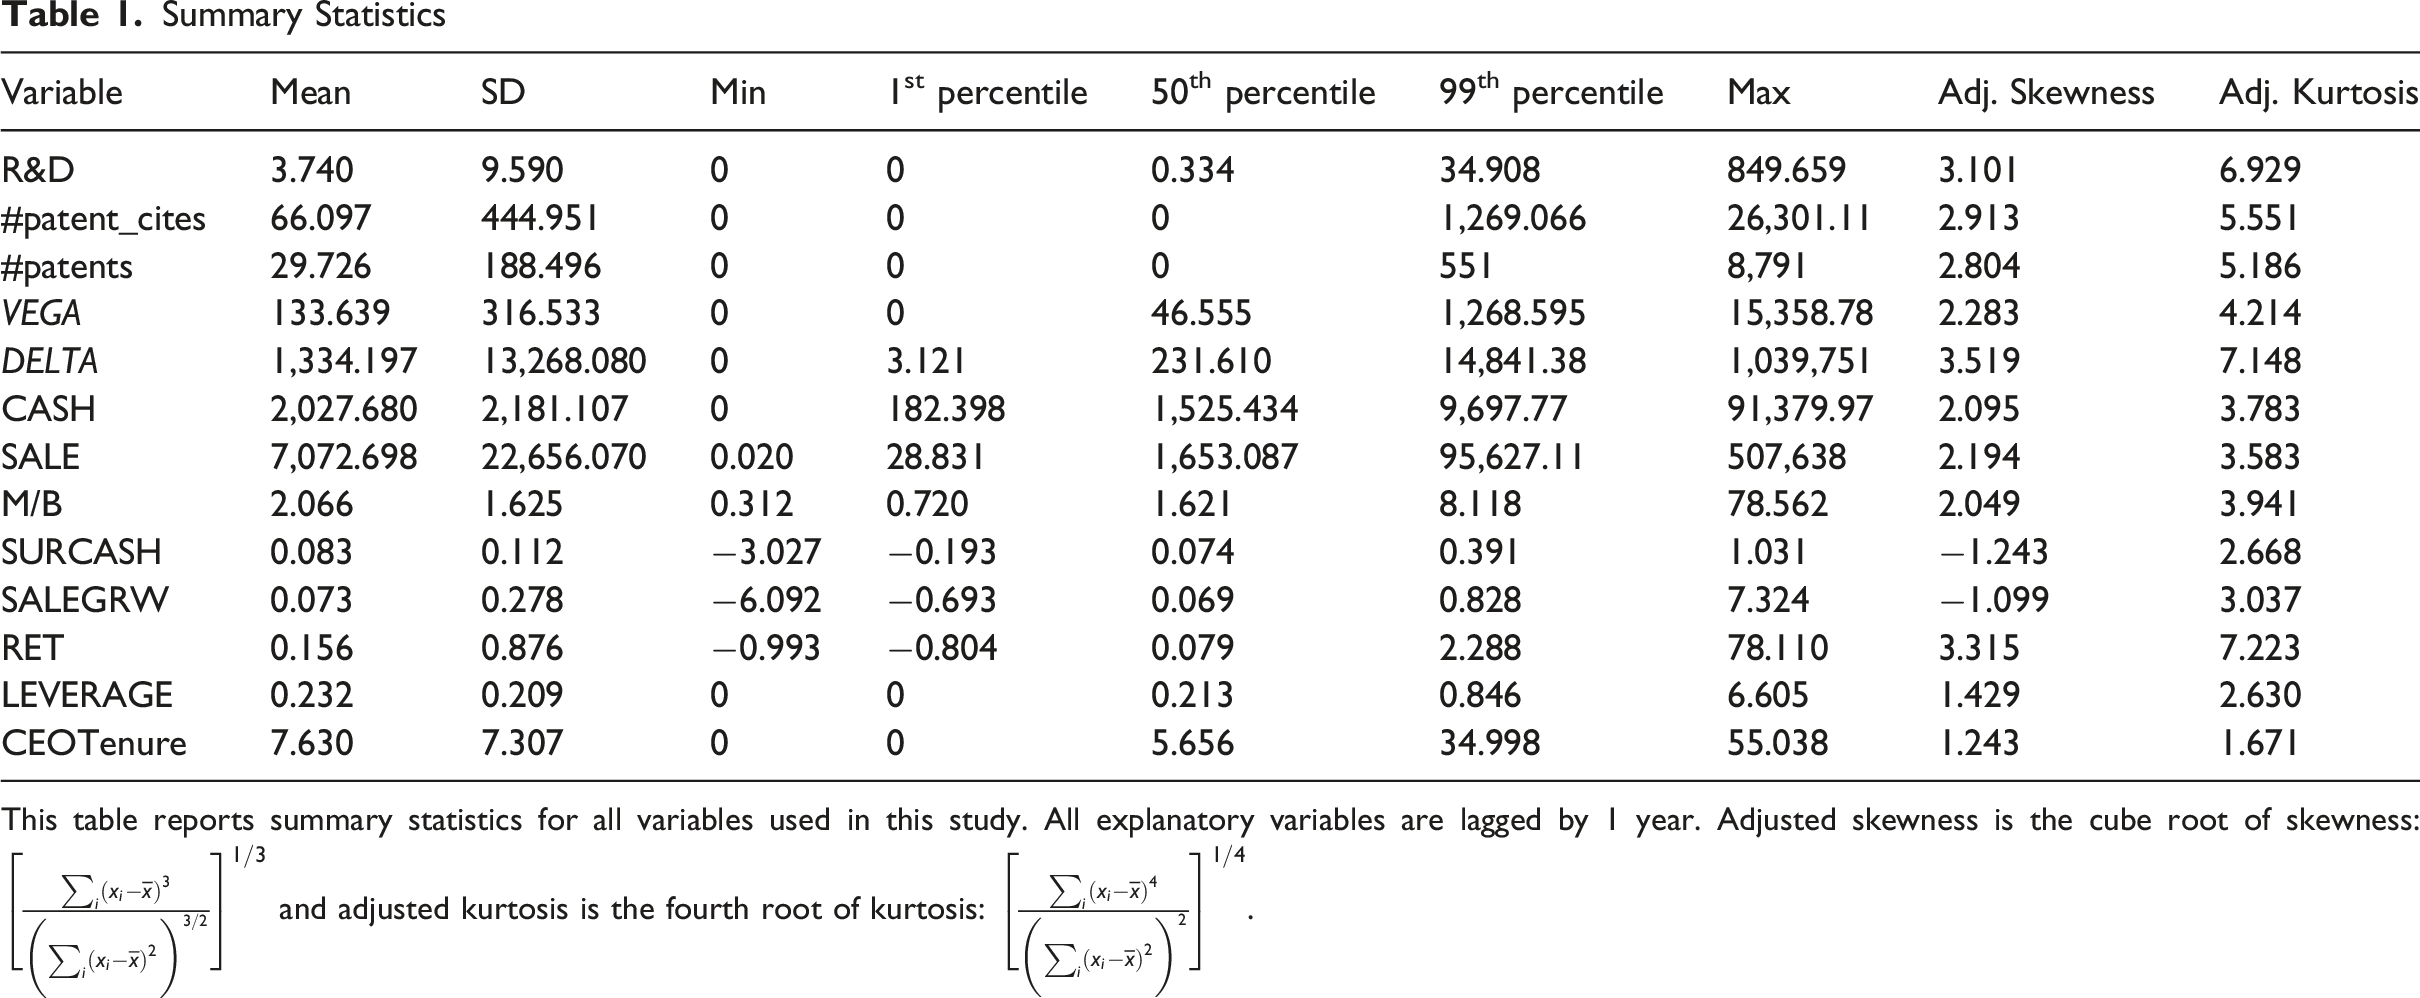
This table reports summary statistics for all variables used in this study. All explanatory variables are lagged by 1 year. Adjusted skewness is the cube root of skewness:
Outliers pose a persistent challenge in corporate innovation research, because key variables exhibit severe univariate outliers. As shown in Table 1, maximum z-scores reach 78 for DELTA, 48 for VEGA, and exceed 46 for innovation variables. Winsorization is a common remedy as it attenuates the influence of univariate outliers and modifies variables closer to normality. Winsorizing VEGA at the 99th percentile, for instance, reduces its maximum from 15,358.8 (z-score of 48.1) to 1,268.6 (z-score of 3.6). However, the theoretical justification for univariate winsorization is weak—values that appear extreme in isolation may be informative when modeled jointly, and ad hoc modification risk discarding useful economic insights. 8
Model and Results
To address outliers systematically, we develop a two-dimensional (2D) framework that recognizes their conditional nature—contingent on a well-specified model and robust estimation techniques—and apply it to examine how CEO equity incentives shape corporate innovation.
Model Specification Dimension
All innovation variables exhibit a discrete spike at zero. Figures 1(A)–(C) display histograms for R&D expenditures, patent grants, and patent citations: nearly half of all observations report zero R&D, and more than half report zero patents or citations. Prior innovation studies (n = 20) address this inconsistently—some exclude zero-innovation observations or drop firms in noninnovative industries—implicitly assuming the incentive-innovation relation varies across industry groups. (A) Histogram of R&D expenditure scaled by total assets (R&D); (B) Histogram of patent grants (#patents); (C) Histogram of patent citations (#patent_cites)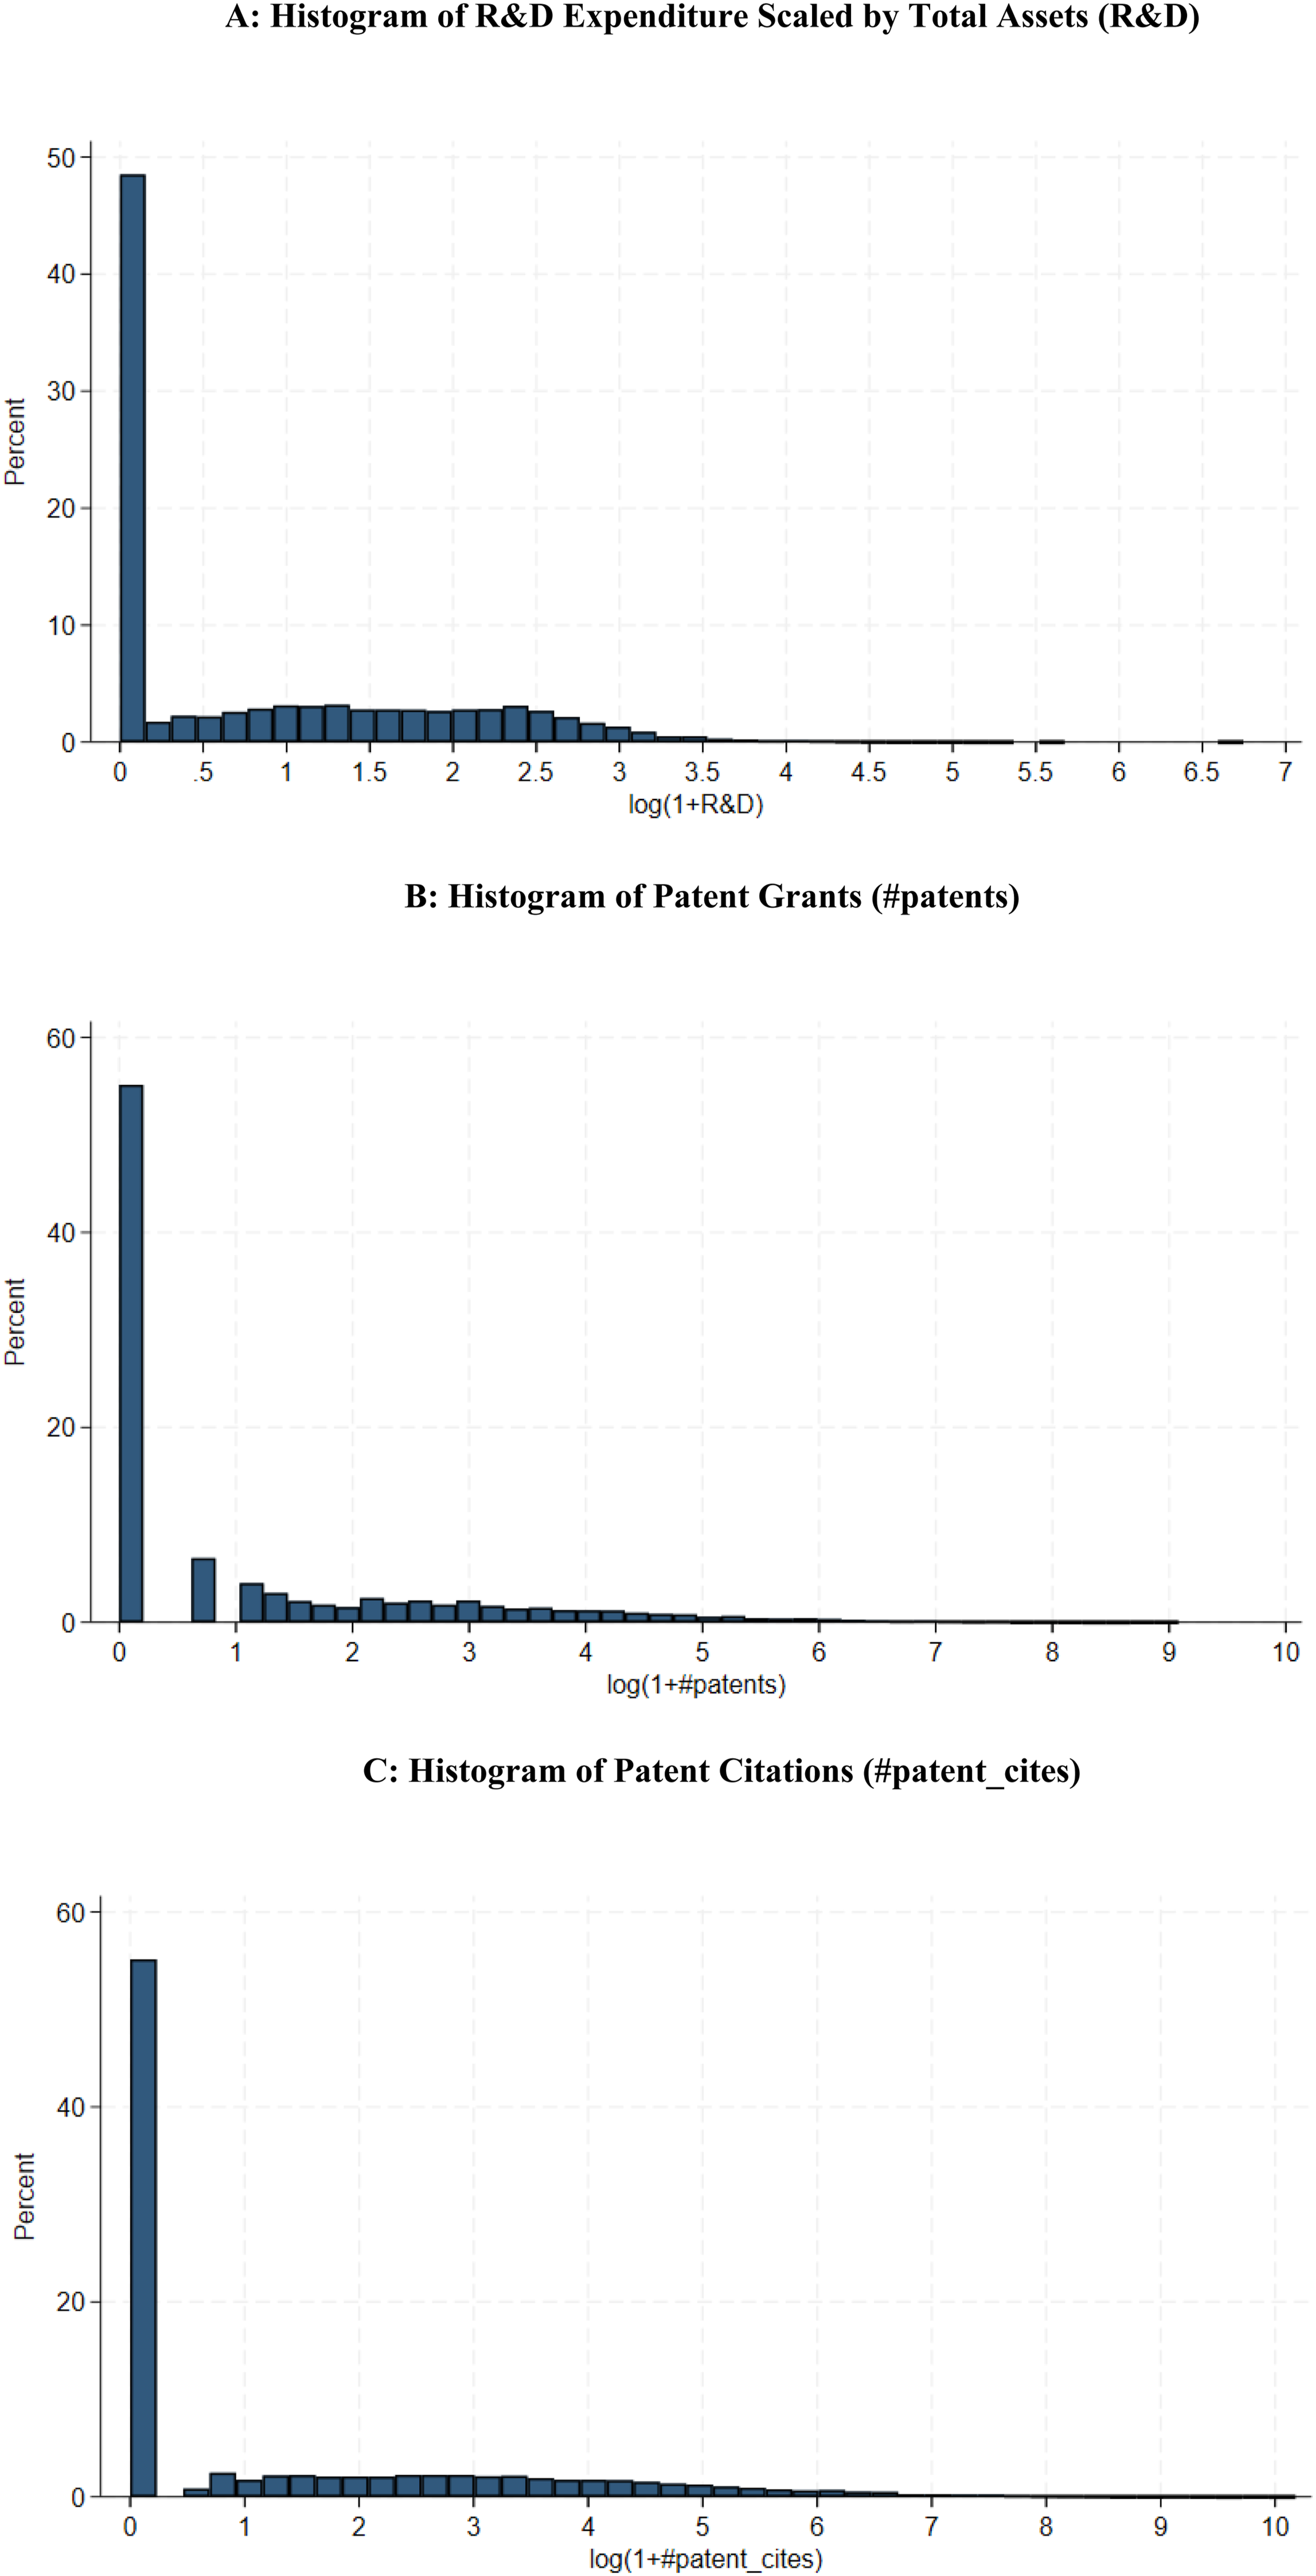
The spike at zero raises two concerns. First, regressing innovation on equity incentives using only zero-innovation observations yields no meaningful inference, as estimates are mechanically zero. Second, innovation is not central to the strategy or performance of many noninnovative firms, even though such firms may still use equity incentives for other purposes. Together, these points suggest that the incentive-innovation relation differs structurally between noninnovative and innovative firms, necessitating a more precise research question: How do CEO equity incentives influence corporate innovation among innovative firms?
Mixture Model
We adopt a two-stage estimation procedure similar to Hirshleifer et al. (2012). In the first stage, a mixture model classifies industries as innovative or noninnovative using only industry-level information. For each industry, we compute the proportion of constituent firms reporting positive R&D expenditures at any point during the sample period, rank industries by this proportion, and select a threshold to separate the two groups. Firms in industries above the threshold are classified as innovative, all others as noninnovative. 9 We use R&D expenditure as the innovation-propensity proxy because it directly reflects committed resources. 10
In the second stage, we regress innovation on CEO equity incentives using only innovative-industry firms (the “innovative sample”). Noninnovative firms constitute structural “outliers” relative to this sample and are excluded from the second-stage estimation. Innovation intensity is modeled as:
Following Coles et al. (2006) and Hirshleifer et al. (2012), equation (1) includes one-year-lagged firm- and CEO-level controls: firm size (logSALE), investment opportunities (M/B), surplus cash (SURCASH), sales growth (SALEGRW), stock performance (RET), leverage (LEVERAGE), CEO tenure (CEOTenure), and CEO risk attitude (CASH). 12 All specifications include year fixed effects and Fama-French 48 industry fixed effects (Fama & French, 1997). Unless stated otherwise, no observations from the “innovative sample” are excluded. All monetary variables are inflation-adjusted to 2017 dollars to ensure comparability across pre- and post-FAS-123R periods (to be discussed in subsample analysis). Variable definitions appear in Internet Appendix 1.
To guard against statistical overfitting and ensure fair comparison between the mixture model (equation (1) estimated on innovative firms only) and the single-equation model (equation (1) estimated on all firms), we conduct out-of-sample evaluation across all firms regardless of innovation status. The data are randomly partitioned into three subsets: 60% for estimation, 20% for validation, and 20% for testing. Internet Appendix 2 details each subset’s role.
Mixture Model—First-Stage Industry Classification
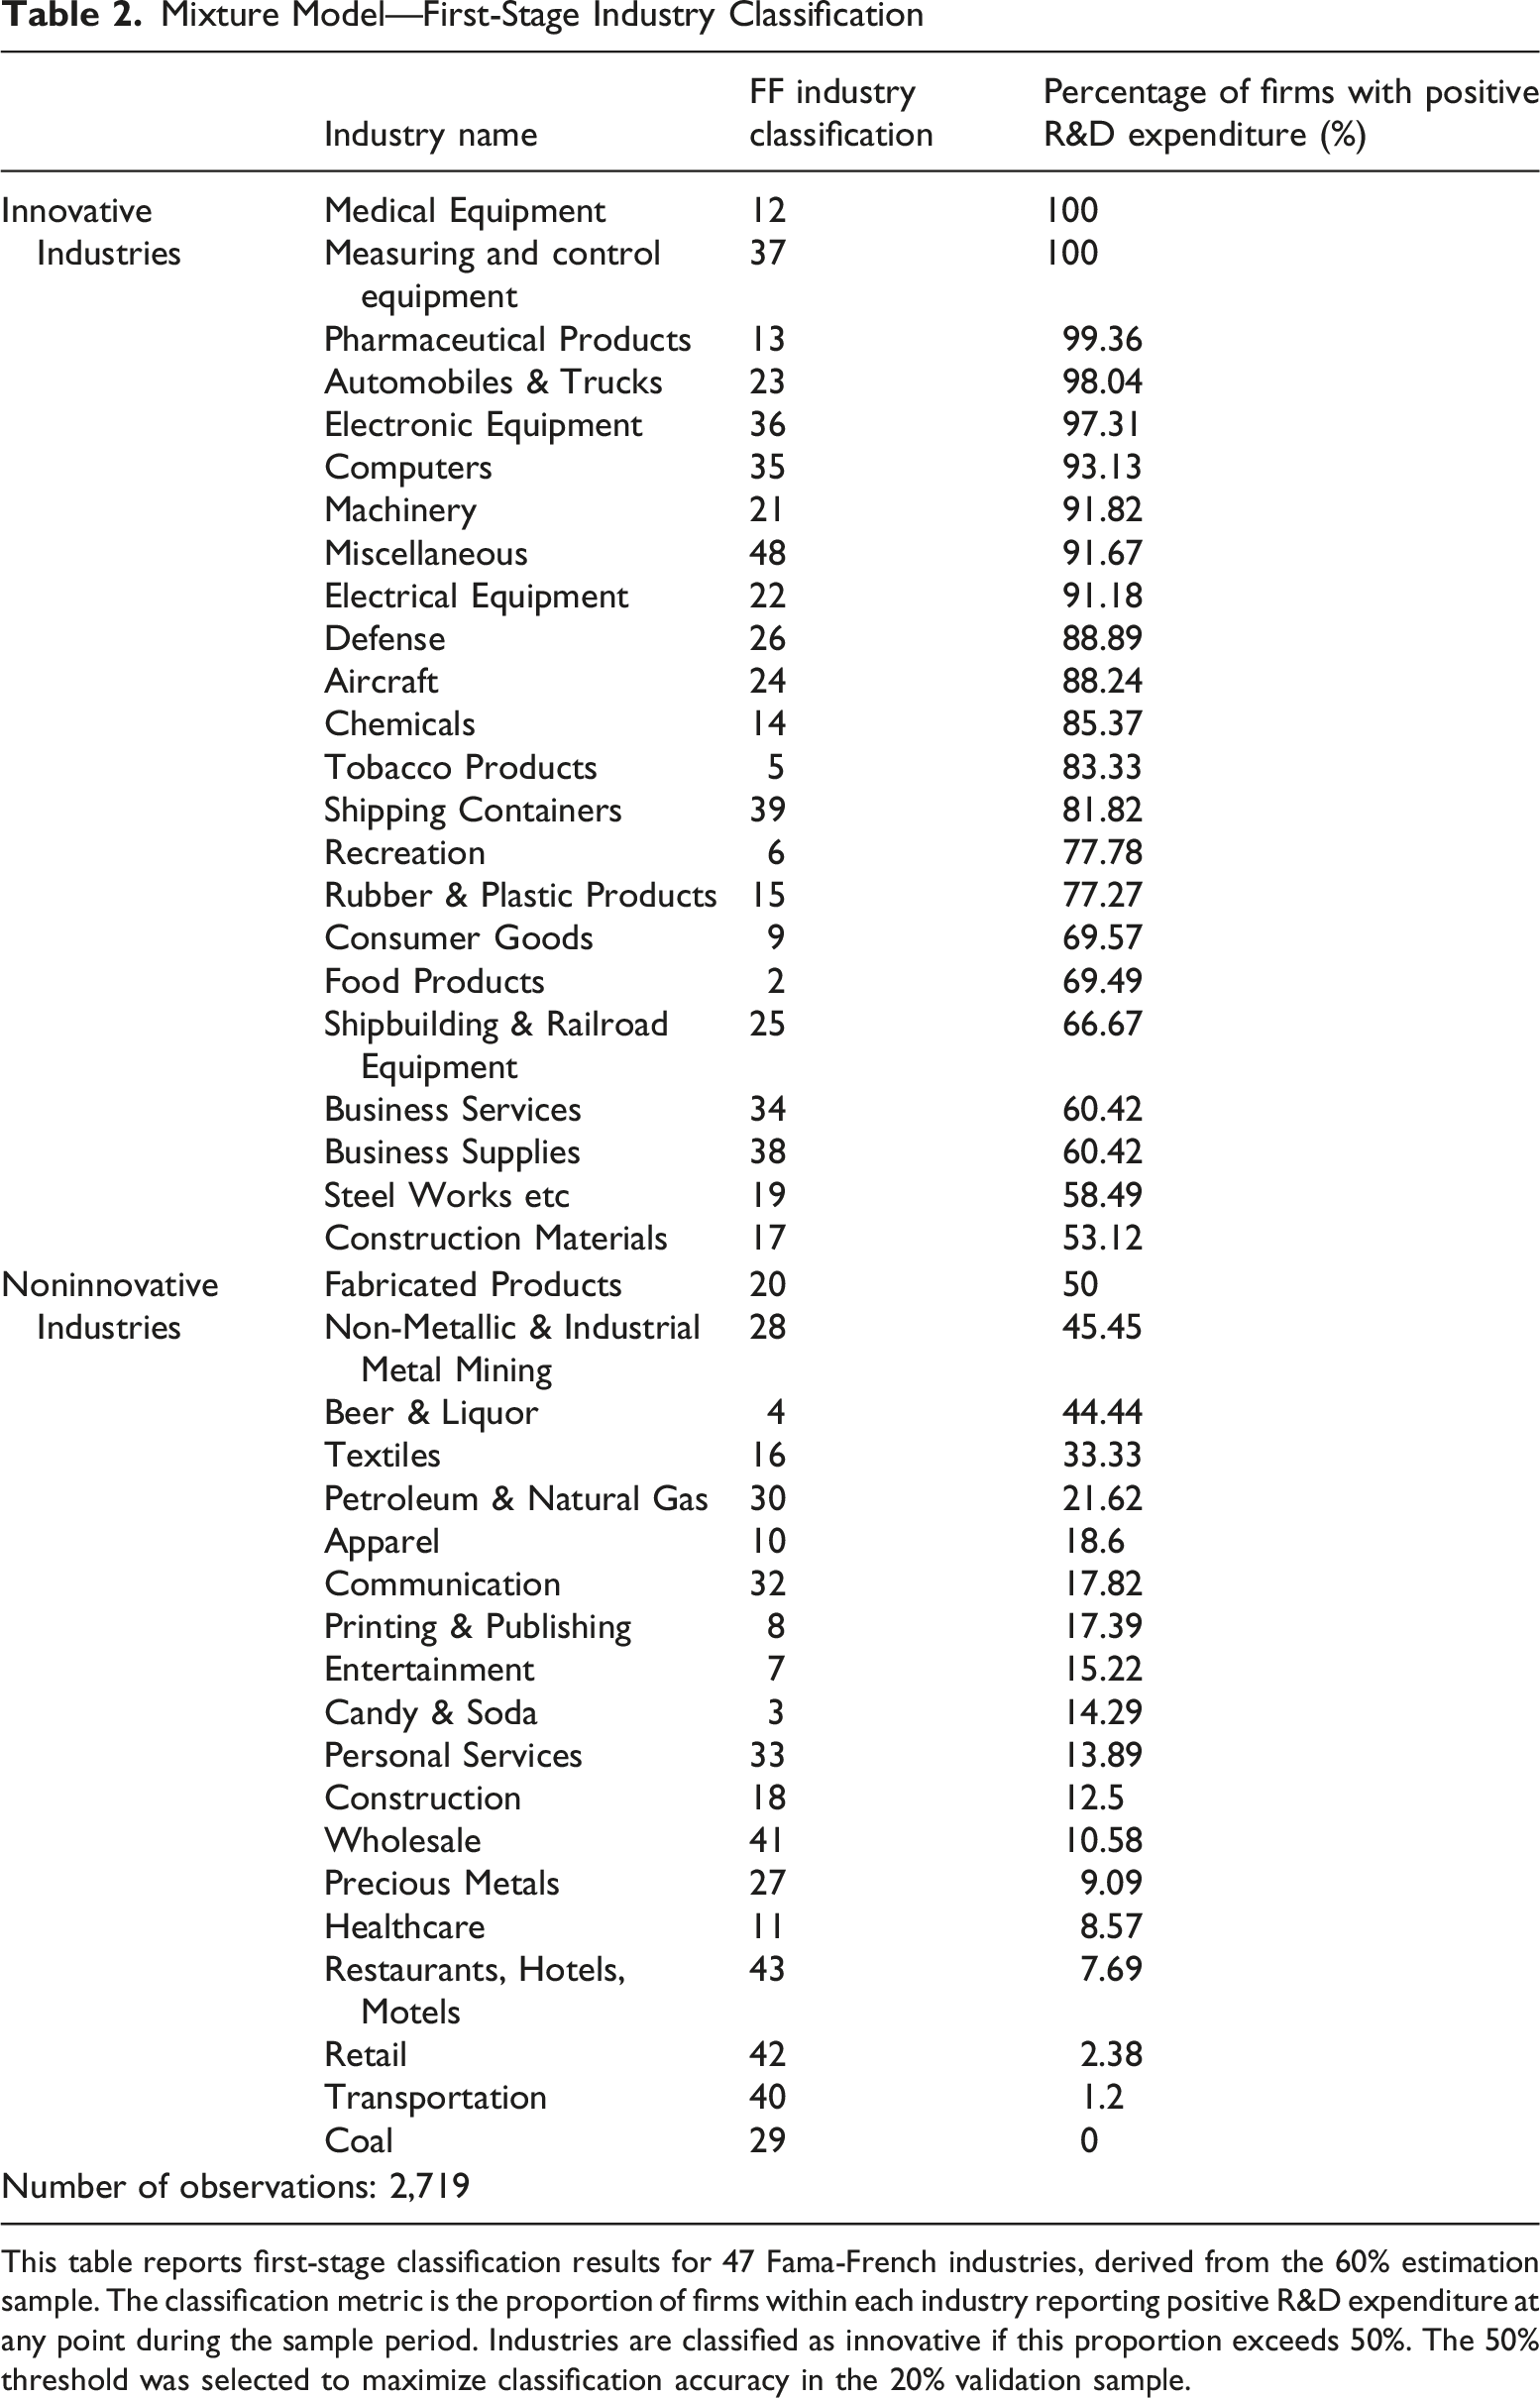
This table reports first-stage classification results for 47 Fama-French industries, derived from the 60% estimation sample. The classification metric is the proportion of firms within each industry reporting positive R&D expenditure at any point during the sample period. Industries are classified as innovative if this proportion exceeds 50%. The 50% threshold was selected to maximize classification accuracy in the 20% validation sample.
Classification Accuracy
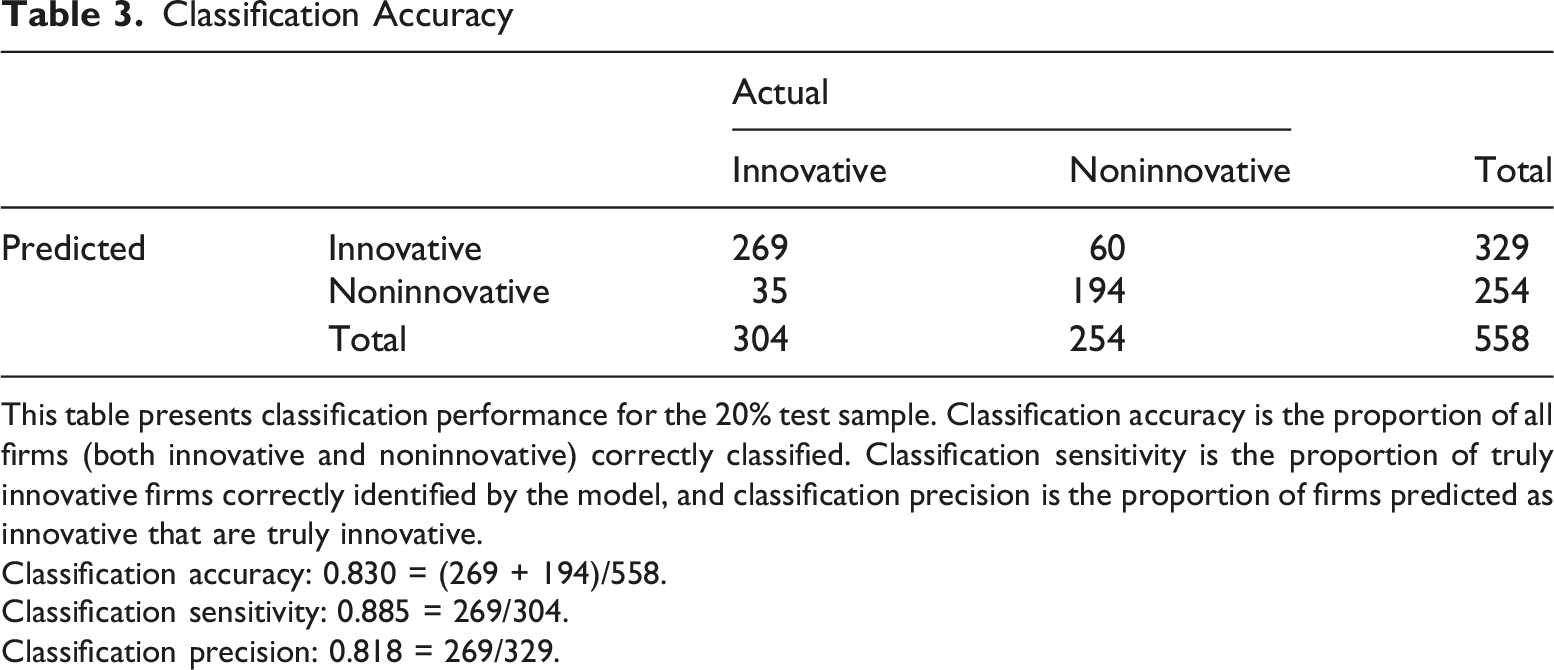
This table presents classification performance for the 20% test sample. Classification accuracy is the proportion of all firms (both innovative and noninnovative) correctly classified. Classification sensitivity is the proportion of truly innovative firms correctly identified by the model, and classification precision is the proportion of firms predicted as innovative that are truly innovative.
Classification accuracy: 0.830 = (269 + 194)/558.
Classification sensitivity: 0.885 = 269/304.
Classification precision: 0.818 = 269/329.
Performance of Mixture Model
Estimation Results—Single-Equation Model vs. Mixture Model
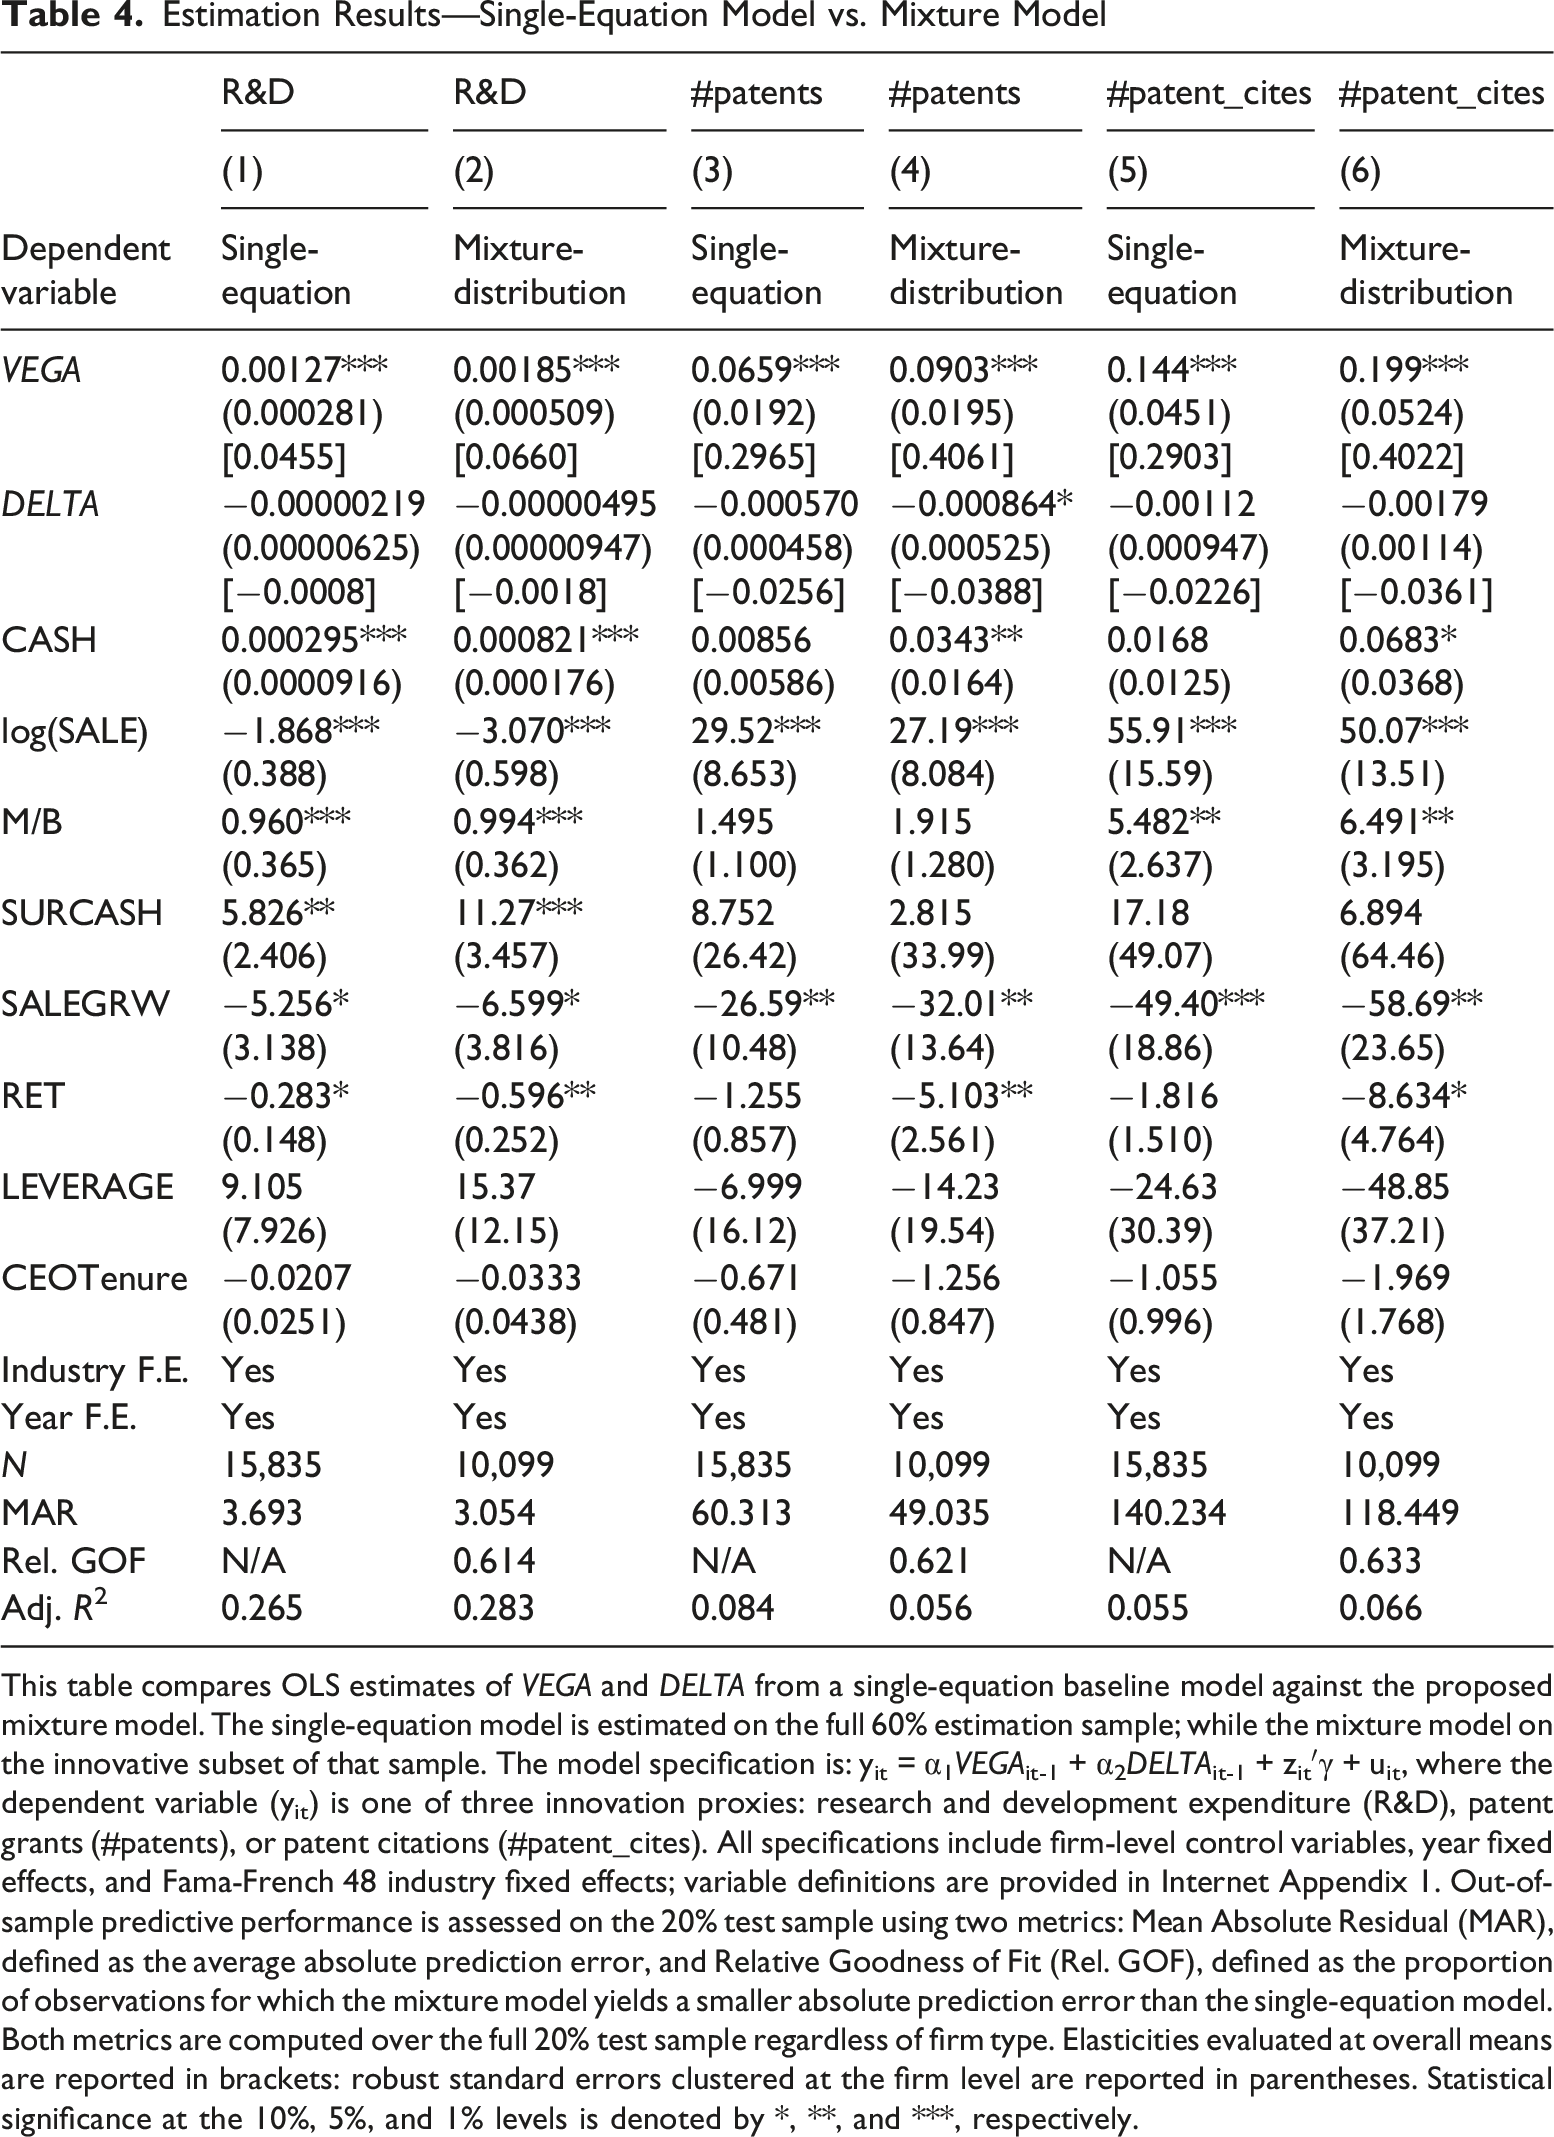
This table compares OLS estimates of VEGA and DELTA from a single-equation baseline model against the proposed mixture model. The single-equation model is estimated on the full 60% estimation sample; while the mixture model on the innovative subset of that sample. The model specification is: yit = α1VEGAit-1 + α2DELTAit-1 + zit′γ + uit, where the dependent variable (yit) is one of three innovation proxies: research and development expenditure (R&D), patent grants (#patents), or patent citations (#patent_cites). All specifications include firm-level control variables, year fixed effects, and Fama-French 48 industry fixed effects; variable definitions are provided in Internet Appendix 1. Out-of-sample predictive performance is assessed on the 20% test sample using two metrics: Mean Absolute Residual (MAR), defined as the average absolute prediction error, and Relative Goodness of Fit (Rel. GOF), defined as the proportion of observations for which the mixture model yields a smaller absolute prediction error than the single-equation model. Both metrics are computed over the full 20% test sample regardless of firm type. Elasticities evaluated at overall means are reported in brackets: robust standard errors clustered at the firm level are reported in parentheses. Statistical significance at the 10%, 5%, and 1% levels is denoted by *, **, and ***, respectively.
Table 4 also reveals that estimated effects are model dependent. VEGA estimates are positive and statistically significant, with mixture model estimates (Columns 2, 4 and 6) approximately 40% larger than their single-equation counterparts (Columns 1, 3 and 5). DELTA coefficients follow a similar pattern, exceeding single-equation estimates by at least 50% in absolute value, though remaining negative and statistically insignificant at the 5% level. The reliability of both estimates is nevertheless undermined by the well-known sensitivity of least squares estimates to influential observations, casting doubt on the robustness of their magnitudes and significance.
Influential Observations




Impact of Influential Observations on Alternative Specifications
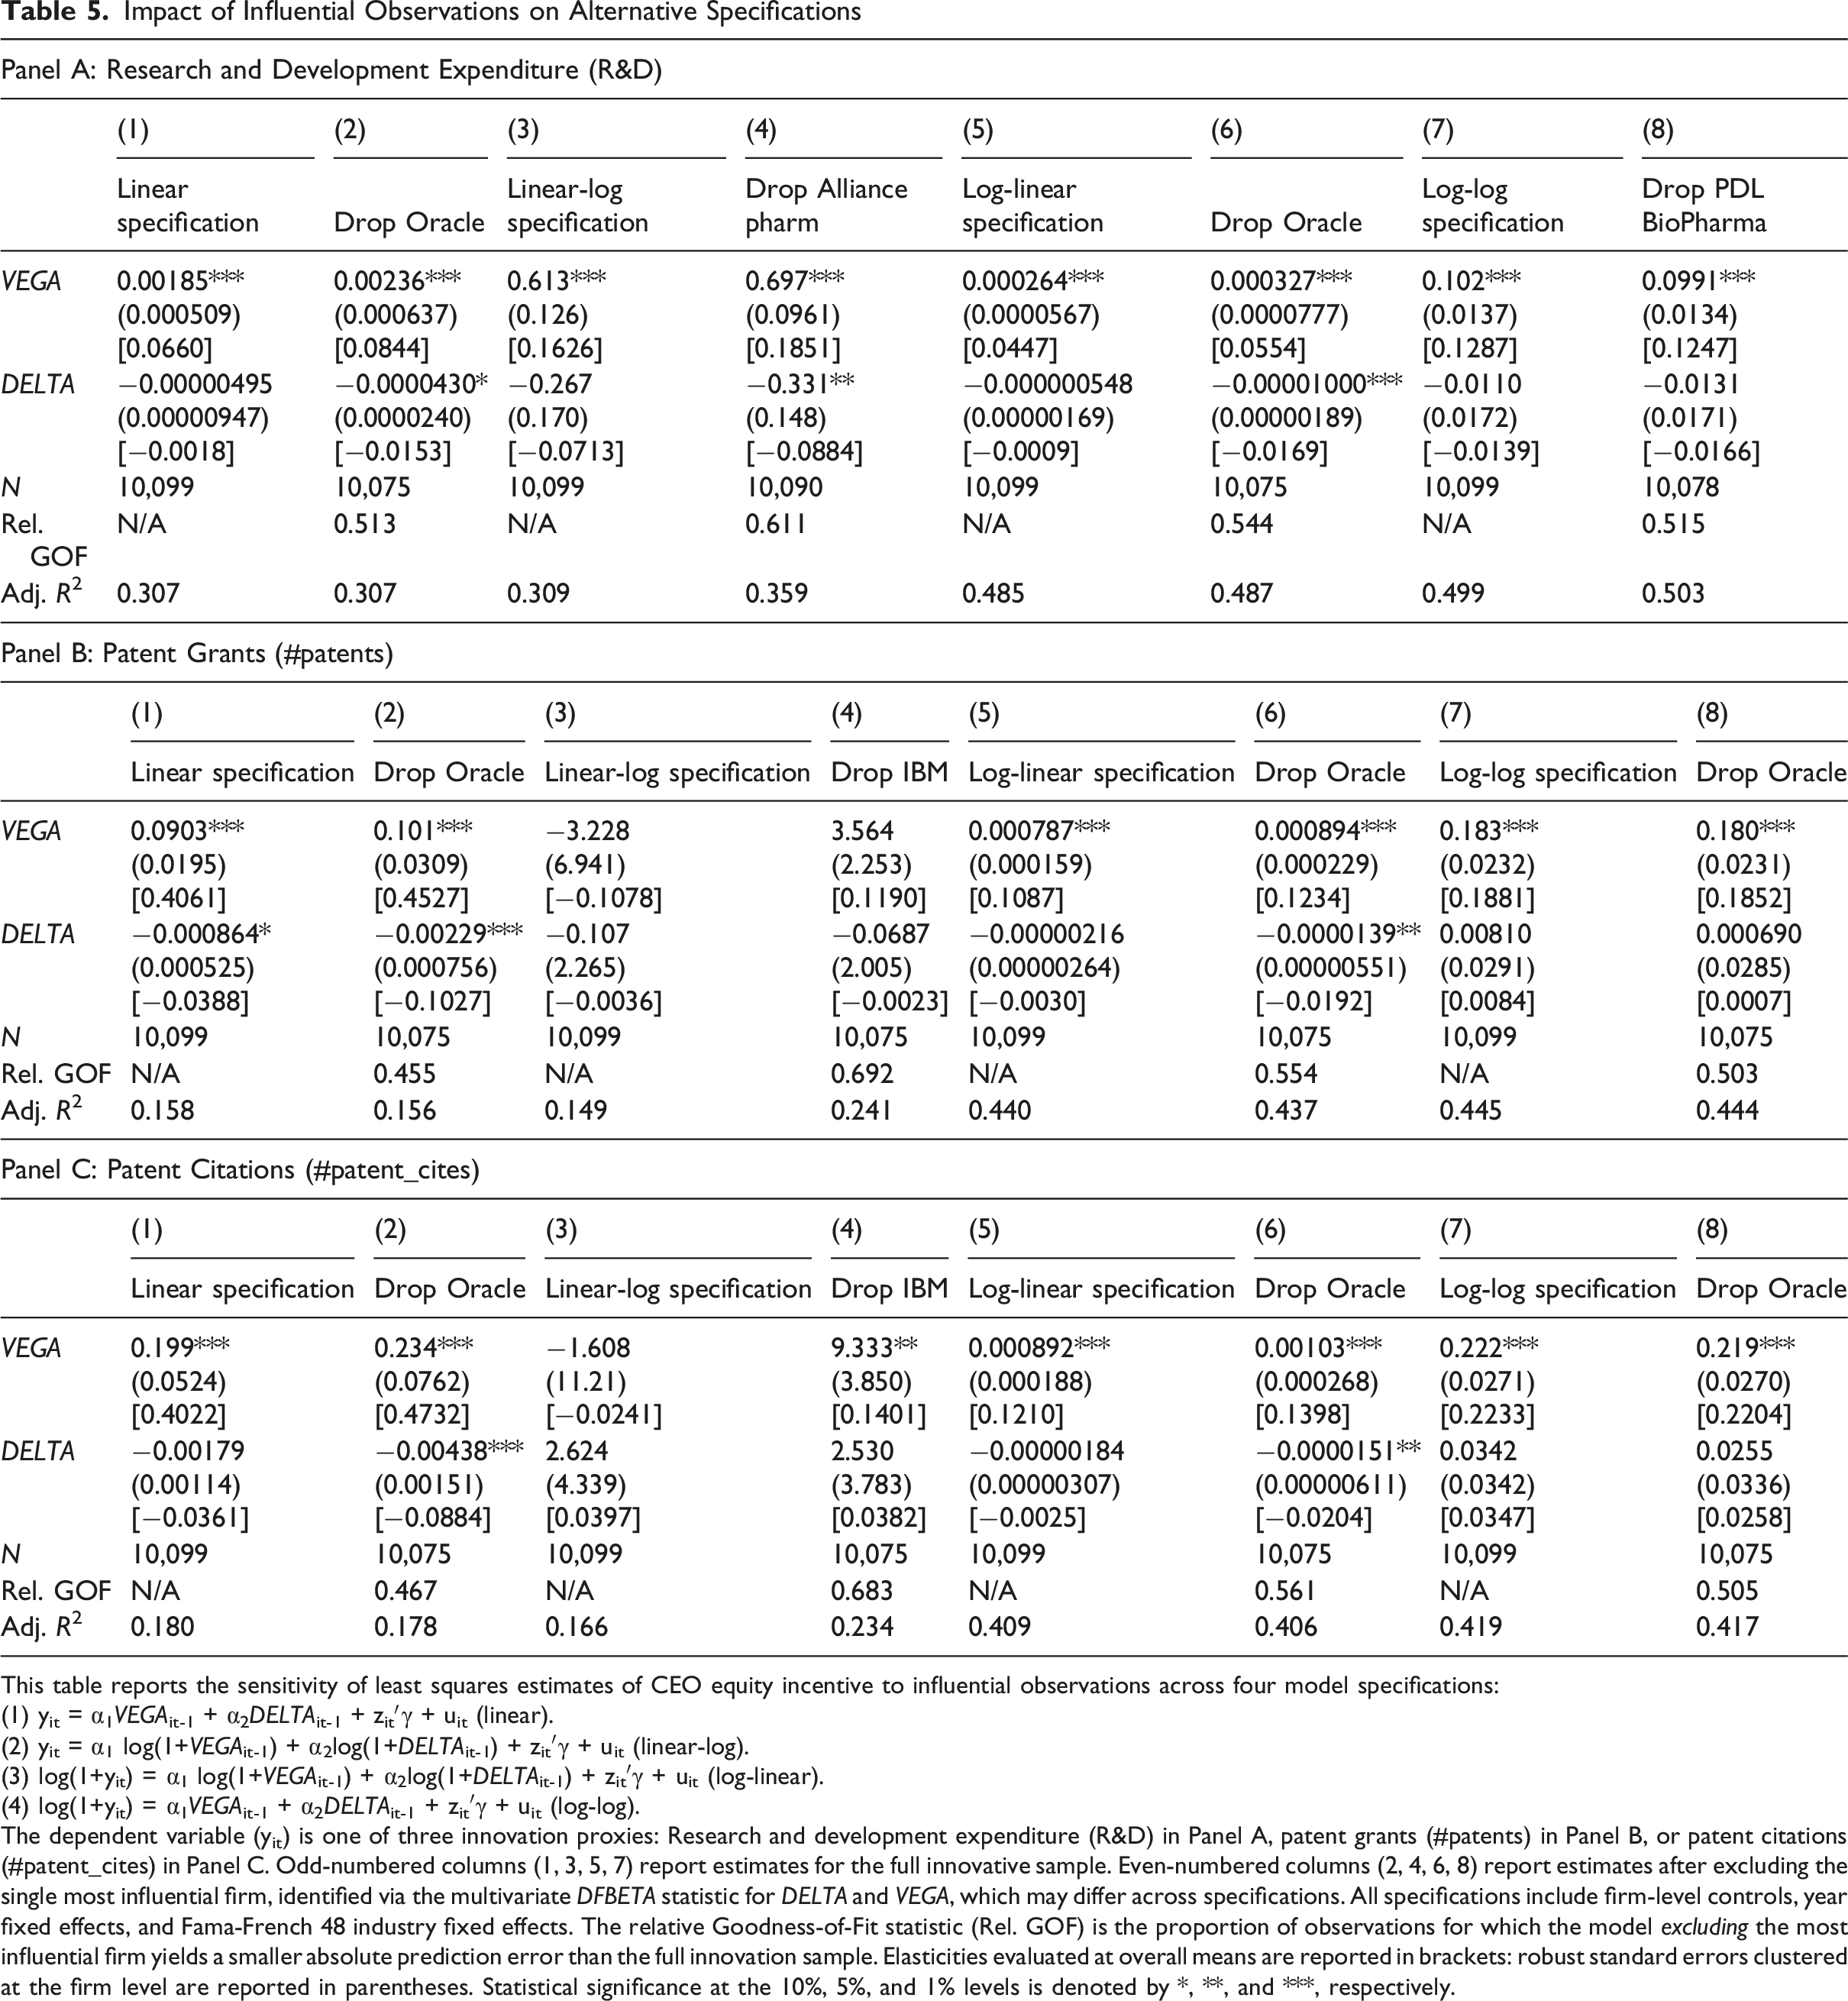
This table reports the sensitivity of least squares estimates of CEO equity incentive to influential observations across four model specifications:
(1) yit = α1VEGAit-1 + α2DELTAit-1 + zit′γ + uit (linear).
(2) yit = α1 log(1+VEGAit-1) + α2log(1+DELTAit-1) + zit′γ + uit (linear-log).
(3) log(1+yit) = α1 log(1+VEGAit-1) + α2log(1+DELTAit-1) + zit′γ + uit (log-linear).
(4) log(1+yit) = α1VEGAit-1 + α2DELTAit-1 + zit′γ + uit (log-log).
The dependent variable (yit) is one of three innovation proxies: Research and development expenditure (R&D) in Panel A, patent grants (#patents) in Panel B, or patent citations (#patent_cites) in Panel C. Odd-numbered columns (1, 3, 5, 7) report estimates for the full innovative sample. Even-numbered columns (2, 4, 6, 8) report estimates after excluding the single most influential firm, identified via the multivariate DFBETA statistic for DELTA and VEGA, which may differ across specifications. All specifications include firm-level controls, year fixed effects, and Fama-French 48 industry fixed effects. The relative Goodness-of-Fit statistic (Rel. GOF) is the proportion of observations for which the model excluding the most influential firm yields a smaller absolute prediction error than the full innovation sample. Elasticities evaluated at overall means are reported in brackets: robust standard errors clustered at the firm level are reported in parentheses. Statistical significance at the 10%, 5%, and 1% levels is denoted by *, **, and ***, respectively.
The dependent variable (y it ) is one of three innovation proxies: research and development expenditure (R&D), patent grants (#patents), or patent citations (#patent_cites). Columns (1), (3), (5) and (7) report estimates for the innovative sample under specifications (1)−(4); Columns (2), (4), (6) and (8) report respective estimates after excluding the most influential firm, which may differ across specifications. All regressions include the full set of firm-level controls, year fixed effects, and industry fixed effects.
Table 5 yields three main findings. First, conditional outliers are model-dependent: the identity of the most influential firm varies across specifications. In the R&D regressions (Panel A), Oracle is the most influential firm under the linear and log-linear specifications, while Alliance Pharmaceutical and PDL BioPharma are most influential under the linear-log and log-log specifications, respectively.
Second, outlier sensitivity is itself specification-dependent. The log-log specification yields relatively stable DELTA and VEGA estimates regardless of whether the most influential firm is included (Columns 7–8). In contrast, outlier sensitivity is substantially more pronounced under the linear-log specification (Columns 3–4). In the patent regressions (Panels B and C), the sign of VEGA estimates reverses upon inclusion of the most influential firm, and both the magnitude and statistical significance of DELTA estimates under the log-linear specification are highly sensitive to its inclusion (Columns 5–6).
Third, DELTA estimates are particularly fragile to influential observations. Under the log-linear specification, excluding Oracle from the 1,027-firm sample changes the absolute DELTA estimate by 1,778% in the R&D regressions (Panel A, Columns 5-6), 540% in the patent grants regressions (Panel B, Columns 5-6), and 716% in the patent citations regressions (Panel C, Columns 5-6). Notably, DELTA transitions from statistically insignificant when Oracle is included to significant at the 5% level upon its exclusion, underscoring the extent to which a single observation can fundamentally distort inference.
By contrast, VEGA estimates are generally robust to influential observations: removing the most influential firm produces negligible changes in both magnitude and statistical significance. The only exceptions arise under the linear-log specification in the patent regressions (Panels B and C, Columns 3-4). Collectively, these patterns suggest that least squares estimates are fragile to influential observations—especially high-leverage points—under misspecified functional forms, but grow increasingly resilient as specification improves.
Estimation Dimension
Different Remedies for Outliers
Outlier remedies vary widely across innovation studies. Among the 18 studies that winsorize, 14 apply broad winsorization—typically at 1%−5% cutoffs—while others winsorize only selected variables. Some studies instead apply logarithmic transformation to key variables, and three employ median or quantile regression. To evaluate the sensitivity of least squares estimates to common outlier remedies, we use Columns (1), (3), and (5) of Table 5 as benchmarks and compare estimates across three conventional treatments: (i) logarithmic transformation of CEO equity incentive variables, (ii) winsorization, and (iii) median regression.
Effect of Different Outlier Remedies on Regression Estimates
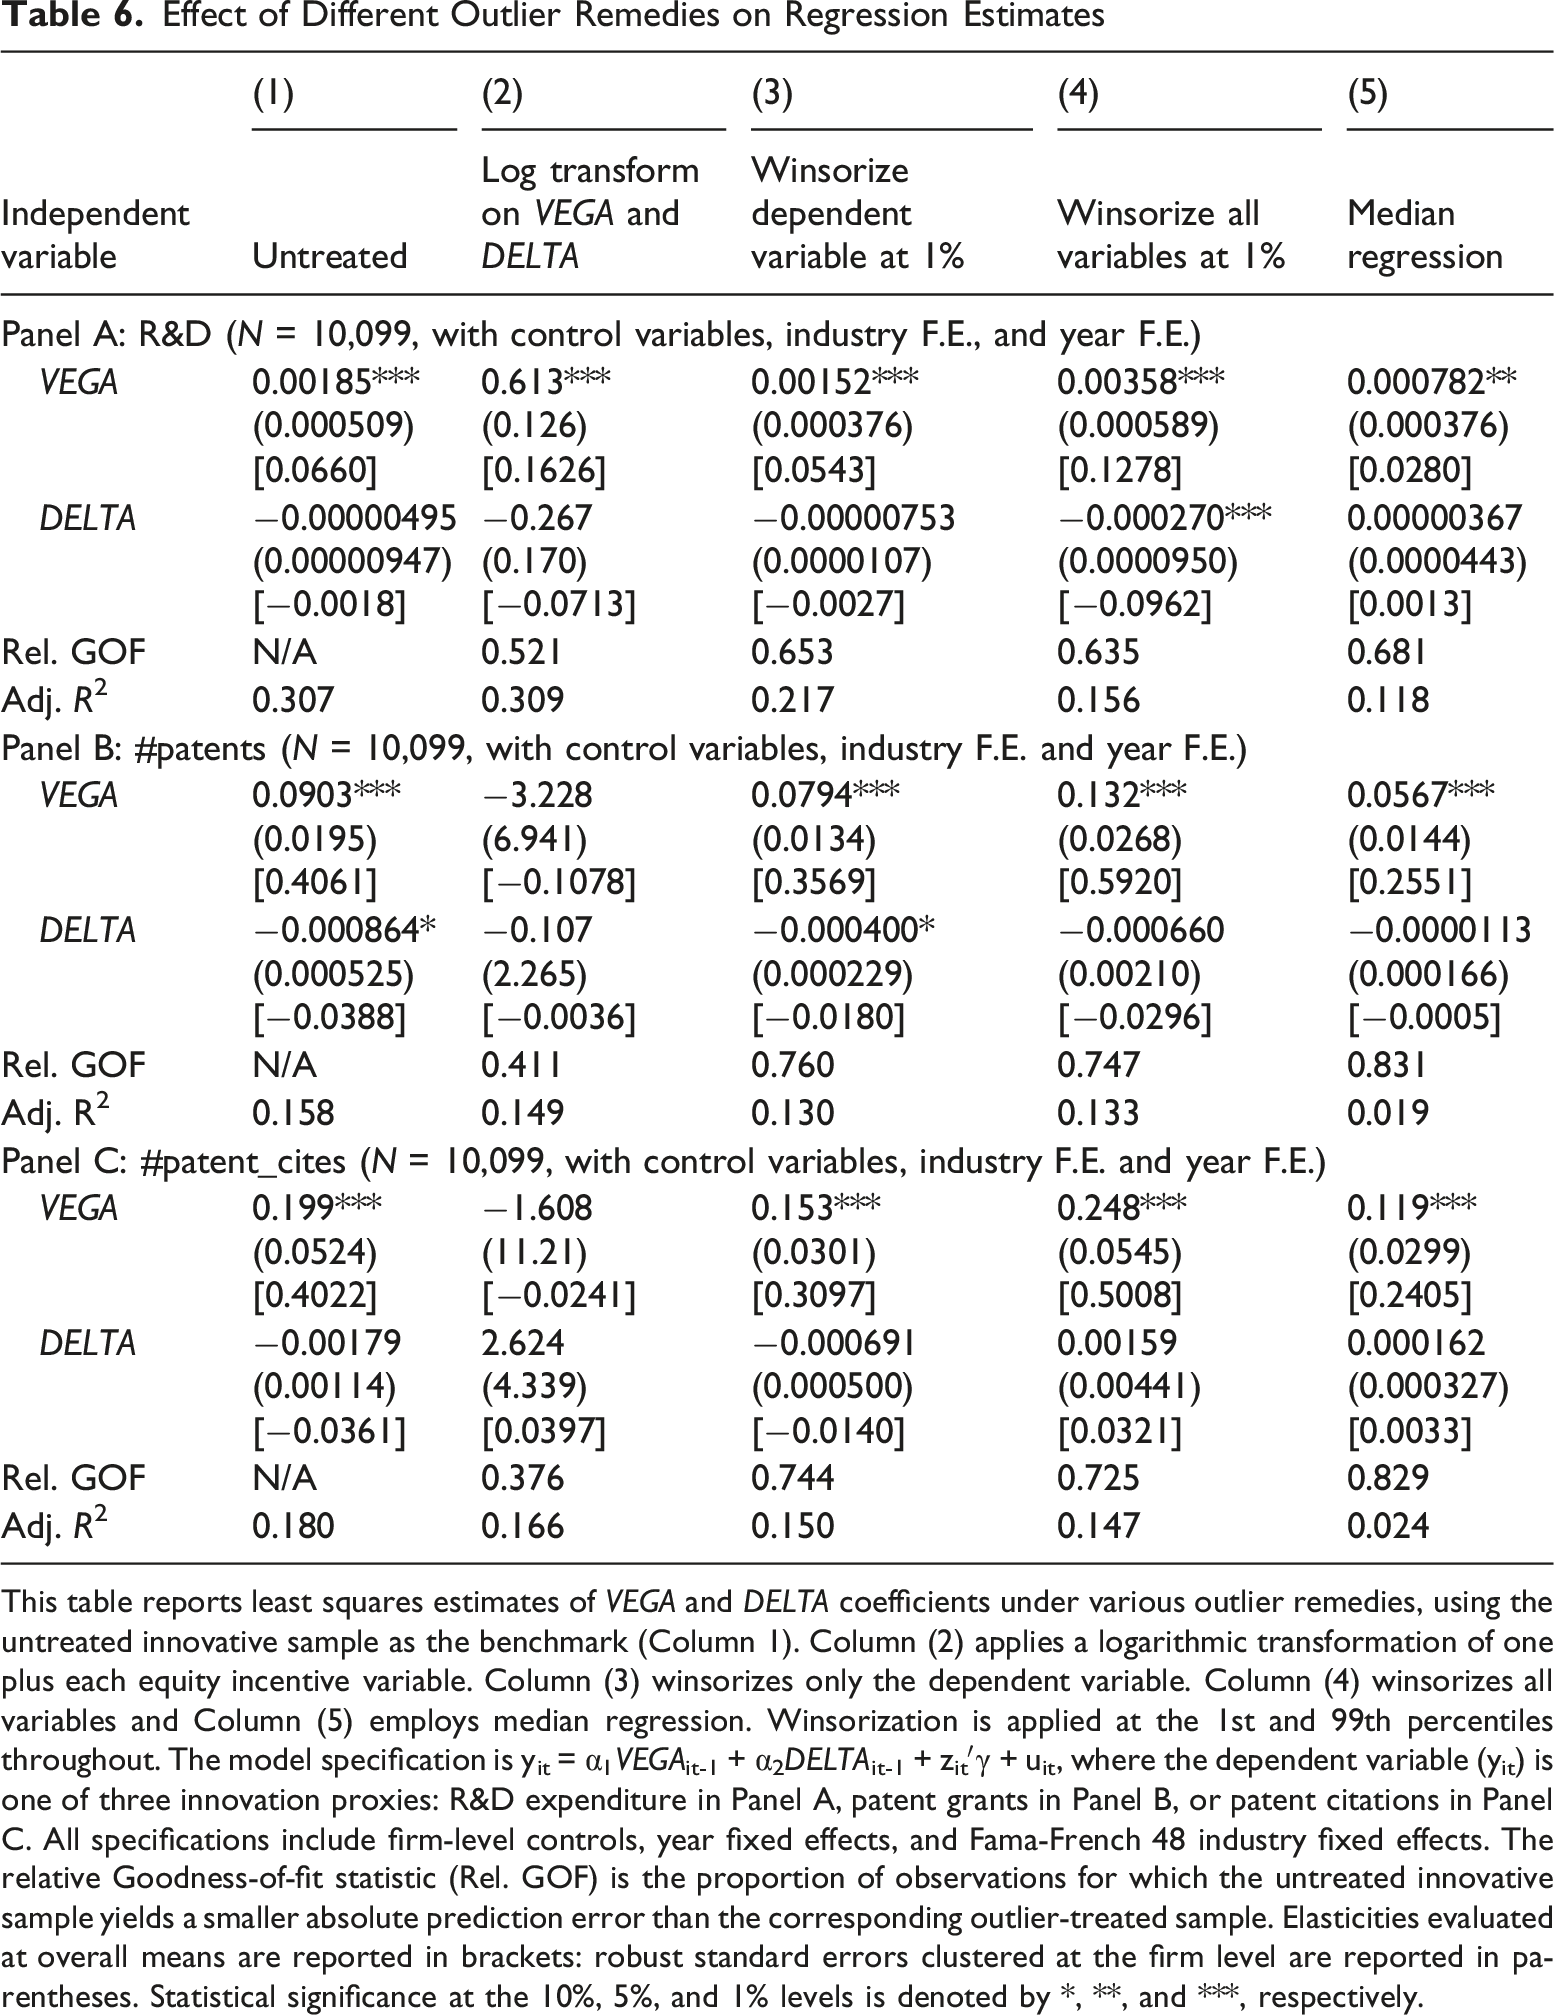
This table reports least squares estimates of VEGA and DELTA coefficients under various outlier remedies, using the untreated innovative sample as the benchmark (Column 1). Column (2) applies a logarithmic transformation of one plus each equity incentive variable. Column (3) winsorizes only the dependent variable. Column (4) winsorizes all variables and Column (5) employs median regression. Winsorization is applied at the 1st and 99th percentiles throughout. The model specification is yit = α1VEGAit-1 + α2DELTAit-1 + zit′γ + uit, where the dependent variable (yit) is one of three innovation proxies: R&D expenditure in Panel A, patent grants in Panel B, or patent citations in Panel C. All specifications include firm-level controls, year fixed effects, and Fama-French 48 industry fixed effects. The relative Goodness-of-fit statistic (Rel. GOF) is the proportion of observations for which the untreated innovative sample yields a smaller absolute prediction error than the corresponding outlier-treated sample. Elasticities evaluated at overall means are reported in brackets: robust standard errors clustered at the firm level are reported in parentheses. Statistical significance at the 10%, 5%, and 1% levels is denoted by *, **, and ***, respectively.
Table 6 illustrates that outlier remedies can be selectively applied to produce desired outcomes—a practice known as p-hacking—as different methods yield systematically different estimates (Harvey, 2017; Ohlson, 2015; Wan, 2014). The estimated effects of DELTA and VEGA vary significantly across remedies. Researchers seeking statistically insignificant VEGA coefficients, for instance, may apply a logarithmic transformation to CEO equity data: under the linear-log specification in the patent regressions (Panels B and C, Column 2), VEGA estimates are negative and statistically insignificant. Conversely, researchers seeking statistically significant results may opt to winsorize the data or forgo data treatment entirely. Researchers seeking inflated estimates may winsorize all variables: relative to untreated data (Columns 1), VEGA estimates under full winsorization (Column 4) are 25%-94% larger. Although DELTA coefficients are statistically insignificant in general, their magnitudes differ considerably across data treatments—in the R&D regression (Panel A), the DELTA estimate under full winsorization (Column 4) is 52 times larger than its untreated counterpart (Columns 1).
As expected, winsorizing only the dependent variable fails to address influential observations, as it ignores extreme values in independent variables, known as high leverage points. Least squares estimates are biased when only the dependent variable is winsorized (Goldberger, 1981). While full winsorization moderates outlier influence, it carries several drawbacks: it distorts informative data, reduce estimator efficiency (Lien & Balakrishnan, 2005), and remains susceptible to confirmation bias or p-hacking.
Our results further indicate that the identification of outliers is estimation-dependent and that conventional estimators may inadequately account for them, particularly when high-leverage observations are present. Table 5 shows that influential observations have little impact on least squares estimates of VEGA but substantially affect DELTA. Untabulated analyses suggest the same pattern for median regression estimates in the R&D regressions. These discrepancies motivate Yohai’s (1987) MM-estimators as a robust second-stage estimator within the proposed 2D framework.
2D Approach
Our 2D framework addresses outliers from a conditional perspective, recognizing their dependence on a well-specified model and robust estimation. In the first stage, we apply the mixture model to distinguish innovative from noninnovative industries. In the second stage, we use Yohai’s (1987) MM-estimation method to estimate the incentive-innovation relation on the innovative sample under the log-log specification (4). 19 MM-estimators are resilient to both high-leverage points and vertical outliers, whereas median regression is robust only to vertical outliers and remains vulnerable to high-leverage points. In addition, MM-estimators combine a high breakdown point with high asymptotic efficiency. They are therefore generally more efficient than most alternative robust estimators.
We apply logarithmic transformations to key variables, specifying log(1+xit-1) and/or log(1+yit). 20 Adding one prior to logging accommodates zero-valued observations, while the logarithmic transformation mitigates the influence of univariate outliers—a particularly important consideration given the discrete mass at zero and pronounced right skew characteristics of both innovation variables and CEO incentive measures.21, 22
Effect of Alternative Estimation Methods on Regression Estimates
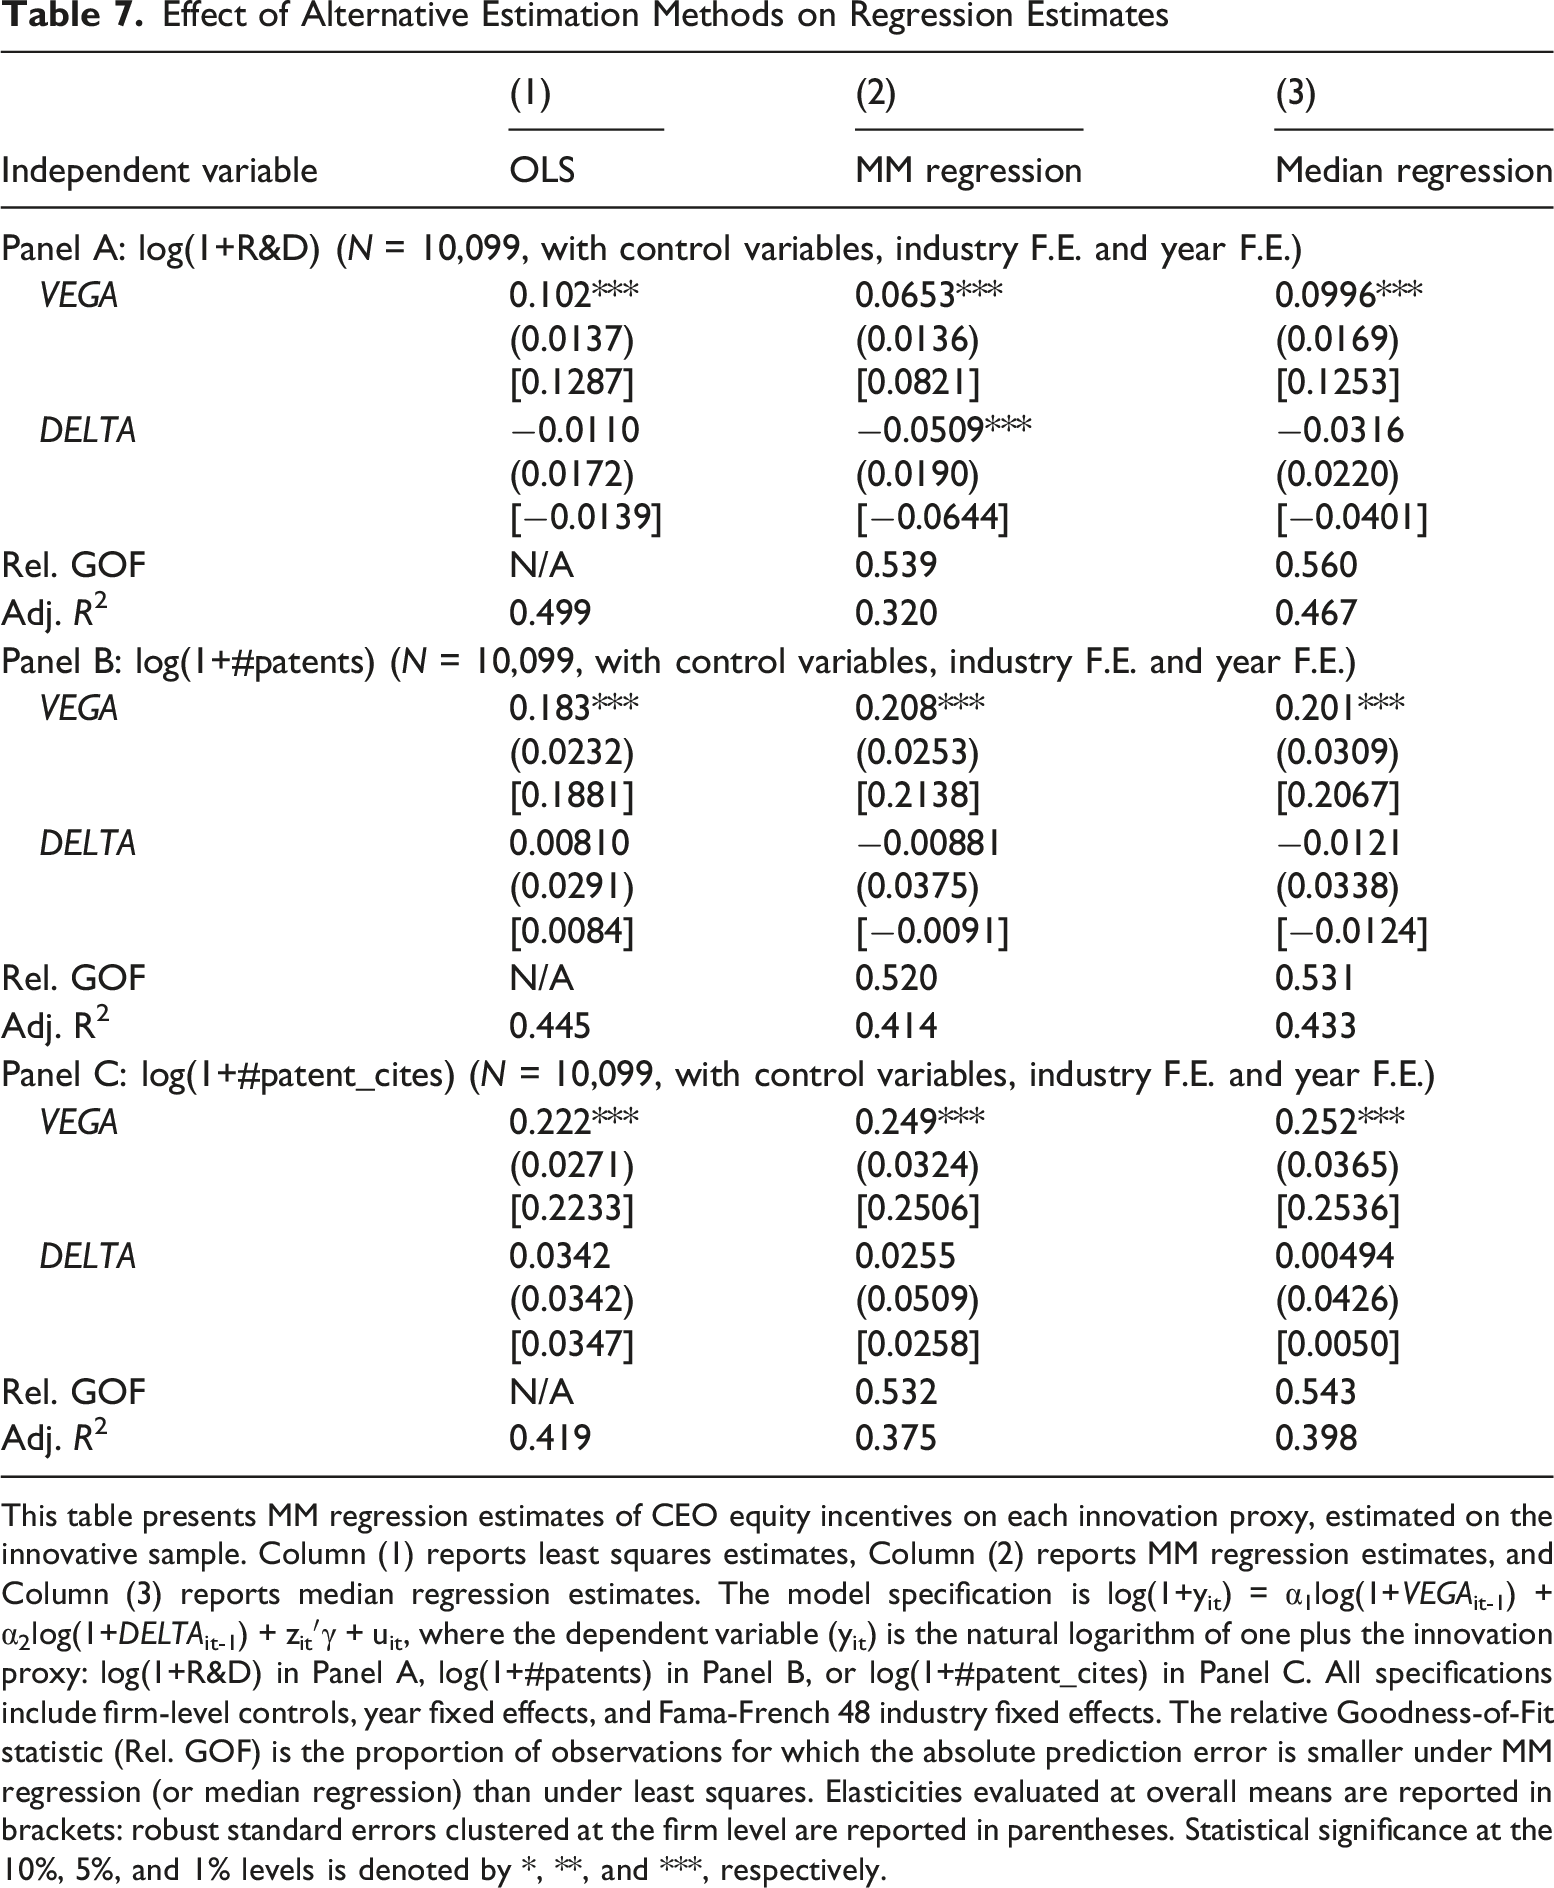
This table presents MM regression estimates of CEO equity incentives on each innovation proxy, estimated on the innovative sample. Column (1) reports least squares estimates, Column (2) reports MM regression estimates, and Column (3) reports median regression estimates. The model specification is log(1+yit) = α1log(1+VEGAit-1) + α2log(1+DELTAit-1) + zit′γ + uit, where the dependent variable (yit) is the natural logarithm of one plus the innovation proxy: log(1+R&D) in Panel A, log(1+#patents) in Panel B, or log(1+#patent_cites) in Panel C. All specifications include firm-level controls, year fixed effects, and Fama-French 48 industry fixed effects. The relative Goodness-of-Fit statistic (Rel. GOF) is the proportion of observations for which the absolute prediction error is smaller under MM regression (or median regression) than under least squares. Elasticities evaluated at overall means are reported in brackets: robust standard errors clustered at the firm level are reported in parentheses. Statistical significance at the 10%, 5%, and 1% levels is denoted by *, **, and ***, respectively.
Table 7 demonstrates that estimated CEO equity incentive effects are robust under the 2D approach, despite the use of untreated data containing univariate outliers. Specifically, the MM regression estimates for VEGA are positive and statistically significant across all innovation outcomes, while DELTA estimates are mixed and statistically insignificant in general, with the exception of the R&D regression. These findings are consistent with prior studies suggesting that greater sensitivity of CEO wealth to stock return volatility (vega) encourages innovation, whereas pay-for-performance sensitivity (delta) has no material effect on patent innovation and lacks empirical robustness.
Our results also underscore the importance of model specification in treating conditional outliers, a factor often overlooked in the innovation literature. When the log-log specification is estimated on the innovative sample, least squares estimates yield qualitatively similar inferences to MM regression, even in the presence of influential observations. The statistical significance of DELTA and VEGA coefficients is qualitatively consistent across all estimators under the log-log specification, and least squares estimates under this specification (Table 7, Column 1) are markedly more robust than those obtained under the linear (Table 6, Column 1) or linear-log (Table 6, Column 2) specifications. This underscores a key insight: robust estimation alone is insufficient—because outliers are conditional on model specification, they are best addressed through well-specified models.
Data Trimming Issues
To address the discrete spike at zero issue, researchers often resort to data trimming, which involves removing observations with no innovation output. However, this approach has three shortcomings. First, it throws away many valuable observations, as a firm’s innovation can vary over time. In unreported results, we find that over 25% of firms in the pre-FAS 123R sample have zero patent grants in some years but positive grants in others. Excluding firms with any zero-patent observations reduces the sample size by 58%, from 7,370 to 3,127 firm-year observations. Second, selectively eliminating zero-innovation observations introduces sample selection bias (Kothari et al., 2005; MacDonald & Robinson, 1985). Third, data trimming is inherently subjective and susceptible to confirmation bias.
Pre- and Post-FAS 123R Analysis
Given that SFAS No. 123(R) materially altered equity-based compensation practices, we examine the influence of outliers on the incentive-innovation relation across two subsamples surrounding the mandate. The pre-FAS 123R sample covers 1993-2004, comprising 1,948 firms and 12,379 firm-year observations; the post-FAS 123R sample covers 2006-2017, comprising 1,878 firms and 14,466 firm-year observations.
Internet Appendix 4 presents subsample summary statistics, revealing three distinct patterns. First, CEO equity incentives exhibit markedly larger univariate extremes in the pre-FAS 123R period: maximum DELTA ($1,039,751) and VEGA ($15,359) substantially exceeds their post-FAS 123R counterparts ($391,755 and $9,443, respectively). Second, average CEO equity incentives declined significantly following adoption: median DELTA and VEGA fell from $299.3 and $48.1 to $184.6 and $45.3, respectively. Third, innovation outcomes show divergent postadoption trends: patent-based extremes increased—maximum patent grants and citations rising from 3,396 and 9,210 to 8,791 and 26,301, respectively—while R&D extremes diminished, with maximum R&D intensity declining from 849.7 to 275.6. Overall, univariate outliers in CEO equity incentives are more pronounced in the pre-FAS 123R period, whereas those for patent-based innovation are more prominent in the post-FAS 123R period.
Internet Appendix 5 compares the mixture and single-equation models across both subsamples. Consistent with full-sample results, the mixture model consistently delivers superior out-of-sample predictive performance in both periods, and estimated effects remain model-dependent. Mixture model VEGA coefficients (Columns 2, 4, and 6) are substantially larger than their single-equation counterparts, and DELTA coefficients are generally larger in absolute value. Regarding sign and significance, DELTA coefficients are consistently positive and mostly statistically significant in the pre-FAS 123R period, but turn predominantly negative and insignificant in the post-FAS 123R period—the sole exceptions being the patent grants regressions in Columns (3) and (4).
Internet Appendix 6 examines influential observations across four specifications in both subsamples, yielding three findings consistent with the full-sample analysis: outlier identification is model-dependent; outlier sensitivity is specification-dependent: and DELTA estimates remain highly sensitive to influential observations. Notably, however, some subsample results diverge from full sample findings. Most strikingly, DELTA estimates remain fragile even under the log–log specification in both subsamples. Excluding Microsoft from the pre-FAS 123R sample (Section A) alters the absolute DELTA estimate by 603%, 526%, and 400% in the R&D, patent grants, and patent citations regressions (Panels A–C, Columns 7–8), respectively; excluding Oracle from the post-FAS 123R sample (Section B) yields corresponding changes of 763%, 314%, and 227%.
Moreover, removing Microsoft renders DELTA estimates—significant at the 5% level with Microsoft included—statistically insignificant. Microsoft constitutes both a vertical outlier—generating exceptionally high innovation output—and a high-leverage point, as its CEOs held large equity stakes but no stock options, yielding unusually high DELTA and zero VEGA. 23 This reflects the incentive structure typical of founder-CEOs: Bill Gates and Steve Ballmer received no option grants owing to substantial pre-IPO equity holdings, an arrangement common among founders in start-up and high-tech firms. 24 Overall, the subsamples results highlight that least squares estimates can remain fragile to influential observations (particularly high-leverage points) even under better model specifications—such as a mixture model with a log-log specification—highlighting the relevance of robust estimation techniques.
Finally, untabulated results (Internet Appendix 7) show that MM regression estimates remain robust across both subsamples, despite the presence of notable outliers in the untreated data. VEGA estimates are positive and statistically significant, while DELTA is generally negative and statistically insignificant—consistent with the full-sample results. These findings highlight the importance of model specification. When the model is properly specified—using the innovative sample, a mixture model framework, and a log–log specification—least squares and median regressions produce inferences qualitatively similar to those from MM estimation, even in the presence of influential observations. In contrast, untabulated analyses indicate that, under linear and linear–log specifications in a single-equation setting, MM estimates for VEGA lose statistical significance.
Conclusion
Outliers are a pervasive challenge in empirical studies, yet when handled thoughtfully they can provide valuable insights. We propose a 2D approach to address outliers systematically, grounded in the recognition that outliers are multivariate and conditional in nature—and thus best addressed through a clearly defined research question, a well-specified model, and a robust estimation method.
The pronounced spike at zero in corporate innovation calls for a rethinking of how equity incentives operate across firms. We address this within a 2D framework that integrates the model-specification and parameter estimation dimensions. Along the specification dimension, the central step is the mixture model, which classifies firms as innovative or noninnovative and focuses the analysis on the innovative group. This resolves a key source of model misspecification by aligning the empirical model with the firms for which equity incentives are plausibly used to promote innovation. Additional choices—such as transformations of dependent and independent variables—matter, but are secondary to the mixture model specification.
Along the estimation dimension, the treatment of outliers becomes critical. Our findings show that outliers are model-dependent as well as estimation-dependent. On the one hand, their influence varies with specification: for example, MM regression estimates for vega are insignificant under a linear–log specification but become significant under a log–log specification, reflecting the role of appropriate transformations for heavy-tailed variables. On the other hand, outliers heavily affect least squares estimates. Conventional univariate fixes, such as winsorization, are inadequate because they ignore the conditional nature of outliers, allowing results to vary with ad hoc choices. Taken together, these results underscore that properly addressing outliers requires a joint approach: correcting model misspecification through the mixture model and applying robust estimation methods within the correctly specified framework.
Applying the 2D framework to innovative firms, we find that greater sensitivity of CEO wealth to stock return volatility (vega) is robustly associated with higher innovation, whereas pay-for-performance sensitivity (delta) exhibits no robust effect. These findings underscore the importance of option-like incentives in fostering innovation and suggest that traditional pay-for-performance mechanisms play a limited role in this context. The absence of a robust delta effect accords with prior work arguing that standard incentive schemes are not necessarily conducive to innovation (Ederer & Manso, 2013; Gneezy & Rustichini, 2000; Manso, 2011).
Supplemental Material
Supplemental Material - Treating Outliers in Corporate Innovation Research: Reassessing the Effect of CEO Incentives
Supplemental Material for Treating Outliers in Corporate Innovation Research: Reassessing the Effect of CEO Incentives by Wai-Tung Ho, Keunkwan Ryu, Kam-Ming Wan in Journal of Accounting, Auditing & Finance
Footnotes
Acknowledgements
We greatly appreciate Agnes Cheng, Xiao-Jun Zhang, and two anonymous reviewers for their insightful comments. We are also grateful to Renee Adams, Pierre Azoulay, Po-Hsuan Hsu, Inmoo Lee, Kevin J. Murphy, Jim Ohlson, Bharat Sarath, Siew Hong Teoh, and seminar participants at the Chinese University of Hong Kong (Shenzhen), Hanken School of Economics, IÉSEG School of Management, Korea Advanced Institute of Science and Technology, National Chengchi University, Seoul National University, University of Southampton, the 2017 and 2018 Journal of Accounting, Auditing and Finance conference, the 2018 TFA International Conference and Annual Meeting, and the Third HKU Symposium on Innovation Strategy and Entrepreneurial Finance for their useful comments. We are thankful for the excellent research support from Wing-Yung (Hazel) Ho and Chi-Yun (Jessica) Lee.

Funding
The author(s) disclosed receipt of the following financial support for the research, authorship, and/or publication of this article: This research project obtained financial support from the Central Research Grants and Departmental General Research Grant of the Hong Kong Polytechnic University (project numbers G-YBL7, G-YBEY, and G-UB34).
Declaration of Conflicting Interests
The authors declared no potential conflicts of interest with respect to the research, authorship, and/or publication of this article.
GenAI Usage Disclosure
The authors used GPT-5 and Claude-4.6 for spelling and grammar checks, and all corrections were carefully reviewed and approved by the authors
Supplemental Material
Supplemental material for this article is available online
Notes
Author Biographies
References
Supplementary Material
Please find the following supplemental material available below.
For Open Access articles published under a Creative Commons License, all supplemental material carries the same license as the article it is associated with.
For non-Open Access articles published, all supplemental material carries a non-exclusive license, and permission requests for re-use of supplemental material or any part of supplemental material shall be sent directly to the copyright owner as specified in the copyright notice associated with the article.
