
Abstract
Using institutional theory as the foundation, this study examines the role of organizational visibility from a variety of sources (i.e., slack visibility, industry visibility, and visibility to multiple stakeholders) in influencing corporate social performance (CSP). The conceptual framework offers important insights regarding the instrumental motives of managers in performing CSP initiatives. Based on a sample of 124 S&P 500 firms, the authors found that it is a firm’s visibility to stakeholders, rather than its economic performance, that has the larger impact on managers’ decisions regarding how much CSP their firms exhibit. The results show that more profitable firms may not be motivated to engage actively in CSP unless they are under greater scrutiny by various firm stakeholders. The authors also found that organizational slack (estimated as cost of capital) is positively associated with a Social CSP dimension but negatively associated with a Strategic CSP dimension. This research contributes to the current CSP literature by demonstrating that motivations in addition to normative or ethical ones may be at play in the decisions firms make regarding their CSP.
For corporations today, the importance of reputation and standing for something beyond the functional benefits or price point of a product or service has never been more important in the battle for consumer loyalty and trust.
The increased requirements firms face for corporate citizenship reflected in the above quotation have occurred because of an evolution of society’s expectations of the legitimate business firm (Sharfman, 1994). Regardless of whether Rousseau’s (1762/1968) concept of the social contract is a valid theory of firm social responsibility, society increasingly accepts it as how businesses should address social issues (Donaldson, 1982). Although the trend has been building for a long time, firms facing increasing pressures from society and its key institutions to be more legitimate (i.e., better corporate citizens) often answer that pressure by performing more of what they judge to be expected corporate social performance (CSP). For many firms, the changing expectations create difficulties because they receive conflicting information from institutional actors about their “debt.” What is appropriate (even essential) social performance for one constituency is heresy to others (e.g., Rupp, Williams & Aguilera, in press). Furthermore, it is not clear to managers why firms even in the same industry seem subject to different pressures for social performance.
We propose that the differing legitimacy requirements and CSP expectations firms face stem in part from the degree of attention they attract from society. Managers gauge (either implicitly or explicitly) the amount of legitimacy pressure this attention creates and then make instrumental choices about how much CSP to perform in response. Although the majority of CSP studies have posited it as a manifestation of intrafirm phenomena such as managerial values, CEO compensation, or board structure (e.g., Buchholtz, Amason, & Rutherford,1999; Deckop, Merriman, & Gupta, 2006; Logsdon & Yuthas, 1997; Wang & Coffey, 1992), a growing group of authors (e.g., Aguilera, Rupp, Williams, & Ganapathi, 2007; J. L. Campbell, 2007; Cox, Brammer, & Millington, 2004; David, Bloom, & Hillman, 2008; Johnson & Greening, 1999; Matten & Moon, 2008; McWilliams & Siegel, 2001; Neubaum & Zahra, 2006; Rupp, Ganapathi, Aguilera, & Williams, 2006; Weaver, Trevino, & Cochran, 1999) propose that CSP is as much a response to external pressures as it is to internal characteristics or managerial values. For example, using a multilevel theoretical framework, Aguilera et al. (2007) suggest that organizations are pressured to engage in corporate social activities based on both instrumental and noninstrumental motives whereas Rupp et al. (in press) suggest that CSP decisions are made as a function of “the extent to which the decisions are self-determined, i.e., that the acts are seen as either externally valuable or intrinsically rewarding” (p. 10). Additionally, McWilliams and Siegel (2001) argue that firms perform CSP based on the demand for CSP from stakeholders to achieve optimal economic efficiency. Our research builds on these ideas using an institutional theoretical framework and tests a model of factors that predicts how social performance will vary among firms due to the visibility they attract.
Because firms identify the legitimacy constraints placed on them by society or its institutions and in part use CSP to meet those demands (e.g., Matten & Moon, 2008), it is necessary to detail this relationship more precisely. The relationship between legitimacy and CSP can be summarized in the following points: (a) business firms are recognizing (or being forced to by stakeholders) that CSP is not a luxury or a nicety, but an important provider of legitimacy and by implication of reputation (Rao, 1994); (b) legitimization is society’s permission for the firm to do business, in effect its “license to operate” (e.g., Dow, 2002). Therefore legitimacy is an essential input to the firm (Wood, 1991a) and an important intangible resource (cf. Dowling & Pfeffer, 1975; Hall, 1993; Itami & Roehl, 1987); (c) American society specifically and global society generally are increasing their expectations (demands) for the “fees” for this legitimacy-based license to operate, that is, more CSP (e.g., GollinHarris, 2004). In other words, providing sufficient benefits to the society in which it operates has become critical for a firm to legitimize its existence and ensure its future.
However, firms that are more in the public eye are more likely to face these legitimacy pressures than firms the public does not know (e.g., Dowling & Pfeffer, 1975). Therefore this demand for more CSP likely would not be uniform across industries or across firms within industries because firms and industries vary in the amount of attention they attract (e.g., J. L. Campbell, 2007). For example, when was the last time we saw a firm in the metal cutting industries marketed their public image, yet highly visible energy companies do so all the time. From these disparities our research questions arose:
Research Question 1: What effects do legitimacy pressure and legitimacy-seeking behavior have on a firm’s CSP?
Research Question 2: Can CSP be conceptualized as an instrumental response to legitimacy pressure based in part on the firm’s visibility?
Research Question 3: What is the role of financial performance in the relationship between a firm’s visibility and its CSP?
To address these questions, we examine the effects of three different types of direct or indirect sources of visibility—industry visibility, visibility to multiple stakeholders, and financial resources visibility—on a firm’s CSP. Higher visibility motivates managers to perform more socially responsible activities because they are under greater scrutiny by the firm’s stakeholders and society to be better corporate citizens. In addition, we investigate whether the relationship between firm visibility and CSP is affected by different levels of financial performance. Because the results of prior empirical studies on the relationship between firm financial performance and firm CSP (e.g., Aupperle, Carroll, & Hatfield, 1985; Orlitzky, 2001; Waddock & Graves, 1997) have been inconsistent, we use a different approach to investigate this linkage.
The objective of this study is to examine industry- and firm-level characteristics that lead to greater visibility, which in turn lead firms to respond to legitimacy demands with different levels of CSP. Our approach allows for an investigation of CSP in a unique way. If managers assess their firm’s legitimacy expectations to determine the extent to which to engage in CSP, CSP becomes an instrumental choice and a resource—one that can be used by the firm for its own strategic ends (Barney, 1991). In spite of the instrumental nature of the argument, it should be noted that this model does not preclude ethically motivated CSP. Evidence suggests that managers sometimes engage in CSP strictly as a function of their own values as opposed to having a more instrumental motivation (e.g., Miles, 1987).
The primary contribution from this research is it takes a step further in disentangling the complex relationships among stakeholders’ pressures, financial performance, and their effects on CSP. To the best of our knowledge, this is the first study examining how managers might be motivated to engage in socially responsible activities in response to societal expectations and legitimacy pressures that come from higher visibility. That is, motivations other than normative/ethical ones may be at play in the CSP decisions that firms make. This research contributes to the CSP literature by extending our understanding of instrumental motives of managers in performing socially responsive actions. In addition, by incorporating both industry and firm level variables in the model, this research provides a more sophisticated framework in explaining whether and how a firm’s CSP might be affected by external conditions. Finally, the results of this research have implications for practitioners. As managers’ understanding of stakeholder expectations for CSP increases, they should be in a better position to address those concerns and respond effectively (e.g., Oliver, 1991).
Theoretical Framework
The idea that legitimacy is essential for organizations is not new. Legitimacy is a phenomenon that constrains change and pressures organizations to conform to their institutional environments. For example, firms in a postindustrial society are required to reflect the nature of their environments much more so than the technical issues of their specific tasks (Bell, 1973). The more firms attend to these institutional elements, the more likely they are to be seen as conforming to societal norms, that is, being legitimate. Suchman (1995) defined legitimacy consistent with these ideas as
A generalized perception or assumption that the actions of an entity are desirable, proper, or appropriate within some socially constructed system of norms, values, beliefs, and definitions (p. 574) . . . Thus, constituents are likely to accord legitimacy to those organizations that “have our best interests at heart,” that “share our values,” or that are “honest,” “trustworthy,” “decent,” and “wise.” (p. 578)
DiMaggio and Powell (1983) used the term isomorphism to describe the set of legitimacy-seeking behaviors where organizations seek increased similarity. The three types of isomorphism are coercive isomorphism (organizations adopt structures or procedures because they are forced to do so by law, contracts, etc.), normative isomorphism (organizations adopt procedures to gain normative status through the process of professionalization and socialization), and mimetic isomorphism (organizations copy another organization as a response to uncertainty). In this article, we argue that all of these types of isomorphism can be sources of institutional pressure on firms to increase socially responsible behavior. For instance, larger factories are often subject to higher levels of environmental regulations, which force them to implement more environmental-friendly operational procedures (coercive). In addition, firms are more likely to adopt socially responsible activities (e.g., better employee treatment and community relationships, etc.) in order to meet societal expectations (normative). Finally, firms facing higher levels of uncertainty or competitive threats might try to imitate more successful firms in the market by performing similar socially responsible behaviors (mimetic).
Although the path to legitimization is not clear (Suchman, 1995), it is increasingly apparent that while obeying the law is necessary it is not sufficient for firms to be considered legitimate (Epstein, 1987). Companies such as Enron and Arthur Anderson are examples where illegal and perceived unethical behavior resulted in a loss of legitimacy. In these cases, powerful institutional actors reduced these once highly respected firms to simply shell organizations disposing of what assets remained. In addition, profit maximization by itself is not sufficient for legitimization as Friedman’s (1962) argument would suggest, that is, “there is one and only one social responsibility of business—to use its resources . . . to increase its profits” (p. 133). Because legitimization is an essential condition for the survival of the firm (Dowling & Pfeffer, 1975; Rao, 1994; Singh, Tucker, & House 1986; Wiley & Zald, 1968; Zucker, 1989), the business firm must go beyond legal compliance and single-minded profit maximization because they must meet society’s legitimization criteria to be allowed to exist and prosper.
Legitimacy and Corporate Social Performance
“Organizations compete not just for resources and customers but for . . . organizational legitimacy, for social as well as economic fitness” (Aldrich, 1979: 265). Such a theoretical position elevates legitimacy to the level of a strategic input (e.g., Barney, 1991) and we propose that CSP is an important part of the cost of that input (cf. Sethi, 1975). An example of how one firm links its social performance to its legitimacy as “license to operate” comes from Dow Chemical:
Society, which ultimately holds our license to operate and grow, expects industry to play its part in the resolution of these (“social”—authors’ addition) issues. In return, companies that take on this challenge can look forward to a better relationship with community neighbors, a boost in employee motivation, increased customer loyalty, reduced costs and liabilities and a better corporate reputation. All of which have a direct or indirect influence on a company’s financial results. (Dow, 2002)
Although CSP is not sufficient for legitimization, it appears increasingly necessary as part of the “license to operate” we mention above. If firms are to prosper they must understand what this “license” entails and especially its “fee.” This idea is in line with the conception of corporate philanthropy programs that firms may develop and implement as socially responsible initiatives to achieve synergistic benefits through community connections (i.e., legitimacy) in society (Saiia, Carroll, & Buchholtz, 2003). One way that firms gain (pay the “fee” for) legitimacy is “by embracing socially accepted techniques” (Suchman, 1995: 580) which includes meeting society’s expectations for corporate citizenship through the production of “concrete, meritorious outcomes” (Suchman, 1995: 588). A 21st century reality is that meeting these expectations appears to be a moving (rising) target. As societies focus on the future, they begin to expect more from corporations as citizens (Reilly, 1990). For evidence of these rising expectations, we review the results of GollinHarris’s (2004: 2) stratified national survey of over 2,700 people in the United States concerning perceptions of corporate citizenship, which stated in part
44% of Americans . . . have doubts and concerns about the trajectory of the business community’s commitment to corporate citizenship, compared to less than one-quarter (24%) who believe business is heading in the right direction . . . As business does better at the bottom line, Americans are expecting that brands do better at meeting and exceeding their corporate citizenship obligations.
Furthermore, 52% report “they are very or somewhat likely to start or increase their business with a company specifically because of its corporate citizenship record” (GollinHarris, 2004: 3). This number jumped from 43% in their 2003 survey; a 9% increase.
However, even within organizational fields, firms differ in how much CSP will be expected of them (Matten & Moon, 2008). The organizational fields (Scott & Meyer, 1983) within which firms operate differ in terms of the demands for CSP they place on member firms because the different fields have differing legitimacy requirements (Matten & Moon, 2008). Cottrill (1990) showed that the nature of specific industries predicts firms’ levels of CSP. This article in part extends that line of research. However, Cottrill (1990) only looked at the effects of what broadly could be called an industry’s market structure. We argue that our understanding of the external effects on CSP is still incomplete. To capture the influence of organizational fields (industries) on CSP more effectively, we must consider institutional forces as well as market structures (Meyer & Rowan, 1977). Such varied legitimacy requirements may also stem from the different patterns of stakeholders in each field and the different criteria for awarding legitimacy these stakeholders have. As such, we propose that the effects of all of these mechanisms on legitimacy vary in part depending on how visible a firm is to its stakeholders or an industry is to the public. In this article, we develop a model that helps us understand how industries and firms within industries vary in terms of the visibility they engender and the subsequent required levels of CSP firms choose to exhibit as legitimacy-seeking behavior.
Hypotheses
Before we present the specific predictions underlying this research, it is necessary that we clarify our working definition of CSP. Following McWilliams and Siegel (2000) and Wood (1991a), we define CSP as a firm’s actions in the promotion and configuration of social responsibility processes, policies, programs, and observable outcomes that are beyond the immediate interests of the firm and beyond that which is required by law. Key to this definition is that CSP is about both values and outcomes, that is, the firm’s beliefs are not sufficient—rather the “bottom line” is its social performance, including action areas such as diversity programs, corporate philanthropy, and community engagement. To develop a legitimacy-based model of the antecedents of CSP, we identified three key sources of direct or indirect attention generation, including the nature of the firm’s industry, its visibility to multiple stakeholders, and its level of slack resources. Below, we analyze how these different types of visibility sources affect managers’ choices regarding their firms’ levels of CSP. We also examine the effect of firms’ financial performance on the relationship between firm visibility and subsequent CSP.
Industry Visibility
The most basic issue in predicting how much legitimacy-seeking CSP firms will achieve likely depends on the characteristics of their area of business activity. Firms’ stakeholders (e.g., customers, suppliers, regulators, and media) have expectations that vary systematically across organizational fields (Rosenzweig & Singh, 1991). That is, the context in which firms operate has a profound influence in shaping societal expectations of legitimate corporate behavior (Miles, 1987). In general, firms that operate in more visible industries are more likely to face stronger institutional pressure than those in less visible industries. The visibility of an industry stems from, for example, (a) the level of environmental, financial or production risks in which an industry might entail and (b) the level of customers, employment, revenues, or taxes an industry generates. Organizations that operate in what appear to be more risky industries receive greater scrutiny from institutional actors and are expected to demonstrate higher levels of commitment to socially responsible behaviors. This is in line with Gardberg and Fombrun’s (2006) argument that industry visibility shapes the range of acceptable corporate citizenship profiles. As examples; nuclear power plants are highly visible because of the potential danger from accidents. Consumer product manufacturers receive more scrutiny because they have more customers than do business-to-business marketers. Of consumer oriented firms, gasoline retailers are more visible than trash-haulers because their services pervade our consciousness more. Moreover, pharmaceutical firms often have several community groups closely monitoring their activities while few people pay attention to soft-drink distributors. As such, we posit that the choice of how much CSP a firm exhibits is influenced by the degree of visibility in the institutional environment of the industry in which the firm participates.
Hypothesis 1: A firm’s industry visibility is positively associated with its CSP.
Visibility to Multiple Stakeholders
Our second predictor is the firm’s visibility to multiple stakeholders. Stakeholders are providers of legitimacy but they can just as easily withdraw it. Various types of stakeholders place different CSP demands on the firm and vary in the extent to which they care about CSP (Mackey, Mackey, & Barney, 2007). The more that important stakeholders actively agitate for CSP, the more likely it is to occur (J. L. Campbell, 2007). Increasingly, activist stockholders use shareholder initiatives to pressure firms to increase specific CSP activities. Community groups use tactics ranging from letter-writing campaigns to boycotts to address perceived CSP deficiencies. We argue that firms that are more visible to a higher number of stakeholder groups are more likely to allocate internal resources to CSP than firms who face a lower number of stakeholder groups. Further, firms that have higher media exposure (more news coverage) are under greater scrutiny concerning their corporate citizenship behaviors because of their higher visibility, which in turn helps reduce information asymmetry between stakeholders and managers (Brammer & Millington, 2006). A decrease in information asymmetry gives stakeholders a clearer picture of the firm’s actions, which may in turn increase stakeholders’ future expectations. These increased expectations may motivate the firm’s managers to perform more CSP in order to address the pressures from institutional actors and other important stakeholders. This argument is consistent with Saiia et al. (2003) who found that firms with higher visibility are more inclined to make larger philanthropic gifts to the community. In addition, firms vary greatly in terms of how many actors (e.g., number of common shareholders, institutional investors, and community groups) might have a stake in their outcomes. Organizations with a large number of common shareholders are likely to be more visible than those with a small number of shareholders. The more that the firm’s actions are monitored by stakeholders, the more likely their social performance is explicit and visible (J. L. Campbell, 2007; Matten & Moon, 2008).
Alternatively, stakeholder demands for CSP may be explained from the resource-based view perspective (RBV). RBV scholars (e.g., Barney, 1991) argue that resources that are valuable, rare, nonimitable, or nonsubstitutable by competitors can be sources of competitive advantages for organizations. Investing in CSP may help the firm develop new competencies and resources in areas such as human capital, corporate culture, and technology (Barney, 1991; Russo & Fouts, 1997; Wernerfelt, 1984), which should lead to shareholder wealth in the long run. More importantly, corporate reputation is linked directly to social responsibility (Fombrun, 1996). Godfrey (2005) argued that philanthropy and other corporate social initiatives create intangible assets for the firm by generating positive “moral capital” among communities and stakeholders. Such positive moral capital is a resource and provides the firm with insurance-like protection, which can help mitigate stakeholders’ propensities for negative actions against the firm when bad acts occur. A higher level of moral capital from engaging in a higher level of CSP serves two purposes. First, it allows a firm to increase its legitimacy among stakeholders with which it interacts. Second, like reputational capital (e.g., Deephouse 2000; Fombrun, Gardberg, & Barnet, 2000), moral capital can become a sustainable competitive advantage to a firm because it often takes a number of years to develop (Dierickx & Cool, 1989); therefore it is difficult to imitate or substitute (Barney, 1991; Ghemawat, 1991). In sum, we argue that as firms’ visibility to stakeholders increases, they will (a) face more CSP demands from the institutional and other actors and (b) have greater incentives to create, develop, and maintain positive moral capital with their stakeholders, both resulting in higher levels of CSP.
Hypothesis 2: A firm’s visibility to stakeholders is positively associated with its CSP.
Financial Performance as a Moderator
The relationship between CSP and financial performance has received a considerable amount of attention (e.g., Orlitzky, Schmidt, & Rynes, 2003). The main concern in this literature lies in whether there is a trade-off between socially responsible behavior and profitability. However, results from past research have been mixed, reporting positive, negative, and null relationships between CSP and firm performance (e.g., see Aupperle et al., 1985; Waddock & Graves, 1997). Although the mixed findings can be explained by the type of dependent variables, stakeholder mismatching, measurement errors, and a neglect of various contingency factors (Orlitzky et al., 2003; Wu, 2006), some scholars (e.g., Sharfman, 2005) suggested that the CSP/financial performance relationship may be moderated or mediated by other factors. In this research, instead of proposing a direct effect on CSP from firm profitability, we examine the moderating role of economic performance in the relationship between the firm’s visibility to stakeholders and CSP (Figure 1).
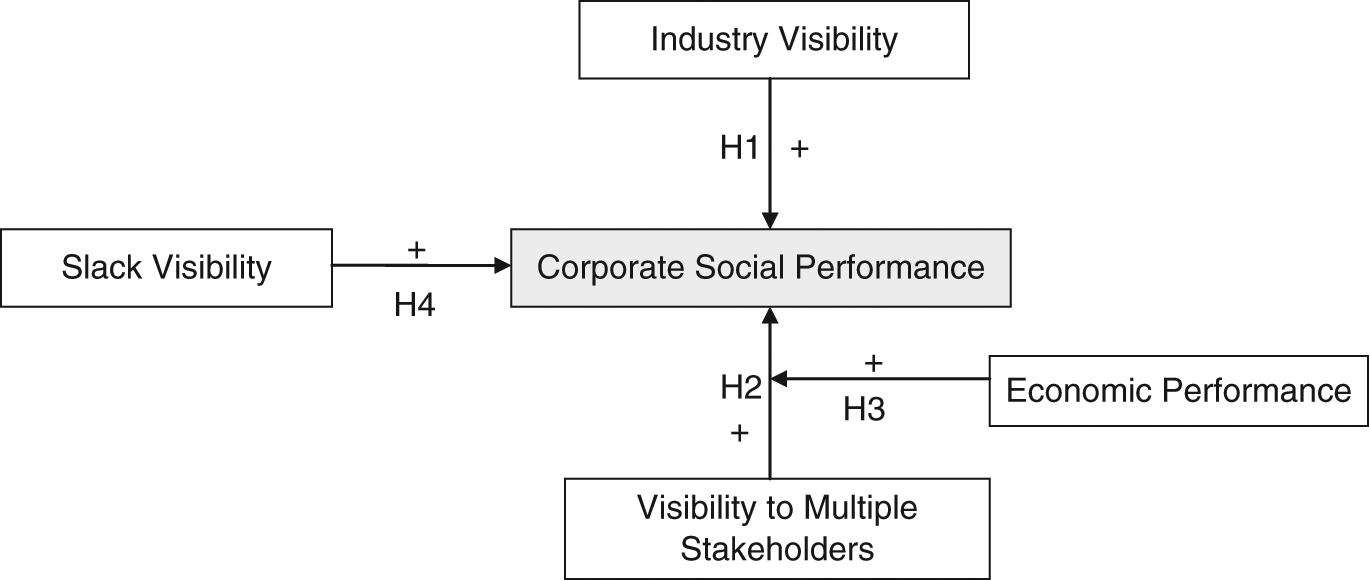
Conceptual Model: Visibility, Economic Performance, and Corporate Social Performance (CSP)
Earlier we argued that organizations with higher visibility (e.g., greater media exposure, a large number of stakeholders, etc.) are more sensitive to stakeholders’ demands for CSP because they are under greater scrutiny in the range and quality of their corporate citizenship profiles. The relationship between visibility to stakeholders and CSP is likely moderated by a firm’s financial performance because higher profits should give stakeholders more confidence in the firm’s ability to make CSP investments. Stakeholders who value CSP might put pressure on the firm to facilitate the implementation of social actions (Mackey et al., 2007); such demands should be higher when the firm has capabilities to allocate funds from its profits for CSP.
We propose that economic performance will moderate the relationship between firm visibility and CSP because organizations with strong profitability may not necessarily exhibit higher levels of CSP, unless they have incentives (e.g., face visibility pressure from institutional stakeholders) to provide benefits or to pay the legitimacy “license fee” to society. While visibility to multiple stakeholders is a key driver behind a firm’s CSP, high visibility plus strong profit performance accentuates pressures that key stakeholders put on firms to demonstrate more socially responsible behaviors. Accordingly, the relationship between visibility to stakeholders and CSP should be enhanced when the firm has strong economic performance. This argument is important because the central theme of our research is to examine whether an instrumental choice (i.e., visibility that forces profitable firms to perform more CSP) plays a critical role in managerial decisions regarding the level of CSP firms make.
Hypothesis 3: Economic performance moderates the relationship between a firm’s visibility to stakeholders and its CSP, such that higher profits will strengthen the relationship between a firm’s visibility to stakeholders and its CSP.
Organizational Slack, Visibility, and Corporate Social Performance
The next predictor of CSP is organizational slack (e.g., Sharfman, Wolf, Chase, & Tansik, 1988). Organizational slack can be manifested in several forms, such as excess staff, retained earnings, or discretionary budgets (Tan, 2003). Because CSP activities rely on firms’ allocation of resources to meet both social and economic objectives, firms with more slack are more likely to implement more CSP activities than firms with little or no slack. Cyert and March (1963) argued that firm policies and expenditures are especially sensitive to the existence of slack resources. If CSP entails a significant cost, firms with more slack are more capable of absorbing those costs and more willing to undertake socially responsible actions (J. L. Campbell, 2007; Parket & Eilbirt, 1975; Seifert, Morris, & Bartkus 2004; Ullmann, 1985). This position is consistent with the Waddock and Graves (1997: 314) “virtuous cycle” argument that when firms engage in CSP they generate better economic returns which subsequently allow firms to afford more investments in future CSP especially when these resources are retained as slack. In addition, previous studies (e.g., Bowen & Sharma, 2005; Sharma, 2000) also showed that organizational slack can facilitate proactive corporate environmental strategies that many consider CSP as well. For example, available slack (Bourgeois & Singh, 1983) in the form of excess management time or cash give firms greater flexibility in experimenting with different socially responsive projects. Furthermore, conceptualizing slack through the cost of capital perspective, Sharfman (2005) found that the relationship between CSP and firm financial performance is mediated over time by the firm’s level of slack resources. This suggests that lower costs of capital as a result of increased CSP can function as unabsorbed slack (Singh, 1986) to support other investments such as social performance projects.
However, although profits may generate the visibility, the firm’s ability or willingness to invest in CSP is a function of how much of those profits are turned into organizational slack (Sharfman et al., 1988). Specifically, although high profits create the potential for more slack resources, firms may reinvest such profits in the firm’s core activities rather than leaving them as discretionary slack (i.e., unallocated resources that are not dedicated to the production function of the firm in the short term; Bowen & Sharma, 2005). The presence of slack resources allows the firm to make more discretionary (visible) investments, for example, ones that are higher risk or that have lower potential return (e.g. Sharfman et al., 1988). Such investments are often highly visible to stakeholders and media. Consistent with our argument, Easley and O’Hara (2004) found that firms with lower costs of capital (i.e., more slack resources) engaged in more corporate disclosures generally. As slack (discretionary resource) levels increase, because of social contract–based ideas, organizations are expected to fulfill their obligations to society by putting something back into the community via CSP. To this point, Seifert et al. (2004) found that high slack resources lead to higher corporate philanthropy—again actions that are highly visible to stakeholders. Although the presence of slack allows the firm to engage in more CSP (generating visibility) it is also associated with more visibility generally (Easley & O’Hara, 2004). Therefore, for the above reasons we posit that visibility from organizational slack is associated with higher levels of CSP.
Hypothesis 4: The higher the firm’s visibility from organizational slack, the higher the level of CSP.
Method
Data and Sample
We collected the data for the present study archivally from a variety of databases. Carroll (1991) encouraged researchers to measure CSP from a variety of different perspectives using a variety of different measures. Whereas in narrative discussions, CSP has been characterized as if it were unidimensional, the literature seems clear that it is multidimensional (e.g., Boal & Peery, 1985; Griffin & Mahon, 1997; Mattingly & Berman, 2006; McWilliams & Siegel, 2000; Mears & Smith 1977; Wood 1991b; Wood & Jones, 1995). Among the approaches to examining CSP in terms of a single issue are CSP as pollution control (e.g., Bowman & Haire, 1975; Chen & Metcalf, 1980; Folger & Nutt, 1975) or as corporate philanthropy (e.g., Buchholtz et al., 1999; Galaskiewicz & Burt, 1991; Wang & Coffey, 1992). Others have examined the opposite of CSP (i.e., corporate crime; e.g., Wokutch & Spencer, 1987). Alternative approaches include the use of Fortune magazine’s America’s Most Admired Companies data (e.g., McGuire, Sundgren, & Schneeweis, 1988; Spencer & Taylor, 1987), primary surveys (e.g., Aupperle, 1984), content analysis of annual reports (e.g., Wolfe, 1991), or the Kinder, Lydenberg and Domini (KLD) social performance indicators (e.g., Berman, Wicks, Kotha, & Jones, 1999; Guerard, 1997; Johnson & Greening, 1999; Waddock & Graves, 1997). Each of these approaches has attempted to measure the CSP construct in different ways. Although there have been a wide variety of methods used to measure this elusive construct, (Bowman & Haire, 1975; Galaskiewicz & Burt, 1991; Mattingly & Berman, 2006, etc.), Graves and Waddock (1994) suggested that the KLD data offer several advantages over other CSP measurement approaches, including comprehensiveness and objectivity, so we used the data set.
Because scholars have called for the use of multiple sources of data in measuring CSP (Carroll, 1994; Graves & Waddock, 1994), in this research we augmented the KLD measures with the Social Responsibility score from Fortune magazine’s survey of America’s Most Admired Companies. Fortune Magazine annually surveys thousands of executives concerning seven reputation elements, including social responsibility. The KLD data set has been widely used in CSP research (e.g., Berman et al., 1999; Guerard, 1997; Johnson & Greening, 1999; Waddock & Graves, 1997) as has the Fortune magazine data (e.g., Brown & Perry, 1994; Conine & Madden, 1987). We chose evaluations performed by external observers (KLD and the participants in the Fortune survey) for several reasons. Both of these databases are large and address cross-sections of industries so we are more likely to have sufficient variance for all variables. In addition, there is less chance for self-serving biases from which primary data might suffer because the executives (in the Fortune survey) or the raters (who work for KLD) are not evaluating their own firms’ performance. Also, firm-specific choices such as philanthropy or environmental performance are too narrow to capture the broad nature of the CSP construct. We discuss the measures using these data sets in the next section. Of the 500 firms in the original Standard & Poor (S&P) data set, 159 firms were evaluated both by KLD and the Fortune survey. Missing or incomplete data further reduced the final sample size to 124 firms.
Measures of Corporate Social Performance
For construct validity purposes, we combined the KLD CSP indicators with the Fortune magazine Social Responsibility score. Combining the KLD scores with the Fortune data provides this study with two different, objective evaluations of CSP and allows triangulation on the construct as well as a demonstration of convergent validity (D. T. Campbell & Fiske, 1959). We used data from 2002 as that was the latest complete year for all data available at the beginning of this analysis.
KLD’s Socrates database (http://www.kld.com/research/socrates/index.html) was developed for commercial use to help investors determine the degree to which firms were socially responsible plus as tools for KLD’s own use in its screened mutual funds and indices. The KLD data set consists of scores for each firm on seven different “social” screens: (a) community, (b) corporate governance, (c) diversity, (d) employee relations, (e) environment, (f) human rights, and (g) product (KLD, 2007). In addition, the firm evaluates each company on a varying number of “controversial business issue” screens. Currently, these additional screens are alcohol, adult entertainment, gambling, firearms, military, nuclear power, and tobacco (KLD, 2007), whereas previously firms had been evaluated on investments in South Africa and Burma (Myanmar) among other things. However, using all 14 indicators is unwieldy so it was necessary to develop a more parsimonious approach. First, one sees that for the seven KLD “controversial business issue” screens scores only 1% to 5% of the firms had a nonzero score on these measures. Such a highly skewed distribution would bias any results obtained and there is no way to transform the data so that it would not. Because so few firms were evaluated in each of these areas, we eliminated these indicators (see Mattingly & Berman, 2006). After the deletions, the KLD data set contained the seven “social” indicators: community involvement, corporate governance, diversity, employee relations, environment, human rights, and products. Although this set is more parsimonious, it still represents a broad range of CSP issues that firms face. For each criterion, KLD identifies whether the firm has a “strength” or a “concern” in three to seven subareas. Each subarea then receives a score of 0 or 1. In past literature (e.g., Sharfman, 1996), authors subtracted each area’s average concern score from its average strength score. The potential problem with this approach is that one cannot assume strengths and weaknesses are equivalent. McGuire, Dow, and Argheyd (2003) found that empirical results based on CSP strengths and concerns have been significantly inconsistent, indicating that they are subject to different dynamics. Because combining the strength and concern scores in the KLD data is argued to be less valid (Mattingly & Berman, 2006), we calculated the KLD strength scores in each category separately to remove this concern. Consistent with past research (e.g., McGuire et al., 2003), we created an average strength score for each firm in each area by summing the scores for each subarea and dividing by the number of subareas.
Despite several advantages it offers in measuring CSP, the KLD database has some limitations. One primary criticism about using the KLD data set is its weighting scheme for the different dimensions of CSP (Graves & Waddock, 1994). The equal weighting is an arbitrary choice and treats all dimensions as equally important. Sharfman and Hart (2007) reviewed the concurrent validity of the version of the KLD data used in this study and it demonstrated sufficient convergence with a new continuous version of the data that have better reliability so as to satisfy validity concerns about the data set. Another concern for using the KLD data set is that it might mask unique industry effects and actual social performance when using multi-industry samples because certain dimensions in CSP are expected to be closely related to the specific stakeholder demands and context in each industry (Griffin & Mahon, 1997). To tackle this problem, we examined whether firms in different industries differed systematically in their levels of CSP without taking into consideration industry visibility, which we will explain in more details below. As Mattingly and Berman (2006) point out that the KLD data, although imperfect, can be useful for the accumulation of knowledge, we chose to use the dataset because of its comprehensiveness and objectivity over other CSP measures (Graves & Waddock, 1994).
The Fortune magazine data come from their annual survey of “America’s Most Admired Companies.” This survey examines the largest firms in 64 different industries on seven different dimensions. The survey, conducted by the Hay Group for Fortune gathers data from “a total of 15,000 respondents (executives, directors, and veteran securities analysts) around the world—10,000 in the U.S. and the rest in 21 other countries . . . (they) asked U.S. executives to rate the largest companies in their industry sectors in (seven) key categories” (Useem, 2005: 66).
However, the Fortune ratings have received a number of criticisms regarding their usefulness in CSP research (e.g., Carroll, 1991; Fryxell & Wang 1994; Wokutch & McKinney, 1991; Wokutch & Spencer, 1987; Wood, 1995), such as their correlation with firm profitability (i.e., a financial “halo” effect—Brown & Perry, 1994), the grand aggregation approach in measuring corporate reputation, and the focus on a particular stakeholder group (other executives in the same industry; e.g., Wood, 1995). Although some questions have been raised about the use of the Fortune data in CSP research, “this database holds substantial promise as a powerful instrument in reputation, and CSP research,” (Szwajkowski & Figlewicz, 1999: 387) particularly when used in conjunction with other measures. Using just the Social Responsibility score to triangulate with the KLD data would seem to limit those problems. Note that Szwajkowski and Figlewicz (1997) took issue with whether such a halo even existed given the evidence for the link between social and financial performance (e.g., Orlitzky et al., 2003) as well as effectively addressing the other concerns (e.g., demand characteristics, comparing reputation vs. CSP, etc.) about the use of the Fortune data set.
However, using this still large set of indicators begs the question as to whether there are latent CSP constructs. Because the KLD data can be useful in indicating specific aspects of CSP based on identified taxonomies (Mattingly & Berman, 2006), we performed an exploratory factor analysis (EFA) on the items in a manner consistent with Johnson and Greening (1999) or Waldman, Siegel, and Javidan (2006). We did not use the factor structure in either previous study because KLD changed the scoring process for evaluating firms in the interim between the data years that Johnson and Greening (1999) or Waldman et al. (2006) used and that which we use in this project. Using an oblimin rotation (which does not force orthogonality); we conducted an analysis on the strengths scores plus the Fortune Social Responsibility Reputation (FSRR) score. We used standard scores in this analysis because the FSRR score and the KLD averages are on different metrics. Our criteria for selecting a factor were that the eigenvalue was greater than 1.0, that the items on the factor loaded more than .50 and did not cross-load more than .50 with any other factor. Using these criteria in the strengths/FSRR analysis, we were able to extract three factors that accounted for 56% of the variance in the data set. Table 1 shows the factor structure matrix of our CSP scales. The first factor, which we dubbed Social CSP Strengths, contains KLD strength indicators in diversity, environment, community and the FSRR (α = .61). We selected this title because the indicators in the first dimension seem to clearly relate to a firm’s concern for social issues.
Rotated Factor Structure Matrix of the Corporate Social Performance (CSP) Items
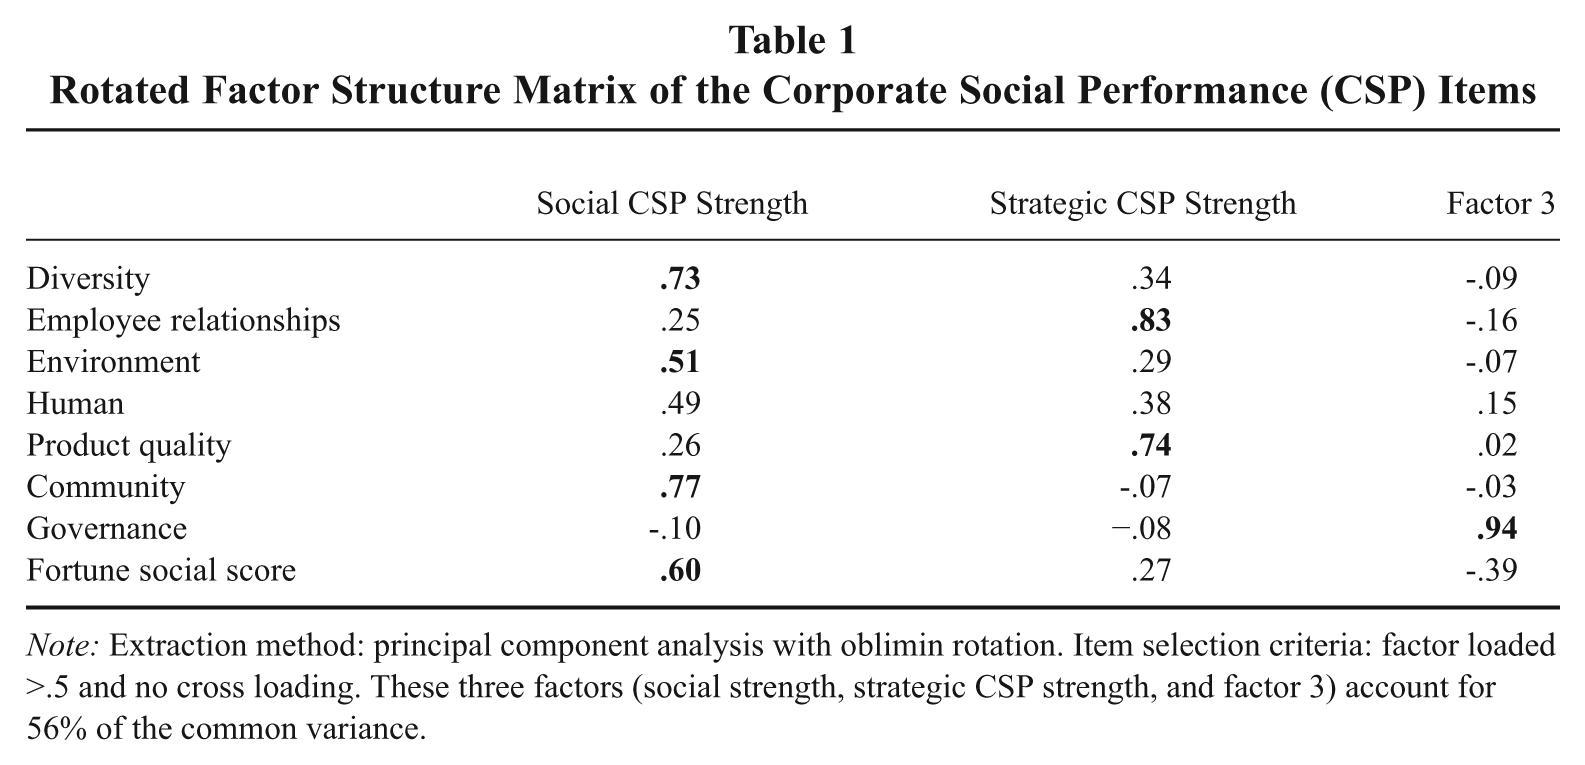
Note: Extraction method: principal component analysis with oblimin rotation. Item selection criteria: factor loaded >.5 and no cross loading. These three factors (social strength, strategic CSP strength, and factor 3) account for 56% of the common variance.
The second factor contains employee relations and product quality indicators, which appear to highlight a firm’s efforts in building competitive competence; thus, we name it “Strategic CSP Strengths (α = not applicable). Although it is mathematically possible to calculate an alpha for a two-item scale as we have in our Strategic CSP Strengths indicator, such results are prone to error. The correlation (r = .33, p < .001) between both items demonstrates a reasonable degree of reliability (convergence) because our research used a large, diverse set of CSP indicators that did not intend to measure the same general construct when they were created in the KLD Socrates database. Mitchell and Jolley (2007) suggest that a median interitem correlation of .30 usually indicates good internal consistency. We could drop the second CSP indicator that was derived from our EFA procedure because the first factor has twice more of explanatory power in the variance. However, this would substantially limit the overall contribution and generalizability of our results because using only the Social CSP indicator would be too narrow to subsume the variety of CSP dimensions. We dropped the third factor from the analysis because it was represented by a single indicator, corporate governance. Because Social CSP strengths and Strategic CSP strengths each capture different aspects of socially responsive activities by firms, we believe that it is necessary to test our hypotheses on both dimensions in order to understand the relationship between firm visibility pressure and subsequent firm CSP more effectively.
Please note that although it might have been preferable to complete a confirmatory factor analysis (CFA) on our CSP indicators, we did not have a sufficient sample size (Jackson, 2005) to generate a confirmatory structure in which we could have confidence. Jackson (2005) suggests that smaller sample sizes like we have in this study have the same deleterious effects in CFA on fit statistics and parameter estimates as one sees in structural equations modeling (see our discussion below). Therefore we determined that although exploratory factor analysis has its limitations, we can have more confidence in the results of an EFA than we would in a CFA.
Independent Variables
Industry visibility
To estimate industry visibility, we used three-digit Standard Industrial Classification (SIC) codes as the search terms in the FirstSearch® and Business & Company Resource Center news databases. Both databases provide comprehensive coverage on key events related to companies, industries, and markets. We averaged the total number of news reports for each SIC code from both news databases over the period 1999-2001. We ended with 1 year lagged from our dependent variable (i.e., CSP) to rule out a potential alternative explanation of the proposed causal relationships because of an endogeneity problem.
Visibility to stakeholders
It is tautological to suggest that firms face a wide array of stakeholders. To capture this range we used several disparate indicators to estimate the extent to which firm has visibility to this wide range of stakeholders specifically: (a) the number of firm employees over the period 1999-2001; (b) the number of CSP-oriented shareholder resolutions during the period 1999-2001 as reported by the Interfaith Center on Corporate Responsibility (because shareholder resolutions are the result of increased stakeholder awareness and also can stimulate media attention; O’Rourke, 2003); (c) the number of public affairs personnel per firm during 1999-2001 from the Directory of Corporate Public Affairs (because more public affairs personnel are both likely to increase the firm’s visibility to stakeholders as well as be a response to high levels of stakeholder attention; Marcus & Irion, 1987); (d) the number of common shareholders; (e) the number of shares held by institutional investors (both items d and e were gathered from S&P’s Research Insight Database); (f) the number of news mentions the firm received from 1999-2001 in the Lexis-Nexis plus the FirstSearch® and Business and Industry news databases. We ended with 1 year lagged data because visibility in period t might not be felt until later (t+1) when relevant stakeholders have had a chance to digest the visibility information. We then conducted an exploratory factor analysis with the same selection criteria as our CSP measures. The test extracted one single factor with all six variables included, which accounted for 49% of the total variance in the data set (α = .78). Such a high alpha indicates that our measure of the visibility to stakeholders construct has strong internal consistency and convergent validity.
Organizational slack as indicated by costs of capital
We used weighted average cost of capital (WACC) as our indicator of organizational slack. WACC is an appropriate conceptualization of slack resources because it represents a more comprehensive estimate of discretionary, company-wide resource availability than the more commonly used accounting-based approaches (e.g., Tan, 2003) that focus on narrow indicators of actual or potential discretionary resources (e.g., the debt/equity, quick or return on assets [ROA] ratios). More important, WACC is an important determinant of firm valuation because the lower the cost of capital, the lower the rate of return demanded by a firm’s investors for the capital they provide to the firm, which in turn makes it less costly for a firm to engage in CSP because it puts less pressure on the organization’s overall resource base. In the general case of a firm with both equity and debt financing, the firm’s after-tax weighted average cost of capital (rWACC) (Modigliani & Miller, 1958) can be expressed as

where E = market value of the firm’s equity, D = market value of the firm’s debt, rE = the firm’s cost of equity capital, rD = the firm’s cost of debt capital, and T = the firm’s rate of corporate taxation.
The firm’s cost of equity capital (rE) is equal to the expected investor return from holding the firm’s equity, from the capital asset pricing model (CAPM; Littner, 1965; Sharpe, 1964)

where rF = the risk-free rate, rM = the return on the market portfolio (risk premium), and
The cost of equity capital is found using the CAPM (Littner, 1965; Sharpe, 1964), which equates the cost of equity of a firm to the risk-free interest rate plus the firm’s beta times the market risk premium. The risk-free rate (rF) is the return an investor can earn on an essentially risk-free investment. Following convention for our risk-free rate, we used the 10-year U.S. Treasury Bond rate of 4.79% which was the rate at the beginning of this analysis. Beta (β) is the covariance of the market’s return with the individual company’s common stock return divided by the market’s variance. We used an annual beta computed by Research Insight for each company from the COMPUSTAT database. The weight of equity (rE) is found by using the total market capitalization, divided by debt plus market capitalization. Market capitalization is the product of the value of one share of stock times the number of shares outstanding. The weight of debt (rD) is found by summing all debt issues of the firm, divided by the total of that debt plus market capitalization. The tax rate data came from the Bloomberg Financial database. We set the return on the market portfolio (risk premium; rM) at 5.6% based on the Fama and French’s (2002) estimate of average returns over the period 1872-2000. We examined whether any effect of these slack resources was immediate or lagged. We determined that there was no lagged effect so we used current period (2002) data. It should be noted that a WACC estimate done with a firm specific risk premium from the Bloomberg database correlated with our estimate at .96, so we used the estimate based on the Fama and French (2002) average to be more consistent with previous finance literature.
Financial performance
We used market-based performance estimated by total returns (capital gains plus any dividends for the target year) from COMPUSTAT to examine whether economic performance moderates the relationship of visibility to multiple stakeholders and a firm’s CSP. Unlike accounting-based performance, which generally highlights the internal efficiency of a firm (e.g., Cochran & Wood, 1984), market-based returns capture the external responses to organizational actions, thus mainly reflect the shareholder satisfaction on firm’s past, current, or future stock returns and risk (Cochran & Wood, 1984). Because this research focuses on how visibility pressure from the institutional environment influences managerial decisions regarding CSP efforts, a market-based finance measure (e.g., total returns) seems more appropriate. Because single years of firm financial data might be sensitive to changes in the external environment or noneconomic factors (e.g., terrorist threats), we averaged the three year (1999-2001) total returns of each firm to increase the stability of this financial measure.
Also, in this study, we employed a number of variables to isolate their unique contributions in the proposed relationships. First, we controlled for size because it might influence managers’ perceptions of visibility pressure from the society. Because there is little agreement as to the best measure for firm size (Kimberly, 1976), we combined three indicators (i.e., total assets, total sales, and total equity) to capture both financial- and market-based size measures. These data were extracted from COMPUSTAT over the period 1999-2001 as the lagged data again proved necessary. All three indicators for the firm size were log transformed to obtain a more normal distribution. We then conducted a factor analysis using the same factor selection criteria as we mentioned above. The test extracted one factor that accounted for 89% of the variance in the dataset (α = .93). We also controlled ROA to avoid the potential measurement bias that has been criticized as accounting for the mixed results on the relationships between CSP and firm profitability (Orlitzky et al., 2003; Wu, 2006).
Because data come from S&P 500 firms, which are normally more visible than other firms, we examined whether there was sufficient amount of variance in our sample. Specifically, we reviewed the standard deviation (SD), the range, and the kurtosis scores of the variables in our model (see Table 2). For example, organizational slack (measured by WACC) has an SD of 0.03, a range from 0.02 to 0.19, and a kurtosis score of .17. The industry visibility variable (measured by news coverage) has an SD of 6,788, a range from 0 to 32,106, and a kurtosis score of 0.519. In general, a kurtosis score that is within the range of ±2.00 indicates a broad and near enough to a normal distribution (Field, 2005) to not introduce error into analyses. Although there is no formula for determining what defines sufficient variance, the results suggest that our data items have broad distributions, which should help reduce the concern for potential range restriction problems.
Descriptive Statistics and Correlation Analysis
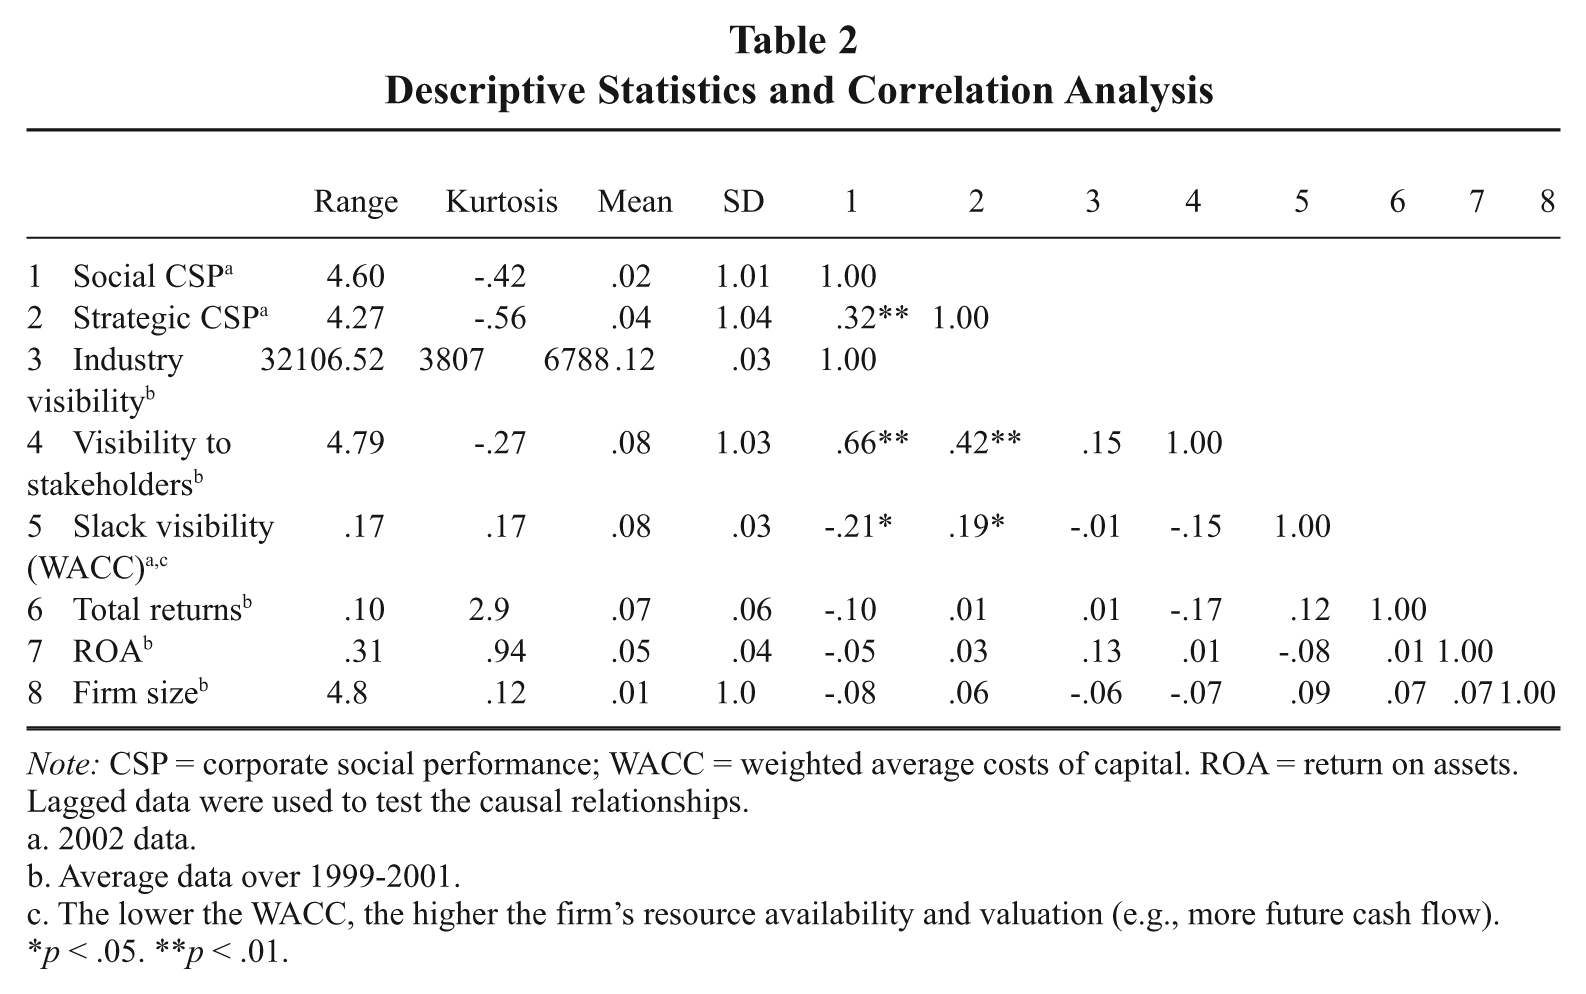
Note: CSP = corporate social performance; WACC = weighted average costs of capital. ROA = return on assets. Lagged data were used to test the causal relationships.
2002 data.
Average data over 1999-2001.
The lower the WACC, the higher the firm’s resource availability and valuation (e.g., more future cash flow).
p < .05. **p < .01.
Additionally, we examined whether there was a need to control for industry membership in our research. Any industry membership effect is not the same as industry-level visibility, which we examine as one of the main predictors for CSP in our analysis. The investigation of the industry membership effect on CSP can shed light on whether firms in different industries differ systematically in their levels of CSP without taking into consideration industry visibility. If there is difference in CSP by industry membership, then the inclusion of such an effect is necessary. A common way to control any industry effect is using dummy variables for SIC codes; however, this approach is not practical in this research because there are 38 industries based on two-digit SIC codes in our dataset. Although scholars (e.g., Amburgey & Miner, 1992) have suggested a variety of methods to deal with a large number of industry codes, we are concerned that any alterations from the original SIC distribution might open the door to alternative explanations of any results. As such, we performed the Kruskal–Wallis analysis of variance test, a robust method that allows for comparisons within nonparametric data, using two-digit SIC codes as the grouping variable and firm CSP as the test variable. The result of this analysis was not significant; indicating that there is no effect of industry membership on CSP in our data set and that there was no need to control for it.
We used hierarchical regression analysis to test the hypotheses in this study because this method allows us to examine whether and how much each additional theoretical predictor influences our ability to explain a firm’s CSP. Some might argue that structural equations modeling (SEM) might have provided a more rigorous test of the models. However, using SEM was not appropriate in this research for two reasons. First, our sample size was too small to allow for robust estimations of either a measurement or a structural model. Previous work suggests that sample sizes such as ours are often subject to false positives and poor fit (Bentler & Chou, 1987). Second, we were interested in the marginal contribution of interaction terms over any variance explained by the main effects, so hierarchical regression was more appropriate as SEM will not handle moderators effectively (Bentler & Chou, 1987). To test Hypotheses 1 to 4, we created three models for both CSP strength dimensions (i.e., Social CSP Strengths and Strategic CSP Strengths). The first was a control model in which we only included ROA, size, and return on assets. The second model examined the main effects (i.e., visibility to stakeholders, slack visibility, and industry visibility) for our study. The third model tested the moderator effect of firm total returns on the relationship between firm visibility to stakeholders and subsequent CSP.
Results
Table 2 provides the means, SDs, kurtosis scores, range, and correlations among the variables. The negative correlation between our slack indicator (WACC) and Social CSP suggests a positive relationship between visibility from organizational slack and Social CSP strength because a lower WACC implies more slack resources. This infers that more slack is associated with better performance in the social dimension (i.e., environment, community, and diversity). However, we also infer a negative relationship between visibility from organizational slack and Strategic CSP strength (i.e., employee relations and product quality) because the correlation between our slack indicator (WACC) and Strategic CSP is positive, implying that Strategic CSP is associated with higher WACC (fewer slack resources). These results suggest that the role of slack resources may vary depending on the CSP dimension, which we investigate in more detail with hierarchical regressions.
Table 3 presents the hierarchical regression results for Hypotheses 1 to 4 using both Social CSP and Strategic CSP strengths. As Table 3 shows, industry visibility is not significantly related to either CSP dimension, thus Hypothesis 1 is not supported. Hypothesis 2 proposed that the higher the firm’s visibility to stakeholders, the higher the level of CSP. The coefficients for this variable in Model 3 (full model) on both dimensions are positive and significant (p < .01), supporting Hypothesis 2. With respect to Hypothesis 3, our results reveal a negative and marginally significant (p < .10) moderator effect of economic performance on the relationship between a firm’s visibility to stakeholders and Social CSP and no impact on Strategic CSP, indicating that the effect of a firm’s visibility to stakeholders on CSP is not strongly influenced by its profit performance. Hypothesis 4 proposed that more visibility from organizational slack results in higher levels of CSP. The prediction for this hypothesis is that the coefficient would be negative because a lower WACC means fewer claims on the firm’s resources and hence more slack resources. The coefficient is significant (p < .01) and negative for Social CSP, but it is positive (p < .01) for Strategic CSP, providing mixed results for Hypothesis 4. The R2 for the main effects is .47 on Social CSP and .25 on Strategic CSP. The change in the amount of explained variance associated with the addition of the “main effects” to Model 1 is statistically significant for both the Social and Strategic CSP equations, demonstrating strong explanatory power for our models.
Hierarchical Regression Analysis for Firm Visibility and CSP: Hypotheses 1-4
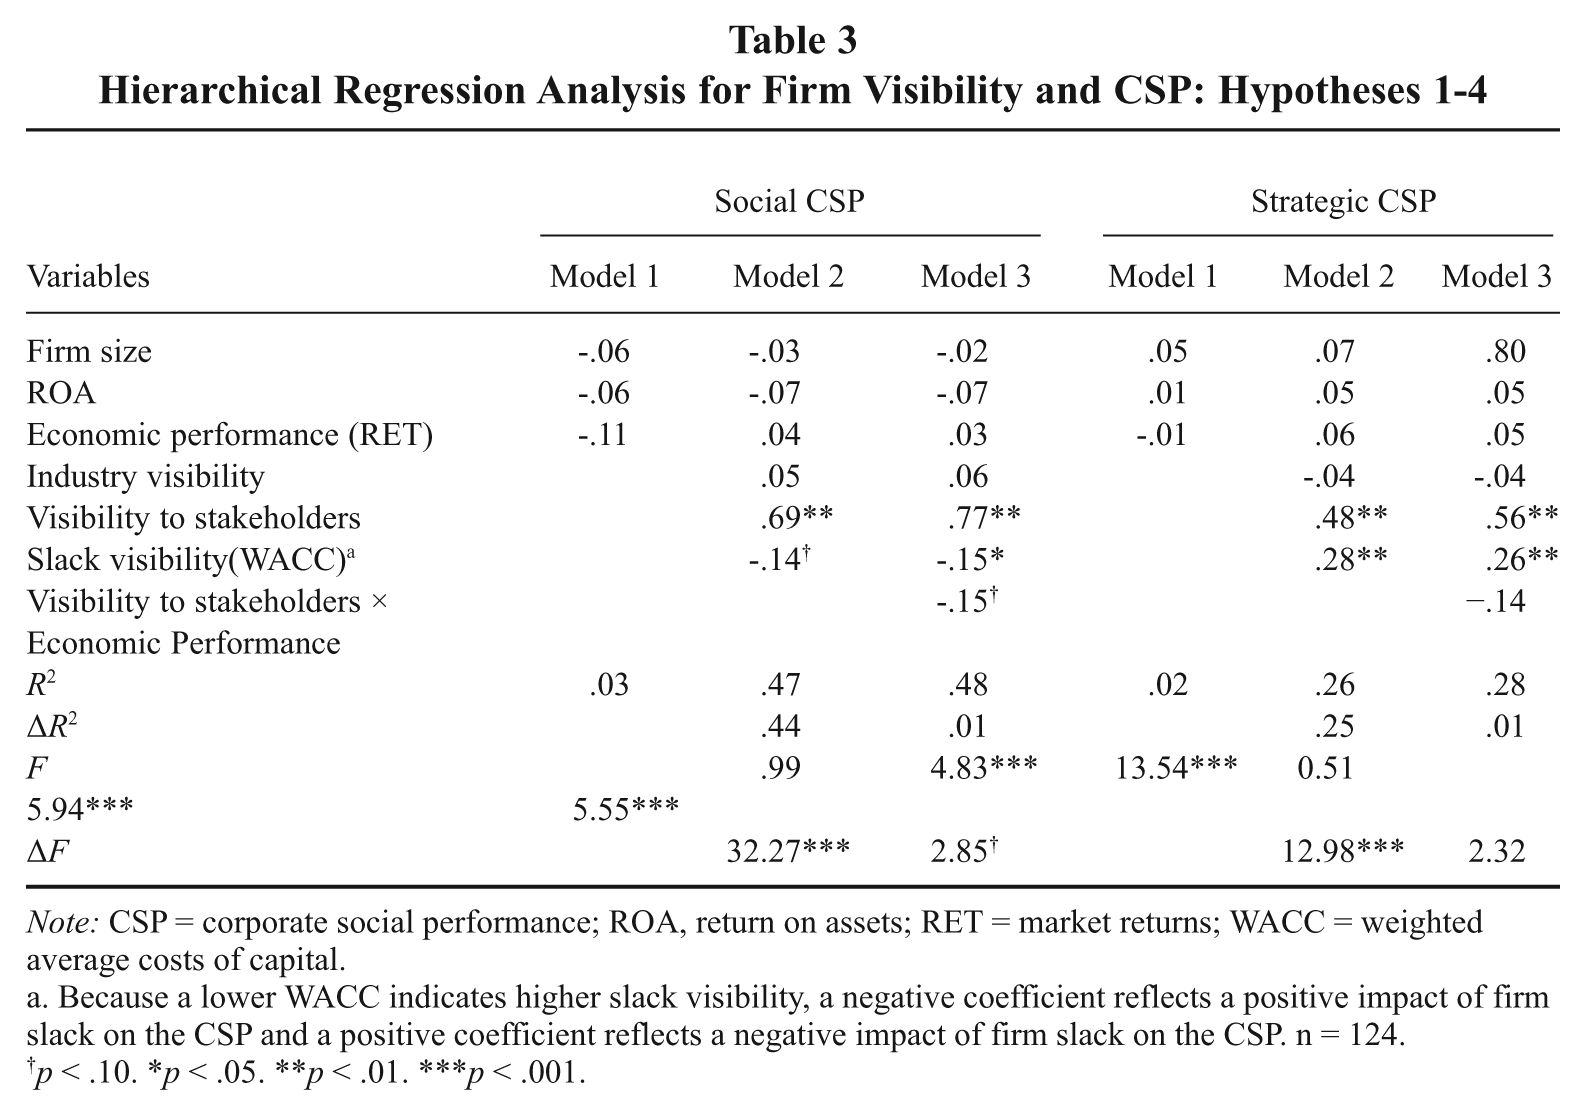
Note: CSP = corporate social performance; ROA, return on assets; RET = market returns; WACC = weighted average costs of capital.
Because a lower WACC indicates higher slack visibility, a negative coefficient reflects a positive impact of firm slack on the CSP and a positive coefficient reflects a negative impact of firm slack on the CSP. n = 124.
p < .10. *p < .05. **p < .01. ***p < .001.
Discussion
In this research, we intend to clarify complex relationships between stakeholders’ pressures, financial performance, and their effects on CSP. Although our model does not preclude ethically motivated CSP, the results from our study strongly suggest that CSP can be conceptualized as (at least in part) an instrumental response by managers to legitimacy pressure on the firm based on its visibility. Society and its dominant institutions exert coercive, normative, and mimetic (DiMaggio & Powell, 1983) legitimacy pressures on firms in response to which some firms increase CSP. Such pressures vary in part as a function of how much visibility the firm engenders. As we predicted, a positive and significant relationship between visibility to stakeholders and the level of CSP emerges from our analyses, indicating that managers become more actively involved in socially responsive projects when they are under greater scrutiny by the various stakeholders in the institutional environment.
The interaction of economic performance and visibility to stakeholders is negative and marginally significant on the Social CSP dimension and has no effect on the Strategic CSP dimension. We examined the relationships using a three-way interaction plot based on the Social CSP for further insights. Figure 2 demonstrates that regardless of the level of profitability, organizations generally have lower CSP when they are less visible to stakeholders and higher CSP as their visibility to stakeholders increases. In these data, we find more consistent effects from visibility to multiple stakeholders than we do for a firm’s financial performance in the CSP decisions managers make. Although profits provide firms with more flexibility in how they allocate resources for CSP (which we see in the slack results), firms with stronger economic performance (as measured by market returns) may not necessarily exhibit higher CSP than less profitable firms. Because economic performance is such a broad construct and can be measured in a variety of ways, we conducted a post hoc analysis using an accounting-based indicator, ROA, to examine whether it had a different moderating effect in the relationship. The results of this additional analysis are consistent with those for the market return measure. Overall, this finding is important because it unveils linkages between visibility, profitability, and CSP, and provides further insights into the mixed results of previous research on profitability and CSP (Margolis & Walsh, 2001; Orlitzky et al., 2003; Wu, 2006).
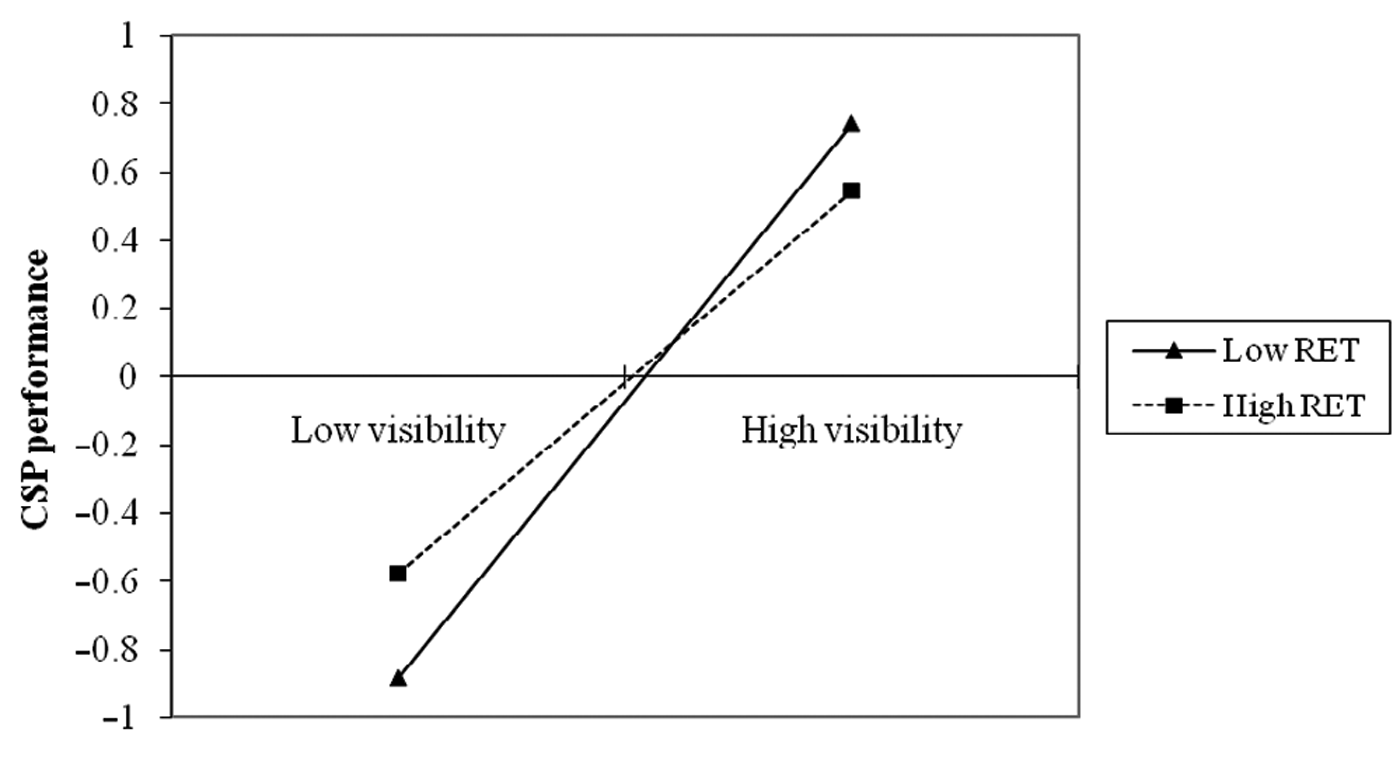
Interaction of Economic Performance (RET) and Visibility to Stakeholders on Corporate Social Performance (CSP)
We found that although the presence of slack resources has a significant effect on a firm’s CSP, such impact is not uniform across CSP dimensions. Our results show that more slack leads not only to stronger CSP in areas such as community, environment, and diversity programs but also lowers strategically related CSP (i.e., employee relations and product quality). This finding suggests that managerial decisions in the choice of CSP may be more strongly influenced by external factors such as social demands from the community or stakeholder groups, rather than by the internal characteristics. An alternative explanation could be that while it is difficult to allocate resources for high levels of CSP in all dimensions, managers might convert some of the resources from other social programs to those they perceive to be more critical in meeting the demands of institutional actors.
Despite the general agreement between the results and the theory, notable differences do exist. We found that industry visibility has no direct impact on a firm’s CSP. We wondered if the influence of industry visibility on CSP was more indirect. As such, we conducted extra tests to examine further any mediation effect by visibility to stakeholders and found that the effect of industry visibility on CSP is indeed mediated (indirect) through visibility to stakeholders. In other words, industry visibility leads to higher visibility to stakeholders, which in turns leads to higher levels of CSP. These findings even more strongly suggest that visibility to stakeholders is a key driver behind managerial CSP decisions.
If as we argue, visibility generates pressure from institutional and other stakeholders, then we can conceptualize an instrumental response to these demands using CSP as an Oliver (1991) response to an institutional process. Our argument would suggest that CSP is, in general, an acquiescence or compromise-type response where the firm sees the institutional pressures and uses CSP to address them. Using Oliver’s (1991) terms, such firm reactions would range from bargaining with stakeholders to outright compliance. However, depending on the strategy the firm employs through its CSP decisions; such actions could be an avoidance response (e.g., using one type of CSP to conceal or escape notice for another type of poor social performance), a defiance response (addressing the preferences of one stakeholder by not doing what another stakeholder wishes done) or a manipulation response where firms attempt (e.g., via “greenwashing,” i.e., appearing environmentally responsive when actually not) to co-opt or even deceive key stakeholders. By confirming that at least in part CSP is an instrumental response to firm visibility and the attendant institutional pressures, we increase our ability to make finer-grained examinations of the motives managers have in making CSP investments and are better able to use the Oliver (1991) typology as a guide for investigating these motives in the future.
Limitations
There are some elements of this study that could be perceived as limiting its robustness or generalizability. The first concern is the measurement of CSP. Although we were able to develop a psychometrically defensible Social CSP measure combining the KLD and Fortune scores that demonstrated convergent validity as well as a second Strategic CSP scale, these measures could be criticized as still being too narrow to subsume the variety of CSP dimensions. A second potential limitation of the study is the sample size. Although 124 firms provide sufficient statistical power to examine our hypotheses, we were constrained by the fact that the KLD and Fortune datasets cover very different firm sets. However, this sample provides broad coverage across industries to allow generalizability.
One might also be concerned about the internal consistency of the CSP measures. Although the alpha statistics for the Social CSP score exceed the Nunnally (1967) threshold of .6 for new scales, they are somewhat below current convention for this statistic. In addition, the Strategic CSP scale has low but acceptable convergence but a meaningful alpha cannot be calculated. We conducted a post hoc analysis on the two items (i.e., product quality and employee relations) in the Strategic CSP scale using them individually in separate regressions and found that the results based on the individual indicators are highly consistent with those from the combined factor. This test suggests that the effects of the predictors are not different when used as single items; thus, using a combined factor derived from the EFA procedure allows us to produce a more parsimonious model as well as to triangulate on a measure of Strategic CSP. In addition, recent research suggests that the low alpha scores in this research may stem from the structure of the version of the KLD data that we used. The reader may recall that we use the version of the data where firms are given a “1” or a “0” on the subdimensions of the seven “social” indicators. These items are then summed and averaged to create a score for each indicator set. This binary approach to scoring creates some range restriction in the interitem variance in each scale potentially lowering the amount of interitem correlation needed to generate higher alpha statistics. Sharfman and Hart (2007) found that factor scores using the new continuous version of the KLD data had much higher alphas (in the .79 to .81 range) overall in part because of the lack of interitem range restriction. The continuous scores in their analysis correlate with their binary equivalents at an average of r = .74. Although these other results do not abrogate completely the concern about the internal consistency of our scales, we can have more confidence in our measures that one might think because of the binary KLD data’s convergence with the more psychometrically powerful continuous version of the data.
Another limitation is that our model does not include noninstrumental predictors (e.g., ethical or morally driven motives) of CSP (e.g., Aguilera et al., 2007; Rupp et al., 2006). Although our study strongly suggests that CSP can be conceptualized, at least in part, as an instrumental response by managers, the question remains how managers’ personal values might interact with the firm’s instrumental demands (e.g., legitimacy pressure based on the firm’s visibility) to affect their decisions on CSP. As such, research is needed to examine both instrumental and non-instrumental motives simultaneously to explore how different types of motives interact with each other to influence subsequent CSP.
Finally, although we used lagged data (1-3 years) to rule out alternative explanations of the proposed relationships and minimize the endogeneity problem, the use of such variables might not completely remove the possibility of reverse causation because factors such as visibility from organizational slack and CSP may not change dramatically enough within a short period of time to abrogate the concern. However, while such a concern can not be ruled out completely, the low to nonsignificant correlations among the independent variables limits the likelihood of such reverse causation. Please note that it is likely impossible to come up with a set of objective and commonly agreed on time lags to examine the causal relationships in the CSP research because isolating the potential confounding factors becomes more challenging as the time lag increases between variables.
Future Research
The results of this study provide guidance for future research. Although we found that firms face legitimacy pressures and subsequent institutional/societal demands for CSP as a function of their visibility in society, the reverse relationship in which stronger CSP leads to higher visibility might also be true. Future research could also examine whether different CSP dimensions vary in their impact on the visibility to stakeholders. For example, it is very likely that some socially responsive activities might raise higher media interests than others, which in turn might draw more attention from stakeholders to those areas. Additionally, while our research highlights the role of “visibility” to stakeholders in CSP, it is also apparent that stakeholders are not uniform in their view of how firms should add value to the society. More research is needed to investigate the intricacies of the relationships between stakeholder goals and the firm’s CSP. Johnson and Greening (1999) found that the presence of equity investments from pension funds, but not from mutual funds, was positively related to a firm’s CSP, indicating that institutional owners could differ in their attitude toward a firm’s CSP. Also, stakeholders’ relationships to management might be critical because individuals or groups that have relational ties to firm executives might be more or less effective in monitoring a firm’s social performance. Furthermore, because our results are based on large, S&P 500 firms, future research also could examine whether these results can be generalized to smaller publicly traded or private firms.
Implications for Managers
Given that the motives behind managers’ CSP decisions have a great impact on a firm’s corporate citizenship behaviors, our results are important for practicing managers. Managers of growth stage firms can benefit from this study by better understanding stakeholder expectations for CSP as their organizations become more visible to the society. Instead of passively reacting to these institutional pressures, managers can plan ahead to design the most effective and efficient strategies to address those concerns proactively before societal demands for even more socially responsible actions emerge. However, while accommodating institutional expectations and building positive moral capital with a large number of stakeholder groups seems critical for any firm’s survival, managers must find ways to allocate resources efficiently while prioritizing their choice of social actions. Our results suggest managers can use their CSP choices as a strategic resource that allows firms to address stakeholder demands while making the most effective use of CSP as a strategic resource.
Conclusion
This research contributes to the existing literature by systematically examining the role of organizational visibility from a variety of sources (i.e., industry visibility, visibility to multiple stakeholders, and slack visibility) in influencing CSP. Our conceptual framework offers important insights regarding the instrumental motives of managers in performing CSP initiatives. The results of this study provide strong evidence that when firms are more visible and visible in more ways, they engender higher levels of legitimacy pressures that they increasingly often answer by engaging in more socially responsive actions. Although we do not wish to preclude values or morality-driven motives (e.g., Rupp et al., in press), our results suggest that managers do integrate institutional logics in their choices about CSP, indicating that motivations in addition to ethical ones may be at play in the decisions firms make regarding CSP. As our knowledge of why managers make the CSP choices develops, we are better able to understand the consequences of these actions.
Footnotes
Acknowledgements
Both authors contributed equally to this article. We presented portions of this article at the 2007 Academy of Management Annual Meeting. The authors wish to thank Kinder, Lydenberg, and Domini for their assistance and especially for the access to the KLD ratings data, and Fortune magazine for access to the America’s Most Admired Companies Survey data, as well as Parthiban David, Marc Orlitzky, Teresa Shaft, Richard Johnson, Deborah Rupp, and several reviewers from the Academy of Management Annual Meeting plus from this journal. The authors disclosed receipt of the following financial support for the research and/or authorship of this article: National Science Foundation (grant IOC 423352), Small Grants Fund of the University of Oklahoma’s Vice President for Research, Price College of Business Research Associates Grants Program.