
Abstract
This study investigates the effects of group member nonresponse in research that examines relationships between group-level constructs aggregated from the responses of individual group members. Simulation data show that the effects of nonresponse vary greatly depending on levels of between-group variability and within-group variability expressed jointly as intraclass correlation, or ICC(1), values. Even high response rates, for example, can produce significantly attenuated correlations between group-level variables with ICC(1) levels commonly reported in group studies. Conversely, even low response rates can yield accurate group-level correlations when ICC(1) levels are high. These effects of nonresponse are equivalent whether nonresponse derives from a random or biased process. Group size appears to play no important role in moderating the effects of response rate. Suggestions for research design and post hoc diagnosis of findings are discussed.
Organizational researchers remain highly interested in the relationships among group-level constructs (House, Rousseau, & Thomas-Hunt, 1995; Klein & Koslowski, 2000). How group size affects decision making, how team knowledge affects team problem solving, and how group cohesion affects group performance are all questions that concern group-level constructs. Sometimes such constructs are operationalized directly at the group level. For example, workgroup effectiveness might be assessed with an objective group-level measure, such as number of products produced or net profit, or by a subjective appraisal supplied by someone in the organizational hierarchy. In either of these cases, the theoretical construct and the measurement operationalization reside at the group level. Frequently, however, group-level constructs are created by aggregating the responses of individual group members. In such cases, the researcher derives a measure of a group-level construct by combining the responses of individuals in the group. Examples of such constructs would be group climate (Glick, 1985), group affect (George, 1990), and group undermining (Duffy, Ganster, Shaw, Johnson, & Pagon, 2006).
Chan (1998) described several different composition models for aggregating individual responses, including those that simply involve the summation of individual scores while making no assumptions about within-group agreement (additive models) and those that assume some level of agreement among individual responses within groups (consensus models). Aggregations of individual scores to represent a group-level construct reflect either the level of a construct (most commonly mean or sum of individual responses) or the dispersion of a construct within a group. The latter are represented by a variety of models such as standard deviation and rwg. But in either case, whenever researchers use the aggregated responses of individual group members to represent a property of the group, they must rely on obtaining an adequate sample of the group’s members in order for their aggregated measure to faithfully represent the group. Generally, 100% response rates from members within groups would perfectly represent the groups (but see exceptions, e.g., George, 1990; Timmerman, 2005). In reality, however, 100% response rates are not often obtainable. In fact, response rates in organizational studies appear to average between 55% and 57% (Baruch, 1999; Roth & BeVier, 1998). Although one might expect low response rates to produce more sampling error and thus attenuate correlations among group constructs, the impact that response rates have on the estimation of such correlations is not well understood. We do not know, for example, how severe such attenuation might be, nor do we understand the interplay between response rates and other study design factors such as group size, within-group variance, and between-group variance. Our objective in this article, then, is to explore the impact of differing response rates on the correlations among group-level measures based on a mean aggregation of group member responses. In so doing, we hope to provide some practical guidelines for researchers who rely on the aggregation of group member responses.
Although the scores of group members can be aggregated to represent either the level of a construct or its dispersion within the group, the great majority of group-level studies focus on the level and most often employ the mean of member responses. In examining the group studies that have appeared in the Journal of Management, the Academy of Management Journal, and the Journal of Applied Psychology over the past decade, we found that about 84% of the 213 studies that used some method of aggregating individual scores to the group level used the mean score to represent the group construct. The few studies that examine dispersion models often are concerned with such constructs as workgroup diversity and its relationship to group outcomes (e.g., Jehn & Bezrukova, 2004; Kearney, Gebert, & Voelpel, 2009). Given the predominant focus on the sum or mean to represent group construct levels, we focus our attention on the group mean as the method of aggregation. A recent study by Cole, Bedeian, Hirschfeld, and Vogel (2011), moreover, suggests another reason for us to focus on group means. Cole et al. (2011) demonstrate that even when investigators are primarily concerned with dispersion–composition models of groups, it is necessary to control for group level (e.g., mean) effects in order to appropriately estimate the effects of dispersion measures because the mean and dispersion of a construct within groups are often highly confounded. They also illustrate the importance of examining the interaction between the group mean and dispersion when studying group-level phenomena. In each of these cases, to the extent that missing data biases the relationship of aggregated group means to group-level outcomes, results of group dispersion analyses are also affected.
Our article proceeds as follows. First we discuss the general effects that response rates might have on correlations among group-level aggregated measures. We discuss these effects under conditions of random as well as nonrandom response patterns. We also explore other factors such as group size, within-group variability, between-group variability, and correlation effect size for their direct impact on group-level correlations as well as their moderating effects with response rate. We then report an examination of these effects in a simulation study.
The Effects of Response Rates
Nonresponse from group members can be either a completely random process or a nonrandom process. Random responding ensures that responders and nonresponders do not differ in their scores on the measured construct or on any other constructs relevant to the research question. Such random responding might occur, for example, because some potential respondents were absent for survey administrations or were unable to attend survey sessions or simply because they were too busy. Perhaps more likely, however, is the case in which nonresponse is not random. Individuals who participate in research studies in organizational settings tend to differ from those who choose not to. Rogelberg, Luong, Sederburg, and Cristol (2000), for example, found that individuals who do not respond to organizational surveys are less likely to be satisfied in their jobs, have lower organizational commitment, and have greater turnover intentions—constructs that might even represent the very ones that the researcher is attempting to measure. Nonresponders have also been found to differ on personality traits such as agreeableness (Dollinger & Leong, 1993).
From a simple sampling perspective, greater response rates should produce more representative aggregated group measures. Researchers typically aggregate individual responses by calculating a group mean from the responses obtained from group members. For large populations, one can estimate the standard error of a mean from a sample as a function of the sample size itself and the variability of responses within the sample. Of course, this rests on the assumption that the sample is random. With random sampling (or with a random nonresponse process), then, low response rates would still produce unbiased group scores (means), but they would have large standard errors. Such large standard errors should attenuate the correlations between group-level measures. In the case of nonrandom samples (nonrandom nonresponse), low response rates should produce larger standard errors as well as biased means. The effects of such biased group means on group-level correlations are more difficult to predict, but systematic nonresponse patterns could produce enough restriction in range for the aggregated group variables so that they also produce attenuation effects. The greater error produced by low response rates should produce attenuation of group-level correlations, on average, but it should also produce greater variability in the observed correlations themselves. Thus, even though the average correlation might be smaller than that obtained from the responses of all group members, some correlations might also be considerably overestimated. Distortions from missing group members, then, can produce correlations that deviate in significant ways in either direction from the true correlation.
Despite the plausibility that missing data from group members might be causing serious distortions in the estimation of relationships between group variables, surprisingly little attention has been directed at the general issue of missing data in group research. Timmerman (2005) examined the effects of different random and systematic nonresponse rates on the correlations between aggregated group variables (means) with samples of professional baseball and basketball teams. Using the full population data for these teams, he calculated the relationships between aggregated team variables (e.g., team experience, team cooperation) and team performance. He then drew random samples representing different levels of nonresponse to see how they affected the observed relationships. As predicted, as response rate dropped correlations between group variables became attenuated. In the case of cooperation, for example, standardized regression coefficients declined from the true value (100% response) of 0.58 to 0.10 with a 10% response rate. The coefficient became statistically nonsignificant when the response rate dropped below 60%. The adjusted R2 dropped from 0.19 to 0.02. When he produced biased samples by systematically eliminating the least cooperative team members, relationships also became attenuated owing to a restriction of range in the team aggregated variable. Thus, Timmerman demonstrated empirically that both random and nonrandom nonresponses can cause reductions in observed correlations (and regression coefficients). Based on Timmerman’s results, one might argue that response rates below about 60% are likely to produce high rates of Type II error, whether nonresponse is random or not. As he noted, this figure seems to correspond closely to response rates typically reported by organizational researchers. Moreover, even at response rates well above 60%, there were pronounced drops in observed correlations. The R2 for team cooperation dropped from 0.19 at a 100% response rate to 0.10 at an 80% response rate. This represents a 50% reduction in effect size even at an 80% response rate.
Although Timmerman’s (2005) is the only study that examined nonresponse effects among group-level correlations involving aggregations using the mean of group member data, Newman and Sin (2009) demonstrated that missing cases also bias estimates of within-group agreement. That such biased estimates of agreement can affect correlations among group-level variables was demonstrated in a simulation study by Allen, Stanley, Williams, and Ross (2007b), who examined the effects of nonresponse on the relationship between group diversity measures and group-level outcomes. Allen et al. (2007b) showed that missing group member responses, even at response rates as high as 80%, produced biased observed correlations (usually attenuated) that also had relatively large confidence intervals. Large true correlations (those representing 100% response rates) were affected more than small correlations by missing cases.
Allen, Stanley, Williams, and Ross (2007a) also simulated the effects of nonresponse on individual-level correlations between dissimilarity scores and outcomes. Although this simulation did not focus directly on group-level aggregated variables, the dissimilarity scores of individuals were calculated using the attribute scores of other group members and thus represent a type of aggregated effect of these group member scores. These findings thus add further credibility to the notion that missing cases in group research can significantly bias results.
Potential Moderators of Response Rate Effects
Timmerman’s (2005) and Allen et al.’s (2007a, 2007b) studies alert us to the significant distortion of group-level findings that can be produced by sampling fewer than all the group members. Moreover, these effects seem significant at response rates that are better than those typically reported in the group literature. Both prior studies, however, examined just the main effects of group response rates on correlations involving aggregated group variables (means or diversity scores), although Allen et al. (2007a) also varied effect size. It seems likely, however, that there are other factors that could interact with response rate to affect group-level correlations. In this section, we discuss five factors that might condition the effects of response rate.
Group Size
Group size is one factor that can affect observed correlations among aggregated group constructs. In organizational research, group sizes rarely consist of large numbers and typically range between 4 and 50. If one obtains a 100% response rate, then group size should have no impact on group-level correlations because one has completely represented the group and there is no sampling error. Of course, group size might act as a moderator of true relationships between group constructs, but these would be structural effects and not methodological artifacts arising from nonresponse. There has been some discussion of group size effects on the magnitude of group-level correlations, but this discussion is not directly relevant to our concern. Bliese (1998), for example, demonstrated that group size does affect the magnitude of group-level correlations, but his concern was with comparing correlations of group-aggregated variables to the raw correlations between the individual-level variables. Our focus is only on those aggregated variables that represent a theoretical group-level construct. Our concern, then, is not with comparing the magnitude of correlations between aggregated variables and individual-level correlations. For our focus, we assume a constant “true” correlation between group variables, irrespective of group size.
It is plausible, however, that group size could interact with response rate. For very large groups—say with more than 50 members—and with a random nonresponse pattern, a 50% response rate might well yield a group mean that is very representative of all group members. But for small groups—say those of 4 to 10—this same 50% response might be much less representative because the marginal impact of nonresponders on the group mean is comparatively greater. We would expect the impact of low response rates, then, to be greater when group size is small. Group sizes in Timmerman’s (2005) study ranged from 12 to 27 for the professional basketball teams and from 17 to 59 for the baseball teams. Timmerman, however, did not explore team size as a potential moderator of response rate effects, nor did Allen et al. (2007b). In our study, we systematically vary group size in order to assess its role, in conjunction with response rate, in affecting group correlations.
Within-Group and Between-Group Variability
Within-group variability is another factor that, by itself, should have no (artifactual) effect on group correlations under complete representation. But as with group size, we expect within-group variability to interact with response rates to affect correlations between aggregated group variables. If all group members have virtually the same scores on a measure (i.e., low variability) then even a low response rate will produce a representative group mean because different group members are basically substitutable. But under conditions of high within-group variability, different small samples can yield very different group means. Newman and Sin (2009) assessed the effects of missing data on the estimation of within-group agreement estimates and found that missing data can bias such estimates. They also provide correction formulas for estimating this bias. Their investigation did not extend to examining the effects of within-group variability and missing data on correlations between aggregate variables, however. Similarly, when there is little between-group variance the impact of large within-group variance would be magnified. The intraclass correlation (ICC[1]) reflects both within-group and between-group variance (ICC [1] = between-group variance/[between-group variance + within-group variance]) and is commonly reported by researchers in the group literature. ICC(1) values will be larger under conditions of small within-group variance and large between-group variance. Thus, we expect response rate to interact with ICC(1) and its effect on group-level correlations to become more pronounced at smaller values of ICC(1).
Effect Size
By effect size we mean the true correlations between group means under conditions of 100% sampling. In general, we expect the potential for attenuation (or other distortions under conditions of nonrandom nonresponse) to be greater when effect sizes are larger. We expect this for the simple reason that proportional distortions (e.g., a 30% attenuation effect) translate to larger impacts when effect sizes are large, at least under conditions of random nonresponse where we expect attenuation effects. Under both random and nonrandom nonresponse conditions, of course, the potential for artifactual inflation of group-level correlations is also possible when effect sizes are small (Allen et al., 2007b).
Response Pattern
The impact of the pattern of nonresponse is more difficult to predict. On the one hand, researchers often attempt to determine if nonresponse is random, assuming that such a random pattern would be less likely to bias findings. In this context, however, a completely random nonresponse pattern might not be the most desirable. In our study we manipulate two different response patterns, including a completely random pattern and a biased sampling pattern that favors high-end responders.
To summarize our expectations, we expect the effect of nonresponse to be the most severe when group size is small and ICC(1) is low. Finally, we expect distortion effects to be greatest when effect sizes are large. Studies such as those of Timmerman (2005) and Allen et al. (2007b) suggest that missing group members can lead to very serious distortions in the estimation of group-level relationships. We examine these effects under different nonresponse patterns by experimentally manipulating response rate, response pattern, group size, ICC(1), and effect size in a simulation study of group-level relationships.
Method
We conducted a Monte Carlo simulation to investigate the effects of the factors of response rate, response pattern, group size, ICC(1), true-score correlation and effect size (i.e., the score obtained given the 100% response rate). Simulation studies are a useful method to test the effects of research factors such as nonresponse because they are able to generate many replications of analyses on data sets of known characteristics. With empirical data collected in actual organizations it is not possible to manipulate the various factors under study and assess their main and interactive effects in a complete fashion. Any given empirical sample contains idiosyncrasies that produce random fluctuations in results. The many replications one can produce in simulation studies produce very stable parameter estimates with small standard errors. This approach has been used by others to investigate group properties, including missing data, and our study follows similar methods (Allen et al., 2007a; Bliese, 1998; Bliese & Halverson, 1998).
Our study utilized a fully crossed factorial design in which we manipulated levels of our five experimental factors: 3 (group size) × 2 (effect size) × 6 (ICC[1]) × 5 (response rate) × 2 (response pattern). The design thus consisted of 360 cells with 800 replications per cell for a total sample size of 288,000. Each of the 288,000 observations included a group-level correlation calculated from a simulated study data of 30 groups. In each simulated study, the size of the group, the ICC(1) value, the response rate, the true correlation, and the method of nonresponse were determined by the experimental condition. Our selection of factor levels and the generation of observed correlations are explained below and are displayed in Table 1.
Experimental Variables
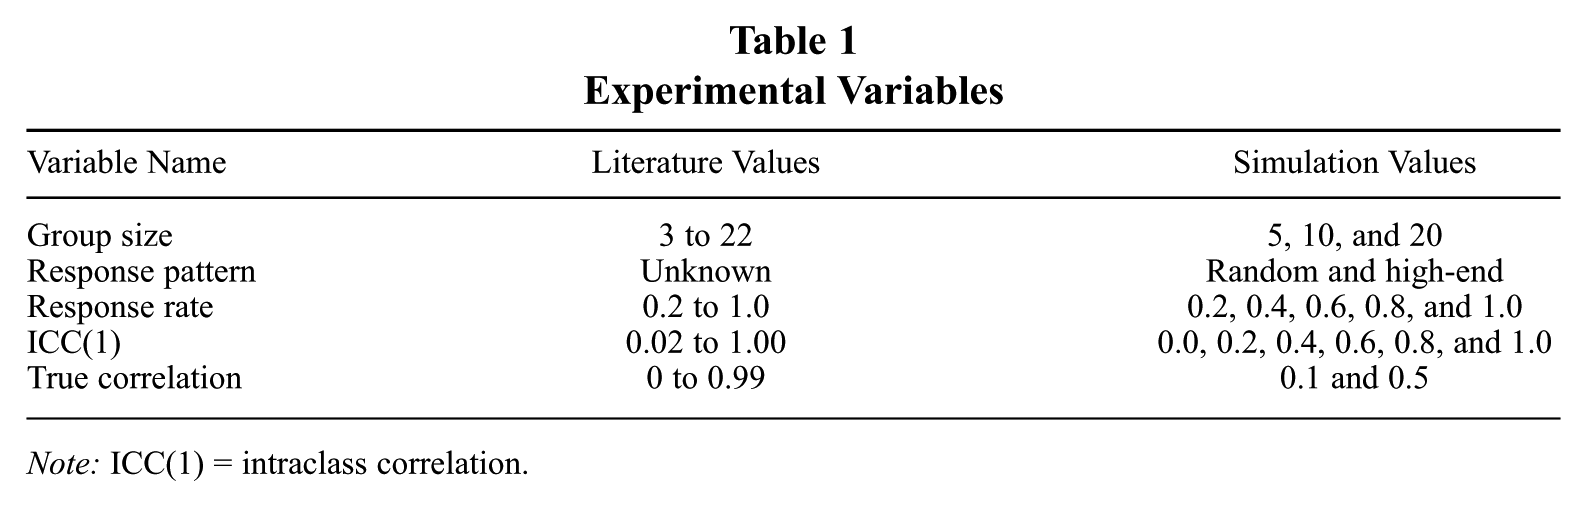
Note: ICC(1) = intraclass correlation.
We based the selection of the levels for each of the experimental variables on an extensive review of group-level empirical studies that appeared in the Journal of Management, the Academy of Management Journal, and the Journal of Applied Psychology from 2001 to 2010. We examined all studies that estimated the relationship between group-level variables. Of these, more than 50% were studies that aggregated individual responses to represent group-level scores, and we used those studies to establish the manipulated levels of the experimental variables in our simulation. Our goal was to select ranges of our factors that represented those typically found in the group literature. The levels of each of the factors are explained below.
In our review of group-level studies, group sizes ranged from 2 (Chen, Thomas, & Wallace, 2005) to 102 (Liao & Subramony, 2008), with more than 90% of studies in the range of 3 to 22. We thus chose group sizes of 5, 10, or 20 to represent this range. Studies reported ICC(1) values ranging from near 0 to almost 1.0, with an average value of 0.29, with 80% of the cases falling below 0.40. We simply chose to manipulate 6 values across the entire range from 0.0 to 1.0. To ensure that our manipulated values of ICC(1) were based on within-group and between-group variability values that were representative of those generally found in the literature, we plotted our values against those found in 25 studies published in the Academy of Management Journal from which we were able to obtain such values. This plot is displayed in Figure 1.
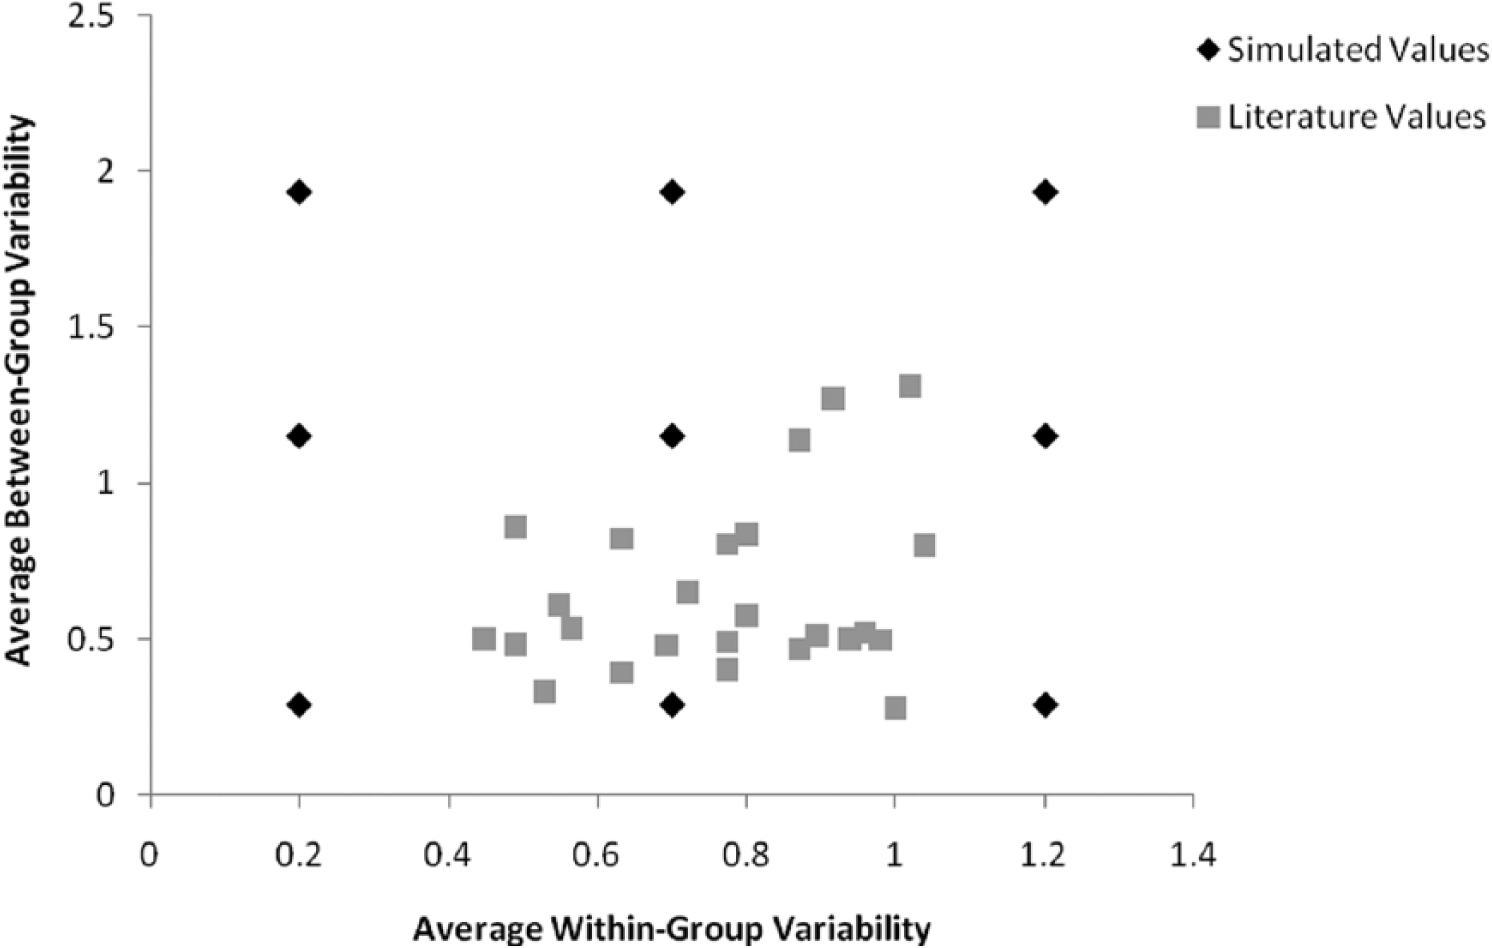
Average Within-Group Variability and Average Between-Group Variability Pairs Reported in the Literature and Examined by the Simulation
Observed effect sizes in the literature ranged from 0 to 0.99, but it was very unusual to observe ones greater than 0.50. We thus chose two values, representing a small effect size (r = 0.10) and a large effect size (r = 0.50) to cover this range. Response rates for groups in our literature review were not always reported in a way that indicated the percentage of group members that participated in the study. Often, the total sample of individuals was reported as a percentage of the total number of individuals in the sampling frame but not as the average number of participants per group as a percentage of the sizes of the groups. Because response rate was our focal variable of interest, we thus chose response rates of 0.20, 0.40, 0.60, 0.80, and, of course, 1.0. The samples, representing each level of the response rate, were selected from each of the simulated groups in either a completely random or a biased fashion. In the case of a biased selection, the group members who had high scores on a particular construct were included in the sample of responders. We labeled the biased selection a “high-end” response pattern. Table 2 provides a summary of the entire design.
ANOVA Results
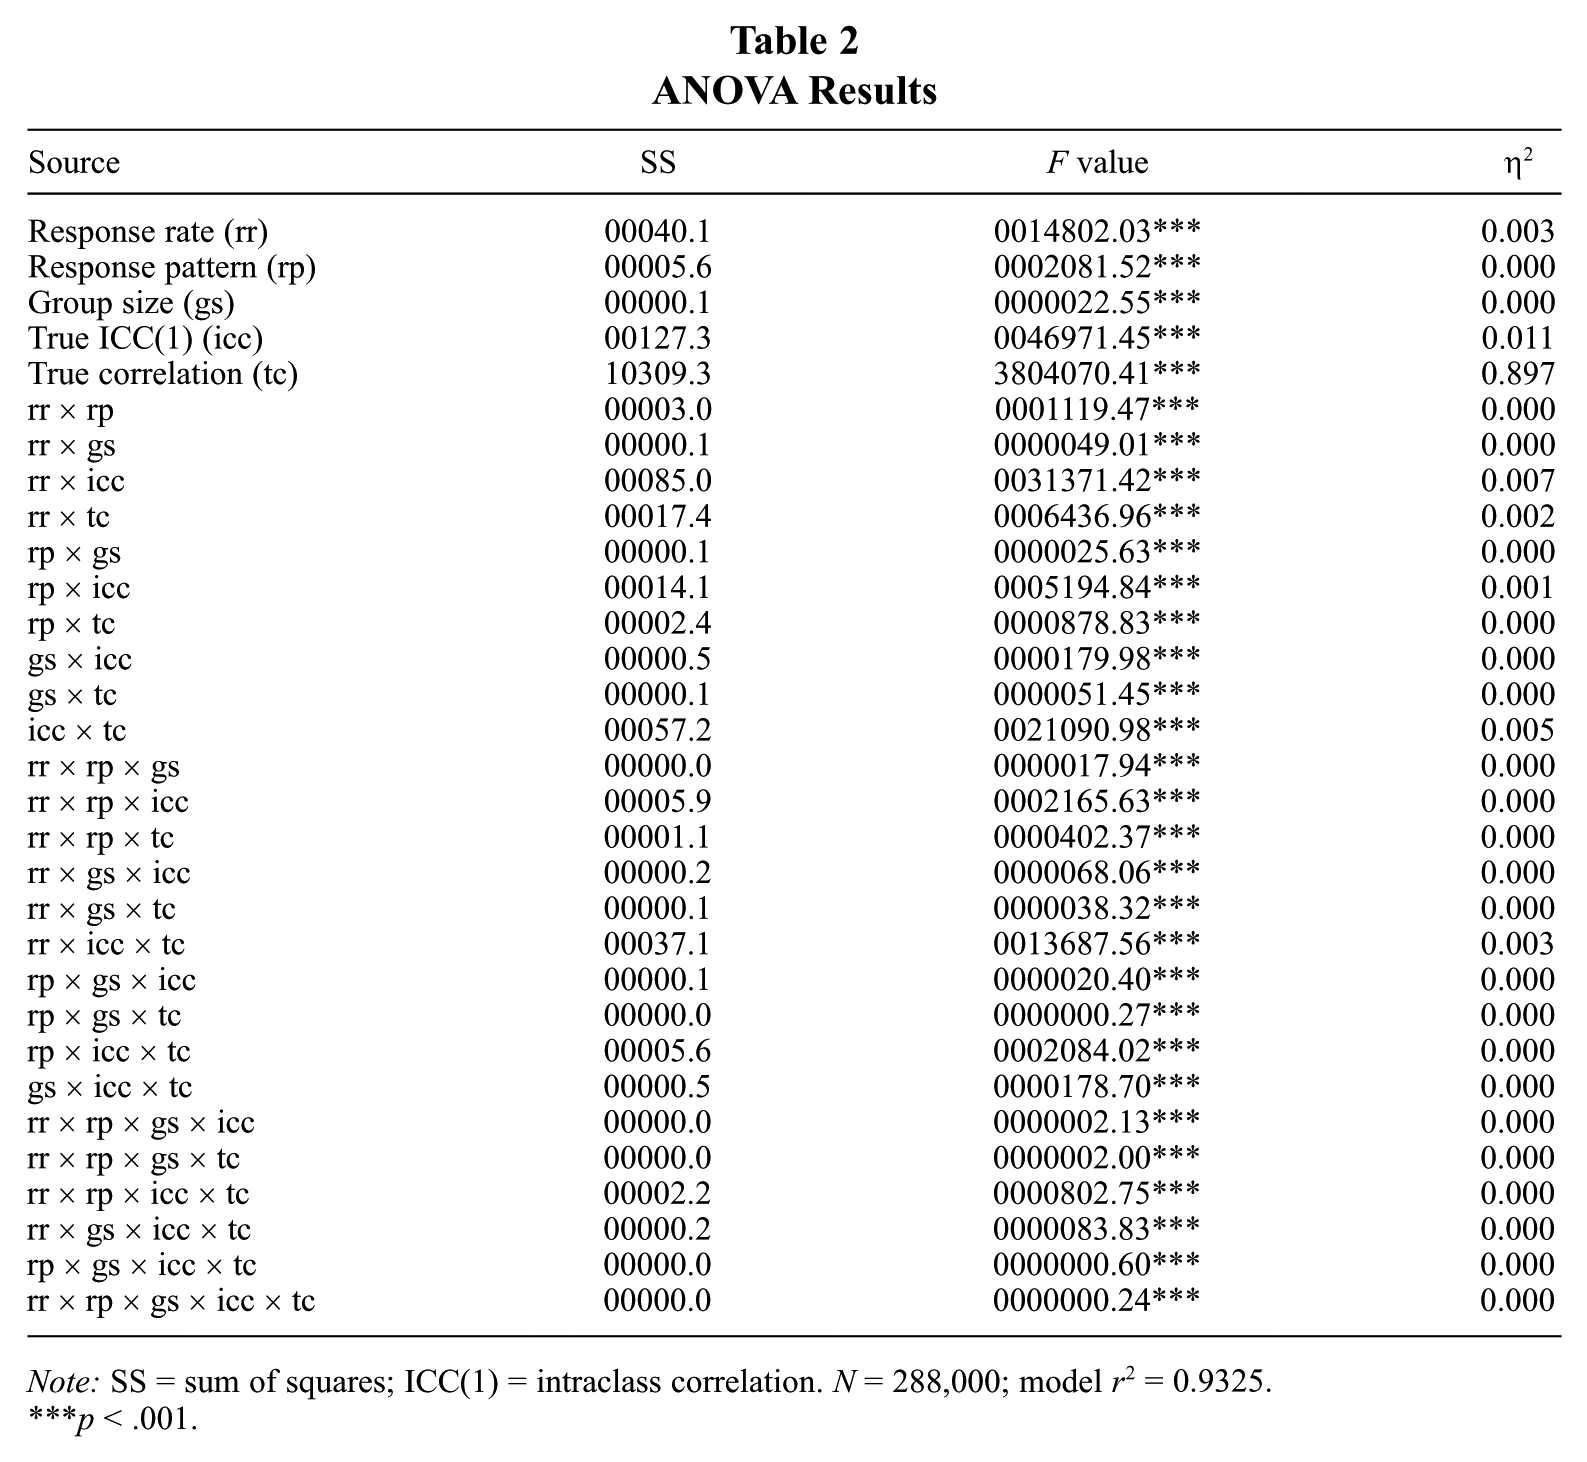
Note: SS = sum of squares; ICC(1) = intraclass correlation. N = 288,000; model r2 = 0.9325.
p < .001.
Results
We conducted an analysis of variance (ANOVA) to examine the effect of response rate and its interactions with the other factors on the observed correlation between group-level variables. These results are reported in Table 2. Response rate showed a significant main effect on observed correlations (η2 = 0.003), indicating that, on average, there is some attenuation of observed correlations with lower response rates. ICC(1) also showed a substantively as well as statistically significant main effect, indicating a positive relationship between ICC(1) and observed correlation. In both cases, however, there are significant interactions involving these factors. Moreover, the most relevant tests for our research questions concern the interactions of response rate with the other factors. As seen in Table 2, because of the very large amount of statistical power, virtually all two-way and three-way interactions are statistically significant. However, in most cases, the effect sizes, as indicated by the values of eta-squared, are almost zero. At the two-way interaction level, response rate had substantive interactions with ICC(1) (η2 = 0.007) and true correlation (η2 = 0.002). However, there was also a substantive three-way interaction among these factors (response rate, ICC[1], and true correlation), so we examined the simple main effects from this three-way interaction. To illustrate the effects of response rate in combination with ICC(1) and effect size, we used the model coefficients to generate predicted observed correlations under various combinations of these three factors. These results are presented in Tables 3a, 3b, and 3c.
The Effect of Response Rate on Observed Correlation Under Different Levels of True ICC(1) When True Correlation is 0.1
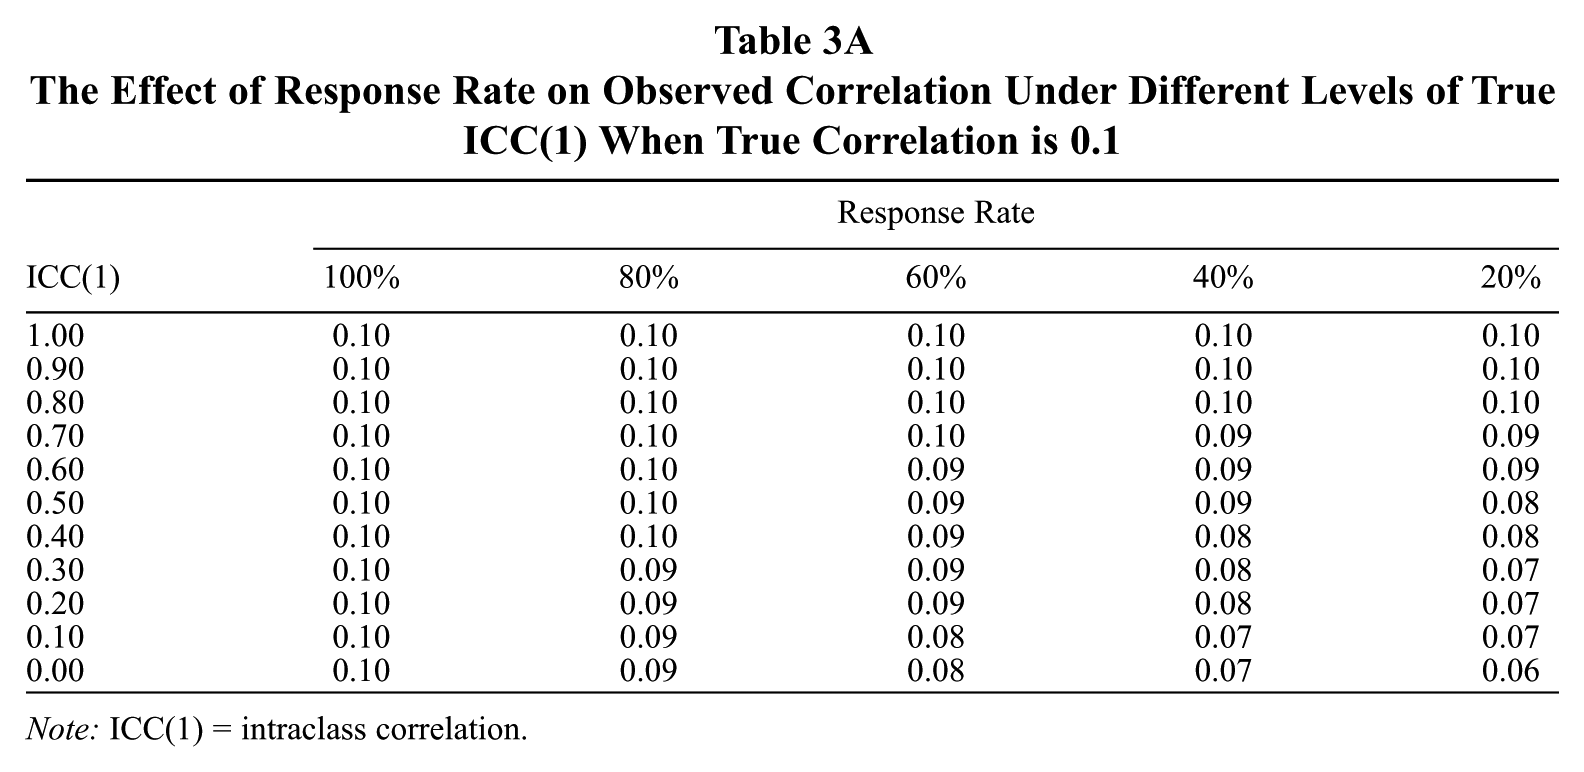
Note: ICC(1) = intraclass correlation.
The Effect of Response Rate on Observed Correlation Under Different Levels of True ICC(1) When True Correlation is 0.5
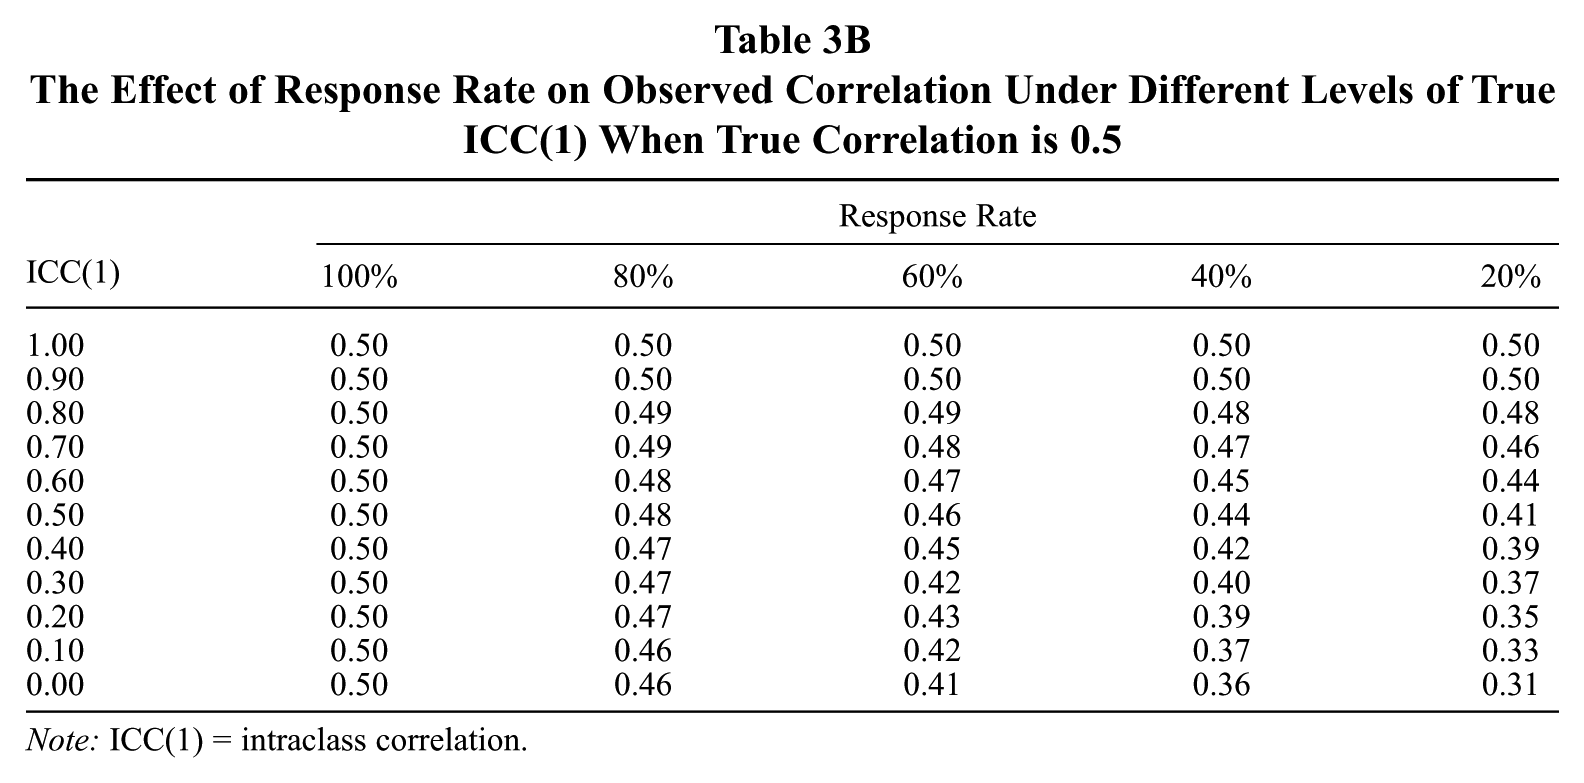
Note: ICC(1) = intraclass correlation.
The Effect of Response Rate on Observed Correlation Under Different Levels of True ICC(1) When True Correlation is 0.3
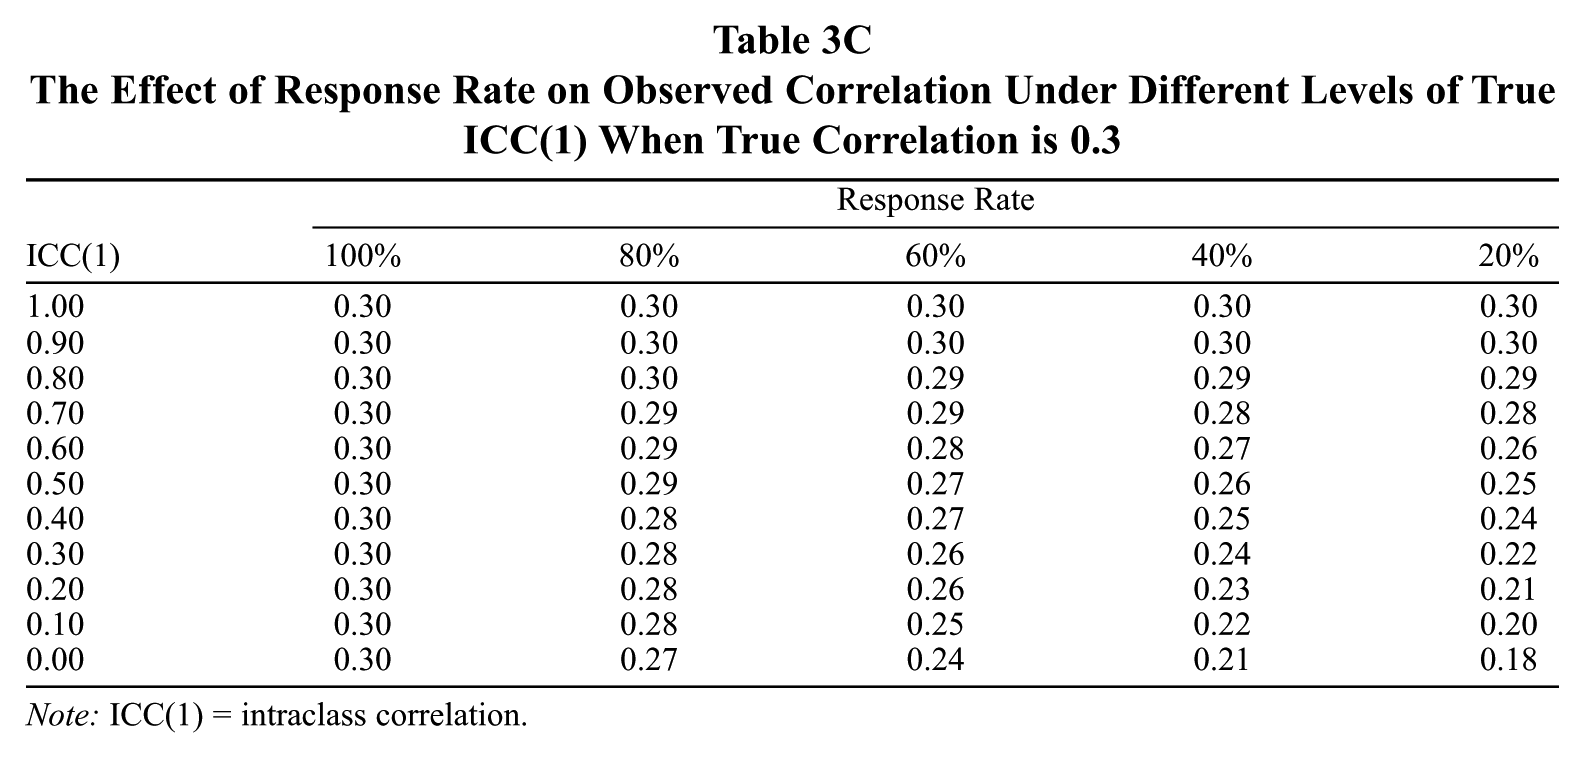
Note: ICC(1) = intraclass correlation.
Examining Tables 3a through 3c shows how the effects of response rates on observed group-level correlations depend on ICC(1) and, to a much lesser extent, on the true correlation. As an example, at even a very small effect size of r = 0.10 and an average ICC(1) of 0.30, a 60% response rate yields a 10% reduction in the size of the observed correlation. A 40% response rate yields a 20% reduction under these circumstances. The impact of the true effect size is also very minimal. When the effect size is a large r = 0.50 and the ICC(1) is 0.30, a 60% response rate produces a slightly larger 12% reduction in the estimated effect, and a 40% response rate produces the same 20% reduction. Thus, the joint effects of response rate and ICC(1) actually depend on true effect sizes to only a small extent, but we report the table values for three different effect sizes for completeness.
Discussion
This study contributes to the group literature by demonstrating that sampling fewer than all group members can produce significant distortions in group-level relationships. We systematically modeled nonresponse effects by examining four moderator variables—that is, group size, ICC(1), effect size, and type of nonresponse model—that were previously unaddressed in the literature. The simulation produced several unexpected findings. First, group size did not make a significant difference in how response rates affected observed correlations. In addition, the type of nonresponse model, either random or biased toward high-end responders, did not determine how response rates affected the results. The only factor that substantively affected the estimation of group-level correlations was the combination of within- and between-group variance, as expressed as ICC(1). Although the two-way interaction between ICC(1) and response rate varied somewhat over different effect sizes, ranging from small (r = 0.1) to large (r = 0.5), as illustrated in Tables 3a through 3c, these differences are not very substantial. We believe that these tables can be used as guidelines to help the group-level researcher avoid some of the pitfalls that occur when there is within-group nonresponse or at least aid in the estimation of how distorted one’s results might be. In line with the work by Timmerman (2005) and Allen et al. (2007a, 2007b), we show that individual within-group nonresponse can be a significant factor in attenuating group-level correlations and increasing the error in their estimation. But the effects of nonresponse vary depending on ICC(1) levels. Overall, the results of this study suggest that simple heuristics for deciding acceptable levels of response rate (e.g., the response rate should be above 50%) are misleading because the effect of nonresponse on observed group-level correlations varies substantially depending on the levels of ICC(1).
In practical terms, how large is the influence of response rate on group-level correlations? A number of authors have discussed the limitations of interpreting effect sizes solely in terms of variance explained (Abelson, 1985; Aguinis et al., 2010; Cortina & Landis, 2009). We followed the advice of Aguinis et al. (2010) to report results in a “customer-centric” way by providing tables that illustrate the effect size reductions investigators can expect to find under conditions that they can easily assess. Our review of the recent group-level literature showed that ICC(1) values ranged from almost 0 to about 0.70, with the mean being about 0.29. Our simulation results suggest that when ICC(1) values are of average levels—ICC(1) = 0.30—even a nominally high response rate of 80% can produce substantive attenuation in observed relationships of 10% to 12% as well as significantly increase standard errors. Under these conditions, a response rate of 40% yields a 20% underestimation of the observed correlation. Moreover, it is common for researchers to report effect sizes as squared correlations. In terms of this metric, at an average ICC(1) of 0.30, a 60% response rate underestimates the true effect size by about 20%, while a 40% response rate underestimates it by about 36%. Such errors in estimation can lead to practically significant distortions in the interpretation of research results.
We anchored the ranges of our experimental variables based on our review of group-level studies in which at least one of the variables was aggregated from the responses of individual group members. Thus, we believe that our findings are relevant to many group-level studies in the organizational literature. In addition, it is informative to compare our findings with those reported by Timmerman (2005) because his is the only study of nonresponse effects in groups based on empirical data from real teams. Timmerman used archival data from professional basketball and baseball teams and compared estimated effect sizes of team-level aggregated variables on objective team-level performance measures under different levels of nonresponse, using both random and biased high-end sampling of team members. Timmerman found substantial attenuation effects from nonresponse, and these were most severe under random sampling conditions. Consider his findings for the effects of team cooperation on team performance. Team cooperation was operationalized with an additive composition model (mean) of individual assists. An assist is credited to a player when he makes a pass to another player directly preceding the other player scoring. Analyzing data from 1,308 different basketball players representing 389 teams over the years 1983 through 1998, Timmerman found large attenuation effects at even relatively high levels of response. For example, the true effect size for assists was 0.51 (beta controlling for points scored), and this reduced to 0.24 at an 80% (random) response rate and down to 0.18 for a 70% response rate. At a 50% response rate, the relationship (β = 0.138) was no longer statistically significant. These are very large effects, and they are considerably larger than the average attenuation effects we found in our simulation. We find it plausible that Timmerman’s effects can be understood in the context of our simulation results, in which we found that attenuation effects were very dependent on levels of ICC(1). Timmerman did not report ICC(1) values for his data, but these are a function of within- and between-group variability, which we can compare to our simulation data. First, consider between-team variability. In Timmerman’s NBA data, the coefficient of variation (CV) across teams for assists (M = 128.89, SD = 24.69) was 0.19. This CV rests in the low end of our range of CVs of 0.07 to 0.48. Timmerman did not report levels of within-group variability for his data, so we examined data for the Los Angeles Lakers (retrieved January 22, 2011, from http://sports.yahoo.com/nba/teams/lal/stats?season=2009_2&stat_category=nba.stat_category.1) and the Boston Celtics (retrieved January 22, 2011, from http://sports.yahoo.com/nba/teams/bos/stats?season=2009_2&stat_category=nba.stat_category.1) for the 2009-2010 season and computed CVs for assists, which were 0.76 for the Lakers and 1.30 for the Celtics. Compared to our levels of within-group variability (as CV), which ranged from 0.05 to 0.30, these are very large. In short, Timmerman’s NBA data represent teams with relatively low to moderate between-team variability and very large within-team variability in the context of moderate effect sizes—precisely the conditions that our simulation results suggest would lead to substantial attenuation of observed relationships. Thus, whereas even in the midrange of values that we investigated in our study there is nontrivial attenuation and error in estimating group-level effects, such effects can be substantially larger in real-world contexts.
Our results also have implications for investigators interested in composition models other than additive models that reflect just the level of a construct (mean). For one, Newman and Sin (2009) showed that nonresponse systematically biases the estimation of within-group agreement indices. Therefore, researchers interested in dispersion models of groups must also contend with estimates of dispersion that are biased by group member nonresponse.
Cole et al.’s (2011) study highlights the importance of controlling for level (mean) effects of group-level constructs when studying dispersion models. They demonstrate that level effects must be considered when estimating dispersion models, for two reasons. First, indicators of level (e.g., mean) and dispersion (e.g., standard deviation) are often correlated. This interdependence can lead to range restriction that can produce attenuated estimates of the relationship between a dispersion measure and another group-level construct. Additionally, the statistical dependence between level and dispersion measures requires that the mean be controlled for when estimating dispersion models. Thus, Cole et al. argue, “It is impossible to determine the extent to which a dispersion variable is actually related to the study criteria being examined without establishing and controlling for the degree of interdependence between the level and dispersion components of a group-level predictor” (2011: 6). Second, Cole et al. (2011) note that multilevel researchers are also interested in theoretical models that incorporate an interaction between level and dispersion effects, citing Harrison and Klein’s (2007) argument that the specification of a dispersion variable implies an interaction between level and variability. Consideration of such interactive models requires that curvilinear effects of the components of this interaction (e.g., mean and standard deviation) be estimated and controlled for when estimating the level-by-dispersion interaction. Attenuated estimates of the relationship between the mean and the group criterion because of missing data will thus seriously distort the exploration of dispersion composition models in several different ways.
Practical Implications for Group Researchers
The practical implications of this study for group researchers concern both post hoc assessments of their empirical findings, in order to gauge possible attenuation effects, and study design strategies that might be used to reduce or eliminate such attenuation. On the post hoc side, our results provide some diagnostic guidelines to group researchers to help them estimate the extent to which their group-level relationships might be biased by nonresponse. Our findings show that the rate of nonresponse alone is insufficient to explain such biases. Thus, even with having a very high response rate such as 80%, researchers could suffer biased results if they had low ICC(1) values. Interestingly, the effects of nonresponse are at least as severe under conditions of random nonresponse. Investigators often strive to demonstrate that nonresponse is random in their samples, even though such randomness does not appear to vitiate the attenuation effects of nonresponse. Although researchers generally report ICC(1) values, in our review of group-level studies we found that investigators often do not report their response rates in terms of the percentage of group members who responded. More often, researchers report an average response rate in terms of the overall percentage of the sampling frame that provided data. Thus, we encourage researchers to report response rates as the percentage of group membership for which they obtain data. Reviewers of group-level studies should also consider the interaction of ICC(1) values and group response rates in assessing reported effect sizes from such studies. We also believe that the estimates provided in Tables 3a through 3c can be used to “correct” effect size estimates for purposes of meta-analysis.
In terms of study design, we recommend, of course, that investigators adopt strategies to maximize response rates (Rogelberg & Stanton, 2007). Such strategies include the use of incentives and the development of trust between researchers and participants. Our findings suggest, however, that other steps might be effective in reducing nonresponse bias. Researchers always face resource constraints of time and money. Some of these resources might be more effectively deployed in developing better sampling plans than in providing monetary incentives for participation. Our research suggests various additional actions that researchers can undertake to diminish the effects of nonresponse. First, we recommend that groups sampled be as heterogeneous as possible with respect to the constructs of interest, in order to maximize between-group variability. This might mean that investigators need to approach multiple organizations from which to sample groups if a single organization produces too little variability on relevant group characteristics. This advice is consistent, of course, with the general research design recommendation to maximize systematic variance on the constructs of interest (Kerlinger, 1986). Our results, moreover, show that following such advice can also lessen the biasing effects of low response rates.
Our second recommendation is that investigators attempt to minimize within-group variability as a second strategy to increase ICC(1) values. Of course, accomplishing this minimization is not always feasible. After all, groups that we study are what they are. But two approaches offer some potential utility. First, in the experimental study of groups, within-group variability can be actively manipulated. Humphrey, Hollenbeck, Meyer, and Ilgen (2007), for example, recently proposed a seeding strategy when forming groups for the purpose of studying trait configuration effects in groups. This approach directly determines the levels of within-group variability. A similar seeding approach can be used to maximize between-group variability. When sampling groups in naturalistic settings, however, this approach is not possible. Investigators’ concerns with within-group variability generally stem from meeting criteria for consensus aggregation models (Chan, 1998). In such cases, if within-group agreement is not sufficiently high, then the validity of the aggregated construct itself is called into question. This is not a concern with additive aggregation models, although our results show that within-group agreement is nevertheless influential in moderating the biasing effects of nonresponse in such models. How survey questions are worded, however, can affect such within-group variability, as demonstrated by Klein, Conn, Smith, and Sorra (2001). They found that within-group agreement was caused in part by whether a direct or referent shift model (i.e., one in which the group was the frame of reference) was used for survey design. But their results were complicated in that a referent shift approach did not always produce the most agreement, as one might have expected. Agreement levels were determined by a combination of measurement strategy and the nature of the items themselves, specifically whether they were descriptive or evaluative. Use of a group referent (i.e., referent shift) led to more agreement for descriptive items but not for evaluative items. Interestingly, use of a referent shift strategy also produced more between-group variability than did the direct method, thus suggesting that this measurement approach might increase ICC(1) values in two ways. More work needs to be done on the effects of such measurement strategies. But at this point, we would recommend that investigators consider the use of a referent shift approach, especially in the case of descriptive items. This method would be expected to yield both more within-group agreement (less variability) and more between-group variability.
Limitations and Future Directions
To render our simulation feasible, we made the following simplifying assumptions: (1) individual-level measurement error is zero, (2) group members’ construct scores are normally distributed, and (3) within-sample variability between groups with respect to group size, within-group variability, and response rate is zero.
Although we analyzed models that assumed no individual-level measurement error, such error should not be discounted, because of the amount of distortion it could contribute to the observed group-level scores. That being said, it is important to note that classical test theory posits that random measurement error should have no effect on the population parameter (in this case a group-level score), because the expected value of the measurement error is zero, and thus the expected observed score should equal the true score (see Pedhazur & Schmelkin, 1991: 83-84). However, given the small sizes of groups used in a typical group-level study (e.g., from 3 to 22), the assertion of no effect of measurement error on the group-level score should be empirically examined. To date, we know of no studies that examined this question. Future research should consider the possible joint role that nonresponse and measurement errors play in biasing empirical results. For now, we encourage the reader to consider this work as perhaps an optimistic portrayal of the role that nonresponse plays (decoupled from measurement error), because it is not unreasonable to hypothesize that the joint role of nonresponse and measurement error might induce a greater biasing effect than nonresponse alone.
Mooney mentions that it is “difficult to determine how a variable is distributed in the real world and which of the many standard distributions best represents it” (1997: 7). Most studies (e.g., Allen et al., 2007a, 2007b; MacKenzie, Podsakoff, & Jarvis, 2005) rely primarily on a normal distribution to simulate the values for the variables of interest. Our work follows this practice. This is a limitation, however, in that many behavioral phenomena are sometimes best represented by a variety of non-normal distributions such as Pareto, exponential, chi-square, or uniform. Future efforts should consider a variety of alternative distributions and their impact on the effects of nonresponse.
Conclusion
Our study illustrates the sometimes large attenuating effects that nonresponse can have when studying aggregated group-level constructs. Moreover, low response rates not only can attenuate observed correlations but create large standard errors as well. What our findings show is that the effect of nonresponse is highly contingent upon the joint effects of within-group and between-group variability, as expressed in ICC(1) scores, and less so on the nature of the nonresponse (i.e., whether it is random or not). Thus, it would be highly misleading to argue for the adoption of any particular response rate standard as acceptable. Serious distortion of group-level relationships can occur even at relatively high response rates and yet at the same time can be minimal at even low response rates. Investigators need to consider these factors when designing their own studies, and reviewers of the literature need to be mindful of them when they critically evaluate or quantitatively summarize existing studies.
Footnotes
Acknowledgements
This article was accepted under the editorship of Deborah E. Rupp. We would like to thank Michael Gross, Christine Henle, and Travis Maynard for their helpful comments on this article.