
Abstract
This paper explores the nature of workplace motivation by testing the continuum structure of motivation proposed by self-determination theory through the application of relatively new and advanced methodological techniques. Specifically, we demonstrate the usefulness of the overarching bifactor exploratory structural equation modeling framework in organizational psychology and discuss implications of such models over more traditional confirmatory factor analyses. This framework is applied to responses obtained from 1,124 Canadian employees who completed a multidimensional measure of workplace motivation. The results support a continuum of self-regulation and illustrate the importance of accounting for quality of motivation in addition to its global quantity. Indeed, the results showed that specific types of motivation explained variance in covariates over and above the variance already explained by the global quantity of self-determination. The current study further demonstrates the limitation of the commonly used relative autonomy index and offers alternate conceptualizations of human motivation.
Keywords
Modern psychological science is progressing to a level of theoretical complexity that necessitates the use of equally sophisticated methodological and statistical tools. This observation calls for substantive-methodological synergy (Marsh & Hau, 2007). Substantive-methodological synergies are joint ventures in which methodological advances are applied to substantively important areas of research in order to help provide more precise, or refined, answers to complex research questions. The current paper is anchored into such a substantive-methodological synergy framework and aims to (a) test the continuum structure of motivation proposed by self-determination theory (SDT; Deci & Ryan, 1985) and (b) demonstrate the usefulness of the overarching bifactor exploratory structural equation modeling (B-ESEM) framework in organizational psychology. We start this paper by reviewing key substantive issues related to the SDT continuum hypothesis of motivation and then present in greater detail the B-ESEM psychometric framework.
Substantive Issues: The Continuum Structure of Motivation
SDT of Human Motivation
SDT (Deci & Ryan, 1985, 2000; Ryan & Deci, 2000) proposes that individuals experience autonomous motivation when their reasons for engaging in behaviors are volitional and experience controlled motivation when their reasons for engaging in the behaviors are pressured either internally or externally. Each of these two forms of motivation can be characterized by different types of motivation expected to form a continuum. At one extreme, the most autonomous form of motivation is intrinsic motivation. Intrinsic motivation occurs when individuals derive a sense of enjoyment and satisfaction from the enactment of the behavior itself. At the other extreme, the most controlled form of motivation is external regulation, which occurs when individuals engage in an activity for purely instrumental reasons, such as to obtain rewards or avoid punishment. Between these extremes, introjected regulation happens when a person engages in behavior to reduce negative self-related feelings (e.g., shame, guilt) or to experience positive self-related feelings (e.g., pride), and identified regulation occurs when the outcome of the behavior is personally meaningful. Introjected regulation can be exemplified by employees who work late to maximize their performance and feel better about themselves, whereas identified regulation would be exemplified by employees who stay late to finish work that they perceive to be important to the organization.
In the work domain, external regulation can be further subdivided according to whether the source of the external pressure to enact the target behavior is material or social (Gagné et al., 2015). External material regulation stems from tangible rewards and punishments, such as monetary benefits and job security. In contrast, external social regulation is related to social rewards and punishments, such as approval and criticism from others. Although not initially covered in SDT, others have noted that it is also important to assess amotivation (Pelletier, Fortier, Vallerand, Tuson, Brière, & Blais, 1995; Vallerand, Pelletier, Blais, Brière, Senécal, & Vallières, 1993), referring to an absence of willingness to exert effort, in order to cover scenarios where people have no reason or willingness to put any effort into an activity. Indeed, early SDT-based motivation instruments were limited in that they implicitly assumed that everyone would have some reason to embark on a targeted course of action, failing to explicitly assess lack of motivation. In the current study, we rely on the Multidimensional Work Motivation Scale (MWMS; Gagné et al.), a newly developed scale designed to measure these distinct types of motivation in the work domain. Previous confirmatory factor analyses (CFA) have supported the multidimensional structure of the MWMS in seven different languages (Gagné et al.). Here, we use a subsample from Gagné et al. and use B-ESEM to test SDT’s hypothesis that motivation types follow an underlying continuum.
Motivation Types on a Continuum
A key aspect of SDT’s conceptualization of motivation is that motivation types are ordered along a continuum depicting the degree of relative autonomy, or self-determination (Ryan & Deci, 2000). SDT suggests that the qualitatively different motivation types also differ quantitatively along a single continuum of self-determination. The continuum hypothesis has typically been examined through an inspection of the correlations between the motivation types (Ryan & Connell, 1989; see Guay, Morin, Litalien, Valois, & Vallerand, 2015, for a review in the education domain). For instance, Ryan and Connell tested whether the correlations between motivation types followed a simplex structure. The simplex structure refers to a correlation pattern showing that adjacent motivation types correlate more strongly and positively with one another than more distal motivation types (which should correlate negatively). For example, intrinsic motivation should correlate more strongly with identified regulation than with introjected or external regulations. Although amotivation has not traditionally been taken into account in tests of the SDT continuum, a case has been made for this factor to fall at the lowest point of the continuum (Cox, Ullrich-French, Madonia, &Witty, 2011; Guay, Ratelle, Roy, & Litalien, 2010; Stevenson & Lochbaum, 2008).
Some past research has supported the continuum hypothesis (e.g., Li, 1999; Li & Harmer, 1996; Ryan & Connell, 1989), while other research has not, especially when using more advanced statistical techniques (e.g., Chemolli & Gagné, 2014; Guay et al., 2015; Wininger, 2007). For example, Chemolli and Gagné argued that if the continuum hypothesis truly represented the structure of motivation, CFA should support the adequacy of a single factor model, and loadings on this single factor would range from negative for the least self-determined forms of motivation to positive for the most self-determined forms of motivation. They used Rasch analysis, a stringent statistical test specifically developed to evaluate continuum structures (Rasch, 1960), to test whether there was a continuum structure underlying the items of the MWMS and the Academic Motivation Scale (Vallerand, Pelletier, Blais, Brière, Senécal, & Vallières, 1992) and found no support for it. These results concur with past research that has consistently supported multidimensional models over unidimensional ones (e.g., Gagné et al., 2015; Gagné, Forest, Gilbert, Aubé, Morin, & Malorni, 2010; Li; Mallett, Kawabata, Newcombe, Otero-Forero, & Jackson, 2007).
A different test of this hypothesis was conducted by Guay et al. (2015), who investigated the continuum assumption of SDT using exploratory structural equation modeling (ESEM). Guay et al. further noted that in ESEM, the SDT continuum could be expressed in two distinct and complementary manners. In line with previous studies, the continuum hypothesis would be supported by the observation of the expected simplex pattern at the level of factor correlations. Because ESEM tends to result in more exact estimates of these factor correlations (see the Methodological Issues: Introduction to B-ESEM section below), the simplex pattern could be expected to be clearer using ESEM than CFA. Moreover, support for the continuum hypothesis could come from the observation of larger cross-loadings between adjacent subscales than between more theoretically distal subscales. Testing these propositions with the Academic Motivation Scale (Vallerand et al., 1992), Guay et al. found that the data fit the ESEM representation better than the CFA model and that factor correlations were more in line with the expected SDT continuum with ESEM than with CFA. However, even though the simplex pattern was cleaner with ESEM, the results still showed many digressions and did not fully replicate across samples. Results also revealed cross-loadings somewhat in line with the SDT continuum (i.e., stronger between adjacent factors), though they remained generally small. Overall, these results partially supported the continuum hypothesis (for a similar ESEM representation of doctoral students’ academic motivation, see Litalien, Guay, & Morin, 2015). In the present study, we extend these previous studies by combining into a single B-ESEM framework the tests conducted separately by Chemolli and Gagné (2014) and Guay et al. to a new measure of work motivation (Gagné et al., 2015).
Methodological Issues: Introduction to B-ESEM
CFA has become the ubiquitous test of factor structures in psychological measurement. Measures that fail to meet designated goodness-of-fit standards are deemed of little worth in the eyes of researchers and reviewers alike. Despite this, psychological scales that consistently meet these rather arbitrary benchmarks are few. This has caused many to question the necessity of the independent cluster model (ICM) constraints inherent in CFA, in which cross-loadings between items and nontarget factors are assumed to be exactly zero. Undoubtedly, CFA has had a positive influence on psychological measurement by encouraging researchers to develop more a priori, precise, and parsimonious models (e.g., Morin, Marsh, & Nagengast, 2013). Through its integration into the structural equation modeling (SEM) framework, CFA has provided ways to test how the data fit with a priori expectations, to systematically investigate the degree to which a measurement or predictive model is invariant across meaningful subgroups of participants, and to assess relations between constructs corrected for measurement errors. These developments have been so substantial that CFA has completely superseded traditional exploratory factor analyses (EFAs) for all but the most preliminary tests of factor structure.
Over and above the intuitive appeal of clearly defined concepts, measured by a small number of items perfectly designed to assess a single construct, has come a recent recognition that the ideals pursued through a CFA approach are often impossible to achieve in applied research (e.g., Marsh et al., 2009; Marsh et al., 2010). Nowadays, many researchers recognize that the ICM constraints inherent in CFA are oftentimes not appropriate given the nature of the data (for a review, see Marsh, Morin, Parker, & Kaur, 2014). Specifically, the fallible and imperfect nature of typical psychometric indicators that typically can be expected to tap into more than one source of true score variance call into question the usefulness of CFA (e.g., Morin, Arens, & Marsh, 2016). As noted by Morin et al., indicators are rarely, if ever, perfectly and uniquely related to a single construct and will almost always display some degree of construct-relevant association with nontarget factors assessing conceptually related (such as interrelated motivation types; see Guay et al., 2015; Litalien et al., 2015) or hierarchically ordered (such as when motivation types are expected to assess an overarching motivation continuum; see Chemolli & Gagné, 2014) constructs.
CFA Versus ESEM
Relying on an EFA measurement model allowing for the estimation of cross-loadings is typically required as a test of construct-relevant multidimensionality related to the assessment of conceptually related constructs (Morin, Arens, Tran, & Caci, in press; Morin et al., 2016). However, EFA has often been criticized for being data driven and “exploratory” in nature (e.g., Kahn, 2006; Preacher & MacCallum, 2003). This implies an approach in which multiple models are compared and the model producing the best correspondence to the data (based on a variety of criteria) is retained for further use. In contrast, CFA is generally assumed to be theory driven, and models are assessed in and of themselves using a variety of goodness-of-fit indices. This view has led to the erroneous assumption that EFA is a data-driven procedure unsuited to confirmatory studies. According to Morin et al.,
This perception is reinforced by the erroneous semantically-based assumption that EFA is strictly an exploratory method that should only be used when the researcher has no a priori assumption regarding factor structure and that confirmatory methods are better in studies based on a priori hypotheses regarding factor structure. This assumption still serves to camouflage the fact that the critical difference between EFA and CFA is that all cross-loadings are freely estimated in EFA. Due to this free estimation of all cross-loadings, EFA is clearly more naturally suited to exploration than CFA. However, statistically, nothing precludes the use of EFA for confirmatory purposes, except perhaps the fact that most of the advances associated with CFA/SEM were not, until recently, available with EFA. (2013: 396)
The recent development of ESEM (Asparouhov & Muthén, 2009; Marsh et al., 2014; Morin et al., 2013) provides a promising way to circumvent restrictive ICM assumptions. ESEM provides an overarching framework allowing for the combination of CFA, EFA, and SEM into a single model. ESEM thus incorporates the benefits from each technique into a single analytic framework where factors defined according to ICM assumptions can cohabitate with EFA factors incorporating cross-loadings.
A frequent misunderstanding about EFA/ESEM is that the inclusion of cross-loadings is likely to change, or taint, the meaning of the latent factors that are estimated. This flawed criticism neglects the fact that EFA/ESEM corresponds to a reflective measurement model where the factors are assumed to influence the items, rather than the opposite. A perhaps more critical issue is whether the factor itself is adequately captured, from a psychometric perspective, as being primarily reflected in its a priori indicators. Indeed, whenever results show large and hard to explain cross-loadings suggesting that some specific (S-) factors are mainly reflected in unexpected items rather than in their a priori items, then alternative models should be explored. As noted by Morin et al.,
Small cross-loadings should be seen as reflecting the influence of the factor on the construct-relevant part of the indicators, rather than the indicators having an impact on the nature of the factor itself. It should be kept in mind that this interpretation applies to relatively small cross-loadings that are in line with theoretical expectations, whereas any model showing large and unexplainable cross-loadings or cross-loadings larger than target loadings should be re-examined. (2016: 135-136)
Forcing cross-loadings to be exactly zero involves ignoring some potentially true influence of a factor (such as stress) on indicators presenting some residual association with these factors (such as insomnia) over and above their association with their main a priori factor (such as burnout). In fact, even when large cross-loadings suggest a problem in the model, forcing them to be zero simply hides sources of misspecification that will in turn be expressed as model misfit—leading to an examination of model modification indices to locate the source of misfit. An advantage of EFA/ESEM is that it allows for the simultaneous consideration of all cross-loadings in a single step, whereas modification indices are calculated based on the inclusion of a single cross-loading at a time (Morin & Maïano, 2011).
It could be argued that ignoring these associations between items and nontarget constructs simply results in reduced goodness-of-fit indices and that typical interpretation guidelines for goodness-of-fit indices are just too stringent for complex measurement models (e.g., Marsh, Hau, & Wen, 2004). However, a clear demonstration that cross-loadings do not taint the meaning of the latent factors comes from simulation studies showing that EFA/ESEM tends to provide more exact estimates of true population values for factor correlations when cross-loadings (even small ones) are present in the population model and to remain unbiased when the population model corresponds to ICM-CFA (Asparouhov & Muthén, 2009; Marsh, Lüdtke, Nagengast, Morin, & Von Davier, 2013; Morin et al., 2016; Sass & Schmitt, 2010; Schmitt & Sass, 2011; for a more extensive discussion, see Asparouhov, Muthén, & Morin, 2015). In turn, biased CFA estimates of factor correlations likely affect the discriminant validity of the factors by creating artificial multicollinearity in subsequent analyses where these factors are used in prediction.
Another legitimate concern about EFA/ESEM is the issue of rotational indeterminacy, meaning that the parameter estimates from any EFA/ESEM model will vary as a function of the rotation procedure that is retained (e.g., Morin & Maïano, 2011; Sass & Schmitt, 2010; Schmitt & Sass, 2011). More precisely, EFA/ESEM models based on different rotation procedures—designed to reduce either cross-loadings or factor correlations to various degrees—will converge on alternative solutions that have equivalent covariance implications (i.e., data fitting different models equivalently). In practice, alternative forms of oblique rotations tend to provide nearly identical, or at least equivalent in terms of substantive interpretations, solutions as demonstrated in simulation studies by Sass and Schmitt and by Schmitt and Sass and real data examples by Morin and Maïano and by Morin et al. (2013). However, users should remain aware of this issue and whenever they decide to use empirical (atheoretical) rotation procedures, should always conduct at least a preliminary exploration of alternative rotations to verify the stability of results. Recent recommendations suggest that this issue can be solved in confirmatory applications of EFA/ESEM relying on target rotation whereby the rotation is guided by a priori expectations regarding the expected factor structure (Marsh et al., 2014; Morin et al., 2016). The development of target rotation (in which all cross-loadings are freely estimated but “targeted” to be as close to zero as possible) makes it possible to use a fully confirmatory approach to the specification of EFA/ESEM factors (Asparouhov & Muthén, 2009; Browne, 2001). Indeed, the most common use of ESEM so far has been the testing of theoretically established models in which the number and content of specified latent factors was a priori defined (Marsh et al.).
B-ESEM
As noted above, a second source of construct-relevant multidimensionality is related to the assessment of hierarchically ordered constructs (such as an overarching motivation continuum). This possibility has typically been investigated using higher-order factor models, which directly test the hypothesis that the various factors can combine into one or many higher-order factors. However, higher-order factor models rely on highly restrictive implicit assumptions that may not hold in practice and may explain why they often fail to meet minimal requirements of adequate fit (Gignac, 2008; Morin et al., 2016; Reise, 2012). More precisely, higher-order models assume that the association between items and the higher-order factor is fully mediated by the first-order factors (McAbee, Oswald, & Connelly, 2014), so that the higher-order factor does not in itself explain any unique variance over and above that already explained by the first-order factors. For this reason, the first-order factors in a higher-order model reflect a combination of the variance explained by the higher-order factor and of the variance uniquely attributable to each first-order factor (Morin et al., in press). More importantly, because the relation between the higher-order factor and the item is mediated through the first-order factor, this relation is captured by the product of the loading of the item on a first-order factor and the loading of this first-order factor on the higher-order factor. This second term is constant for all items associated with a single first-order factor. Similarly, the relations between the items and the disturbances of the first-order factors (reflecting the variance uniquely attributable to the first-order factor) are also indirect and reflected by the product of the loadings of the items on their first-order factor with a constant for all items associated with a single first-order factor. Because of these characteristics, the ratio of variance attributed to the global (G-) factor versus uniquely attributed to the first-order factor is constant for all items associated with a single first-order factor (Gignac; Morin et al., in press; Reise).
An alternative, and far more flexible, way to examine whether the presence of a single global SDT factor underlies answers to motivation questionnaires involves the use of a bifactor representation, in which all items are used to define their respective motivation subscales while also being used to directly define a global SDT motivation factor that represents the continuum (Reise, 2012). Bifactor models have existed for decades (Holzinger & Swineford, 1937) and are well known in research on intelligence (Gignac, 2008) or personality (McAbee et al., 2014). In comparison to higher-order models, bifactor models present none of these redundancies or restrictions and provide a way to explicitly separate the variance attributable to S-factors from the variance attributable to the global G-factor, while allowing for the estimation of direct relations between the items and both the S-factors and the G-factor. More precisely, bifactor models assume that the covariance among a set of n items can be explained by a set of f orthogonal factors including one G-factor and f-1 S-factors. In bifactor-CFA (B-CFA) models, each item is used to define the G-factor and one of the S-factors. Bifactor models thus partition covariance into a G-factor underlying all items and f-1 S-factors corresponding to the covariance not explained by the G-factor. This clean partitioning is made possible by the orthogonality of the factors, which forces all of the variance shared among all items to be absorbed into the G-factor and the S-factors to represent what is shared among a specific subset of items but not the others.
Interestingly, higher-order models form restricted nested versions of bifactor models. While the above-mentioned proportionality constraints implicit in higher-order models introduce some parsimony to the model, they are unlikely to hold in most research settings (Reise, 2012; Yung, Thissen, & McLeod, 1999) or to make sense theoretically (Gignac, 2016), thus positioning bifactor models as the more robust modeling procedure. Jennrich and Bentler (2011) showed that while bifactor models were able to properly recover true higher-order factor structures, higher-order factor models could not always properly recover true bifactor structures. Bifactor models should thus be preferred over higher-order models unless strong theoretical reasons are present to support the need to model the relations between the indicators and the G-factors as indirect and the presence of the implicit proportionality constraints (for a more extensive discussion of these issues, see Gignac).
Whenever a single instrument is expected to incorporate both conceptually adjacent constructs and hierarchically ordered constructs, it becomes important to rely on a model that allows for the incorporation of both cross-loadings (i.e., EFA) and G-factors (i.e., bifactor). Indeed, research has shown that unmodeled cross-loadings tend to result in inflated estimates of the G-factor in B-CFA and that an unmodeled G-factor tends to result in inflated cross-loadings in EFA (e.g., Morin et al., 2016; Murray & Johnson, 2013). Recent development of bifactor target rotation for EFA makes it possible to incorporate bifactor modeling into the ESEM framework (Reise, 2012; Reise, Moore, & Maydeu-Olivares, 2011). The resulting B-ESEM method offers the most detailed and flexible models possible, more so than either EFA or CFA/SEM alone, and can now be implemented while relying on a confirmatory bifactor target rotation procedure (Morin et al., 2016, in press).
The Present Study
In the present study, we conducted an integrated test of SDT’s continuum hypothesis of motivation combining the perspectives of (a) Guay et al. (2015; also see Litalien et al., 2015), who showed that taking into account sources of construct-relevant psychometric multidimensionality related to the assessment of conceptually related constructs was necessary to obtain a clearer representation of the continuum structure of motivation; and (b) Chemolli and Gagné (2014), who argued that the strongest evidence in favor of the SDT continuum hypothesis should come from the demonstration that all motivation items contribute to the assessment of a single overarching self-determination factor (i.e., from the observation of another source of construct-relevant psychometric multidimensionality related to the assessment of hierarchically ordered constructs). To do so, we rely on the B-ESEM framework proposed by Morin et al. (2016, in press), which allows for the simultaneous consideration of these two perspectives into a single model.
The bifactor component of this framework directly tests whether the items measuring the different types of motivation load onto a single factor with loadings ranging from negative to positive according to the expected position of the items along the SDT continuum (aligned with the perspective of Chemolli & Gagné, 2014), while allowing the estimation of S-factors for each motivation type. Essentially, should this hypothesis be supported, this G-factor is expected to provide a global estimate of the overall quantity of self-determined motivation characterizing individual employees, whereas the resulting S-factors would reflect the more specific quality, or flavor, of employees’ motivational profiles. More precisely, because of the inherent orthogonality of bifactor models, employees’ overall amount (quantity) of self-determined motivation will be reflected in the G-factor, whereas the specific features (quality) of employees’ motivational profiles left unexplained by this global amount of self-determination will be reflected in the S-factors (e.g., pleasure, guilt, pressure). The ESEM component of this framework allows us to incorporate the presence of a second layer of continuity in motivation ratings expressed through the estimation of cross-loadings between motivation factors (e.g., Morin et al., 2016), as advocated by Guay et al. (2015).
Thus, on the basis of current theory suggesting the existence of an overarching continuum of motivation (Chemolli & Gagné, 2014) and research suggesting the importance of controlling for cross-loadings between motivation factors in order to obtain a proper depiction of the underlying structure of motivation measures (Guay et al., 2015; Litalien et al., 2015), we expect the B-ESEM model to provide the most adequate representation of employees’ answers to the MWMS (Gagné et al., 2015). However, following Morin et al. (2016, in press) recommendations regarding the application of the B-ESEM framework for the identification of the sources of construct-relevant multidimensionality present in complex psychometric measures, as well as basic principles of model testing (e.g., Bollen, 1989), we contrast this a priori B-ESEM representation with more parsimonious alternative models including either none (CFA) or only one (ESEM, B-CFA) of these sources of construct-relevant multidimensionality. These four alternative models are presented in Figure 1.
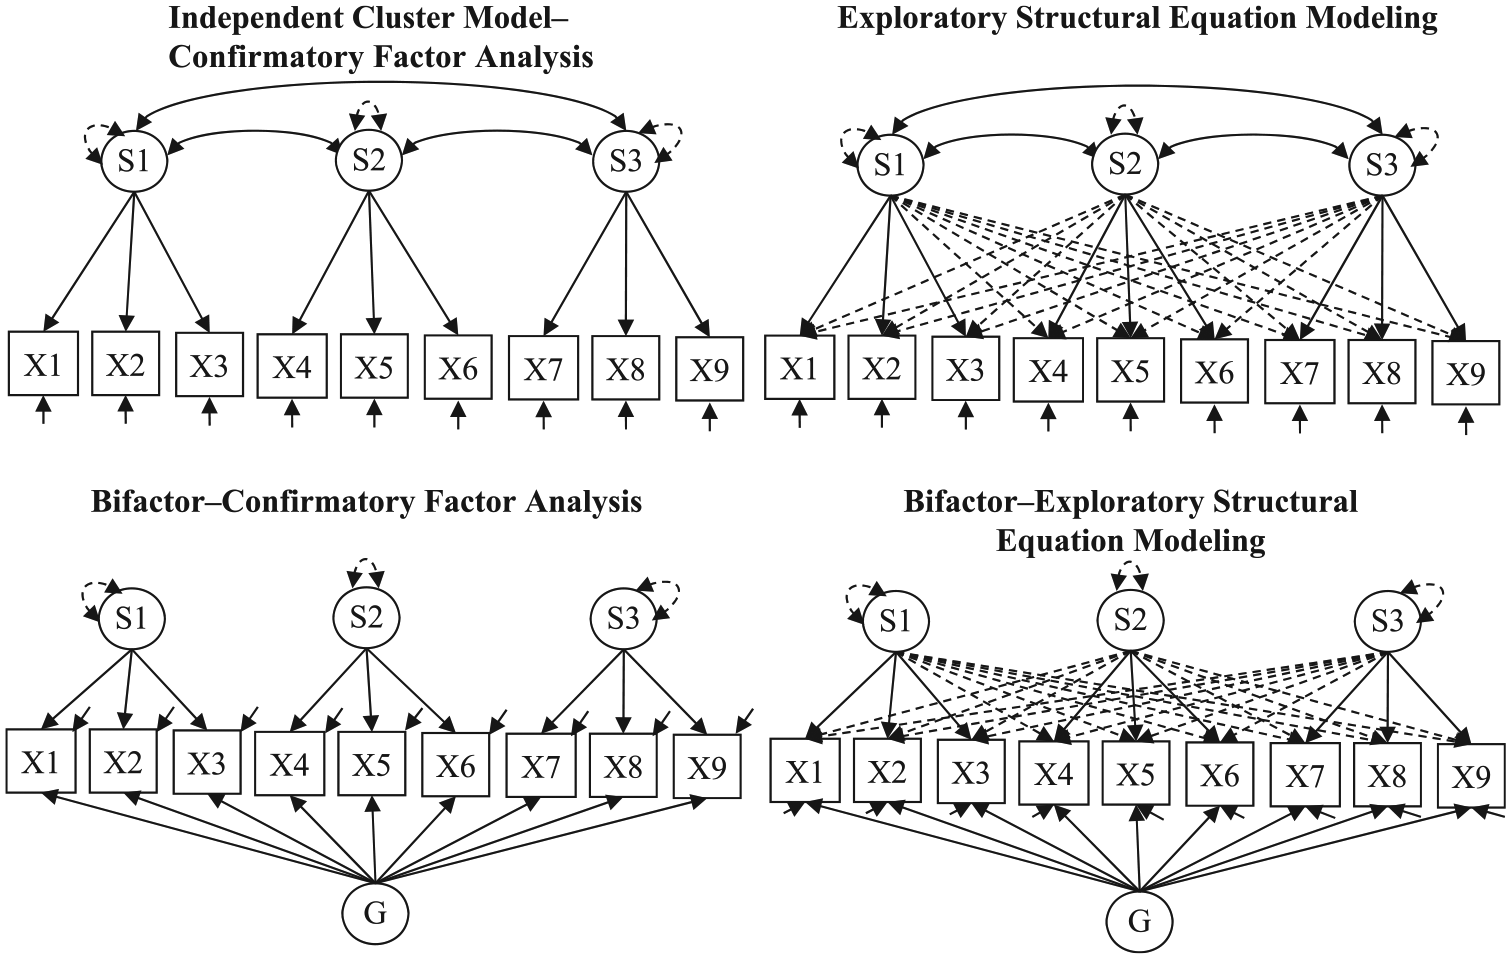
Simplified Representations of Specified Models
To establish the criterion-related validity of the resulting global (G) and specific (S) motivation factors, we also test the extent to which they are related to a series of covariates that occupy a core position in SDT theorization both generically (i.e., the satisfaction of the needs for autonomy, competence, and relatedness) and in the work context (i.e., employees’ levels of affective and continuance commitment to the organization). SDT proposes that the satisfaction of basic psychological needs for autonomy (a sense of volition), competence (the experience of mastery), and relatedness (feeling connected to others) should promote autonomous over controlled types of motivation (Deci & Ryan, 2000; Gagné & Deci, 2005). Research has found strong support for this proposition both in general and in organizational psychology (Deci & Ryan, 2000, 2008; Gagné et al., 2015).
Past research has also found rather robust relations between different types of motivation and distinct commitment mindsets (Gagné, Chemolli, Forest, & Koestner, 2008; Gagné et al., 2015). In particular, affective organizational commitment (emotional attachment to the organization; Meyer & Allen, 1997) has been positively related to autonomous (identified and intrinsic) motivation (Gagné et al., 2008), while continuance commitment (staying in the organization because of the perceived cost of leaving and lack of alternatives; Meyer & Allen) has been positively related to external regulation and negatively related to more internalized types of regulation (Battistelli, Galletta, Portoghese, & Vandenberghe, 2013; Gagné et al., 2008; Vandenberghe & Panaccio, 2012).
In order to more precisely assess the criterion-related validity of the motivational factors, we also systematically contrast models in which only the G-factor (i.e., reflecting the overall quantity of self-determined motivation) is allowed to predict the covariates with models in which the S-factors (i.e., reflecting the specific quality of motivation) are also allowed to predict the covariates. These comparisons systematically test the added value (in terms of percentage of explained variance in the covariates) that is afforded by the simultaneous consideration of motivation quantity and quality.
Method
Participants and Procedure
This study used archival data collected between 2008 and 2012 that have been previously used to validate the MWMS (Gagné et al., 2015). The current sample includes 1,124 full-time Canadian employees from a range of organizations and industries. Content of the surveys varied within data sets in terms of covariates and demographics, but all participants completed the same 19 items forming the MWMS. Employees completed confidential surveys voluntarily on an online platform or in paper format on their work premises. Additional details are provided in Gagné et al.
Measures
The MWMS (Gagné et al., 2015) includes 19 items assessing six distinct motivation types. Each item is a response to the stem “Why do you or would you put efforts into your current job?” along a 1 (not at all) to 7 (completely) Likert scale. Example items include “I don’t know why I’m doing this job, it’s pointless work” (amotivation; α = .78 in the current study), “To get others’ approval (e.g., supervisor, colleagues, family, clients . . .)” (external regulation social; α = .77), “Because others will reward me financially only if I put enough effort in my job (e.g., employer, supervisor . . .)” (external regulation material; α = .63), “Because otherwise I will feel ashamed of myself” (introjected regulation; α = .71), “Because putting efforts in this job aligns with my personal values” (identified regulation; α = .80), and “Because the work I do is interesting” (intrinsic motivation; α = .90). Validation evidence for the MWMS based on the current data set has already demonstrated adequate fit for a six-factor ICM-CFA structure (invariant across French and English languages) and acceptable scale score reliability (Cronbach’s α ranged from .70–.90 for all subscales) and supported the convergent and discriminant validity of the scales (Gagné et al.).
Need satisfaction was measured using an early version of the Work-Related Basic Need Satisfaction Scale (Van den Broeck, Vansteenkiste, Witte, Soenens, & Lens, 2010). This instrument assesses the satisfaction of the three basic needs for (a) autonomy (three items, α = .81, e.g., “I feel like I can be myself at my job”), (b) competence (three items, α = .85, e.g., “I really master my tasks at my job”), and (c) relatedness (four items, α = .82, e.g., “At work I feel part of a group”) on a 1 (totally disagree) to 5 (totally agree) Likert scale.
Affective commitment to the organization was measured using Meyer, Allen, and Smith’s (1993) organizational commitment measure (six items, α = .84, e.g., “This organization has a great deal of personal meaning to me”). Continuance commitment to the organization was measured by Stinglhamber, Bentein, and Vandenberghe’s (2002) French adaptation of the Meyer et al. measure to ensure a complete coverage of both high-sacrifice (i.e., cost of leaving) and low-alternative (i.e., lack of alternatives) facets (six items, α = .70, e.g., “I consider my job opportunities as too limited to consider leaving the organization”). All items were rated on a 1 (totally disagree) to 7 (totally agree) Likert scale.
Estimation and Specification
All models were estimated using Mplus 7.3 (Muthén & Muthén, 2014) robust maximum likelihood estimator (MLR). CFA models were specified according to ICM assumptions, with items allowed to load onto their a priori motivation factor and all cross-loadings constrained to be exactly zero. ESEM was specified using target rotation: Item loadings on their a priori motivation factors were freely estimated, and all cross-loadings were also freely estimated but “targeted” to be as close to zero as possible. B-CFA models were specified as orthogonal, with each item specified as loading on the SDT G-factor as well as on their a priori S-factors corresponding to the six distinct motivation types. Finally, B-ESEM was estimated using orthogonal bifactor target rotation: All items were used to define the SDT G-factor, while the six S-factors were defined using the same pattern of target and nontarget loadings and cross-loadings as in the ESEM solution. The current models correspond to typical bifactor specifications where all items are used to define the G-factor and one S-factor in line with theoretical expectations that all items reflect motivation types organized according to the expected continuum structure of motivation reflected in the G-factor. 1 We note, however, that hybrid models, such as models including more than one G-factor (e.g., Caci, Morin, & Tran, 2015), or models where only a subset of items are used to define the G-factor (e.g., Brunner, Lüdtke, & Trautwein, 2008) are also possible when theoretical expectations suggest that these might be more appropriate.
Covariates were then integrated to the final retained measurement model, allowing estimation of relations between the motivation factors and the covariates. In a first model, only the G-factor was allowed to covary using the ESEM-within-CFA method described by Morin et al. (2013, 2016), which allows for the estimation of relations between only a subset of B-ESEM factors (i.e., here only the G-factor) and covariates. This model simulates the common approach used in SDT of using a single motivation score (quantity; i.e., the relative autonomy index, or RAI; Fernet, Gagné, & Austin, 2010; Grolnick & Ryan, 1987; Markland & Ingledew, 2007; Pelletier, Seguin-Levesque, & Legault, 2002), which ignores the relative impact of different types (or qualities) of motivation. In a second model (relying on a regular B-ESEM representation), both the G-factor and the S-factors were allowed to predict scores on all covariates. These two models were contrasted to one another on the basis of not only goodness-of-fit information but also standardized regression coefficients and model-based estimates of the percentage of explained variance (R2) in the covariates afforded by the model.
Model Comparisons
Because of the known oversensitivity of the chi-square test of exact fit to sample size and minor model misspecifications (e.g., Marsh, Hau, & Grayson, 2005), model fit was assessed using commonly used goodness-of-fit indices and information criteria: the comparative fit index (CFI), the Tucker-Lewis index (TLI), the root mean square error of approximation (RMSEA) with its confidence interval, the Akaike information criterion (AIC), the constant AIC (CAIC), the Bayesian information criterion (BIC), and the sample-size adjusted BIC (ABIC). According to typical interpretation guidelines (e.g., Hu & Bentler, 1999; Marsh et al., 2004, 2005), values greater than .90 and .95 for the CFI and TLI, respectively, support adequate and excellent fit of the data to the model, while values smaller than .08 or .06 for the RMSEA support acceptable and excellent fit. When comparing models, changes in RMSEA, CFI, and TLI greater than .01 were deemed significant as established by Cheung and Rensvold (2002) and Chen (2007). Although they cannot be used to assess the global fit of a single model, the information criteria (AIC, CAIC, BIC, ABIC) are particularly useful in the comparison of alternative models, with lower values supporting a better fitting model. These guidelines have so far been established for CFA and have also been used in previous applications of ESEM (e.g., Marsh et al., 2009, 2014; Morin et al., 2013, 2016). However, because ESEM includes many more parameters than ICM-CFA, due to the free estimation of cross-loadings, it has been suggested that indicators including a correction for parsimony (i.e., TLI, RMSEA, AIC, CAIC, BIC, ABIC) will be critical to the assessment of model fit in an ESEM context (Marsh et al., 2009, 2010, 2014; Morin et al., 2013, 2016).
It is important to keep in mind that these remain rough guidelines for descriptive model evaluation, which also needs to take into account the even more important information coming from parameter estimates, statistical conformity, and theoretical meaningfulness (Marsh et al., 2004, 2005). Indeed, each of these models is able to absorb unmodeled sources of construct-relevant multidimensionality (e.g., Asparouhov et al., 2015; Morin et al., 2016; Murray & Johnson, 2013). For this reason, a close examination of parameter estimates and theoretical conformity is necessary to select the best alternative among a series of models as simple goodness-of-fit assessment is often insufficient to differentiate among models that often provide similar levels of fit to the data (Marsh, Liem, Martin, Morin, & Nagengast, 2011; Morin et al., 2016). Morin et al. (2016, in press) suggest to start with a comparison of CFA and ESEM solutions. In this comparison, as long as the factors remain well defined by strong target factor loadings, the key issue is related to the factor correlations. Statistical evidence that ESEM tends to provide more exact estimates of true factor correlations (Asparouhov et al.) suggests that ESEM should be retained whenever the results show a discrepant pattern of factor correlations. Otherwise, the CFA model should be preferred based on parsimony. Then, the second comparison involves contrasting the retained model with its bifactor counterpart (B-CFA or B-ESEM). Here, the key elements favoring a bifactor representation are the observation of a G-factor that is well defined by strong factor loadings and the observation of reduced cross-loadings in B-ESEM compared to ESEM.
Results
Measurement Models
Table 1 presents the goodness-of-fit indices and information criteria associated with each of the estimated models. The ICM-CFA demonstrated marginally adequate fit, whereas the B-CFA did not. In contrast, the ESEM solution provided an excellent representation to the data according to all indices and provided a better representation than the ICM-CFA solution on the basis of lower scores on the information criteria and substantial improvement on the goodness-of-fit indices (ΔCFI = .05; ΔTLI = .06; ΔRMSEA = –.02). Furthermore, the 90% confidence intervals for the RMSEA showed no overlap between the CFA and ESEM solutions, indicating a high degree of differentiation between competing models. Finally, although the B-ESEM solution provided an excellent representation of the data, it displayed only marginal improvement relative to the ESEM solution according to goodness-of-fit indices (ΔCFI < .01; ΔTLI = .01; ΔRMSEA = –.01), overlapping confidence intervals for the RMSEA, and almost identical values for the information criteria. However, this model resulted in a nonsignificant chi-square value suggesting that it is the only model providing exact fit to the data. However, no analysis should be conducted in disconnection from theory, expectations, and a detailed examination of parameter estimates (Marsh et al., 2014; Morin et al., 2016).
Goodness of Fit Statistics and Information Criteria
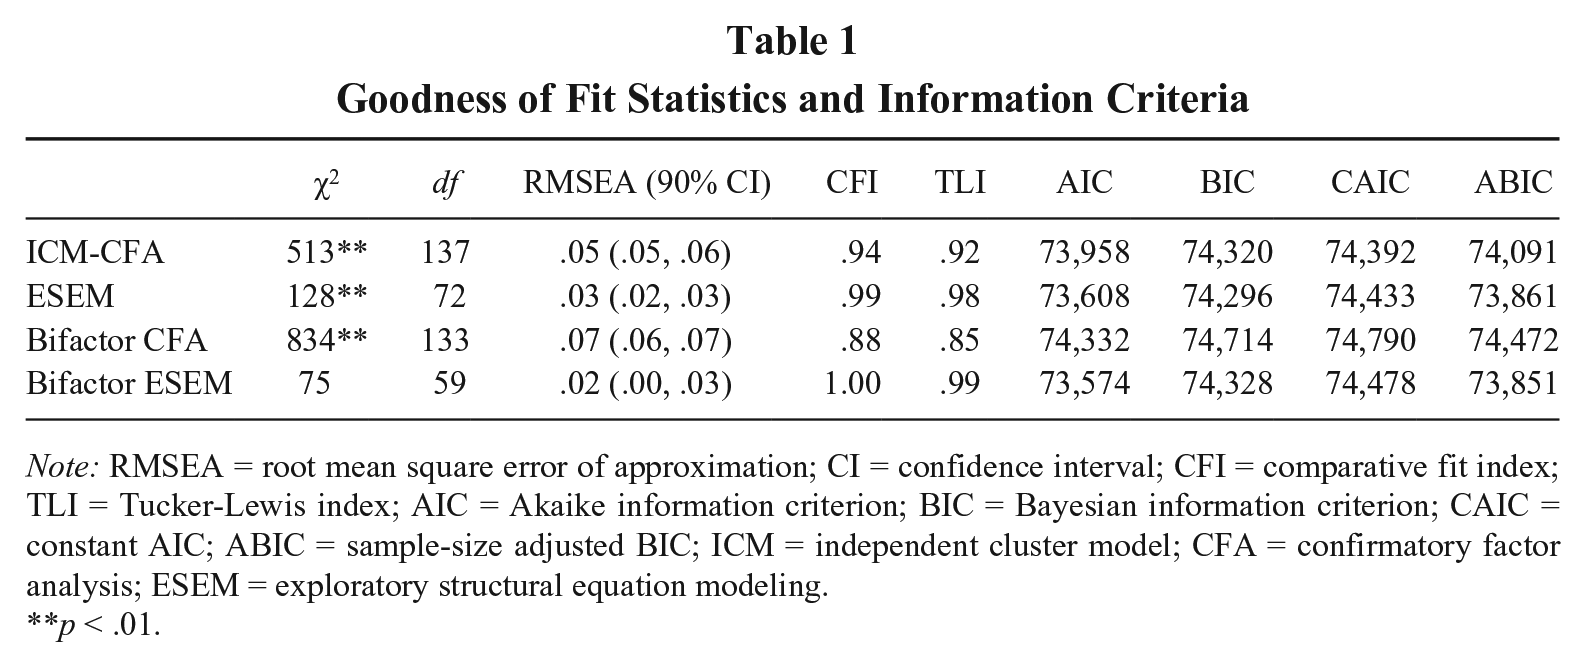
Note: RMSEA = root mean square error of approximation; CI = confidence interval; CFI = comparative fit index; TLI = Tucker-Lewis index; AIC = Akaike information criterion; BIC = Bayesian information criterion; CAIC = constant AIC; ABIC = sample-size adjusted BIC; ICM = independent cluster model; CFA = confirmatory factor analysis; ESEM = exploratory structural equation modeling.
p < .01.
Because the data did not fit the B-CFA model to even a minimally acceptable standard, and following Morin et al. (2016, in press) recommendations, we first turn to a comparison of ICM-CFA and ESEM before moving on to the B-ESEM solution. Before doing so, however, it is worth noting that on the strict basis of goodness-of-fit assessment showing the superiority of the ESEM and B-ESEM solutions when compared to the ICM-CFA and B-CFA solutions, cross-loadings are clearly to be expected in the solution. Because of this, factor correlations are expected to be higher in the ICM-CFA model compared to the ESEM models as this is the only way through which these cross-loadings can be expressed. Because the B-CFA model is orthogonal, however, the only way for these omitted cross-loadings to be expressed is through an inflated estimate of the factor loadings on the G-factor (Morin et al., 2016), which is unlikely to be sufficient to compensate for this source of misfit should the cross-loadings reflect another source of multidimensionality than the presence of an underlying global construct. This explains why the fit of the B-CFA model was lower and less adequate than that of the ICM-CFA.
Parameter estimates for ICM-CFA and ESEM are reported in Tables 2 (correlations) and 3 (factor loadings, cross-loadings, and uniquenesses). Looking first at the loadings and cross-loadings, the overall size of the factor loadings of the items on their target factors remained similar in the ICM-CFA (λ = .50 to .90; M = .69) and ESEM (λ = .37 to .93; M = .65) solutions, showing well-defined factors corresponding to a priori expectations. In the ESEM solution, target factor loadings systematically remained higher than cross-loadings, which generally remained very small (|λ| = 0 to .37; M = .02). In fact, only two cross-loadings were higher than .30: Item 1 of identified regulation (“Because I personally consider it important to put effort into this job”) cross-loaded on the introjected regulation factor at .37, and Item 2 of introjected regulation (“Because it makes me feel proud of myself”) cross-loaded on the identified factor at .31. Closer inspection suggested no pattern of larger cross-loadings between adjacent factors and smaller or more negative cross-loadings between more distant factors, providing weak support for the continuum hypothesis at the cross-loading level.
Standardized Factor Correlations for the Independent Cluster Model–Confirmatory Factor Analysis and Exploratory Structural Equation Modeling Solutions
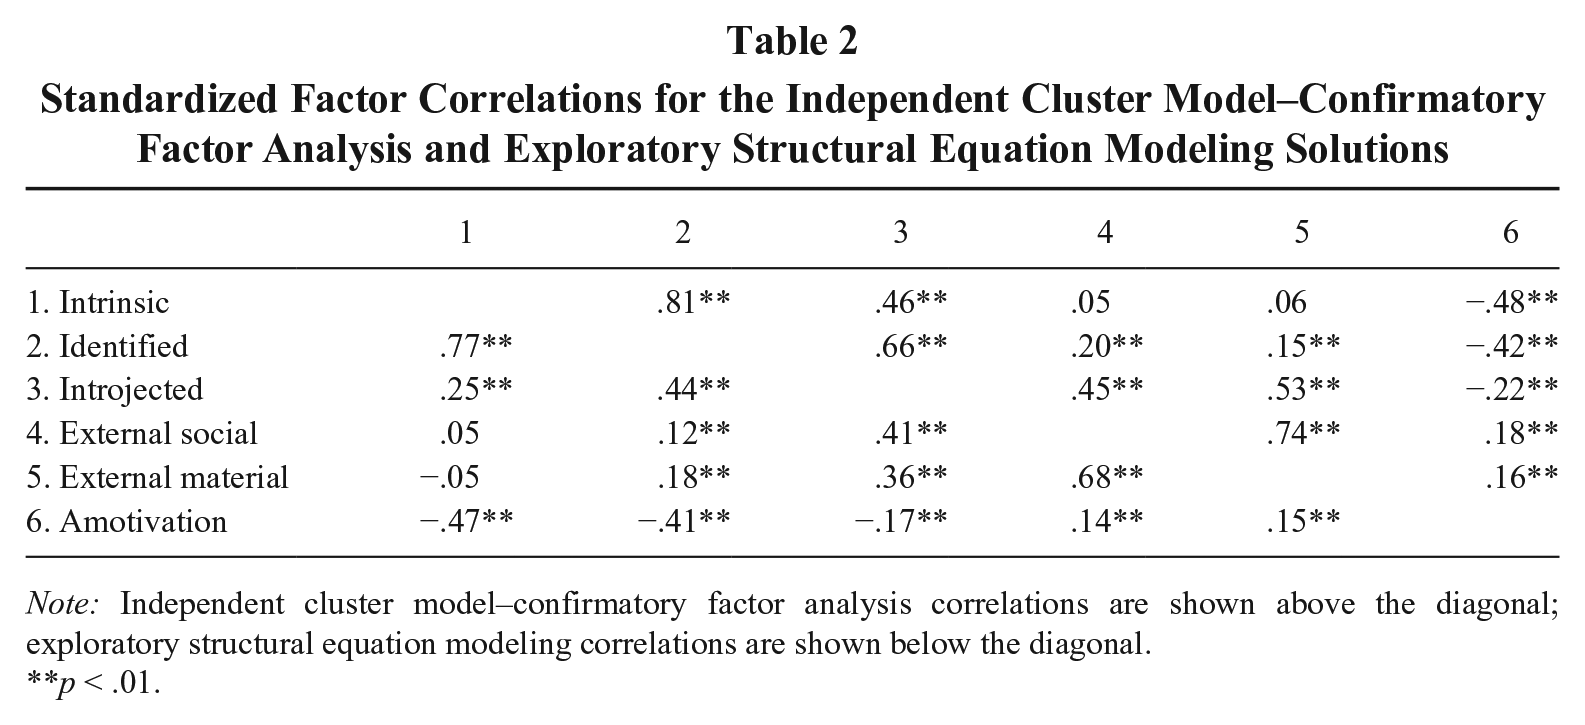
Note: Independent cluster model–confirmatory factor analysis correlations are shown above the diagonal; exploratory structural equation modeling correlations are shown below the diagonal.
p < .01.
Standardized Factor Loadings (λ) and Uniquenesses (δ) for Independent Cluster Model–Confirmatory Factor Analysis (ICM-CFA) and Exploratory Structural Equation Modeling (ESEM)
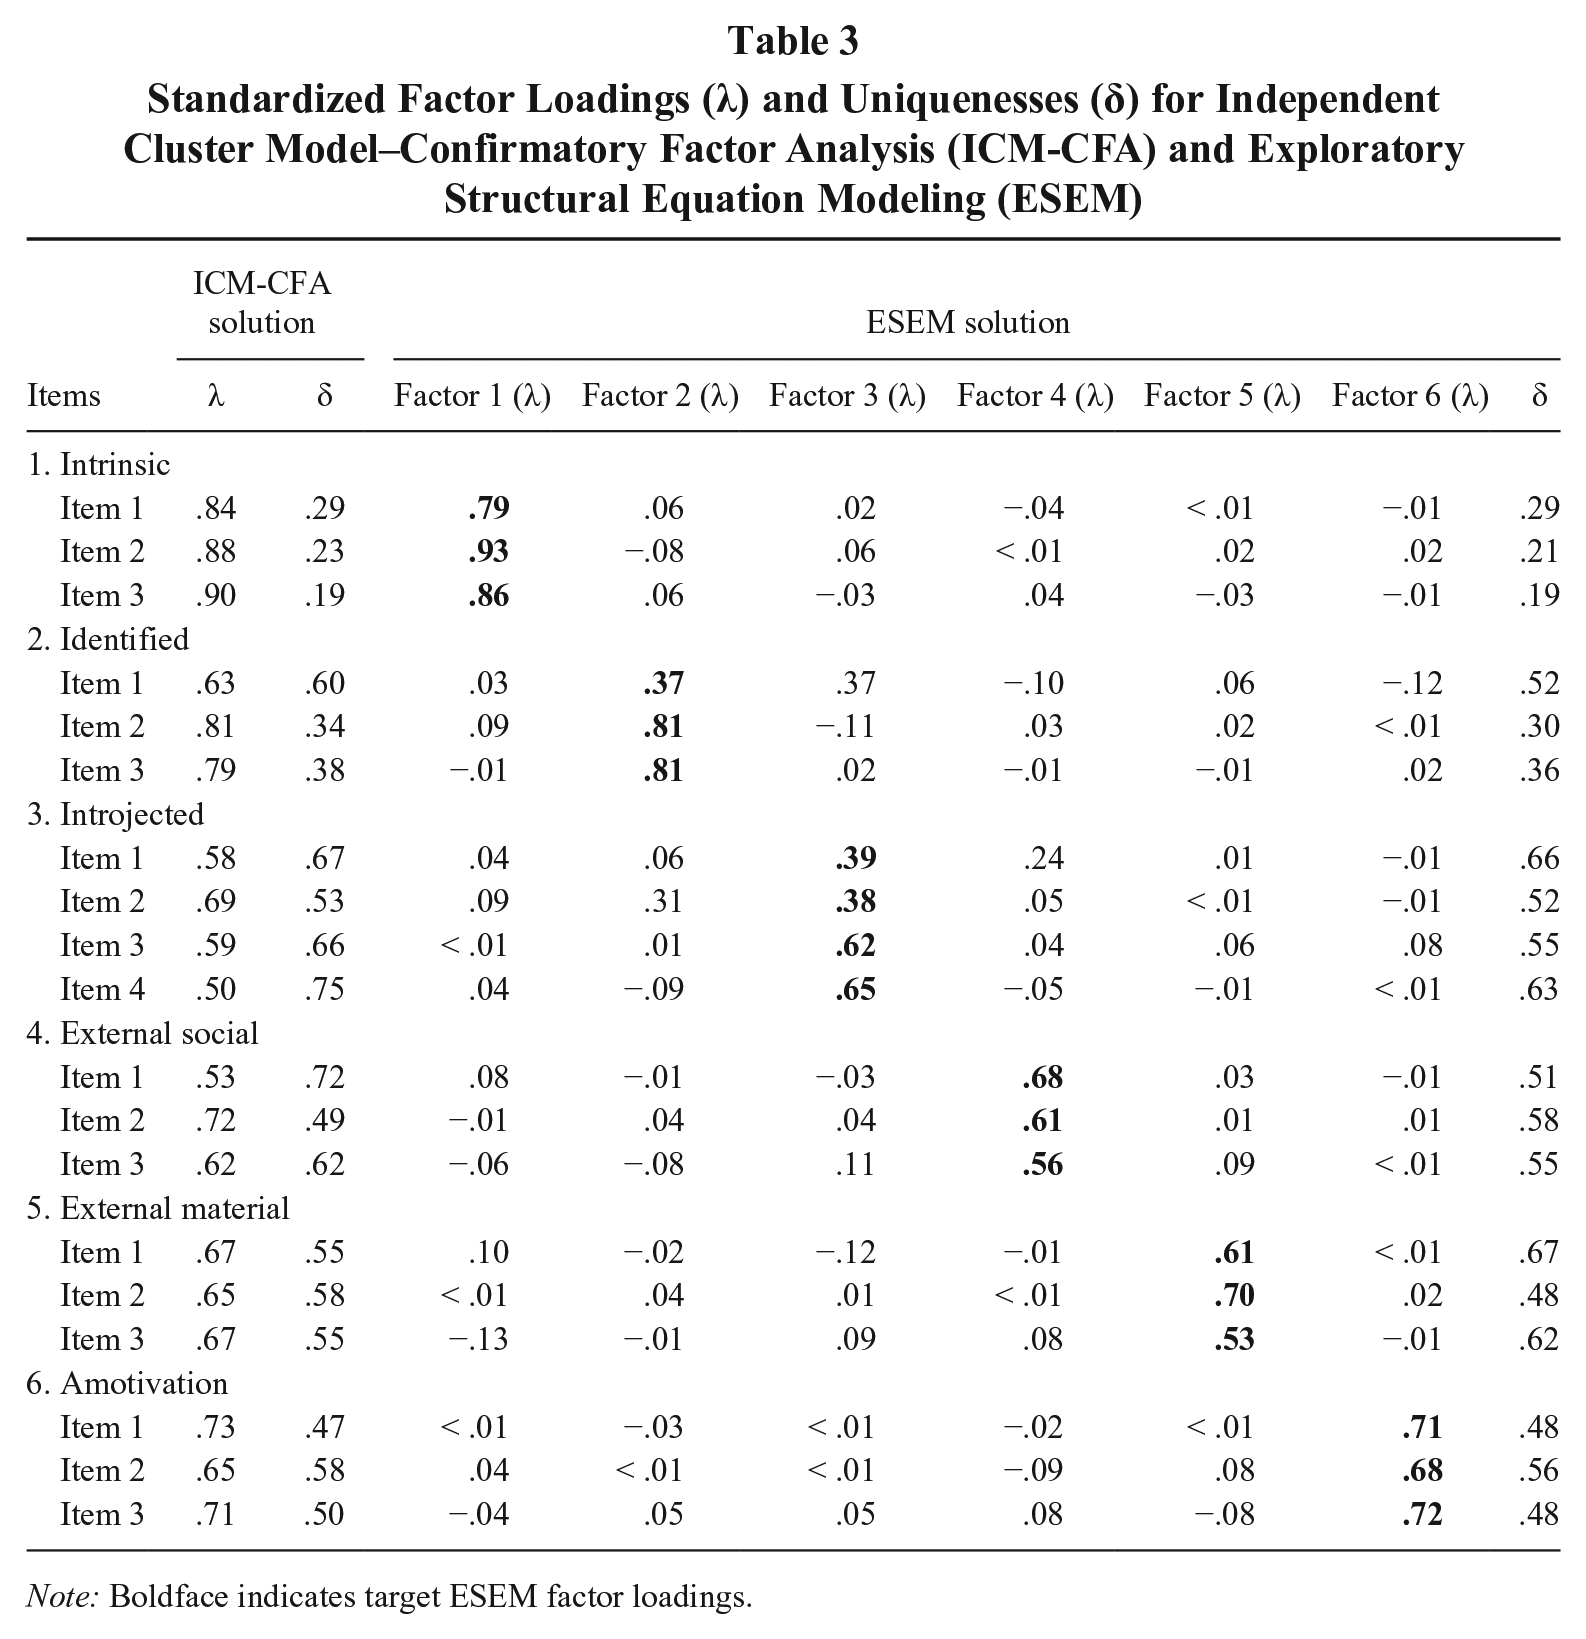
Note: Boldface indicates target ESEM factor loadings.
As expected, factor correlations proved to be slightly lower in ESEM (r = –.47 to .77; |M| = .31) than ICM-CFA (r = –.48 to .81; |M| = .37). 2 The overall pattern of those correlations, however, was not changed by the decision to rely on an ICM-CFA or ESEM solution. A closer examination of these correlations reveals that they match the continuum hypothesis relatively well, being stronger between conceptually closer factors than between conceptually distant factors. Additionally, the amotivation factor appears to represent one end of the hypothesized continuum, showing generally negative correlations with more autonomous forms of motivation (intrinsic and identified), a smaller correlation with introjected regulation, and positive correlations with the social and material forms of external regulation (with a slightly larger correlation for the material factor than for the social factor).
Looking at the B-ESEM solution, we already noted that it represented the data quite well and provided an exact fit to the data. It is interesting to note that typical (i.e., orthogonal) representations of bifactor models attempt to synthetize the covariance (i.e., correlations) among factors through the estimation of a single G-factor and to keep in mind that the ESEM correlations generally supported the continuum hypothesis. As such, a key advantage of the B-ESEM model in comparison to the ESEM model, in addition to its exact fit to the data, is that it provides a single directly interpretable self-determination G-factor. Interestingly, results from the B-ESEM solution (see Table 4) revealed a well-defined G-factor representing general self-determination. This G-factor follows the idea of a continuum underlying motivation: The loadings on the G-factor were high and positive for the items associated with autonomous motivation (λ = .71 to .75 for intrinsic motivation and .56 to .79 for identified regulation), moderate for the items associated with introjected regulation (λ = .26 to .61), lower for the items associated with external–social regulation (λ = .02 to .21), small or negative for the items associated with external–material regulation (λ = –.07 to .25), and negative for the items associated with amotivation (λ = –.35 to –.30).
Standardized Factor Loadings (λ) and Uniquenesses (δ) for Bifactor Confirmatory Factor Analysis and Bifactor Exploratory Structural Equation Modeling
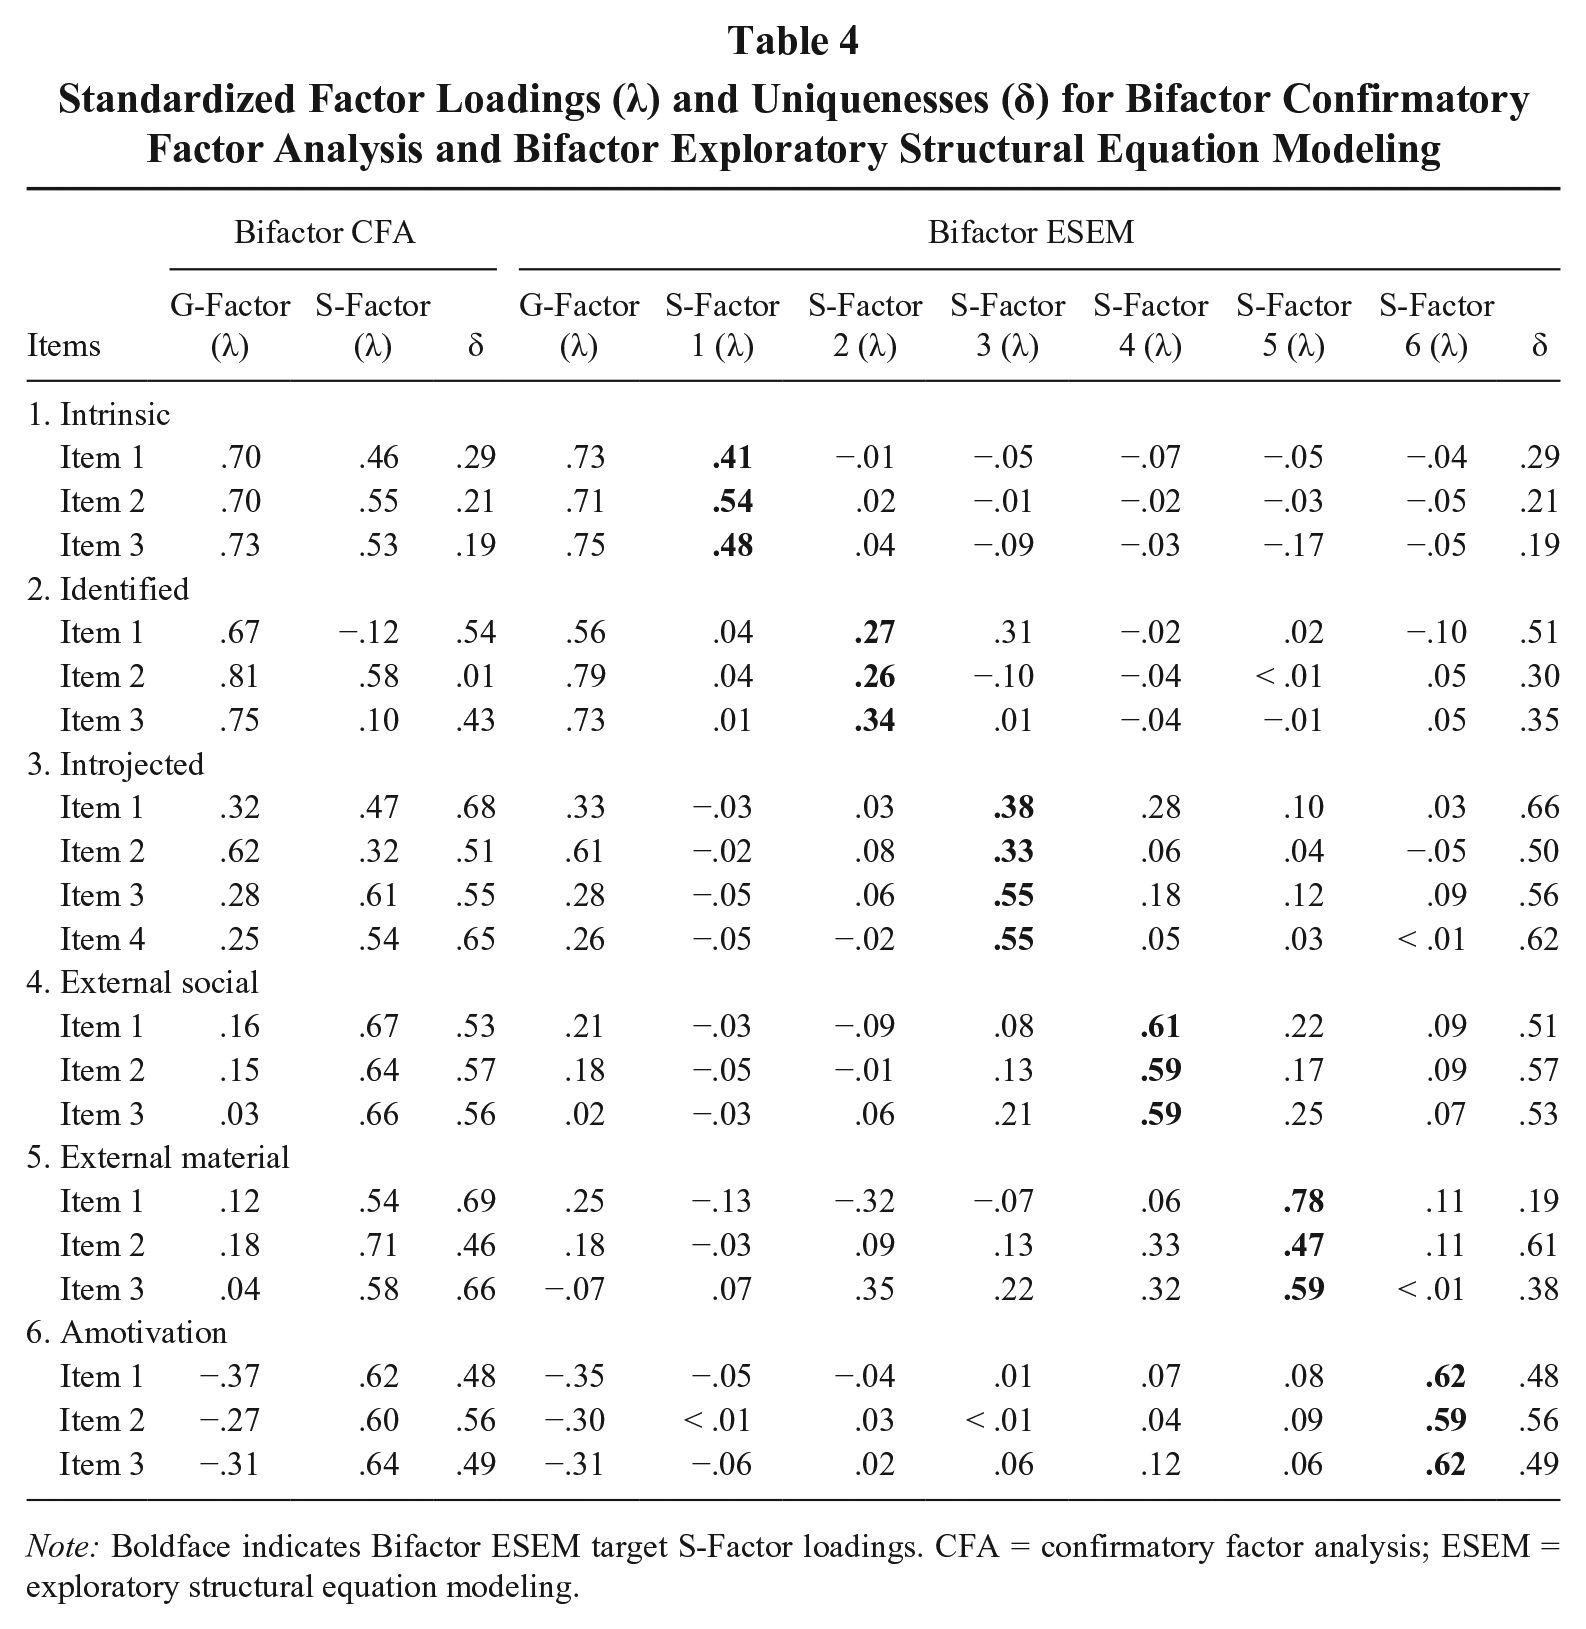
Note: Boldface indicates bifactor ESEM target S-factor loadings. CFA = confirmatory factor analysis; ESEM = exploratory structural equation modeling.
Further examination of this solution reveals reasonably low cross-loadings, remaining lower than target loadings (|λ| < .01 to .33; M = .08), and reasonably well-defined S-factors (λ = .26 to .78; M = .50), with very few noteworthy exceptions. Importantly, the cross-loadings tended to be smaller in the B-ESEM solution than in the ESEM solution, suggesting that part of the ESEM cross-loadings reflected the presence of the unmodeled G-factor. It is also interesting to note that the S-factors located at the ends of the continuum (amotivation, external-social regulation, external-material regulation, and intrinsic motivation; λ = .41 to .78; M = .57) retained substantial specificity once the covariance attributed to the self-determination G-factor was taken into account. Conversely, the S-factors located toward the midpoint of the continuum (identified and introjected regulation; λ = .26 to .55; M = .38) retained less specificity once the general self-determination G-factor was taken into account. On the basis of the evidence presented thus far, in terms of exact fit to the data but most importantly theoretical conformity of the parameter estimates, the final retained model is the B-ESEM model. In practical terms, this model also provides a way to simultaneously take into account all motivation factors (motivation quality), together with a global estimate of the quantity of self-determined motivation into a single predictive model, and to do so without having to rely on a psychometrically suboptimal RAI.
Predictive Models
From the final retained B-ESEM solution, analyses were used to assess the criterion-related validity of the various motivation factors. More precisely, these models were used to compare the added value of the specific motivation facets (representing the specific quality of employees’ motivational profiles) over and above the G-factor (representing overall quantity of self-determined motivation) in terms of percentages of explained variance in the various covariates considered. This comparison was achieved by contrasting a model in which only the G-factor was allowed to predict scores on the covariates with a model in which both the G-factor and the S-factors were allowed to predict scores on the covariates. As shown in Table 5, when considered as the sole predictor of covariates, the self-determination G-factor was significantly associated, as expected, with higher scores on the affective commitment mindset (explaining 38% of its variance), as well as on the satisfaction of the needs for autonomy (R2 = 15%), competence (R2 = 1%), and relatedness (R2 = 15%). It was not significantly associated with continuance commitment.
Relations With Covariates: Standardized Coefficients
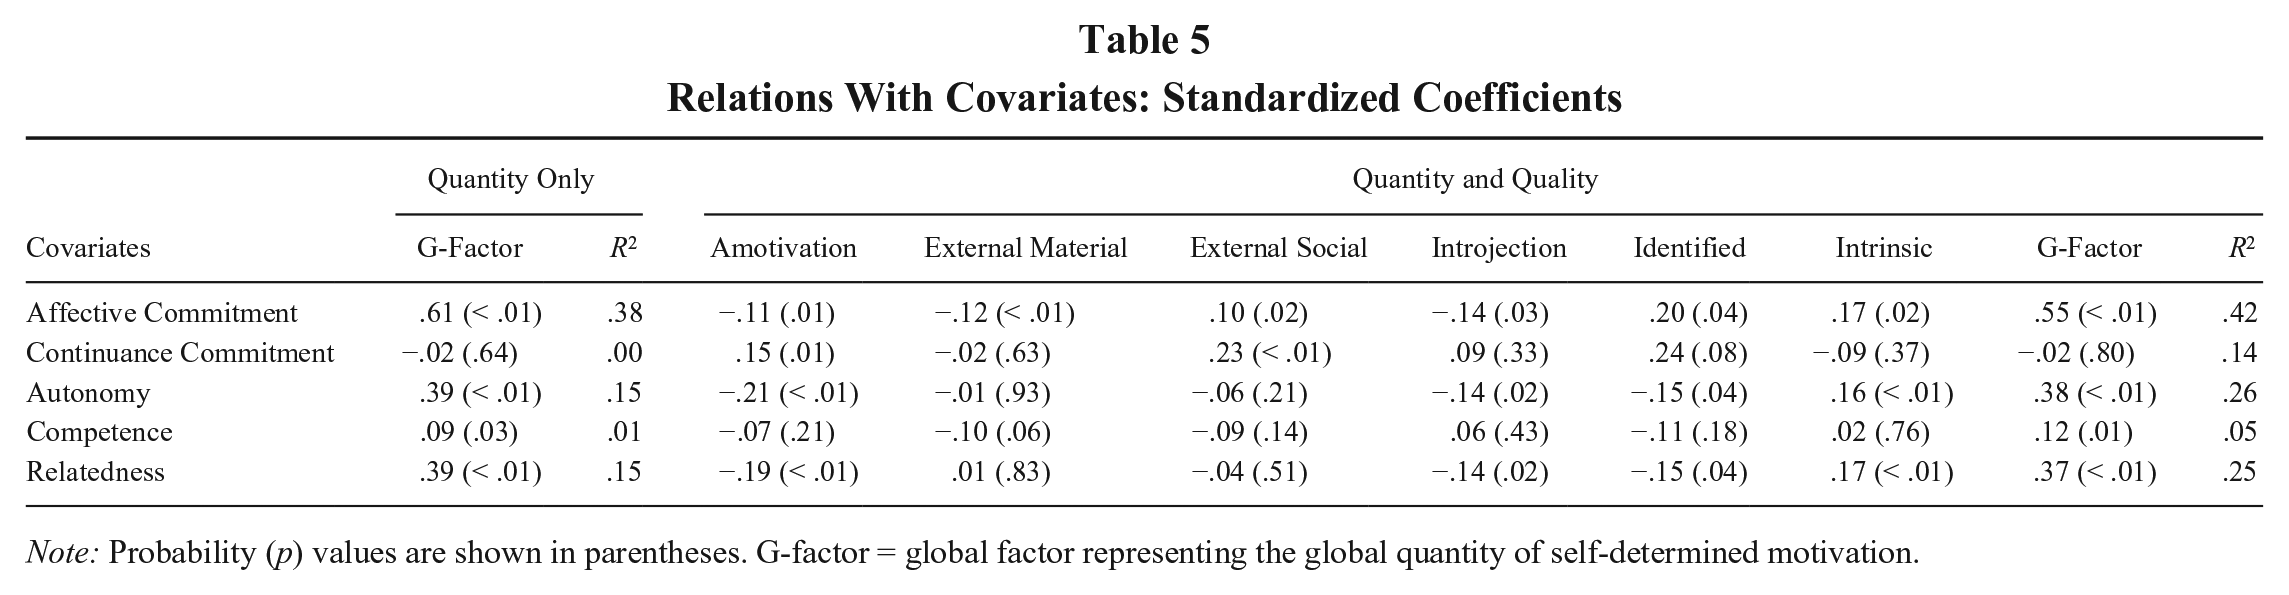
Note: Probability (p) values are shown in parentheses. G-factor = global factor representing the global quantity of self-determined motivation.
These relations were all maintained in the next model where the S-factors were also allowed to relate to the covariates. This more complete model resulted in visible increases in explained variance in the various covariates: (a) from 38% to 42% for affective commitment, (b) from 0% to 14% for continuance commitment, (c) from 15% to 26% for the satisfaction of the need for autonomy, (d) from 1% to 5% for the satisfaction of the need for competence, and (e) from 15% to 25% for the satisfaction of the need for relatedness. These increases in percentages of explained variance were also accompanied by increases in goodness of fit (complete model: CFI = .99, TLI = .98, RMSEA = .02; restricted model where only the G-factor relates to the covariates: CFI = .98, TLI = .98, RMSEA = .03).
Interestingly, relations observed between the S-factors and the covariates appeared to be partly in line with our expectations, showing that continuance commitment was mainly, and positively, associated with levels of amotivation and external-social regulation. Contrary to our expectations, continuance commitment and external-material regulation were not significantly related. In contrast, and fully in line with our expectations, affective commitment was significantly, and negatively, associated with levels of amotivation, external-material regulation, and introjected regulation but positively associated with identified and intrinsic motivation, as well as with the G-factor. However, we also noted an unexpected positive relation between affective commitment and external-social regulation.
With regard to need satisfaction, the results are also essentially in line with our expectations that all three needs would be positively related to the more autonomous forms of motivation. Indeed, significant positive relations between the satisfaction of the needs for autonomy and relatedness and motivation factors were limited to intrinsic motivation and to the G-factor, whereas they were strictly limited to the G-factor for the need for competence. Moreover, relations between satisfaction of the needs for autonomy and relatedness were significant and negative with amotivation, introjection, and even identified regulation.
Discussion
The present study had the dual objective of testing SDT’s continuum hypothesis of motivation (Deci & Ryan, 1985) using ratings obtained on the MWMS (Gagné et al., 2015), while demonstrating the usefulness of the B-ESEM framework for management research. Support for the continuum hypothesis of motivation has been at best inconsistent in previous research (Chemolli & Gagné, 2014; Gagné et al.; Guay et al., 2015; Litalien et al., 2015; Mallett et al., 2007). In particular, recent studies relying on more systematic tests of this hypothesis using ESEM (Guay et al.; Litalien et al.) and Rasch analysis (Chemolli & Gagné) respectively showed weak or no support for the continuum hypothesis. In the current study, we relied on a newly developed overarching B-ESEM framework, which combines the logic of previous analyses conducted by Guay et al. and Chemolli and Gagné to conduct a more comprehensive test of the SDT continuum hypothesis.
Using this framework, the SDT continuum could be expressed in three different manners. First, SDT’s continuum can be evidenced by the observation of ICM-CFA or ESEM factor correlations corresponding to the expected simplex pattern, showing larger correlations between conceptually adjacent motivation factors and smaller or negative correlations between conceptually distant factors (Guay et al., 2015; Litalien et al., 2015). In the current study, the ICM-CFA/ESEM correlations provided support for SDT’s continuum hypothesis, showing stronger correlations between conceptually adjacent factors and smaller or negative between more conceptually distal factors. Second, the SDT’s continuum can be evidenced by the observation of ESEM or B-ESEM cross-loadings that are larger and positive between conceptually adjacent motivation factors and smaller or negative between conceptually distant factors (Guay et al.; Litalien et al.). In the current study, the results did not support this proposition as cross-loadings were uniformly small and evidenced no clear pattern of loading more highly on theoretically closer S-factors. Third, the strongest evidence in favor of SDT’s continuum hypothesis could come from the observation that the G-factor estimated as part of the B-CFA or B-ESEM solutions is characterized by a pattern of target loadings from the items associated with the motivation types corresponding to the continuum assumptions of SDT (e.g., Chemolli & Gagné, 2014). In the current study, the G-factor loadings were largely in line with the presence of an underlying continuum of motivation. Given that the B-ESEM model was retained for final interpretation, these results support the notion that motivation types follow an underlying continuum.
However, although our results provide strong evidence that motivation types follow a continuum structure globally aligned with SDT hypothesis, the observed continuum structure is not completely in agreement with SDT assumptions that external and introjected regulations should load negatively on a continuum factor. Such a factor structure would represent what has been described in SDT as “relative self-determination” (Grolnick & Ryan, 1987). Instead, the introjection subscale loaded positively on the G-factor and the external regulation subscales loaded weakly but positively. As such, the factor loadings on the G-factor rather seem to represent a general quantity of self-determination (rather than relative self-determination), as they ranged from strongly positive for autonomous motivation items, to slightly positive for introjected items, to nonsignificant for external regulation items, to moderately negative for amotivation items. The pattern of factor loadings on the S-factors also suggested that while the subscales may be ordered in a predictable fashion, each still provided relevant unique information. As such, although our results support the presence of a continuum structure of motivation as proposed by SDT, they also suggest a need to revise the exact nature of this theoretical continuum, pending replication of the present results.
Turning now to the methodological contribution of this research, the results revealed that the data fit the ESEM representation better than the ICM-CFA model. This suggests that even the small cross-loadings present in the current data were enough to cause significant model misspecification. These cross-loadings are not surprising given the conceptually fine distinction between motivation types. Accounting for conceptual relatedness between the motivation types resulted in a significantly better fitting model but also in more precise estimates of the factor correlations (Marsh et al., 2013; Morin et al., 2016, in press; Sass & Schmitt, 2010; Schmitt & Sass, 2011).
The estimated factor correlations were slightly lower in the ESEM solution than in the ICM-CFA solution. While not directly relevant to this study, where the final retained model was a B-ESEM model, this discrepancy in correlation estimates could have significant implications if these latent factors were used in prediction. Indeed, relying on ICM-CFA would introduce unnecessary multicollinearity (Asparouhov et al., 2015), which may explain why there are few published studies that use all of the separate motivation subscales in predictive regression or SEM models. Instead, many SDT studies typically rely on a single RAI (Grolnick & Ryan, 1987) or on two higher-order factors of autonomous and controlled motivation (e.g., Gillet, Gagné, Sauvagère, & Fouquereau, 2013).
The data did not fit the B-CFA model as well as the other models. This was most likely the result of suppressing cross-loadings, which has been shown in past research to be problematic (Morin et al., 2016), especially for measures of conceptually close constructs, such as motivation types (Guay et al., 2015). Given the orthogonality of this solution, these cross-loadings could be expressed only through an inflation of the loadings on the G-factor. Thus, the relatively poor fit of the B-CFA solution, and the superior fit of the B-ESEM solution, supports the idea that these cross-loadings are needed to reflect the presence of conceptually related constructs that could not entirely be captured by an overarching G-factor. Indeed, the B-ESEM displayed excellent fit and revealed a pattern of factor loadings on the G-factor that supports the presence of a continuum structure of motivation.
Importantly, a key practical and theoretical advantage of the B-ESEM model is that it provided an explicit expression of the expected self-determination continuum (rather than implicitly assuming its existence through an eyeballing of factor correlations). More precisely, the B-ESEM solution has the advantage of providing a directly interpretable latent estimate of overall self-determined motivation and of allowing explicit tests of whether the S-factors (reflecting the residual variance attributable to qualitatively different motivation types over and above the global self-determined motivation factor) contribute to the prediction of meaningful outcomes over and above this global self-determined motivation factor. Pending replication of the current results, this advantage clearly suggests that this method should be given careful attention in future research in which the objective is to assess relations between self-determined motivation and various predictors, covariates, and outcomes.
Through the incorporation of covariates into the final retained B-ESEM model, the current study was uniquely able to test the criterion-related validity of the G- and S-factors and to examine the degree to which the global quantity of self-determined motivation and the more specific qualities of motivation over and above this G-factor explained variability in the covariates. Our results clearly showed the added value of considering these specific motivation facets over and above the global quantity of self-determined motivation. Specifically, across all covariates, the results showed that the complete model consistently resulted in a higher proportion of explained variance in the covariates when compared to the model in which only the G-factor was allowed to associate with covariates.
Furthermore, the simplified quantity-only model failed to recognize key directional differences between the various forms of regulation. For example, amotivation, external-material, and introjected regulations all displayed negative relations with affective commitment, whereas external-social regulation did not. This result is important as it suggests that the regulations proposed by SDT are not always associated with covariates in a manner that directly and linearly follows their expected position on the continuum but, rather (once the global quantity of self-determination is taken into account), are qualitatively different from one another to the extent of presenting differentiated patterns of relations with covariates. Similarly, when examining continuance commitment, which was not related to the G-factor, the quantity-only model contributed to hide valuable information, such as a positive relation with external-social regulation and a negative association with amotivation. It appeared that quantity of self-determined motivation had essentially no association with continuance commitment, whereas qualities specific to external social and amotivation were significantly associated with this covariate. These examples demonstrate the importance of recognizing and modeling both the quantity and quality of motivation in not only explaining more variance in covariates but also creating a more detailed picture of the relations between covariates and motivation.
The results, when considered together, suggest that though there is evidence for a continuum structure underlying of motivation, important information would be lost if we were to assume that all motivation types can be summarized within a single (latent or manifest) score reflecting a self-determination continuum, such as the RAI. More precisely, it is critical to note that although the current results support “a” continuum of self-determination, they do not represent “the” classical representation of the SDT continuum hypothesis (see above discussion) and clearly do not support the way this hypothesis has been used to justify the use of difference scores to combine all motivation types into a single RAI (see Chemolli & Gagné, 2014, for an in-depth discussion of the RAI). More precisely, the RAI is typically calculated by subtracting scores on the external and introjected regulation subscales from the scores on the identified and intrinsic motivation subscales to obtain a single indicator of self-regulation. When amotivation is included, it is also given a negative weight. Results from this study clearly show that this mode of calculation is flawed given that very few loadings on the G-factors are negative, with the sole exception of those involving amotivation. Instead, it appears that in order to fully utilize the richness of information inherent within SDT, it is important to take into account both the quantity of self-determination and the specific effects of individual regulations.
The resulting B-ESEM structure provides an alternative approach that allows for the simultaneous consideration of the global quantity of self-determined motivation together with all qualitative variations along the SDT continuum in a single model not tainted by multicollinearity. These findings have important implications for SDT in explicitly showing that individual regulations do provide valuable information both in terms of increasing the amount of variance accounted for by the models and in terms of providing more theoretical precision regarding the nature of the observed relations with key covariates. Two recommendations emerge out of these results. First, the continuum hypothesis could be revised to focus on the global “quantity of self-determined motivation” rather than on “relative autonomy.” Second, researchers using SDT should not ignore quality over quantity in motivation research, as both aspects were shown to have complementary predictive power and are themselves meaningful factors. B-ESEM models provide researchers with the means to take into account both quality and quantity of self-determined motivation. In the current study, both the general G-factor and the S-factors were used as both were theoretically pertinent to the hypotheses under examination. The decision to contrast predictive models including only the G-factor to predictive models including both the G-factor and the S-factors aimed to illustrate the loss of information related to the reliance on a simplified “quantity-only” representation of human motivation. Still, it should be kept in mind that bifactor models are essentially designed to represent theoretically meaningful G- and S-factors estimated from the same set of items whenever there are reasons to expect the presence of construct-relevant multidimensionality due to the presence of hierarchically ordered constructs. As such, it is part of the inherent theoretical logic of bifactor models that all factors need to be incorporated in further predictive models. In contrast, alternative models are available whenever there is a need to control for theoretically meaningless, or construct irrelevant, sources of multidimensionality in a measure, such as models incorporating correlated method factors (Eid, 2000) or models incorporating a G-factor aiming to control for shared response tendencies in the estimation of meaningful correlated factors (Podsakoff, MacKenzie, Lee, & Podsakoff, 2003).
Limitations and Directions for Future Research
The present study is not without limitations. First, though our sample was large, it was limited to Canadian employees and to a handful of different work settings. As such, future research should aim to replicate the current study to samples including more job types, work conditions, and cultures. Chemolli and Gagné (2014) noted through a review of the literature covering different life domains (including work, sport, and education) that the pattern of correlations between the motivation subscales appears to be more variable across studies than SDT predicts. This variability may be due to different scales being used to assess motivation but also possibly may be moderated by contextual factors, such as life domain (e.g., work, sport, education) and work conditions. Meta-analytic examination of these correlations across domains would help elucidate this issue. Similarly, although not directly relevant to organizational research, it is also critical, from the perspective of SDT, to see whether the present results replicate across different levels of analyses (e.g., state vs. domain; Vallerand, 1997), life periods, contexts, and activities (Guay et al., 2015; Pelletier, Rocchi, Vallerand, Deci, & Ryan, 2013; Vallerand et al., 1992).
Another potential direction for future research will be the introduction of Bayesian models in which prior knowledge of cross-loadings could be directly specified and incorporated to the estimated models (Muthén & Asparouhov, 2012). This method provides a way to achieve a balance between accounting for the most influential cross-loadings while at the same time retaining greater parsimony in areas where knowledge has advanced enough to afford a priori predictions regarding the nature of these most significant cross-loadings. In these contexts, it is important to note that a key advantage of Bayesian methods is that the use of model priors does not completely constrain the estimation of the model, thus allowing for unexpected cross-loadings to be incorporated (Muthén & Asparouhov). While promising, this approach will require more research into identifying expectable cross-loadings and is not without limitations (e.g., no clear goodness-of-fit information, approximate invariance constraints). For a comprehensive coverage of ESEM versus Bayesian SEM models, we refer readers to Gucciardi and Zyphur (2016). However, it is important to reinforce that, irrespective of parsimony, current evidence suggests that there is no risk to adopting an ESEM parameterization of the data even when no cross-loadings are present in the population model (Asparouhov et al., 2015).
Conclusion
Methodologically, this study demonstrated the use of the relatively new B-ESEM framework for organizational researchers by showing how it can help to provide a more precise test of SDT’s continuum hypothesis. Substantively, our results inform the value of postulating a continuum structure underlying the motivation types on both theoretical and practical grounds. There has been mixed support for a continuum structure, as past research has mostly used insensitive tests of the continuum structure (see Chemolli & Gagné, 2014). Recent research, including the current study, has used more stringent techniques to test this assumption with mixed results (Chemolli & Gagné; Guay et al., 2015; Litalien et al., 2015). The current study provided clearer support for a continuum structure of motivation, though this continuum is not completely in line with the way it is postulated in SDT. However, criterion-related tests revealed that relying solely on a single latent motivation construct results in the loss of critical information specific to each motivation type.
In practice, the continuum hypothesis has led researchers to use the RAI. Not only is this formulaic motivational construct not supported by the factor structure obtained in the current study, nor by results of previous research (e.g., Chemolli & Gagné, 2014), but the results also show that relying on a single construct representing quantity of self-determined motivation is insufficient to fully explain motivational covariates. Rather, our results demonstrate the added value of considering quality of motivation through the motivation subscales even when accounting for quantity of self-determined motivation. Such omission could potentially have grave consequences for evidence-based decisions taken in workplaces to motivate the workforce. In this context, a key advantage of the bifactor model comes from its orthogonality, providing a way to simultaneously consider all motivation facets without encountering potentially severe problems of multicollinearity. In SDT research conducted so far, it has typically been impossible to simultaneously consider all types of motivation in a single model, possibly as a result of the presence of substantial multicollinearity among motivation subscales that is likely to remain even when using an ESEM approach because of the lack of control for the global quantity of self-determination underlying ratings to all motivation items. The B-ESEM approach thus provides a more comprehensive approach to testing the critical assumptions of SDT regarding the role of self-determination and motivation types than has been available so far in the literature.
Supplemental Material
JOM645653_-_SupplMat – Supplemental material for Using Bifactor Exploratory Structural Equation Modeling to Test for a Continuum Structure of Motivation
Supplemental material, JOM645653_-_SupplMat for Using Bifactor Exploratory Structural Equation Modeling to Test for a Continuum Structure of Motivation by Joshua L. Howard, Marylène Gagné, Alexandre J. S. Morin and Jacques Forest in Journal of Management
Footnotes
Acknowledgements
This article was accepted under the editorship of Patrick M. Wright. Preparation of this article was facilitated through funds from the Australian Postgraduate Award scholarship awarded to the first author, as well as grants from the Fonds Québécois de la Recherche sur la Société et la Culture and the Social Sciences and Humanities Research Council of Canada awarded to the second and fourth authors, a grant from the Australian Research Council (LP140100100) awarded to the third author, and a grant from the Fondation de l’Ordre des CRHA awarded to the fourth author. All funds were awarded to authors as grants to conduct research from government or university sources and in no way influenced the current research. The funding parties have no specific interests in the research and had no influence over the research proceedings.
Notes
References
Supplementary Material
Please find the following supplemental material available below.
For Open Access articles published under a Creative Commons License, all supplemental material carries the same license as the article it is associated with.
For non-Open Access articles published, all supplemental material carries a non-exclusive license, and permission requests for re-use of supplemental material or any part of supplemental material shall be sent directly to the copyright owner as specified in the copyright notice associated with the article.