
Abstract
Organizational noncompliance with legal rules can be consequential. The antecedents of such noncompliance as well as the remediation of it thus remain enduring subjects of research inquiry. However, prior studies have implicitly treated all rules alike. In contrast, we argue that rules are not all the same and that differences between rules might be systematically linked to variations in the likelihoods of noncompliance and remediation across the range of organizations under the purview of a rule system. We consider the role of two fundamental but distinct sources of rule complexity: components (i.e., sections that compose a rule) and connections (i.e., functional links to other rules in the same system). We analyzed data from 81,266 rule-level observations from 1,011 health inspections of 289 restaurants in Santa Monica, California, conducted from 2007 to 2010. As hypothesized, increases in either source of rule complexity were associated with higher probabilities of noncompliance. Unexpectedly, however, the two sources of rule complexity had divergent effects on remediation such that increases in the number of connections were associated with higher probabilities of repeated noncompliance, whereas increases in the number of components were not. Taken together, we suggest that our understanding of noncompliance and remediation can be enhanced by viewing them both as rule-level phenomena. A range of implications for theory and practice are discussed.
Keywords
Introduction
Routine operations in organizations are frequently subject to various rules from the regulatory legal environment that define the boundaries of appropriate organizational conduct (Edelman & Suchman, 1997; Lehman & Ramanujam, 2009; Weber, 1946). These rules often reflect broader societal and cultural values such that over time, commonly shared ideals become codified into formal rules (Edelman, 2016). Compliance confers several benefits upon organizations, such as licenses and endorsements from regulators (Jin & Leslie, 2003), accreditation from industry boards (Wiley & Zald, 1968), and labels of legitimacy by observers (Scott, 2002), all of which are critical for organizational survival. Noncompliance, by contrast, can potentially endanger organizational reputation and survival, as well as the safety and security of consumers, employees, shareholders, and society at large (Vaughan, 1999).
Yet noncompliance with such rules is widespread and often linked to a host of adverse outcomes. For example, failures of restaurants to comply with food safety rules can lead to outbreaks of deadly foodborne illnesses (P. Simon et al., 2005), lack of adherence to handwashing rules by healthcare providers can result in the transmission of fatal hospital-acquired infections (Dia, Milkman, Hofmann, & Staats, 2015), deviations from work safety rules can contribute to workplace injuries and deaths (Whiting & Bennett, 2003), noncompliance in nuclear power plants with process safety rules can cause large-scale industrial accidents (Perrow, 1984), and noncompliance with launch safety protocols has been linked to multiple space shuttle disasters (Haunschild, Polidoro, & Chandler, 2015); a host of other examples abound.
Not surprisingly, the antecedents of noncompliance and its remediation remain important subjects for organizational research (for reviews, see Frese & Keith, 2015; Greve, Palmer, & Pozner, 2010; Palmer, 2012; Roe & Schulman, 2016). Although prior studies have significantly advanced our understanding, they have almost without exception examined noncompliance in one of two different ways. One approach is to examine noncompliance with respect to a specific rule or subset of rules without considering whether the other rules within the same rule system are also out of compliance (e.g., Harris & Bromiley, 2007; Zhang & Greve, 2018). Another approach is to examine aggregate noncompliance, or the total number of rules in a system that are out of compliance, without considering potential differences in noncompliance rates across rules (e.g., Anand, Gray, & Siemsen, 2012; Flanagan, Ramanujam, Sutherland, Vaughn, Diekama, & Doebbeling, 2007; Jin & Leslie, 2003). Both approaches implicitly assume that all rules within a given system are alike. However, this assumption runs counter to much of the organizational literature on rules that suggests that rules within a given system often vary from one to the next in terms of the nature of the demands they place on organizations (e.g., Beck & Kieser, 2003; Jennings, Schulz, Patient, Gravel, & Yuan, 2005; Lehman & Ramanujam, 2009). Yet few studies have considered the real possibility that such differences among rules might be systematically linked to differences in the likelihoods of noncompliance and remediation.
This gap in the literature is particularly noteworthy because the potential outcomes of noncompliance often vary across rules. That is, noncompliance with some rules might be more consequential than noncompliance with other rules (Reason, 1997). A better understanding of variations in noncompliance and remediation across rules thus stands to shed new light on various outcomes linked to organizational reliability, such as errors (e.g., Frese & Keith, 2015), safety (e.g., Zohar & Luria, 2005), accidents (e.g., Perrow, 1984), wrongdoing and misconduct (e.g., Greve et al., 2010; Palmer, 2012), and operational failures (e.g., Kim & Miner, 2007). Yet despite calls for frameworks and studies of noncompliance and remediation at the rule level of analysis (e.g., Lehman & Ramanujam, 2009; Vaughan, 1999), few studies have heeded the call. Our aim is to offer an initial step toward filling this gap and addressing these calls.
Accordingly, we present here a rule-level study of the effects of rule complexity on noncompliance and its remediation. Rule complexity represents a natural starting point for understanding how different rule features might be systematically linked to differences in the likelihoods of noncompliance and remediation. In essence, rules can be understood as formal directives about appropriate actions and outcomes (Edelman, 2016; Lehman & Ramanujam, 2009; Zhang & Greve, 2018), and the complexity of such directives has a notable impact on organizational capabilities to reliably execute necessary actions and achieve desired outcomes (for a review, see Rasmussen, Standal, & Laumann, 2015; see also Haerem, Pentland, & Miller, 2015). Moreover, the notion of rule complexity has consistently been identified as a particularly promising avenue for understanding the impact of rules on organizational action (e.g., Jennings et al., 2005; Lehman & Ramanujam, 2009; Martinez-Moyano, McCaffrey, & Oliva, 2014; Schulz, 1998).
We draw on classic conceptions of systems complexity (e.g., Perrow, 1984; H. A. Simon, 1962; Sterman, 1989) in order to consider here two fundamental but distinct sources of rule complexity: components (i.e., the sections that compose a given rule) and connections (i.e., functional links between a focal rule and other rules in the same system). To develop a framework about the effects of rule complexity on noncompliance and remediation, we draw on theories of routines (e.g., Nelson & Winter, 1982) and learning (e.g., Levitt & March, 1988), both of which are rooted in the notion of bounded rationality (e.g., H. A. Simon, 1997). We posit that increases in either source of complexity will be associated with higher probabilities of noncompliance and lower probabilities of remediation.
To study the effects of rule complexity on noncompliance and remediation, we used data from restaurant health inspections in Santa Monica, California, from 2007 to 2010. During this period, restaurants were subject to 86 food safety rules, and compliance was assessed during periodic inspections conducted by local health inspectors. Hierarchical logistic regression analysis was used to examine 81,266 rule-level observations across 1,011 inspections of 289 restaurants. As hypothesized, increases in either source of rule complexity were associated with higher probabilities of noncompliance. Unexpectedly, however, the two sources of rule complexity had divergent effects on remediation such that increases in the number of connections were associated with higher probabilities of repeated noncompliance, whereas increases in the number of components were not. Taken together, the findings paint a nuanced picture of how rule complexity shapes organizational noncompliance and remediation.
This study offers at least two related theoretical contributions. First and foremost, it advances the notion that our understanding of the antecedents of noncompliance and remediation is incomplete and can be enhanced by conceptualizing them as rule-level phenomena. That is, across organizations regulated by a given rule system, some rules are systematically associated with higher rates of noncompliance and lower rates of remediation. This perspective complements nicely the dominant emphasis in the literature on organizational antecedents (e.g., Greve et al., 2010; Palmer, 2012; Vaughan, 1999) and thereby draws a renewed attention to rules as objects of study in their own right (e.g., Jennings et al., 2005; Sullivan, 2010; Zhou, 1993). Second, it adds to long-standing discussions amongst sociolegal scholars about how the legal regulatory environment shapes organizational action (e.g., Edelman, 2016; Edelman & Suchman, 1997; Weber, 1946) by emphasizing the role of rule features. Together, these contributions stand to inform a wide range of literatures that pertain to legal rules and organizational (non)compliance with them and at the same time, point to exciting new lines of inquiry.
Theory and Hypotheses
The Role of Legal Rules in Organizational Life
The guiding premises for our theoretical arguments are threefold. First, rules are not all the same. Rules in the regulatory legal environment are “formalized prescriptions and proscriptions about appropriate actions” (Lehman & Ramanujam, 2009: 644) that “impose societal authority on various aspects of organizational life” (Edelman & Stryker, 2005: 537). Rules do not exist in isolation; rather, each is situated within an “ecology of rules” or a system that comprises a multitude of rules (Beck & Kieser, 2003; Jennings et al., 2005; March, Schulz, & Zhou, 2000; Zhou, 1993). Importantly, rules within a given system vary in the demands they place on organizations and in how they relate to one another (Lehman & Ramanujam, 2009).
Second, organizations rely on routines to ensure ongoing compliance with legal rules. Routines are an organization’s way of doing things or the “repetitive patterns of interdependent actions” carried out by organizational members (Parmigiani & Howard-Greville, 2011: 417) and serve as the “building blocks of capabilities” (Dosi, Faillo, & Marengo, 2008: 1167). In the context of rules pertaining to day-to-day operations, these capabilities can be further understood as “routines as targets” (Nelson & Winter, 1982). In other words, rule-related routines reflect strict patterns of action that provide “mechanisms for control and bases for replication” (Parmigiani & Howard-Grenville, 2011: 416). This “executable capability for repeated performance” (Cohen et al., 1996: 683) is especially critical when “routines are clearly meant to be stable [due to the legal environment]” (Anand et al., 2012: 1700). Of course, routines enable both stability and change (Cyert & March, 1963; Howard-Grenville, 2005; March & Simon, 1958; Nelson & Winter, 1982). As such, routines allow for the reliable execution of actions necessary for compliance and at the same time, capture lessons learnt about noncompliance for purposes of remediation.
Third, some organizational routines are shaped by and adapted to the legal environment. Indeed, “classic definitions of routines suggest that they are bound by rules,” including ones of legal standing (Desai, 2010: 186; see also Cyert & March, 1963; Nelson & Winter, 1982). In this way, legal rules can be viewed as artifacts that are external to the organization but nonetheless influence organizational routines (D’Adderio, 2011). Legal rules and organizational routines are thus inherently linked via action. That is, rules both outline the boundaries of actions that compose routines as well as specify some particular actions that must be embedded in those routines. Of course, organizations typically maintain some discretion over the design and implementation of rule-related routines (Anand et al., 2012; Edelman, 2016). Nevertheless, such routines can be expected to be systematically shaped by the rules in the legal environment (Lehman & Ramanujam, 2009; see also Nelson, 1994).
Taken together, these premises provide a useful way to understand noncompliance and remediation. On one hand, compliance is often a matter of effortful accomplishment of routines. Various rule-related routines enable organizations to “repetitively execute [a] sequence of productive activities without trouble” (Ethiraj, Kale, Krishnan, & Singh, 2005: 28; see also Anand et al., 2012; Nelson & Winter, 1982). Noncompliance is thus more likely to occur when an organization fails to accomplish the actions of a routine that are associated with a particular rule or set of rules. On the other hand, remediation is often a matter of learning-driven refinement of routines. The routines associated with legal rules are repositories of organizational memory (Gavetti & Levinthal, 2000) that enable organizations to capture the lessons of experience (Zollo & Winter, 2002). Repeated noncompliance, or the failure to remediate, is thus more likely to occur when an organization fails to update the actions of a routine associated with a particular rule or set of rules in response to feedback from the regulatory regime about previous noncompliance.
Several features of noncompliance and remediation are particularly noteworthy. First, both are fundamentally rule-level phenomena. A rule is either in compliance or it is not; an organization’s routines either conform to the standards of associated rules or they deviate from them. Of course, noncompliance and remediation can often be matters of degree, and the degree to which a rule is out of compliance might vary over time (Lehman & Ramanujam, 2009), but even still, most assessments of noncompliance and remediation are fundamentally binary (Vaughan, 1996). Second, both are concerned with the perspective of the regulatory regime. Regulatory officials, not organizational agents, assess whether a rule is out of compliance and if previously so, whether it has been remediated. Across a wide range of industries, such assessments are commonly made during periodic inspections (for examples, see Anand et al., 2012; Jin & Leslie, 2003; Palmer, 2012; Roe & Schulman, 2016). Third, both are agnostic with respect to intent, including unintentional and intentional deviations from rules (Frese & Keith, 2015). Fourth, both are indifferent to outcomes, including deviations from rules that result in harm as well as benefits (Ramanujam & Goodman, 2003). In sum, noncompliance refers to organizational actions that deviate from the requirements of a legal rule that regulates those actions, as determined by regulatory officials and regardless of intent and immediate outcome; remediation refers to the correction of a deviation such that noncompliance is not repeated.
Drawing on these premises, we suggest that the rates of noncompliance and remediation will vary across rules in a given system. That is, across organizations regulated by a given rule system, some rules are more prone than others to noncompliance and less likely to be remediated. Our core thesis is that rule complexity will play a systematic role in the accomplishment and refinement of routines as targets and, consequently, shape—at least in part—noncompliance and remediation.
Two Sources of Rule Complexity
In early conceptions of systems complexity, H. A. Simon noted that “how complex or simple a structure is depends critically upon the way in which we describe it” (1962: 481). He goes on to suggest that the complexity of any part of a system refers, at its root, to the number of subparts that compose it and the interdependence between it and other parts in the system. Later discussions point to similar basic conceptions of complexity (e.g., Perrow, 1984; Sterman, 1989). Applied to rules embedded within a rule system, this points to two fundamental but distinct sources of complexity for any given rule: components and connections. 1
First, a rule is more complex to the extent that it comprises more components that together describe the actions and outcomes necessary for compliance. A rule with a high number of components contains more detail and requires more actions to constitute compliance (Beck & Kieser, 2003; Kaplow, 1995; Schulz, 1998). Following others, we conceive of components as the number of formal sections that compose a rule (e.g., Jennings et al., 2005; Sullivan, 2010). This source of complexity thus pertains to how a particular rule is defined in and of itself, irrespective of the other rules in the same system.
Second, a rule is more complex to the extent that it has more connections to or functional dependencies upon other rules in the same system. A rule with a high number of connections refers to actions or outcomes that may be affected by activities pertaining to another rule or set of rules (Lehman & Ramanujam, 2009; March et al., 2000). Following others, we conceive of connections as the number of other rules upon which the focal rule is functionally dependent such that noncompliance with the connected rule(s) could cause noncompliance with the focal rule (e.g., Collins, Gong, & Li, 2009; Jennings et al., 2005). This source of complexity thus pertains to how a particular rule is defined in relation to other rules in the same system.
The Effects of Rule Complexity on Noncompliance
As previously discussed, organizational compliance can be understood, at least in part, as a matter of effortful accomplishment. That is, noncompliance is more likely to occur when organizational members fail to accomplish the actions of a routine that are associated with a particular rule or set of rules. Noncompliance is often the result of organizational efforts to simultaneously respond to competing demands such as speed, productivity, profits, and innovation, among others (Frese & Keith, 2015; Greve et al., 2010; Hofmann & Stetzer, 1998; Holmstrom & Milgrom, 1994; Martinez-Moyano et al., 2014; Zohar & Luria, 2005). It thus often arises from a shift in organizational attention away from routines associated with a given rule or rules and toward those associated with responding to competing demands (Anand et al., 2012).
Organizational efforts to accomplish routines, including those associated with legal rules, must, therefore, be understood in the context of bounded rationality. Organizational members are “human beings who satisfice [“or look for a course of action that is satisfactory or ‘good enough’”] because they have not the wits to maximize” (H. A. Simon, 1997: 118, [119]); they do so because they have limited attention and knowledge for dealing with the world around them. On one hand, routines facilitate organizational action, including rule compliance, because they provide organizational members with basic scripts for reacting to environmental stimuli (March & Simon, 1958). Organizational members generally execute routines as intended because these routines represent an efficient option for carrying out their work by “economiz[ing] on the limited information processing and decision-making capacity of agents” (Becker, 2004: 656). However, the accomplishment of routines tends to decay over time as organizational members are faced with competing demands or simpler alternatives to prescribed routines (Anand et al., 2012; Cohen & Bacdayan, 1994; Nelson & Winter, 1982). In either case, boundedly rational organizational members frequently use temporary workarounds, thereby deviating from routines as targets (Howard-Grenville, 2005; Tucker & Edmondson, 2003). Even when these workarounds are well meaning and “seem like obvious improvements viewed from a particular role, [they] can easily have adverse effects elsewhere in the system” (Nelson & Winter, 1982: 116). Such deviations are especially likely for routines that require greater attention and cognitive resources to accomplish (H. A. Simon, 1997; Sutcliffe & Weick, 2008).
We posit, therefore, that the failure to accomplish routines as intended is more likely for routines associated with more complex rules. As defined, legal rules provide the boundaries for the various actions and outcomes that are required of all organizations within a population even if each organization maintains some level of discretion over how exactly to design and implement the routines necessary to fulfill those actions (Edelman & Stryker, 2005; Lehman & Ramanujam, 2009). The features of a given rule, in turn, determine the effort required to execute associated routines. Complex rules, like complex tasks, demand greater attention and cognitive resources from organizational members (Haerem et al., 2015; Rasmussen et al., 2015). In the face of competing demands or simpler alternatives, boundedly rational individuals will thus be more likely to fail to accomplish as intended those routines associated with complex rules.
Consider components as a source of rule complexity. By definition, a rule with more components contains more sections. Consequently, the actions and outcomes referenced in these sections may be either associated with a wider range of organizational routines or distributed amongst more organizational members (see Becker, 2004). In either case, the execution of routines associated with a rule composed of a high number of components will correspondingly require more organizational resources in the form of cognitive effort, attention, and coordination (Ocasio, 1997; Sutcliffe & Weick, 2008). In the face of competing demands, therefore, a rule composed of a high number of components will be more prone to noncompliance because there is an increased number of opportunities for one or more organizational members to engage in a workaround of one or more routines that results in noncompliance with the rule (Anand et al., 2012; Jett & George, 2003; Tucker & Edmondson, 2003). We, therefore, propose the following.
Hypothesis 1a: A rule is more likely to be out of compliance as the number of components that compose the rule increases.
Consider next connections as a source of rule complexity. As defined, a rule with more connections entails more links to other rules such that the actions of the focal rule may be affected by activities pertaining to another rule under some or all conditions. These functional dependencies produce causal linkages and, hence, the potential for unanticipated noncompliance. If an organizational member works around part of one or more routines associated with a connected rule, these deviations might impede compliance with the focal rule. The likelihood of noncompliance is especially high if these routines are highly interdependent (see Weick, 1990). A highly connected rule will thus be more prone to noncompliance as a result of the increased number of opportunities for workarounds that will result in noncompliance with the rule (Anand et al., 2012; Jett & George, 2003; Tucker & Edmondson, 2003). We, therefore, propose the following.
Hypothesis 1b: A rule is more likely to be out of compliance as the number of connections to other rules increases.
Of course, the two sources of complexity may vary simultaneously; thus, their joint effects are also worthy of consideration. To revisit H. A. Simon’s view of complexity: “Complex systems [are] made up of a large number of parts that interact in a nonsimple way” (1962: 468). In other words, complexity compounds complexity; a complex part in a system is made more complex when it is related to other parts in complex ways (Perrow, 1984; Sterman, 1989). Applied to rules, increases in either source of complexity can be expected to amplify or reinforce the hypothesized effects of the other. We argued that a rule is more likely to be out of compliance as the number of components increases because there is an increased number of opportunities for failures to carry out the routine as intended. As the number of connections also increases, however, each of the components of the focal rule is increasingly at risk of noncompliance as a result of the functional dependence of the rule on the actions and outcomes of other rules to which it is connected. Increases in the number of connections will thus exacerbate the challenges posed by increases in the number of components. We, therefore, propose the following interaction.
Hypothesis 1c: A rule is more likely to be out of compliance as simultaneously the numbers of components and connections both increase.
The above hypotheses considered the effects of rule complexity on noncompliance irrespective of previous noncompliance. The subsequent hypotheses consider the persistence of noncompliance as well as the effects of rule complexity on noncompliance for rules previously out of compliance. As such, the foregoing hypotheses can be understood as particularly relevant for rules previously in compliance. The empirical analysis considers the two cases separately.
The Persistence of Noncompliance
Before the effects of rule complexity on remediation are discussed, it is necessary to first consider the persistent quality of noncompliance. Scholars from the capabilities tradition have likened routines to organizational genes in that they are “sticky” and “rather difficult to change” (Parmigiani & Howard-Grenville, 2011: 434; see also Adler, Goldaftas, & Levine, 1999; Rumelt, Schendel, & Teece, 1994; Szulanski, 1996). Routines are reflections of experiential learning (Gavetti & Levinthal, 2000) and are thus unlikely to change in the absence of negative outcomes or feedback (Cyert & March, 1963; Zollo & Winter, 2002). Moreover, any changes in response to feedback occur in a path-dependent manner (Becker, 2004; Levitt & March, 1988). We posit that noncompliance, once initiated, thus tends to persist because the benefits are clear and immediate, whereas any negative outcomes or feedback are often ambiguous and delayed.
Organizations are frequently provided with feedback about noncompliance in the form of inspection reports. In providing such feedback, regulatory regimes typically specify which rules are in versus out of compliance (Palmer, 2012; Roe & Schulman, 2016). This feedback has been shown to trigger a renewed focus of organizational attention on routines as targets, thereby prompting the remediation of noncompliance (e.g., Anand et al., 2012; Haunschild et al., 2015). Indeed, the deliberate allocation of organizational attention is a critical ingredient for learning from feedback (Argote & Miron-Spektor, 2011; Zollo & Winter, 2002). Organizations appear to be particularly inclined to respond to feedback from regulatory officials when the feedback is also made available to interested members of the public (see Jin & Leslie, 2003).
Even still, noncompliance with a given rule, once initiated, is prone to be repeated. The mechanisms for providing feedback (i.e., inspection reports) occur infrequently, and the potential adverse outcomes of noncompliance (e.g., accidents or disasters) are generally loosely coupled with the routine itself (Ramanujam & Goodman, 2003). Consequently, organizational members tend to “learn from noncompliance in a perverse way; namely they learn that [it] is acceptable” (Greve et al., 2010: 73). As organizational members enjoy immediate benefits of noncompliance but delayed consequences of it, if any at all, organizational structures and processes become subject to inertia and the same actions are repeated over time (Anand et al., 2012; Vaughan, 1996). This is not to suggest that feedback from regulatory regimes never elicits remediation; rather, it is to simply suggest that previous noncompliance with a given rule makes subsequent noncompliance with that rule more likely. We thus propose the following.
Hypothesis 2: A rule is more likely to be out of compliance if it was previously out of compliance than if it was previously in compliance.
Of course, the contrapositive of the proposed hypothesis is that a rule is more likely to be in compliance if it was previously in compliance than if it was previously out of compliance. However, as hypothesized earlier, a rule previously in compliance is more likely to be out of compliance if it is a more complex rule. The remediation of noncompliance might similarly vary across rules. Specifically, we posit that increases in either source of complexity will be associated with lower probabilities of remediation.
The Effects of Rule Complexity on Remediation
As previously discussed, the remediation of noncompliance can be understood, at least in part, in terms of a learning-driven refinement of routines. Routines are not only targets that serve as the basis for replication (Nelson & Winter, 1982) but also repositories of memory that encapsulate lessons learned from prior experience (Gavetti & Levinthal, 2000). Repeated noncompliance, or the failure to remediate, is thus more likely when organizational members are unable or otherwise fail to update a routine that is associated with a particular rule or set of rules previously out of compliance.
Organizational efforts to refine routines, including those associated with legal rules, must, therefore, be understood through the lens of experiential learning. Importantly, the transformation of experience into updated routines requires an accurate interpretation of experience (Argote & Miron-Spektor, 2011; Levitt & March, 1988; Zollo & Winter, 2002). However, learning from experience is difficult when the causes of outcomes are ambiguous (March, 2010). Individuals tend to do a poor job of considering multiple or varied causes and, instead, simplify information in a way that often distorts it altogether (Russo, Carlson, Meloy, & Yong, 2008; van Oorschot, Akkermans, Sengupta, & van Wassenhove, 2013). In particular, organizational members striving to learn from experience are often faced with a “credit assignment problem” such that it is not necessarily obvious which cause(s) ought to receive “credit” for experienced outcomes (Axelrod & Cohen, 1999; Fang, 2012). In other words, it is not clear which routines ought to be updated. This problem is intensified in the context of complex routines because “the complexity of an organization’s system of interdependent routines would make it hard to know which routine would have the most impact on the organizational goal that is the focus of the search” (Nigam, Huising, & Golden, 2016: 553). In the face of such ambiguity, boundedly rational organizational members tend to engage in a local search and, consequently, assign credit to the most proximal and seemingly obvious causes; however, this tendency often results in erroneous attributions (Denrell, Fang, & Levinthal, 2004; Fang, 2012; March, 2010; H. A. Simon, 1997). Consequently, the organization fails to learn from the experience.
We posit, therefore, that the failure to appropriately refine routines in response to feedback about noncompliance is more likely for routines associated with more complex rules. Remediation requires that organizational members accurately identify the causes of noncompliance and update associated routines accordingly (see Argote & Miron-Spektor, 2011). Yet it may not necessarily be obvious which organizational routines ought to receive “credit” for noncompliance even if the regulatory regime provides feedback about which rules are in versus out of compliance (Axelrod & Cohen, 1999; Fang, 2012). This credit assignment problem will be particularly challenging in the context of complex rules. Organizational members will thus be more likely to fail to appropriately refine those routines associated with complex rules.
Consider again components as a source of rule complexity. As defined, a rule with more components contains more sections, each of which may either be associated with a wider range of organizational routines or distributed amongst more organizational members. Increases in the number of components will therefore also increase the scope of the credit assignment problem (Axelrod & Cohen, 1999; Fang, 2012). In other words, a rule with a higher number of components presents a broader range of possible causes of noncompliance. As such, organizational members may misidentify the cause of noncompliance for rules composed of multiple components (Denrell et al., 2004; Fang, 2012; March, 2010). We, therefore, propose that increases in the number of components will decrease the likelihood of remediation.
Hypothesis 3a: The likelihood of repeated noncompliance (i.e., failure to remediate) for a given rule increases as the number of components that compose the rule increases.
Consider again connections as a source of rule complexity. As defined, a rule with more connections entails more functional links to other rules. Feedback about a rule previously out of compliance must therefore be jointly interpreted with any other rules to which it is connected. Increases in the number of connections will therefore also intensify the credit assignment problem (Axelrod & Cohen, 1999; Fang, 2012). Organizational members will be inclined to assign credit for noncompliance with a given rule to the routines most closely associated with that rule (Denrell et al., 2004; March, 2010). However, this credit assignment may be overly simplistic in the case of rules with multiple connections because noncompliance with the focal rule may be caused by noncompliance with a different yet connected rule. As such, organizational members may misidentify the cause of noncompliance in the case of highly connected rules. We, therefore, propose that increases in the number of connections will also decrease the likelihood of remediation.
Hypothesis 3b: The likelihood of repeated noncompliance (i.e., failure to remediate) for a given rule increases as the number of connections to other rules increases.
Once again, the two sources of complexity may vary simultaneously and, therefore, their joint effects are also worthy of consideration. It would thus be useful to consider again how the two sources of complexity reinforce one another (Perrow, 1984; H. A. Simon, 1962; Sterman, 1989). We proposed that a rule is less likely to be remediated as the number of components that compose the rule increases because there is an increased number of opportunities for organizational members to misidentify the cause of noncompliance. As the number of connections also increases, however, the scope of the credit assignment problem increases even further as a result of the functional dependence of the rule on other rules to which it is connected. In other words, as the number of connections also increases, the causes of noncompliance are even more likely to be misidentified. Increases in the number of connections will thus exacerbate the effect of components on remediation. We, therefore, propose the following interaction.
Hypothesis 3c: The likelihood of repeated noncompliance (i.e., failure to remediate) for a given rule increases as simultaneously the numbers of components and connections both increase.
In sum, we have considered the effects of two different sources of rule complexity on noncompliance and remediation. We hypothesized that a rule is more likely to be out of compliance as its numbers of components or connections, either singly or jointly, increase. We then hypothesized that noncompliance tends to persist over time. Finally, we hypothesized that a rule previously out of compliance is less likely to be remediated as its numbers of components or connections, either singly or jointly, increase.
Data and Method
Study Context
Our examination of noncompliance and remediation was conducted in the context of restaurant health inspections in Santa Monica, California, which is an incorporated city in western Los Angeles County. Restaurants throughout the state of California are regulated by local food safety rules. On May 15, 2006, the state legislature signed into law the California Retail Food Code (State Code), which is a comprehensive law pertaining to food safety and is based on the Good Retail Practices outlined by the Food and Drug Administration in the United States Public Health Service Food Code. Each of the 58 counties in California is responsible for designing and enforcing a local rule system that is aligned with this State Code. On July 1, 2007, the Los Angeles Department of Public Health (LADPH) then introduced a revised Retail Food Inspection Guide (Inspection Guide) to lay out a rule system that is derived from the State Code. This rule system comprises 86 food safety rules that regulate the activities of all restaurants operating in Los Angeles County, including those in Santa Monica.
Several features of this study context make it an ideal setting for testing our hypotheses. First, a single system of legal rules applies uniformly to all restaurants. Second, data about noncompliance and remediation are available at the rule level of analysis for each restaurant across multiple inspections over time. Third, feedback was provided to each restaurant operator at the conclusion of each inspection in the form of an inspection report that specified which rules were in versus out of compliance. Fourth, each inspection was conducted by a highly trained health official. 2 Finally, as we elaborate below, compliance with the food safety rules in the system is consistent with our conceptualization of routines as targets.
In addition, the rules contained within the system vary in terms of the two sources of complexity outlined above. First, each rule in the LADPH Inspection Guide is composed of one or more of sections of the State Code, which is organized by content such that different sections outline different sets of actions and outcomes that are intended to guide and constrain organizational action. Some rules are composed of a single section, whereas others are composed of multiple sections. Failure to follow the actions or achieve the outcomes required by any of these sections results in noncompliance with the respective rule. The number of sections of the State Code that serve as the basis for a given rule in the LADPH Inspection Guide is thus consistent with our conceptualization of components. Second, the LADPH Inspection Guide lists for each rule any other rules in the system upon which the focal rule is functionally dependent such that if out of compliance, could cause noncompliance with the focal rule. Some rules do not list any other rules as functionally interdependent, whereas others list several. The number of rules listed for a given rule in the LADPH Inspection Guide is thus consistent with our conceptualization of connections. Also consistent with our conceptualization, components and connections are both rule-level variables.
Table 1 provides details of four different rules for illustrative purposes. Although all of these rules are associated with the same penalty for noncompliance (6 points; details given below), they differ in terms of components and connections. For example, Rule 16 pertains to the cleanliness of food-contact surfaces. It is composed of four different sections of the State Code (i.e., components) and is functionally dependent upon compliance with five other rules in the LADPH Inspection Guide (i.e., connections); its average noncompliance rate across all inspections in the data set is 12.9%. Details and other examples are noted in the table, which also highlight the variety of content of the rules within the system (i.e., cooling methods, food-contact surfaces, sewage disposal systems, and cooking time and temperatures); further details are provided below.
Examples of Rules
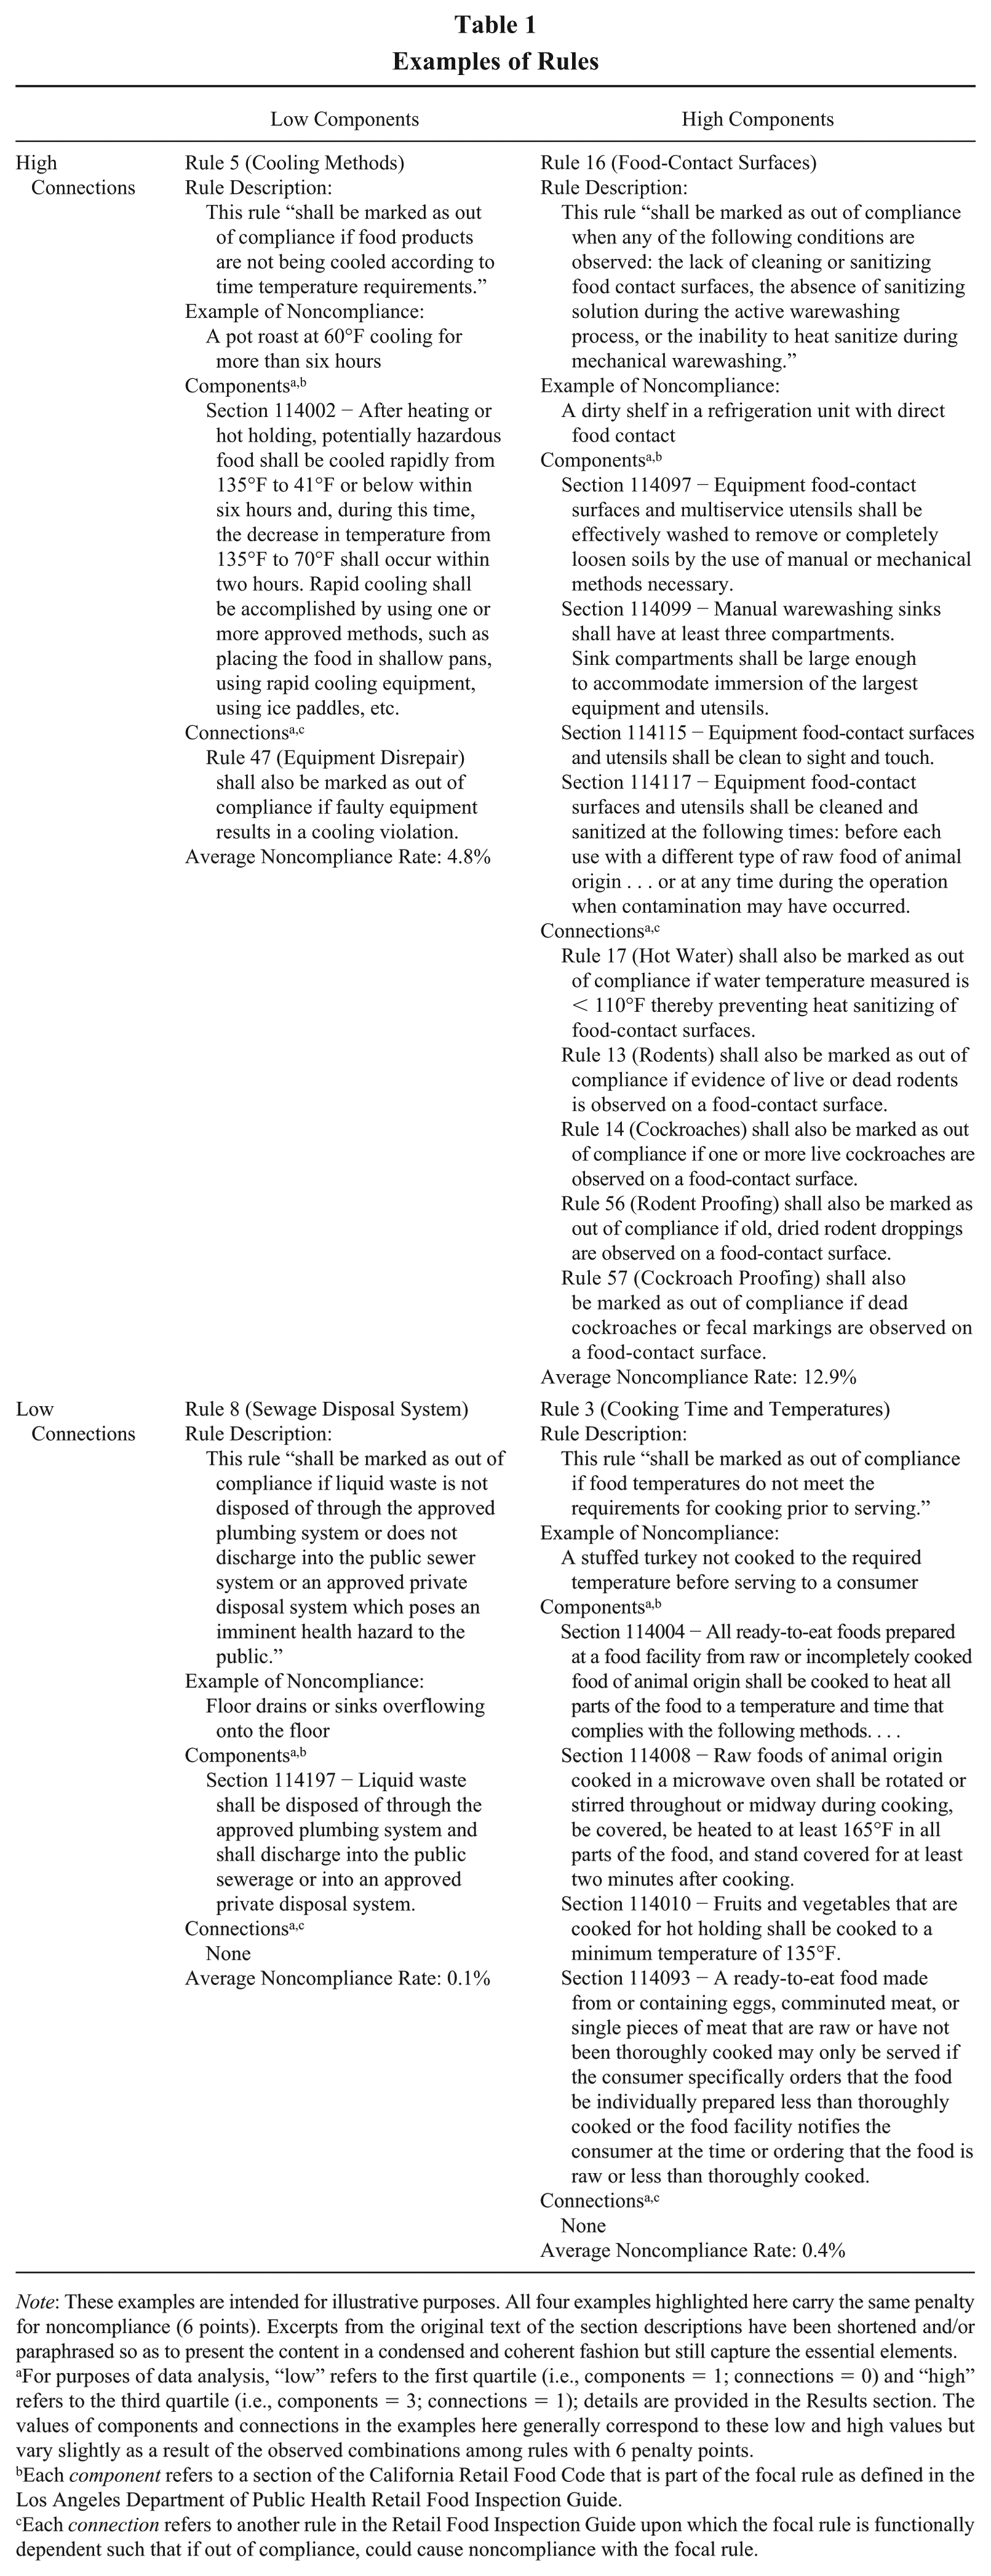
Note: These examples are intended for illustrative purposes. All four examples highlighted here carry the same penalty for noncompliance (6 points). Excerpts from the original text of the section descriptions have been shortened and/or paraphrased so as to present the content in a condensed and coherent fashion but still capture the essential elements.
For purposes of data analysis, “low” refers to the first quartile (i.e., components = 1; connections = 0) and “high” refers to the third quartile (i.e., components = 3; connections = 1); details are provided in the Results section. The values of components and connections in the examples here generally correspond to these low and high values but vary slightly as a result of the observed combinations among rules with 6 penalty points.
Each component refers to a section of the California Retail Food Code that is part of the focal rule as defined in the Los Angeles Department of Public Health Retail Food Inspection Guide.
Each connection refers to another rule in the Retail Food Inspection Guide upon which the focal rule is functionally dependent such that if out of compliance, could cause noncompliance with the focal rule.
A restaurant’s compliance with each of the food safety rules is assessed during regular but unscheduled inspections. In other words, periodic inspections occur without announcement or advance warning; a restaurant operator knows that an inspector will visit about every 4 months, but they do not know exactly when. Compliance is assessed through on-site observations, reviews of restaurant records, and interviews with employees. Each of the applicable rules is marked as either in or out of compliance by the inspector on a simple two-page report. Each rule is associated with a predefined penalty ranging from 0 to 6 points on the basis of the potential adverse consequences associated with noncompliance. After assessing compliance with each of the rules, the inspector then computes an overall score ranging from 0 to 100 points on the basis of those rules deemed out of compliance (i.e., 100 points minus penalties). A copy of the inspection report is provided to the restaurant operator at the conclusion of the inspection, thereby providing feedback about which rules were in versus out of compliance.
The outcome of each inspection is of notable significance to the restaurant. The overall score is translated into a letter grade (A = 90–100 points, B = 80–89 points, C = 70–79 points) and a placard indicating the assigned grade must be posted prominently near the front door of the facility for patrons to see upon entering the establishment. The placard simply indicates the grade but does not display the actual number of points unless the restaurant earned a score below 70 points; in such cases, the placard indicates the numerical score instead. In neither case does the placard outline the specific rules out of compliance. This grading system and public posting mandate was introduced in 1998 after a now-famous health department crackdown that was triggered by a local investigative news special on unhygienic health practices in various restaurants in the county. The grading system was then retained after the passage of the State Code in 2006 and the introduction of the revised LADPH Inspection Guide in 2007. Given the importance of health grades for the reputation and survival of restaurants (see Jin & Leslie, 2003; Lehman, Kovács, & Carroll, 2014), it is reasonable to assume that each restaurant operator is highly incentivized to take the necessary steps to earn high health grades. The LADPH has even taken steps to aid restaurant operators in this effort; the LADPH Inspection Guide includes a self-inspection guide so that restaurant operators can design and refine their routines accordingly.
Data
Data came from health inspections conducted between July 1, 2007, and June 30, 2010, in the city of Santa Monica. A restaurant and all respective inspections were included in the analysis if the restaurant met the following three criteria: it was classified as a full-service restaurant by the LADPH (i.e., it handles multiple types of potentially hazardous foods, utilizes multiuse customer utensils, and may prepare food days in advance), which allowed for comparability across establishments in the sample; it was classified as a restaurant by Yelp.com, which allowed for the inclusion of the full range of control variables in the analysis (see details below); and it was inspected at least five times during the study period, which allowed for sufficient control of previous noncompliance in the models (see details below). The final data set includes data from inspections of 289 restaurants conducted by 25 different inspectors; it is composed of 1,011 inspections and 81,266 rule-level observations. 3 The data set is structured such that each observation is at the rule level of analysis (i.e., a rule marked as either in or out of compliance), each observation is nested within an inspection, and each inspection is nested within a restaurant; as outlined below, the analysis models account for this hierarchical structure.
Most data came from the LADPH database; however, some data came from two other sources. First, we gathered information about each restaurant from Yelp.com, a website created in 2004 as a forum for consumers to voluntarily write reviews about restaurants; it also provides additional information about each restaurant, such as its price level, location, and cuisine offerings. Second, we gathered information about each restaurant from the company websites, if available; 241 of the 289 restaurants in the sample (83%) maintained a web presence. Each variable described below was collected from the LADPH database unless otherwise noted.
Dependent Variable
Rule (non)compliance
Organizational (non)compliance was coded as a binary variable such that 1 indicates “out of compliance” and 0 indicates “in compliance” for that rule during the inspection at hand of the focal restaurant as marked by the inspector on the inspection report. Table 1 provides an example of noncompliance with each of the four illustrative rules.
Independent Variables
Number of components
The number of components for each rule was measured as the number of sections of the State Code that compose the rule as defined by the LADPH Inspection Guide. Some rules are composed of a single section, whereas others are composed of multiple sections. Table 1 offers descriptions of the sections that compose each of the illustrative rules.
Number of connections
The number of connections for a given rule was measured as the number of other rules in the LADPH Inspection Guide upon which the focal rule is functionally dependent such that if out of compliance, could cause noncompliance with the focal rule. Some rules are not connected to any other rules, whereas others are connected to several other rules in the system. Table 1 lists the connections for each of the illustrative rules.
Previous noncompliance
Previous noncompliance is simply the lagged noncompliance indicator for the focal rule in the most recent inspection by the same restaurant (i.e., Lag 1). In total, three lags were included to control for autocorrelation (i.e., Lag 1, Lag 2, and Lag 3).
Control Variables
Organization level
Control variables at the restaurant level were included as available in the data: (1) the total number of inspections conducted of the restaurant since July 1, 2000 (the date of the first health inspection in the LADPH electronic archives), as restaurants with a greater number of inspections may be able to better comply with more rules; (2) the average number of inspections per year of the restaurant during the study period, as restaurants with more frequent inspections may also be able to better comply with more rules; (3) a dummy variable to denote whether the restaurant was located inside a hotel as indicated on its Yelp profile, as such restaurants may have qualitatively different structures or routines associated with regulatory compliance; (4) an indicator variable for the price level of the restaurant based on categories from Yelp, indicating the “average price per customer per meal”: $ denotes “cheap” (less than $15), $$ denotes “moderate” ($15–$30), $$$ denotes “expensive” ($31–$60), and $$$$ denotes “splurge” (above $60), as more expensive restaurants may have more reputational stock at stake with respect to noncompliance with food safety rules; (5) the age of the restaurant in number of years since the founding of the restaurant at the time of the focal inspection, 4 as older restaurants may have more stable routines in place for complying with legal rules; (6) the size of the restaurant as a percentile based on the size of all restaurants in the sample: 0 to 10 seats (6% of restaurants), 11 to 30 seats (21%), 31 to 60 seats (29%), 61 to 100 seats (22%), 101 to 150 seats (10%), 151 to 200 seats (8%), 201 to 400 seats (4%), 401-plus seats (1%), as the challenges involved in ensuring compliance may vary as the number of employees increases; (7) the number of locations in the county that operate under the same brand name, 5 as chains may have more standardized routines in place for ensuring compliance; and (8) a count of the number of cuisine categories assigned to the restaurant (e.g., American, Mexican, Italian, Chinese, Thai) on its Yelp profile, as restaurants with multiple cuisine offerings may have more complex routines associated with these diverse offerings. In addition, fixed effects were included for each of the 289 restaurants to control for any unobserved heterogeneity across restaurants.
Inspection level
Control variables at the inspection level were also included as available in the data: (1) a dummy variable for whether the inspection was conducted by the same inspector as the previous inspection, as inspections conducted by the same inspector may reflect certain biases; (2) the time since the last inspection in number of years, as inspections following long time lags may reflect the decay in routines that often occurs in the absence of such feedback; (3) the time since the first inspection in number of years, as inspections following a long history of prior inspections may reflect associated learning; and (4) an indicator variable for the previous grade (i.e., A, B, C, < C or score card) assigned to the restaurant as a result of the previous inspection, as inspections following a poor grade may reflect a deliberate attempt by the restaurant to refine its routines in an effort to ensure remediation. In addition, fixed effects were included for each of the 25 inspectors to control for any potential heterogeneity in inspection practices or tendencies across inspectors.
Rule level
Control variables at the rule level were also included as available in the data: (1) the number of penalty points (i.e., 0, 1, 4, or 6) associated with the rule, as penalties are generally believed to curb noncompliance; (2) a dummy variable for the availability of corrected on site (COS Option) as an option for the inspector to mark on the inspection report, 6 as this option may suggest a qualitative difference about the rule; (3) a dummy variable for the availability of not observed (N/O Option) as an option for the inspector to mark; 7 and (4) the previous noncompliance rate with the rule by the focal restaurant based on all previous inspections during the study period (i.e., the total number of times the rule has been out of compliance divided by the total number of inspections of the focal restaurant in the data set), as a rule frequently out of compliance in the past may be particularly prone to noncompliance. In addition, fixed effects were included for the content of each rule, which was based on the risk factors identified by the Centers for Disease Control and which serve as a set of guiding principles for the development of food safety rules in municipalities across the United States. 8
Data Analysis Models
A series of hierarchical logistic regression models were used to test the hypotheses. The logistic regression framework was used as a result of the dichotomous nature of the dependent variable (i.e., a rule is either in or out of compliance), and the hierarchical structure was used to accommodate the repeated measurement of compliance for each rule, which is nested within an inspection and within a restaurant. This hierarchical design uses random effects at the inspection level to accommodate the dependence between observations within the same inspection of a restaurant and as noted above, fixed effects at the restaurant level to account for organizational differences not captured by other control variables. 9 The combination of lagged noncompliance and noncompliance rate ensured that the design effectively accounted for any autocorrelation between successive inspections. Outcomes were then modeled starting from the fourth inspection of each restaurant so that a history of at least three previous outcomes was available in each case. Model estimation was carried out using Latent GOLD 5.1 (Vermunt & Magidson, 2015).
Results
Hypothesis Tests
Table 2 provides descriptive statistics and intercorrelations among variables, categorized into the three levels of analysis: organization, inspection, and rule. The mean for the rule noncompliance dummy reveals that each rule has on average a 5.96% probability of being out of compliance. Note that the standard deviation is quite high (0.24), suggesting that some rules were frequently out of compliance, whereas other rules were rarely out of compliance. The average inspection revealed 4.8 rules of the 86 rules in the system to be out of compliance.
Correlations and Descriptive Statistics
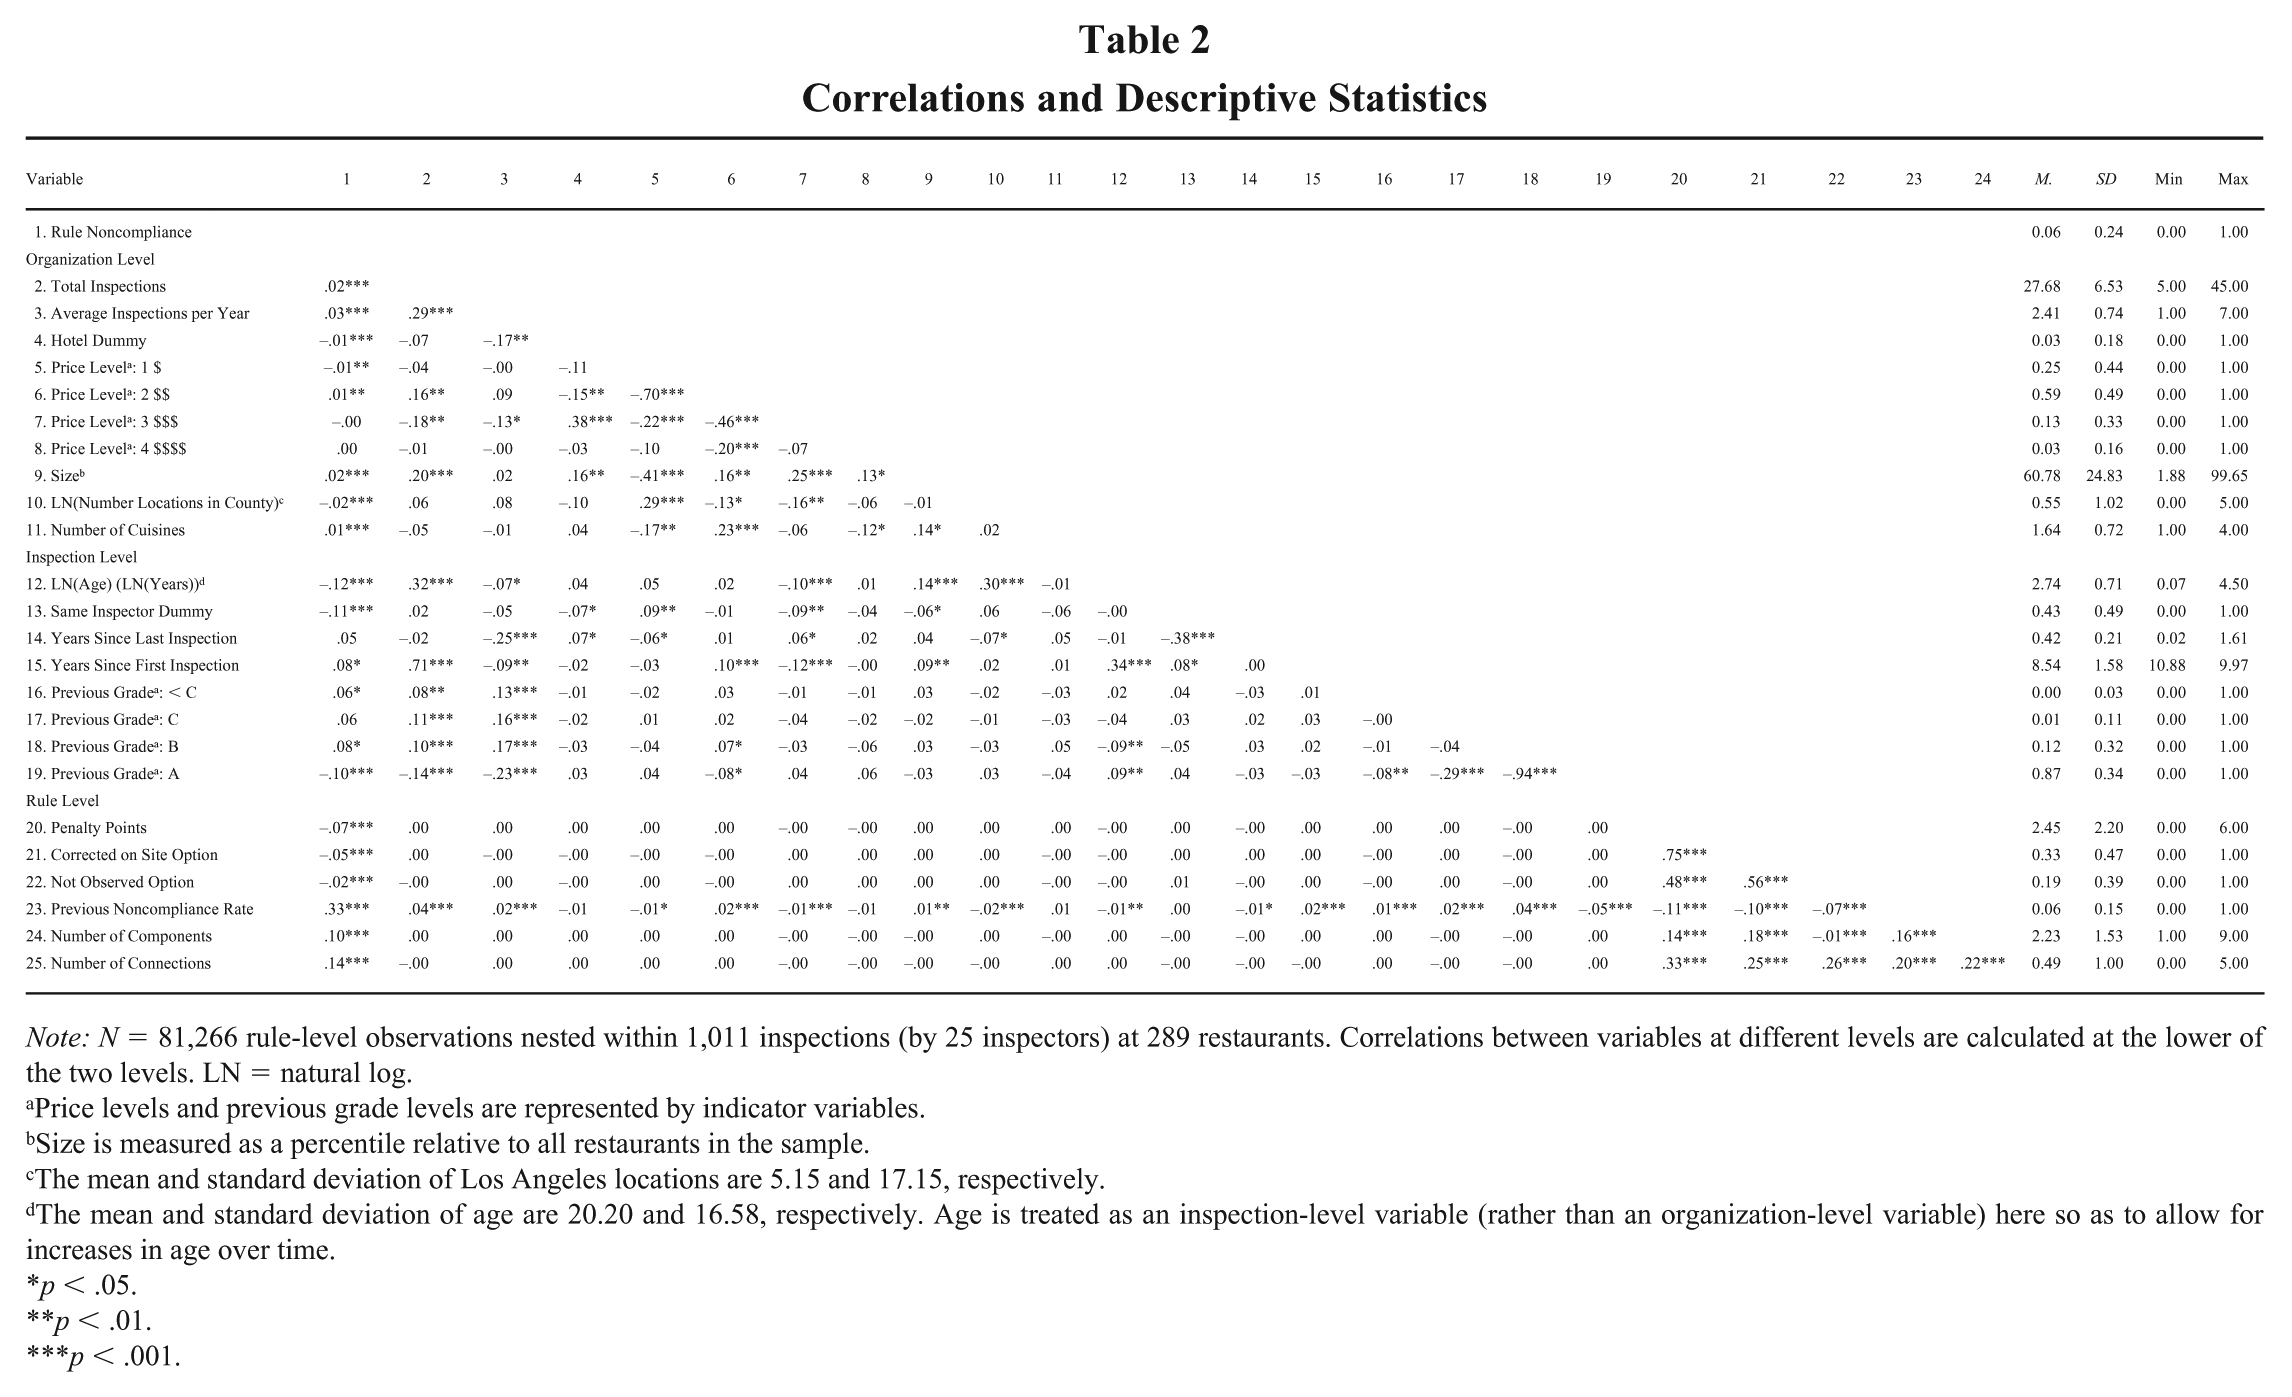
Note: N = 81,266 rule-level observations nested within 1,011 inspections (by 25 inspectors) at 289 restaurants. Correlations between variables at different levels are calculated at the lower of the two levels. LN = natural log.
Price levels and previous grade levels are represented by indicator variables.
Size is measured as a percentile relative to all restaurants in the sample.
The mean and standard deviation of Los Angeles locations are 5.15 and 17.15, respectively.
The mean and standard deviation of age are 20.20 and 16.58, respectively. Age is treated as an inspection-level variable (rather than an organization-level variable) here so as to allow for increases in age over time.
p < .05.
p < .01.
p < .001.
Table 3 provides the results of the hierarchical logistic regression analysis used to test the hypotheses. All values reported represent coefficients. Model 1 is a baseline model that includes all control variables. As expected, rules for which noncompliance results in harsher penalties are less likely to be out of compliance (βPenalty = −0.33, p < .001). The significant positive interaction between previous noncompliance and penalty points (βPenalty Points × Lag 1 = 0.05, p < .05) opposes the main effect but when the two are considered together, indicates that rules with harsher penalties are still less likely to be out of compliance, regardless of previous compliance versus noncompliance. All subsequent models thus test the effects of rule complexity above and beyond the effects of associated penalties. Interestingly, rules that can be marked by the inspector as COS (βCOS = 0.35, p < .001) or N/O (βN/O = 0.80, p < .001) are more likely to be out of compliance. In addition, increased inspection frequency of a given restaurant appears to be positively related to noncompliance (βAverage Inspections per Year = 0.09, p < .001). Various nonsignificant effects of control variables can be seen in the table. Given that restaurant and inspector fixed effects are included in all models, it is not surprising that most organization- and inspection-level controls are not significant.
Hierarchical Logistic Regression Analysis
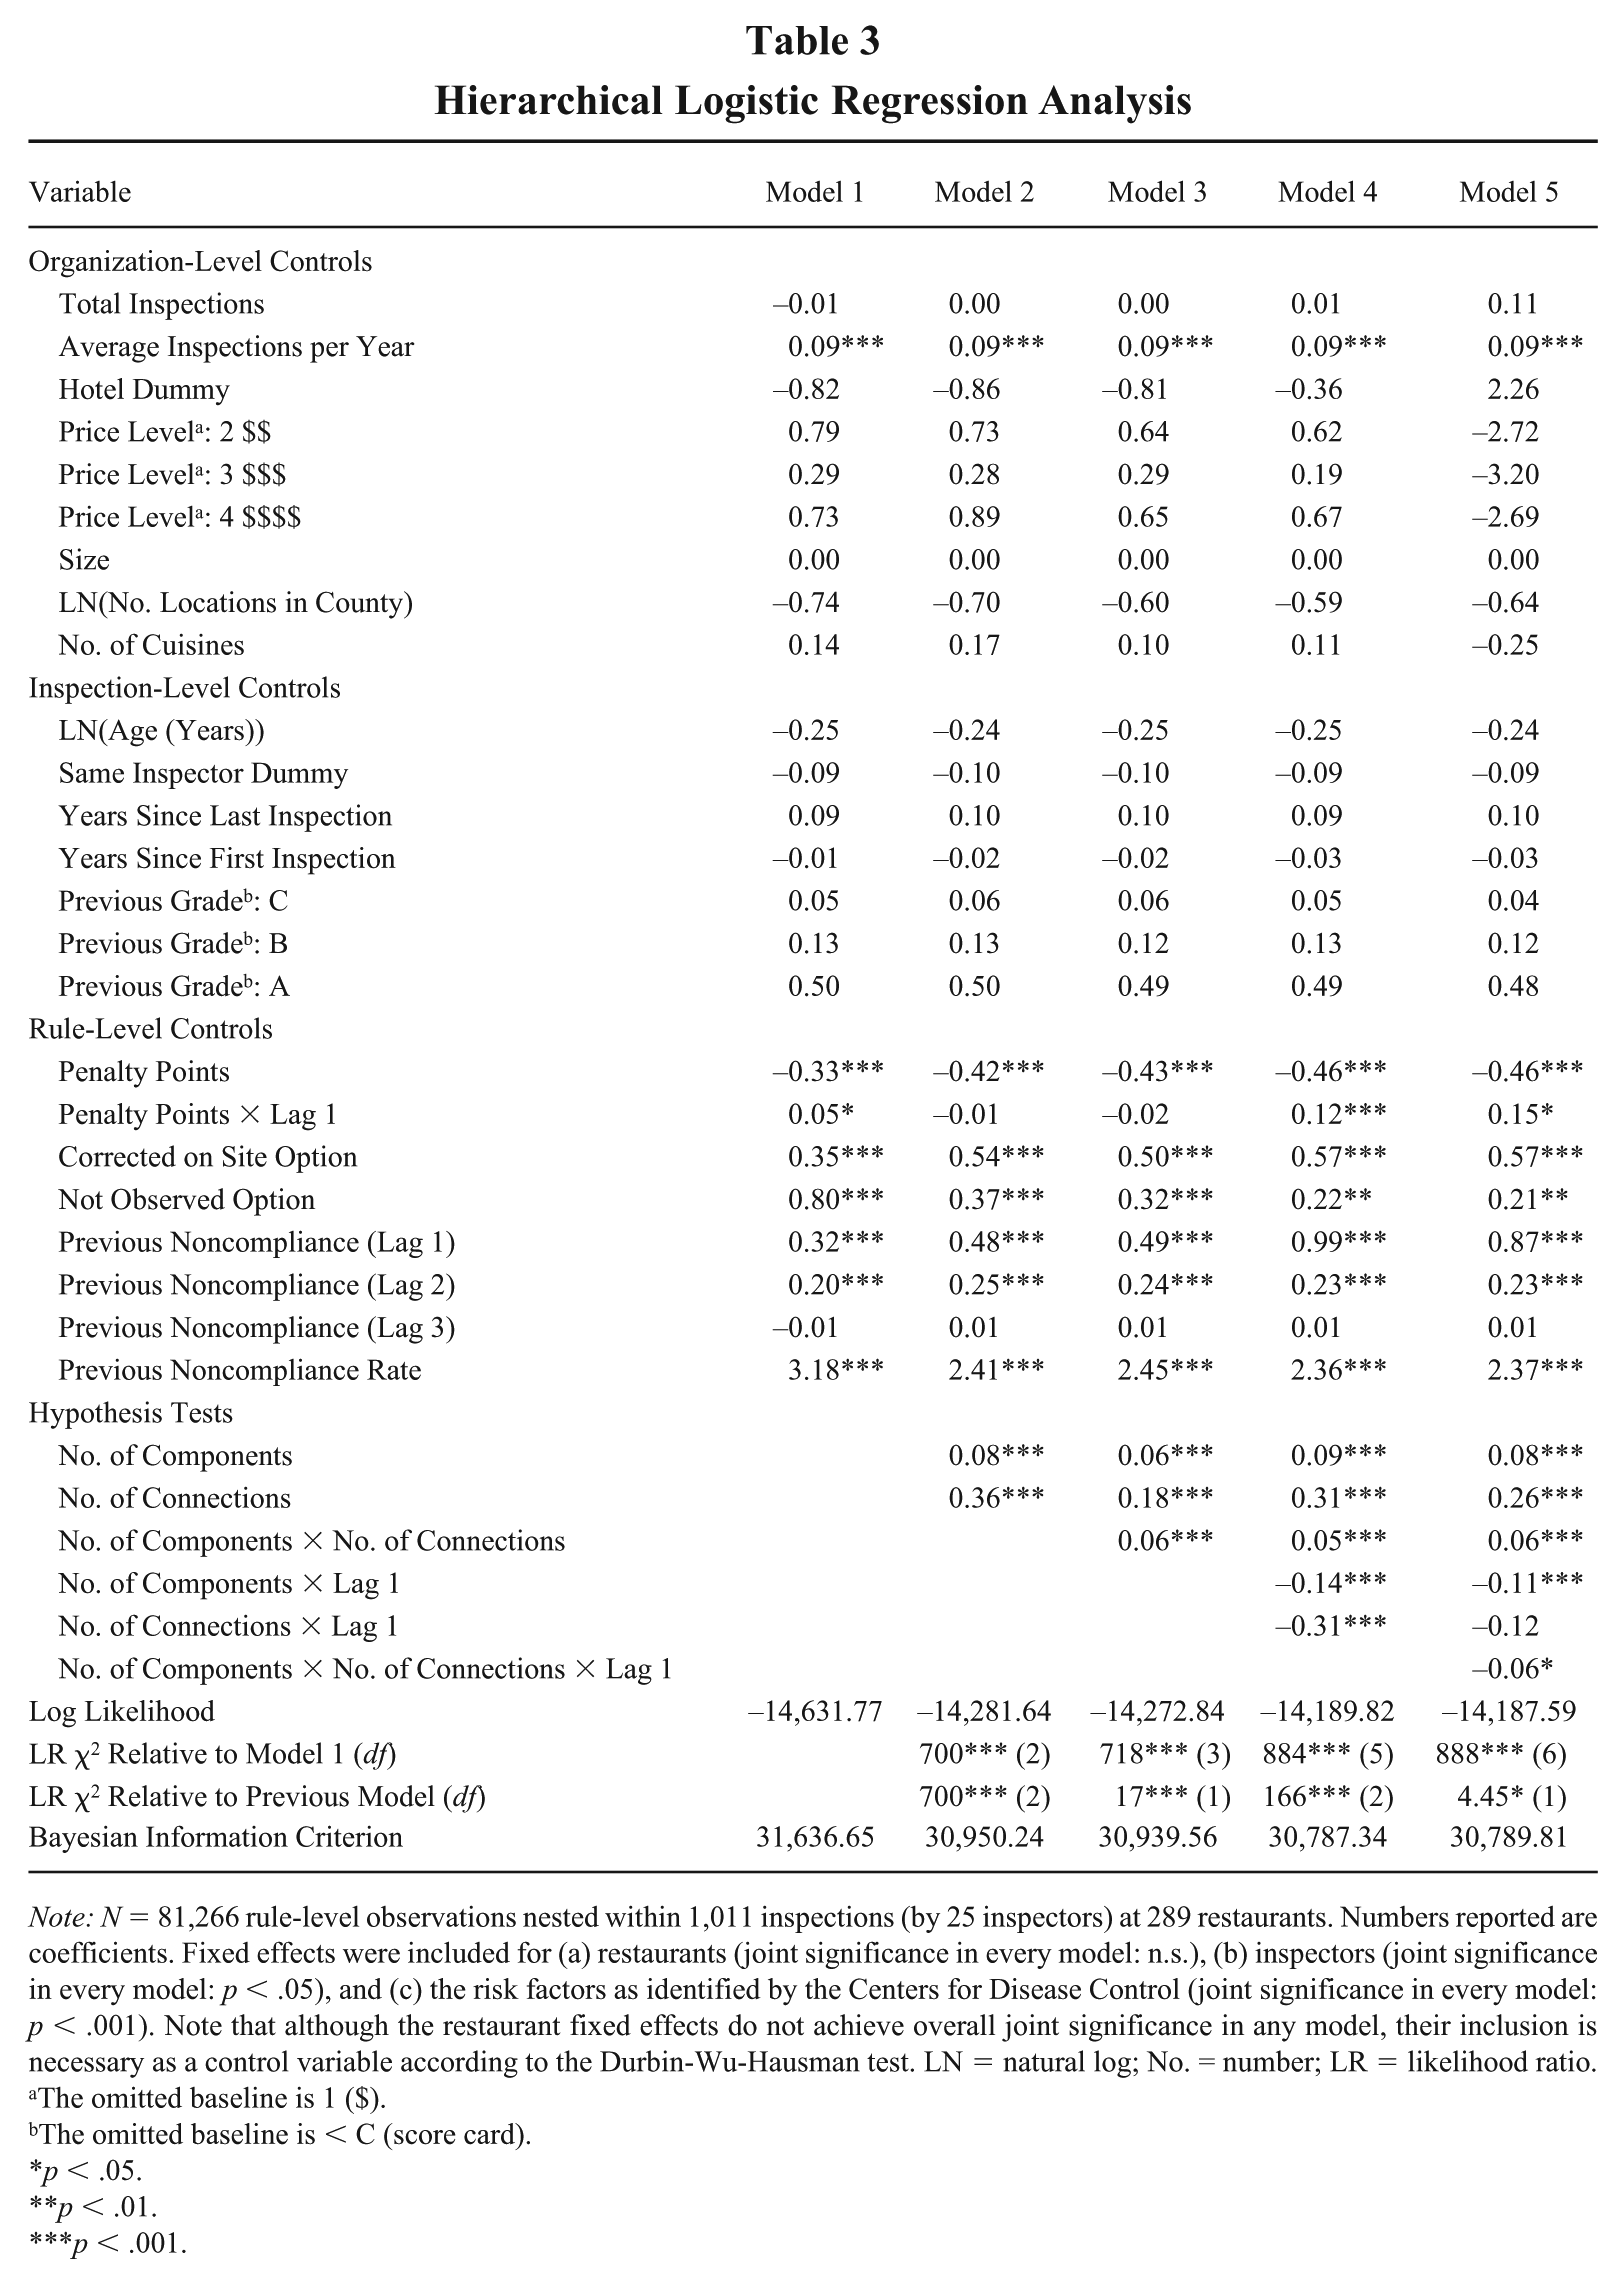
Note: N = 81,266 rule-level observations nested within 1,011 inspections (by 25 inspectors) at 289 restaurants. Numbers reported are coefficients. Fixed effects were included for (a) restaurants (joint significance in every model: n.s.), (b) inspectors (joint significance in every model: p < .05), and (c) the risk factors as identified by the Centers for Disease Control (joint significance in every model: p < .001). Note that although the restaurant fixed effects do not achieve overall joint significance in any model, their inclusion is necessary as a control variable according to the Durbin-Wu-Hausman test. LN = natural log; No. = number; LR = likelihood ratio.
The omitted baseline is 1 ($).
The omitted baseline is < C (score card).
p < .05.
p < .01.
p < .001.
Model 2 introduces the main effects for each of the two sources of rule complexity and shows significant improvement over the baseline model (∆LR χ2 = 700, p < .001). As hypothesized, a rule is more likely to be out of compliance as the number of components increases (βComponents = 0.08, p < .001) or as the number of connections to other rules increases (βConnections = 0.36, p < .001). Hypotheses 1a and 1b are thus supported.
Model 3 introduces the joint effects for the two sources of rule complexity. It also shows significant improvement over the baseline model (∆LR χ2 = 718, p < .001) as well as over Model 2 (∆LR χ2 = 17, p < .001). As hypothesized, a rule is more likely to be out of compliance as the number of components and connections simultaneously increases (βComponents × Connections = 0.06, p < .001) such that the effects of one reinforce the other. Hypothesis 1c is thus supported.
Model 3 also accounts for the effects of previous noncompliance. As hypothesized, a rule is more likely to be out of compliance in the focal inspection if it was out of compliance in the previous inspection of the same restaurant (βPrevious Noncompliance (Lag 1) = 0.49, p < .001). Of course, the model also includes an interaction term between previous noncompliance and the penalties associated with it (βPenalty Points × Lag 1 = −0.02, n.s.); the difference in log odds for a rule previously out of compliance (i.e., Lag 1 = 1) and a rule previously in compliance (i.e., Lag 1 = 0) is 0.44 (p < .001) when the number of penalty points is held constant at its mean. Note that the other models yield similar results. Hypothesis 2 is thus supported.
Model 4 introduces the two-way interaction terms for previous noncompliance. This model also shows significant improvement over the baseline model (∆LR χ2 = 884, p < .001) as well as over Model 3 (∆LR χ2 = 166, p < .001). Of course, appropriate tests for Hypotheses 3a and 3b involve three different coefficients each, two of which are interaction terms. As such, and given the nature of the models (i.e., logistic regression), it was necessary to conduct an analysis of the marginal differences in the observed effects for different possible values for each of the two measures of rule complexity (see Hoetker, 2007; Wiersema & Bowen, 2009). In each case, “low” refers to the first quartile for each source of complexity (i.e., components = 1; connections = 0) and “high” refers to the third quartile (i.e., components = 3; connections = 1); the nonfocal source of complexity as well as all other variables are held constant at their respective means. The test for Hypothesis 3a involves all coefficients pertaining to the number of components (βComponents = 0.09, p < .001; βComponents × Lag 1 = −0.14, p < .001; βComponents × Connections = 0.05, p < .001). The difference in log odds for a rule previously out of compliance with a high number of components compared to a rule previously out of compliance with a low number of components is −0.065 (p = .050). 10 This marginally contradicts the hypothesis that repeated noncompliance is more likely as the number of components that compose the rule increases. The test for Hypothesis 3b involves all coefficients pertaining to the number of connections (βConnections = 0.31, p < .001; βConnections × Lag 1 = −0.31, p < .001; βComponents × Connections = 0.05, p < .001). The difference in log odds for a rule previously out of compliance with a high number of connections compared to a rule previously out of compliance with a low number of connections is 0.10 (p < .001). This supports the hypothesis that repeated noncompliance is more likely as the number of connections to other rules increases. In sum, Hypothesis 3a is not supported but Hypothesis 3b is supported.
Model 5 introduces the three-way interaction term for previous noncompliance and also shows significant improvement over the baseline model (∆LR χ2 = 888, p < .001), as well as over Model 4 (∆LR χ2 = 4.45, p < .05). In order to test Hypothesis 3c, an analysis of marginal differences was again conducted, accounting here for all six coefficients relevant to rule complexity. If a rule was previously out of compliance, the difference in log odds for a rule with low numbers of components and connections compared to a rule with high numbers of both is 0.08 (p = .056) when all other variables are held constant at their respective means. In other words, repeated noncompliance with a rule increases as simultaneously the numbers of components and connections both increase. Hypothesis 3c is thus marginally supported.
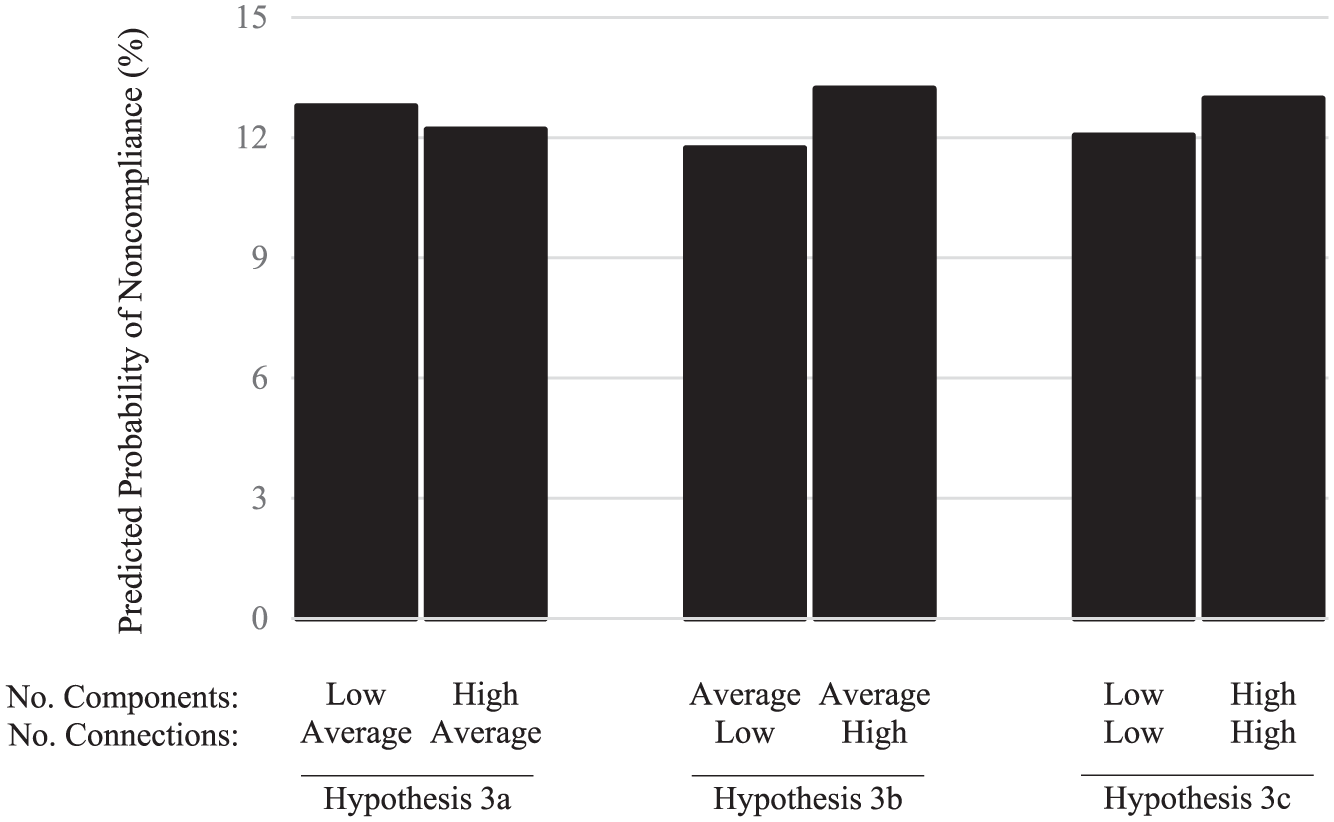
Figures 1 and 2 provide graphical depictions of tests of Hypotheses 1 and 3, respectively. Whereas the tests discussed above rely on several different models (i.e., Models 1–5), the tests presented here rely on the full model (i.e., Model 5); as before, nonfocal variables are held constant at their respective means. Both figures show the predicted probabilities of noncompliance for different possible values for each of the two measures of rule complexity. Figure 1 depicts these differences for rules previously in compliance (i.e., Lag 1 = 0). Figure 2 depicts these differences for rules previously out of compliance (i.e., Lag 1 = 1). Probabilities are expressed in percentages and represent absolute differences; for example, a difference of 1% would be used to indicate that the probability of noncompliance increases from 5% to 6%.
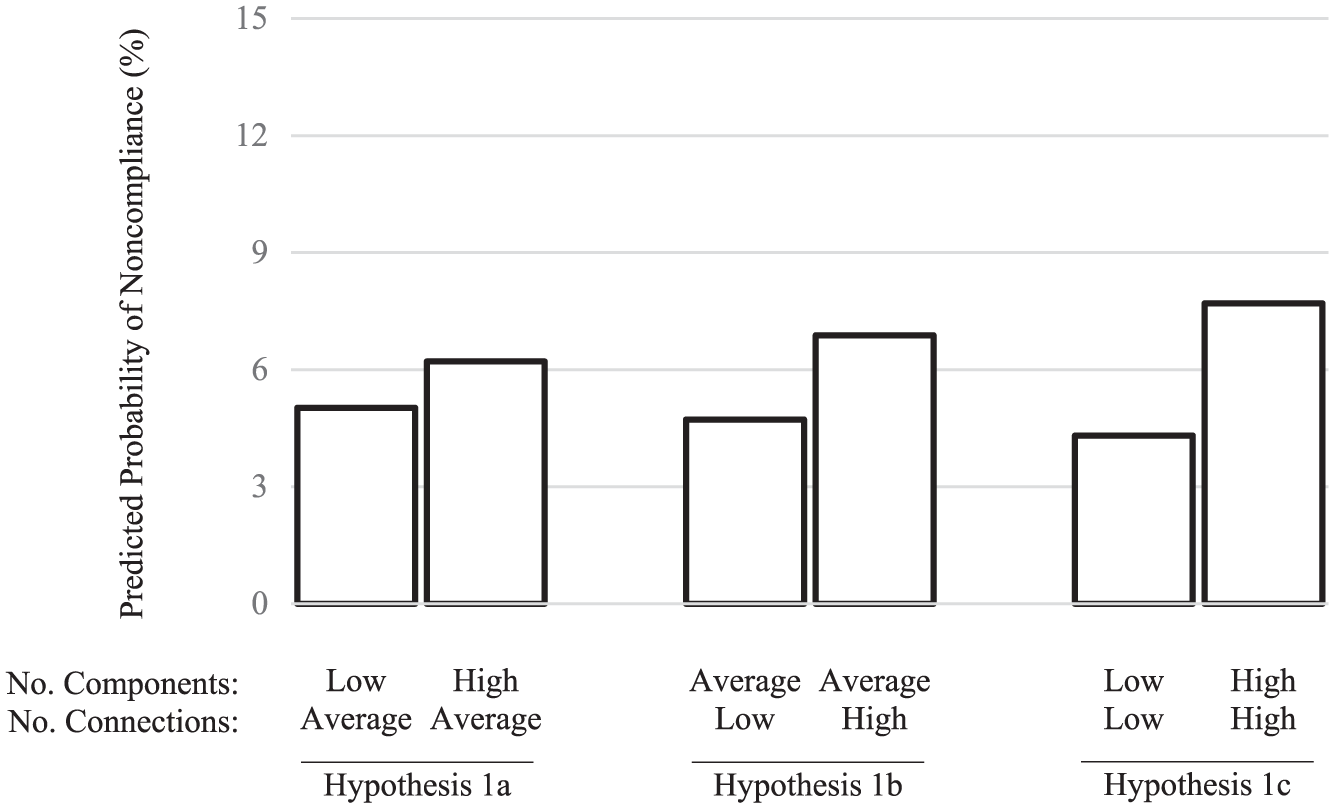
Summary of Predicted Probabilities for Rules Previously in Compliance
Summary of Predicted Probabilities for Rules Previously out of Compliance
Figure 1 depicts the results of tests of Hypothesis 1. We proposed that a rule is more likely to be out of compliance as the number of components and connections, singly as well as jointly, increases. As noted earlier, this first set of hypotheses focuses on rules previously in compliance (i.e., Lag 1 = 0). As expected, the probability of noncompliance is indeed higher as the number of components increases from low to high (∆Hypothesis 1a bars: 1.19%, p < .001), as the number of connections increases from low to high (∆Hypothesis 1b bars: 2.16%, p < .001), and as the numbers of components and connections jointly increase from low to high (∆Hypothesis 1c bars: 3.38%, p < .001). In sum, Hypotheses 1a, 1b, and 1c are all supported.
Figure 2 depicts the results of tests of Hypothesis 3. We proposed that remediation is less likely as the number of components and connections, singly as well as jointly, increases. As such, the analysis here focuses on rules previously out of compliance (i.e., Lag 1 = 1). Contrary to expectations, the probability of repeated noncompliance is lower as the number of components increases from low to high (∆Hypothesis 3a bars: –0.58%, p = .090). As expected, however, the probability of repeated noncompliance is indeed higher as the number of connections increases from low to high (∆Hypothesis 3b bars: 1.49%, p < .001) and as the numbers of components and connections jointly increase from low to high (∆Hypothesis 3c bars: 0.92%, p = .056). In sum, Hypothesis 3a receives no support, Hypothesis 3b receives full support, and Hypothesis 3c receives marginal support.
Neither figure depicts a test of Hypothesis 2. We proposed that a rule is more likely to be out of compliance in the focal inspection if it was out of compliance in the previous inspection. Using the coefficients reported in Model 5, the difference in log odds for a rule previously out of compliance (i.e., Lag 1 = 1) and a rule previously in compliance (i.e., Lag 1 = 0) is 0.86 (p < .001), and the absolute difference in the probabilities is 6.76% when all other variables are held constant at their respective means. Hypothesis 2 thus receives further support.
Although the differences in predicted probabilities have been discussed in absolute terms, the effect sizes are even more substantial when considered in relative terms. For example, there is a 78% increase in the probability of noncompliance when jointly the numbers of components and connections increase from low to high (i.e., Hypothesis 1c 11 ), an 8% increase in the probability of repeated noncompliance when jointly the numbers of components and connections increase from low to high (i.e., Hypothesis 3c), and a 119% increase in the probability of noncompliance for a rule previously out of compliance relative to a rule previously in compliance (i.e., Hypothesis 2). These relative differences are important to note because even small differences in the overall probabilities of noncompliance can translate into substantial increases in the probabilities of noncompliance for specific rules relative to other rules, which may result in severe health hazards. Of course, understanding such relative probabilities is indeed the aim in understanding whether some rules are more prone than others to noncompliance and less prone to remediation.
Robustness Checks
Additional analyses were conducted to verify the robustness of the results. We discuss below several variants of Model 5, which are available online in the supplemental material. First, we excluded the interaction between penalty points and previous noncompliance (Model 5a); the interaction between connections and previous noncompliance is significant and the three-way interaction is not, producing results similar to Model 4. (In a variant of Model 3 [Model 3a], the exclusion makes no difference to the value of any coefficient of interest.) Second, we used Lag 2 rather than Lag 1 in the relevant interaction terms to ensure that Hypotheses 2 and 3 were robust to these alternative specifications (Model 5b); the interaction between connections and previous noncompliance is significant and the three-way interaction is not, again producing results similar to Model 4. Third, we included the word count of each rule as a control to ensure that the effects of rule complexity as measured were robust to this rule feature (Model 5c); the signs and significance of the coefficients remain largely the same as in Model 5. Fourth, we treated word count as an alternative measure of components as rules composed of more words likely outline more actions and outcomes (Model 5d); the interaction between connections and previous noncompliance is significant and the three-way interaction is not, again producing results similar to Model 4. Fifth, we treated “not applicable” rules as “in compliance” rather than excluding them from the model (Model 5e); the signs and significance of the coefficients remain largely the same as in Model 5. Sixth, we excluded restaurants for which we relied on data from Yelp for age to ensure that the left censoring of this variable in the Yelp archives did not influence the results (Model 5f); the signs and significance of the coefficients remain largely the same as in Model 5. Seventh, we omitted the rule risk factors fixed effects as a control to ensure that the results were robust to its exclusion (Model 5g); neither the interaction between connections and previous noncompliance nor the three-way interaction is significant, but the conclusions drawn from the hypothesis tests are consistent with those based on Model 5. Eighth, we included seasonality as a control (Model 5h); as one might expect, the probability of noncompliance with any rule increases during the summer and autumn months, but, importantly, the values of the coefficients of interest are identical to those in Model 5. Taken together, these models lend further confidence in the reported findings even as they highlight the sensitivity of the hypothesized three-way interaction to model specification.
Discussion
Summary of Findings
Organizational action is often subject to various rules in the regulatory legal environment. The present study offered a theoretical framework to explain why rates of noncompliance and remediation will vary systematically across such rules. Specifically, we considered the effects of two different sources of rule complexity: components and connections. The findings paint a nuanced picture of how rule complexity shapes organizational noncompliance and remediation.
As hypothesized, increases in either source of rule complexity were associated with higher probabilities of noncompliance. These findings are consistent with our position that organizational compliance can be understood as a matter of effortful accomplishment of routines as targets by boundedly rational individuals. Noncompliance thus occurs when organizational members fail to accomplish the actions of a routine that are associated with a particular rule or set of rules, presumably due to competing attentional demands. Organizational members are apparently more likely to fail to accomplish those routines associated with complex rules.
Unexpectedly, the two sources of rule complexity had divergent effects on remediation such that increases in the number of connections were associated with higher probabilities of repeated noncompliance, whereas increases in the number of components were not. One plausible conclusion from these findings is that increases in the number of connections exacerbate the credit assignment problem as hypothesized but increases in the number of components do not. Indeed, all else being equal, increases in the number of connections expand the scope of the problem beyond the focal rule, whereas increases in the number of components do not. Moreover, as discussed, organizational members tend to engage in local searches for solutions and assign credit to the most proximal causes of problems (Denrell et al., 2004; Fang, 2012; March, 2010). It thus seems possible that the probability that organizational members will misidentify the cause of noncompliance with a given rule is more strongly associated with its connections than with its components. Another plausible explanation for these findings is that increases in the number of connections introduce additional challenges beyond the credit assignment problem. For example, routines “embedded in other organizational structures” (Howard-Grenville, 2005: 632) are particularly “sticky” and difficult to change (Szulanski, 1996); it is possible that such interlinkages of routines are more strongly associated with connections than with components. Yet another plausible explanation is that increases in the number of components facilitate remediation in a way that somehow counterbalances the credit assignment problem. For example, organizational members allocate attention to the most salient issues (e.g., Ocasio, 1997), and such attentional allocation is crucial for organizational learning (Argote & Miron-Spektor, 2011) and problem solving (MacDuffie, 1997); it is possible that increases in the number of components make a rule more salient by virtue of its larger size, whereas increases in the number of connections do not have the same effect. Of course, these possible explanations are not necessarily mutually exclusive. In sum, these unexpected findings point to the need for further investigation in order to better understand the effects of rule complexity on remediation.
Finally, the effects of both sources of rule complexity were stronger in the case of rules previously in compliance than rules previously out of compliance. 12 We did not hypothesize about the relative strength of these effects; however, drawing on our theoretical framework, these findings suggest that rule complexity may be more impactful for the effortful accomplishment of routines than for the learning-driven refinement of them. Nevertheless, the findings taken together support our core thesis that rule complexity plays a systematic role in shaping—at least in part—noncompliance and remediation.
Theoretical Implications
These findings make at least two contributions to distinct but related bodies of research. First and foremost, this study brings into question a strong implicit assumption underlying much of the extant research amongst organizational scholars on noncompliance and remediation. Prior studies have generally examined either one or both with respect to a specific rule or a subset of rules within a rule system to the exclusion of other rules in that same system (e.g., Harris & Bromiley, 2007; Zhang & Greve, 2018) or in terms of the total number of rules that are out of compliance with no mention of distinctions between multiple rules (e.g., Anand et al., 2012; Flanagan et al., 2007; Jin & Leslie, 2003). Both approaches implicitly assume that all rules in a given system are alike, at least when it comes to understanding noncompliance and remediation. Contrary to such assumptions, the findings reported here reveal that individual rules differ from one another and that such differences are associated with varying rates of noncompliance and remediation. Our understanding of noncompliance and remediation, therefore, needs to be updated by conceptualizing them as rule-level phenomena.
A conceptualization of noncompliance and remediation as rule-level phenomena points to a fundamentally new research question. The seemingly common view is that noncompliance arises as a result of “organizations gone wild” (Greve et al., 2010). Ill intent is implied in such labels as “wrongdoing” (Palmer, 2012) and “misconduct” (Vaughan, 1999); fault is equally implied in many studies of errors (e.g., Frese & Keith, 2015) and accidents (e.g., Perrow, 1984). Accordingly, most prior studies have traditionally focused on one of two related questions: Why are some organizations more likely than others to fail to comply with a particular rule? Or why are some organizations more likely than others to fail to comply with a higher number of rules? We readily acknowledge the critical role of organizations in understanding noncompliance and remediation. However, this study underscores the importance of a new research question that focuses on rule-level antecedents and complements the dominant emphasis on organizational antecedents: Why are some rules more likely than others to be out of compliance or less likely than others to be remediated? This study offers an initial step toward some answers.
This new research question opens up exciting avenues for future inquiry. Although several prior studies have examined rules, such studies have almost invariably treated rules and their features as the outcomes of interest by examining, for example, the causes of rule births, deaths, or changes (e.g., Beck & Kieser, 2003; Jennings et al., 2005; March et al., 2000; Schulz, 1998; Sullivan, 2010; Zhou, 1993). Few studies have examined the effects of rule features on organizational outcomes. This study not only draws renewed attention to the differences between rules but also advances this literature by linking variations in rule features to variations in rates of noncompliance and remediation. Future studies would do well to explore how other rule features might also play a role in shaping noncompliance and remediation. One natural starting point may be to consider finer-grained variants of components (e.g., repetition in the content of sections) or different types of connections (e.g., dependence vs. interdependence). Another potentially interesting rule feature is plasticity, or the extent to which a rule has undergone revisions (March et al., 2000; Zhou, 1993). We could not examine plasticity here because the food safety rules remained unchanged during the study period; however, this represents an exciting avenue for further insights. Future studies would also do well to consider how rule features, such as complexity, and organizational characteristics might jointly explain noncompliance and remediation. It is possible that some organizations are better able than others to cope with complex rules. Finally, future studies might also consider how features of rule systems also play a role. Others have shown that rule systems evolve over time, increasing and decreasing in size (e.g., Beck & Kieser, 2003; Jennings et al., 2005; March et al., 2000). It is possible that features of individual rules and of the systems in which they reside might jointly shape noncompliance and remediation. In sum, this study advances the notion that noncompliance and remediation can be enhanced by viewing them as rule-level phenomena.
Second, this study contributes to long-standing discussions about how the regulatory legal environment shapes organizational action. Sociolegal scholars have broadly tended to view legal rules as either “a system of incentives and penalties” (Edelman & Suchman, 1997: 487) or “a pervasive belief system that permeates the most fundamental morals and meanings of organizational life” (Edelman & Suchman, 1997: 493). As Edelman and Stryker put it, “There is a debate . . . about whether organizations experience their regulatory environment primarily as a set of externally imposed constraints altering their cost-benefit calculi, or as a set of normative ideals and institutionalized models of compliance” (2005: 538). Both perspectives agree that a given rule is more prone to noncompliance to the extent that such noncompliance poses fewer costs or compliance poses greater costs (see Edelman, 2016; Lange, 2008). However, the former emphasizes economic costs, whereas the latter emphasizes social costs. The findings reported here point to an important third view: cognitive costs. That is, a rule will be more prone to noncompliance to the extent that compliance with it or the remediation of its noncompliance places greater cognitive demands on boundedly rational organizational members. As such, we join others who have noted that efforts to shape organizational action via regulation might necessitate more than incentives and penalties or taken-for-granted cultural norms (e.g., Kagan, 1989); specifically, the structure or design of rules themselves and the systems in which they reside is also critically important. Indeed, “managers violate [legal rules] for reasons other than instrumental action” (Vaughan, 1998: 29). Consequently, inasmuch as legal rules are intended to shape organizational action with the aim of managing the risks of particular adverse outcomes, an understanding of how the structure or design of those rules shapes the likelihood of noncompliance and remediation can aid in the prevention of associated negative consequences. Taken together, this study highlights a fresh perspective on how the regulatory legal environment shapes organizational action.
To develop a framework about the effects of rule complexity on noncompliance and remediation, we drew on theories of routines (e.g., Nelson & Winter, 1982) and learning (e.g., Levitt & March, 1988). Although our empirical findings do not directly contribute to these literatures, our theoretical formulation points to exciting avenues of future inquiry for both. For example, scholars have previously emphasized the firm specificity of routines (e.g., Szulanski, 1996); however, the findings reported here suggest that rules applied uniformly to a population of organizations might shape organizational action in a systematic fashion. In this way, legal rules can be viewed as artifacts that are external to the organization but nonetheless shape organizational routines (D’Adderio, 2011). An important future research direction is thus to consider how legal rules and organizational routines might be linked in practice. It is conceivable that in some cases, a single rule may be linked to multiple routines and in other cases, multiple rules may be linked to a single routine; such variations might be shaped by rule complexity. In addition, scholars have long emphasized the role of attention in organizational learning from feedback (e.g., March & Simon, 1958). An important future research direction is thus to consider how organizational members allocate limited attentional resources in response to feedback from regulatory regimes (Ocasio, 1997). For example, it is possible that rules deemed out of compliance are attended to in a sequential fashion, which might be shaped by rule complexity. Other exciting future research questions related to both routines and learning abound.
Of course, a notable limitation of our study design is that it did not allow us to capture these proposed mediating mechanisms. That is, we empirically examined the effects of rule complexity on noncompliance and remediation, but we were unable to directly observe organizational routines or learning. Although the findings are suggestive of and largely consistent with our theoretical framework, additional research is necessary to conclude that rule complexity indeed affects the accomplishment and refinement of routines as theorized. In addition, other unobserved factors might predict noncompliance and remediation. For example, it is possible that compliance with some rules might entail greater financial costs than others (e.g., investments in specialized equipment vs. proper handwashing techniques) and, therefore, be more prone to noncompliance. Of course, the burden of such costs would presumably vary from one organization to the next depending on financial resources, among other factors. We sought to account for such organizational heterogeneity with the use of various controls as well as restaurant fixed effects; the effects of rule complexity were robust to the inclusion of such controls. Alternatively, it is possible that noncompliance with some rules is more easily detectable than others and, therefore, more prone to be deemed out of compliance. Moreover, considerable evidence suggests that auditors and inspectors themselves may be prone to biases that compound this issue. We sought to account for these issues by including fixed effects for inspectors and rule content; again, the effects of rule complexity were robust to the inclusion of such controls. More generally, our intent was not to offer here a comprehensive theory of noncompliance and remediation but, rather, to examine the effects of rule complexity on both. However, we do consider such aims to be worthwhile, and the pursuit should consider not only various features of the rules but also a range of organization- and inspector-level factors.
Finally, some characteristics of our study context represent potentially important boundary conditions; we discuss here a few possibilities. First, the total number of food safety rules in force in our study context was 86; however, the effects of rule complexity on noncompliance and remediation might vary in other settings, such as manufacturing (e.g., Anand et al., 2012) or accounting (e.g., Collins et al., 2009), where rule systems might be larger in size or in settings with “institutional voids” and little legal oversight (e.g., Khanna & Palepu, 2000). Second, inspectors marked compliance with each rule, or the lack of it, in a binary fashion; however, the effects of rule complexity on noncompliance and remediation might vary in settings where noncompliance is instead a matter of degree or rate of occurrence (e.g., Ramanujam & Goodman, 2003). Third, noncompliance with food safety rules is often (but certainly not always) directly visible to inspectors and sometimes even consumers, and both tend to hold in high regard the scientific theories on which these rules are based. However, the effects of rule complexity on noncompliance and remediation might vary in highly technical contexts where regulatory officials must rely on organizational experts to verify compliance (see Vaughan, 1996) or in contexts where agreement is lacking regarding what constitutes compliance with the rules in force (see Edelman, 2016); both possibilities point to technological or industry maturity as a potential boundary condition. Of course, the study context was specific in other ways, such as geographical area and time period, among others; further research in other study contexts will strengthen the generalizability of the findings reported here.
Practical Implications
This study points to several practical implications, each of which follow directly from our core premise: noncompliance and remediation are fundamentally rule-level phenomena. Efforts to prevent noncompliance and promote remediation must therefore be informed by rules themselves. First, policy makers need to carefully consider how rules are designed. Our findings suggest that efforts to decrease noncompliance by increasing the size of rules or by introducing new links to other rules may lead to unintended consequences. Second, regulatory agents need to more carefully consider how noncompliance is monitored and feedback about it given to organizations. Our findings suggest that monitoring efforts should be focused on complex rules; moreover, feedback about noncompliance with highly connected rules might be more effective if regulatory officials and organizational members work together to identify the causes of it and potential solutions to it. Third, managers need to consider carefully the features of the various rules that regulate organizational action. Our findings suggest that managers must recognize the challenges of achieving and maintaining compliance with complex rules and perhaps redesign routines accordingly. For all parties, legal rules embody important societal values and are in force to protect the public from risk. A deeper understanding of how such rules shape noncompliance and remediation will help ensure that these values are upheld and risks mitigated.
Conclusion
We began by asserting that current theoretical accounts of noncompliance and remediation are inherently incomplete. In an effort to offer a fuller view, we have advanced a rule-level perspective to address variations across rules in the rates of noncompliance and remediation. In doing so, we have attempted to go beyond the traditional view of many studies that seem to paint an overly self-interested picture of organizations. We suggest that the design of rules themselves might create significant challenges for otherwise well-intentioned organizations. Scholars and practitioners alike should thus consider how a better understanding of rules can shed new light on noncompliance and remediation and thereby hopefully reduce the occurrence of adverse outcomes that often arise as a result.
Supplemental Material
JOM842262_SM – Supplemental material for The Effects of Rule Complexity on Organizational Noncompliance and Remediation: Evidence From Restaurant Health Inspections
Supplemental material, JOM842262_SM for The Effects of Rule Complexity on Organizational Noncompliance and Remediation: Evidence From Restaurant Health Inspections by David W. Lehman, Bruce Cooil and Rangaraj Ramanujam in Journal of Management
Footnotes
Acknowledgements
The authors wish to thank the multiple informants at the Los Angeles Department of Public Health who offered their kind assistance throughout this research project. Earlier versions of this manuscript were presented at the 2012 Academy of Management Meetings in Boston, Massachusetts, and at the 2014 Carnegie School of Learning Conference in Pacific Grove, California; the authors are grateful to participants in both forums for their insightful comments. The authors also wish to acknowledge the constructive suggestions provided by the associate editor and two anonymous reviewers throughout the review process. Any remaining errors are our own. Bruce Cooil gratefully acknowledges support from the Dean’s Fund for Faculty Research at the Owen Graduate School of Management, Vanderbilt University.
Supplemental material for this article is available with the manuscript on the JOM website.
Notes
References
Supplementary Material
Please find the following supplemental material available below.
For Open Access articles published under a Creative Commons License, all supplemental material carries the same license as the article it is associated with.
For non-Open Access articles published, all supplemental material carries a non-exclusive license, and permission requests for re-use of supplemental material or any part of supplemental material shall be sent directly to the copyright owner as specified in the copyright notice associated with the article.