
Abstract
The resource-based and competitive dynamics perspectives emphasize market activity in defining competition: Rivals compete in product and factor markets for customers and scarce resources. To address market opportunities, however, resources must be bundled into capabilities. Bundling represents the link between resources and value creation. Despite the competitive implications of resource bundling, the current literature implicitly assumes that firms take bundling actions in isolation, which does not reflect the phenomena in most industries, where rivals observe, react to, and learn from each other’s bundling, potentially resulting in escalation. To address this gap, we explore the competitive drivers of bundling, which differs from market-oriented activities in its internal nature and how it escalates within and across markets. We posit that simultaneous overlap in factor and product markets can enhance the visibility of bundling activity, foster resource similarity, and create performance pressure among rivals, leading to a market-level “race to bundle” and differentiation in bundling. We also analyze the moderating roles of the focal firm’s resource endowments relative to its rivals and the extent to which it overlaps with these rivals across factor markets. Based on over a million firm-month observations of 5,415 upstream oil and gas operators, we find that rivals’ bundling intensity is positively related to subsequent focal firm bundling intensity and nonconformity. These relationships are moderated by the firm’s relative resource endowments and multi-factor market overlap. This important complementary aspect of competition can enhance both the resource-based view and competitive dynamics research.
Introduction
Competitive dynamics research analyzes firms’ market-oriented actions and interactions, emphasizing how rivals “attack” one another in product or factor markets to gain customers or resources (Chen & Miller, 2012). Yet, how resources are utilized is at least as important as how firms come to possess them and the markets in which they are deployed (Mahoney & Pandian, 1992). In most industries, rivals observe, react to, and imitate each other’s bundling actions, through which firms combine and integrate resources into capabilities to maximize value creation (Sirmon, Hitt, & Ireland, 2007). For example, studies have analyzed how airlines attack and respond to one another through product market actions, such as market entry (e.g., Baum & Korn, 1996; Gimeno, 1999) and price changes (e.g., Chen & MacMillan, 1992; Gimeno & Woo, 1996). However, anecdotal evidence suggests that airlines are also in a race to offer better meals (Chung, 2023), train pilots more effectively (Woods, 2022), and optimize boarding procedures (Kline, 2023). Despite the implications of bundling activity for firm performance and competitive outcomes (e.g., Sirmon, Gove, & Hitt, 2008) and the prevalence of firm interactions involving such activity, the competitive drivers of bundling remain overlooked in the literature. As a result, an activity critical to competitive advantage is treated as occurring in isolation, devoid of interfirm dynamics.
To address this gap, we explore the competitive dynamics related to resource bundling activity. How do rivals react to each other’s bundling activity with their own, and how does bundling escalate among rivals? We combine arguments from the resource-based view (RBV) and resource orchestration literatures with those from competitive dynamics to demonstrate how firms interact within and across geographic markets in a “race” to better utilize key resources. In contrast to the literature to date, we posit that internal actions such as bundling can have competitive drivers and implications and find evidence that rival bundling activity affects both the intensity and the nature of focal firm bundling. Thus, current models of rivalry overlook an important avenue of interaction, missing a widespread phenomenon critical to competitive advantage. This kind of competition is prevalent across industries, and it is distinct from market rivalry in its escalation mechanisms, motivations, and the level at which it occurs. We thus develop a model of the competitive drivers of bundling and explain how these drivers are facilitated by firm overlap in product and factor markets. We then explore how resource endowments of a firm moderate these drivers. Finally, we also contribute to the study of multimarket competition by exploring the implications of multi-factor market contact for bundling activity. To our knowledge, this study is the first to empirically examine multi-factor market overlap. With these contributions, we bridge the competitive dynamics and RBV literatures, advancing a key agenda in strategic management research (Chen, Michel, & Lin, 2021; Smith, Ferrier, & Ndofor, 2005).
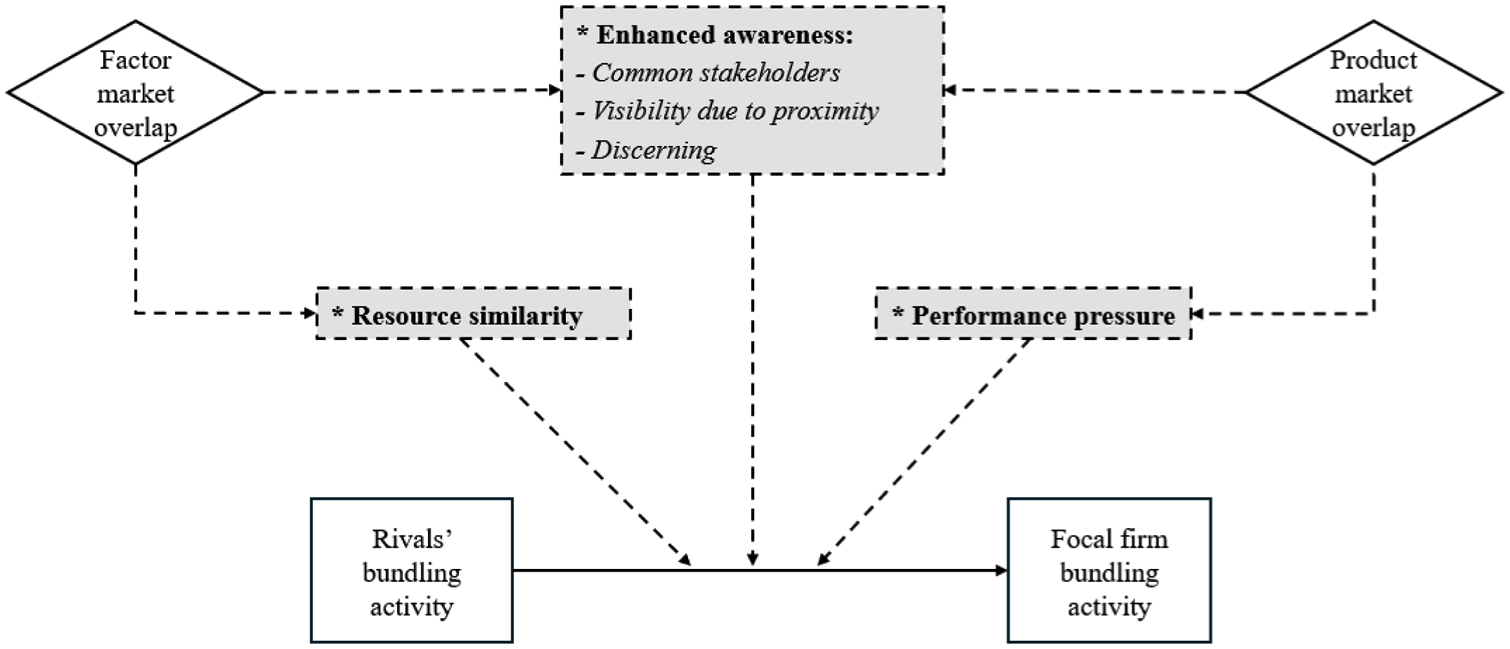
In our model of the competitive drivers of resource bundling, product and factor market overlap among rivals distinctly facilitates bundling interactions, which can lead to escalation at the market level. First, our framework challenges an implicit assumption in the literature that, due to its internal nature, bundling is not visible to rivals by analyzing how rivals can become aware of and interpret one another’s bundling activity. Rivals can gain an enhanced awareness of each other’s bundling activity: (a) by interacting with a common set of stakeholders, (b) from the visibility afforded by geographical proximity, and (c) through “discerning”—a process that involves interpreting signals in factor and product markets stemming from rivals’ resource structuring and deployment activity. Second, an overlap in factor markets implies resource similarity among rivals, which is also critical in the escalation of bundling. Third, combined with rivals’ bundling activity, product market overlap creates a performance pressure to bundle, motivating firms to engage in bundling to “keep up” with their competitors in how efficiently they utilize their resources and maximize value creation. Based on this model, we analyze how rivals’ bundling activity affects the intensity and nonconformity of focal firm bundling, two critical outcomes in competitive dynamics (Chen & Miller, 2012).
We propose two key moderators of these relationships. First, we explore how a firm’s relative resource endowments (Ndofor, Sirmon, & He, 2011) can mitigate the intensity and nonconformity of its reaction to rivals’ bundling activity. Based on the potential trade-off between a firm’s resource endowments and the marginal benefit of bundling (Sirmon et al., 2008) and the competitive asymmetries among firms with different resource levels (Chen, 1996), we propose an attenuation effect on bundling interactions. Finally, we explore how multi-factor market contact (Markman, Gianiodis, & Buchholtz, 2009) affects focal firm bundling behavior through enhanced resource similarity and awareness among rivals. We conclude that, because the motivation to forbear associated with market rivalry will be absent in bundling interactions (Theeke & Lee, 2017), multi-factor market contact can spur imitation and escalation among rivals, resulting in more intense but also more conforming bundling activity.
We examine these relationships in a study of the upstream oil and gas industry, which is characterized by intense competition and escalating patterns of bundling activity. In this industry, rivals often overlap in both factor and product markets, ensuring that all three proposed competitive drivers of bundling activity are in play. To more accurately capture interactive bundling behavior, we control for the potentially confounding effects of resource structuring and deployment (Sirmon et al., 2007). In the following sections, we outline the paper’s theoretical foundations and develop our model of the competitive drivers of resource bundling, from which we derive our hypotheses. We then describe the methods used to test them and conclude with a discussion of the findings and their implications for future research and practice.
Theoretical Background
In the RBV, resource heterogeneity is the main driver of performance heterogeneity (Peteraf, 1993). Strategic resources, valuable resources that are also scarce and inimitable, can enable a firm to achieve and sustain competitive advantage (Barney, 1991). In line with this premise, the RBV traditionally focuses on resources and their relationship to firm performance (Barney, Ketchen, & Wright, 2021). However, “a firm may achieve rents not because it has better resources, but rather the firm’s distinctive competence involves making better use of its resources” (Mahoney & Pandian, 1992: 365). The contingent nature of the resource–firm performance relationship has long been recognized (Crook, Ketchen, Combs, & Todd, 2008). The work on resource management and orchestration addresses this by focusing on actions and processes that link resources to value creation (Sirmon, Hitt, & Ireland, 2011). Accordingly, the resource management framework (Sirmon et al., 2007) posits that three kinds of activity enable firms to obtain and utilize strategic resources: (a) structuring, which refers to the acquisition, accumulation, and divestiture of strategic resources; (b) bundling, which refers to the combination and integration of these resources into firm capabilities; and (c) leveraging, which addresses how firms mobilize, coordinate, and deploy their capabilities.
Unlike the RBV, which is largely static at its core (Kraaijenbrink, Spender, & Groen, 2010) and emphasizes competitive advantage that is sustainable (Barney & Arikan, 2001), the competitive dynamics literature associates competition with disequilibrium and the pursuit of temporary advantages (D’Aveni, Dagnino, & Smith, 2010). Accordingly, it analyzes the “interactions and interrelationships” among rivals (Chen et al., 2021: 1821)—firms that concurrently operate in a given market (Markman et al., 2009). Owing to its Schumpeterian origins, the literature’s primary object of study has been competitive actions (Smith et al., 2005), moves that enable “a firm to defend or improve its relative competitive position” in market contexts (Smith, Grimm, Gannon, & Chen, 1991: 61). In competitive dynamics, the exchanges of action and response give rise to a dynamic process that influences firm performance and characterizes markets and industries (Ferrier, 2001). Chen (1996) posits that while rivals’ competitive actions can motivate a focal firm to respond, the likelihood of this response will also depend on the firm’s awareness of the rival activity and its capability to take similar actions.
The existing competitive dynamics literature has analyzed the interactions among rivals within and across product markets and, to a lesser extent, factor markets. The activities related to these interactions primarily reflect the resource leveraging and structuring stages of the resource management process. However, firms often do not take their bundling actions in a vacuum; through bundling, rivals can influence their own and, in turn, each other’s competitive positions and “relative performance”—a key construct in market competition (Ferrier, 2001: 858). Accordingly, below, we first discuss the existing work on factor- and product-market competition, which we connect with resource structuring and leveraging, respectively. We then explore the competitive drivers of resource bundling, which is internal to the firm.
Resource Structuring and Factor-Market Competition
Resource structuring involves the acquisition or development and divestiture of resources. Thus, it is the first stage of the resource management process and has important performance implications. Because a firm’s resource endowments determine the breadth of actions it can subsequently take (Ndofor et al., 2011), resource structuring can also create path dependencies. Excluding non-tradable resources, such as know-how, social capital, and reputation, which are developed internally (Dierickx & Cool, 1989), firms procure strategic resources in strategic factor markets (Barney, 1986). Firms also divest their non-productive assets in factor markets, which is particularly salient for those experiencing or anticipating poor performance (Morrow, Sirmon, Hitt, & Holcomb, 2007).
Factor markets, where rivals vie for the same resources, constitute competitive domains. Due to the inherently scarce nature of the traded—strategic—resources, strategic factor markets (Barney, 1986) are particularly prone to “competition over resource positions” (Markman et al., 2009: 423), in the form of bidding wars (Makadok & Barney, 2001). The more scarce, nonimitable, and nonsubstitutable a resource is, the more intense the rivalry it is likely to incite (Peteraf, 1993). Moreover, assuming that factor market overlap engenders awareness among rivals of each other’s factor market activity, factor market competition tends to escalate reciprocally as rivals acquire scarce resources (Theeke & Lee, 2017), such as patents (Gianiodis, Markman, & Panagopoulos, 2019) and supply chain resources (Ellram, Tate, & Feitzinger, 2013). A firm might also choose to acquire strategic resources to pre-empt its rivals (Capron & Chatain, 2008). In any case, intensifying factor market competition benefits factor owners, who are able to appropriate more value as a result (Asmussen, 2015).
Resource Leveraging and Product-Market Competition
The final stage in the resource management process—leveraging—involves the utilization of existing firm capabilities to execute a chosen strategy and, ultimately, create value (Sirmon et al., 2011). Leveraging activity relates to demand, and it is product-market oriented. It involves identifying opportunities in the marketplace, matching them with the capabilities needed to capture them, integrating those capabilities, and deploying them in product markets (Sirmon et al., 2007). Product markets are the “flipside” of factor markets. As noted, rivalry within and across product markets has been the main focus of the competitive dynamics research (Hughes-Morgan, Kolev, & Mcnamara, 2018). The actions herein, such as new product introductions (e.g., Lee, Smith, Grimm, & Schomburg, 2000), product market entry (e.g., Baum & Korn, 1996) and exit (e.g., Upson, Ketchen, Connelly, & Ranft, 2012), the launch of marketing campaigns (e.g., Yu & Cannella, 2007), and changes in pricing (e.g., Ferrier, Smith, & Grimm, 1999), largely correspond to resource deployment activities in the resource management framework (Costa, Cool, & Dierickx, 2013). Likewise, the resource orchestration literature has emphasized the relationship between product market-oriented activity and performance outcomes (D’Oria, Crook, Ketchen, Sirmon, & Wright, 2021).
In competitive dynamics, “firms act, and rivals react” (Smith et al., 2005: 318), resulting in escalating patterns of market competition and rivalry. Accordingly, a focal firm can be driven to engage in competitive activity when rivals’ activity threatens its market position, leading to dyadic exchanges of competitive moves (Chen & Miller, 2015). Alternatively, a firm can be driven to display competitive behavior by the intensity of competition in a given market or industry (D’Aveni, 1994; Young, Smith, & Grimm, 1996) in order to improve or maintain its “relative competitive position” (Smith et al., 2005: 321). As a strategic choice, rivals may also refrain from escalating competition within and across markets (Andrevski & Miller, 2022), as this can benefit customers at the expense of competing firms (Andrevski & Ferrier, 2019).
Competitive Drivers of Resource Bundling
Bundling is the activity of combining resources into capabilities (Sirmon et al., 2011), which are bundles of complementary—strategic and nonstrategic—resources and processes (Helfat & Winter, 2011). Organizational capabilities address how resources are utilized in performing “a coordinated set of tasks” (Helfat & Peteraf, 2003: 999) and have distinct outcomes that are related to firm-level value creation and performance (Barney et al., 2021; Drnevich & Kriauciunas, 2011). In the resource management framework (Sirmon et al., 2007, 2011), bundling activity has three main implications on capabilities. Through bundling, firms can (a) maintain capabilities by replenishing them and making minor improvements, such as providing employees with on-the-job training to update knowledge; (b) also reconfigure their existing capabilities to increase their effectiveness or efficiency, for example, by adopting new technologies; and (c) build new capabilities.
Across the three stages of resource management, bundling serves as the bridge between resource acquisition and deployment (Sirmon et al., 2007). However, bundling activity, on its own, can improve value creation and affect firm performance. Bundling can facilitate synergy among resources and enhance their value-creating potential (Schmidt & Keil, 2013). Through bundling, a firm can create uniquely valuable resource combinations using resources similar or even inferior to those of its rivals (Zott, 2003). Accordingly, effective bundling is an antecedent of advantage in competitive rivalry (Holcomb, Holmes, & Connelly, 2009; Sirmon et al., 2008). Research has shown that various bundling activities through human resource systems enable firms to extract greater value from their workforce (e.g., Patel, Messersmith, & Lepak, 2013). Bundling process is also central to innovation (Carnes & Ireland, 2013), as it can unlock new value-creating potential for a given resource, which, in turn, can create competitive advantage through superior value or enhanced efficiency (James, Leiblein, & Lu, 2013). By bundling available resources with new technologies, firms can update eroding capabilities or increase the lifespans of critical resources (Helfat & Peteraf, 2003). Rebundling strategic resources through structural and operational changes can also improve performance (Bridoux, Smith, & Grimm, 2013). For example, integrating new knowledge into current capabilities (Zahra, Ireland, & Hitt, 2000) and rebundling scarce human capital with generic human capital can improve firm performance (Hitt, Bierman, Uhlenbruck, & Shimizu, 2006). Thus, resource bundling is not merely complementary to resource structuring; holding constant factor- and product-market activity, resource bundling actions can enable or help sustain competitive advantage.
Despite these salient implications of bundling for competitive advantage and firm performance, its competitive drivers have largely been overlooked, likely because it does not fit the “externally directed” definition of competitive action in the literature (Smith et al., 2005: 321). Indeed, resource bundling differs from market-oriented competitive actions in two ways. First, bundling activity is internal and does not manifest itself in factor and product markets. This might limit the visibility of bundling actions and the awareness among rivals about each other’s bundling activity. Second, bundling is not inherently zero-sum. Through bundling, a firm can improve its competitive position and relative performance without “attacking” its rivals. This contrasts with market actions that tend to escalate into “tit for tat” exchanges among rivals.
However, we posit that, under certain conditions, resource bundling has both salient performance implications and competitive drivers. We specify three such drivers of bundling activity facilitated by market overlap: (a) enhanced awareness, (b) resource similarity, and (c) performance pressure. While market overlap is an established key factor in competitive dynamics (Chen, 1996), the escalation of bundling among rivals calls for a more nuanced understanding of market overlap and involves mechanisms that differ from those underlying market rivalry. Below, we specify how product and factor market overlap and their combination can distinctly enable the escalation of bundling activity among rivals. In doing so, we first challenge an implicit assumption in the existing literature that bundling is an activity “invisible” to rivals, and we discuss the mechanisms that enhance its visibility and rivals’ awareness. Second, we describe the relationship between factor market overlap and resource similarity, and how it contributes to the escalation of bundling among rivals. Finally, we explore the performance pressure product-market rivals’ bundling can constitute and how, combined with enhanced awareness and resource similarity, it is likely to drive focal firm bundling intensity—our mainline hypothesis.
Enhanced Awareness
In competitive dynamics, awareness of rival actions is a prerequisite of response and escalation, which hinges upon the assumption that market overlap among rivals results in awareness of each other’s market-oriented actions (Chen, 1996). Conversely, because bundling activity is internal, it is assumed to be less visible to outsiders (Bridoux et al., 2013), which can limit rivals’ awareness and therefore likelihood of response. Further, because “awareness” in competitive dynamics implies an understanding of the cause-and-effect relationships between rival actions and their outcomes (Andrevski, Miller, Le Breton-Miller, & Ferrier, 2022), the internal nature of bundling activity is also associated with causal ambiguity (Reed & DeFillippi, 1990). We argue that, although bundling activity is relatively less visible, as explained below, three factors contingent on factor and product market overlap can enhance rivals’ awareness of each other’s bundling activity, thereby facilitating reaction and escalation.
Common stakeholders
Key stakeholders, such as customers (in product markets) and suppliers (in factor markets), can serve as conduits of information and business intelligence among rivals (Runge, Schwens, & Schulz, 2022; Ryu, McCann, & Reuer, 2018). Overlap in product and factor markets also indicates that rivals are likely to deal with the same—or a similar set of—key stakeholders, creating opportunities for knowledge spillovers and revealing firms’ bundling activity (Agarwal, Ganco, & Ziedonis, 2009; Uzzi & Gillespie, 2002). Such spillovers can flow either forward or backward along the value chain. For example, suppliers and factor owners can observe order quantities, specifications, and the timing of firm procurement activity (Ethiraj & Levinthal, 2004). Likewise, customers typically have deep and unique insights into product features, innovativeness, quantity available, and other qualities of products (Prahalad & Ramaswamy, 2004), which relate to the processes of production and bundling. Customers can transmit such information as they compare (and bargain for) product offerings and features across rivals. Further, on the factor market side, human resources also gain insights about bundling activity within firms, and they tend to facilitate knowledge spillovers across rivals through turnover (Almeida & Kogut, 1999). Thus, firms that hire employees (especially technical and managerial), contractors, or consultants from a given area or functional background will be more aware of each other’s bundling activity.
Regulators and certifying bodies are another key stakeholder group regarding the visibility of bundling activity among rivals in both product and factor markets. For example, on the factor market side, across the United States, upstream oil and gas operations require permits which are often public information. Patents issued for products and production processes can also contain information about firm bundling activity (Gans & Stern, 2003). Likewise, firms need to disclose salient information about their internal processes or adhere to standard practices to obtain industry professional certifications, such as ISO 9000 or Fair Trade, which can “reduce information asymmetries in supply chains” (Terlaak & King, 2006: 579). Thus, information spillovers regarding bundling activities and their timing are often inevitable across firms that deal with overlapping regulatory or certifying bodies.
Proximity
Firms can also gain awareness of each other’s bundling activity if they can directly observe the rivals in their geographical proximity. The important role location and geographical proximity play in both competition and learning has long been recognized (e.g., Greve, 1998; Porter, 2000). If overlap in product or factor markets entails geographic co-location, certain bundling activities can become directly observable among rivals. For example, factor market rivals that operate in close proximity often cannot conceal from one another bundling activities such as the upgrade, renovation, or expansion of facilities and physical infrastructure. Likewise, on the product market and resource deployment side, actions related to retail and distribution channels, physical stores, and marketing are difficult to conceal from rivals and can involve visible bundling activities. Such visibility is pronounced in service industries, where service features and underlying bundling activities are directly observable as services are rendered, as in changes to airline boarding procedures (e.g., new boarding groups, altered sequencing, or digital boarding passes). 1
Discerning
In the resource management process, product market deployment is typically preceded by the bundling of resources, which in turn, are acquired in factor markets (Sirmon et al., 2007). Considering the assumption in the existing literature that market overlap facilitates mutual awareness among rivals of each other’s market actions (Chen, 1996; Markman et al., 2009), an overlap in both factor and product markets can enable a focal firm to discern its rivals’ bundling activity even if this activity is not directly observable by outsiders. This mechanism addresses the mitigation of causal ambiguity that typically surrounds bundling activity, whereby rivals fail to understand the relationships between each other’s resources and the outcomes of related capabilities (McIver & Lengnick-Hall, 2018). A simultaneous awareness of rivals’ resource acquisition and deployment activities can reveal the relationships between capability inputs and outputs, enabling a focal firm to discern rivals’ bundling activity connecting the two. For instance, Intel and AMD, archrivals in the semiconductor industry, are known to closely follow each other’s transactions with key suppliers like TSMC along with specifications of new products to analyze each other’s production capabilities and discern the underlying bundling activities, which is a critical piece of information guiding their own subsequent bundling activity and capability configurations (Cherney & Nellis, 2024).
The mechanisms through which rivals become aware of one another’s bundling actions also have important implications for how quickly they react to them. 2 If bundling actions are readily visible to outsiders due to spatial proximity, rivals’ reaction time will be shorter as they are likely to become aware of one another’s activity relatively quickly, potentially even before the initial bundling process is complete. Awareness through common stakeholders, on the other hand, is likely to involve a longer reaction time as it will be driven by subsequent transactions with stakeholders (e.g., customers and suppliers) and/or deliberate environmental scanning (Teece, 2007). Furthermore, firms vary in their capability to solicit information from customers and suppliers (Helfat & Raubitschek, 2000; Helfat & Winter, 2011). Awareness through discerning, on the other hand, involves the longest potential reaction time. In the process of discerning, firms should (a) first observe rivals’ resource acquisition activity in a factor market, (b) followed by resource deployment activity in a product market, and, (c) in the last step, these pieces of information should be interpreted in combination, requiring additional time and resources, and thereby limiting firms’ ability to react quickly (Smith et al., 1991).
Resource Similarity
In competitive dynamics, rivalry is more likely to escalate among rivals with similar resource profiles (Chen, Su, & Tsai, 2007; Smith et al., 2005). Due to the literature’s emphasis on product markets (Chen et al., 2021), however, resource similarity is considered independent of market overlap. 3 Distinguishing the competitive implications of factor market overlap from those of product market overlap helps clarify the relationship between market commonality and resource similarity. Because resources traded in a given factor market are likely to be similar in function and characteristics (Felin, Kauffman, Mastrogiorgio, & Mastrogiorgio, 2016), rivals overlapping in factor markets are likely to have similar resource profiles, enhancing their capability and likelihood of reacting to each other’s activity. As resources determine the breadth of actions a firm can take (Ndofor et al., 2011), firms that possess similar resources are more likely to be capable of engaging in similar types of activities, including bundling. Resource similarity among rivals can also eliminate or minimize the need for additional resource acquisition when rivals react to each other with conforming bundling activity. These effects are particularly salient for firms that overlap in strategic factor markets (Barney, 1986). Strategic resources are scarcer and costlier than others. As a result, firms prioritize their strategic resources by building their organizational capabilities “around” them through bundling actions that accentuate such resources to maximize their value-creating potential (Makadok, 2001).
Performance Pressure
Despite its internal and non-zero-sum nature, bundling activity can constitute performance pressure and escalate among rivals that overlap in product markets. However, this process differs from the conventional conceptualization of product market rivalry in both the motivation behind firm activity and the mechanism through which this activity escalates. Firms are in a constant race to achieve and sustain competitive advantage, which requires creation of greater economic value than rivals. Economic value creation is a function of both cost and consumer value (Peteraf & Barney, 2003). The latter is about resource leveraging through which firms seek and exploit market opportunities (Sirmon et al., 2008); leveraging and deployment activity can escalate into product market rivalry via dyadic exchanges, where firms “attack” rivals through market actions to gain customers or, threatened by rivals’ attacks, respond with their own market activity to defend their positions (Chen & Miller, 1994). Resource bundling, on the other hand, is about optimal utilization of the firm’s existing resources to maximize value creation (Sirmon et al., 2011). Firms “performing particular activities more efficiently than competitors” can achieve cost-driven competitive advantages (Porter, 1996: 62). Thus, bundling can enable a firm to improve its relative performance without engaging in further factor or product market activity (Barney & Arikan, 2001).
On the flip side, rivals’ bundling actions—and the implied efficiency advantages—can serve as a salient competitive cue for a focal firm. Because value creation materializes ultimately in product markets, performance pressure is conditioned by overlap in product markets. As markets evolve, rivals’ efforts to maximize value creation through bundling inevitably affect each other’s relative performance. In turn, a focal firm may become motivated to “act” in order to improve or maintain its own standing (Barnett, 1997; D’Aveni et al., 2010). Notably, such activity reflects a firm’s reaction to the broader competitive environment rather than retaliation to a specific rival (Derfus, Maggitti, Grimm, & Smith, 2008), as an initial “attack” is not present in this case. Accordingly, firms often utilize market-level benchmarking (Panagiotou, 2007; Porter, 1980), where rivals’ capability levels serve as reference points for bundling. As competition becomes a series of races in operational effectiveness (Porter, 1996), firms tend to engage in escalating series of actions “to maintain pace with opponents, which leads to an environment of great competitive intensity” (Chen, Lin, & Michel, 2010: 1410-1411); those that fail to do so face performance declines (Andrevski & Ferrier, 2019). For successful firms, such competition driven by dynamism in crafting and constant fine-tuning capabilities yields “a series of temporary competitive advantages” rather than a sustained one based on scarce resources (Morrow et al., 2007: 281).
Bundling can be a salient reaction to such pressure—one that does not constitute direct “attack” on rivals. Unlike resource structuring and leveraging (market-oriented activities), bundling is less likely to escalate into zero-sum rivalry, which primarily benefits customers and factor owners. Moreover, bundling does not necessarily involve additional investment in resource acquisition and can be executed relatively quickly, yet it may yield enduring positive impact on firm performance (Bridoux et al., 2013). Empirical evidence also suggests that performance pressure motivates bundling activity (Ketchen & Palmer, 1999). The benefit a firm can derive from an activity depends on the intensity of competition in the context where the activity occurs (Nadkarni, Chen, & Chen, 2016). Accordingly, as firms react to the performance pressure driven by their rivals’ bundling efforts by intensifying their own bundling activity, bundling is likely to escalate at the market or industry level. A salient example is the recent widespread race to integrate artificial intelligence (AI) into existing organizational capabilities. Accordingly, across a multitude of industries, ranging from retail to manufacturing, transportation, and healthcare, “peer competitive pressure is the largest influencer of the decision to adopt AI and make it work across all enterprise functions” at the “industry level” (Seong & Bughin, 2018). Figure 1 illustrates our model of the competitive drivers of bundling activity among rivals that overlap in both factor and product markets.
The Competitive Drivers of Resource Bundling
Building on these theoretical reflections, we first outline a baseline hypothesis on the relationship between the bundling intensity of a focal firm and the preceding aggregate bundling intensity of the rivals it overlaps with both in product and factor markets. To account for the sequential nature of the resource management process (Sirmon et al., 2007), we hold constant focal firm resource structuring and deployment activity.
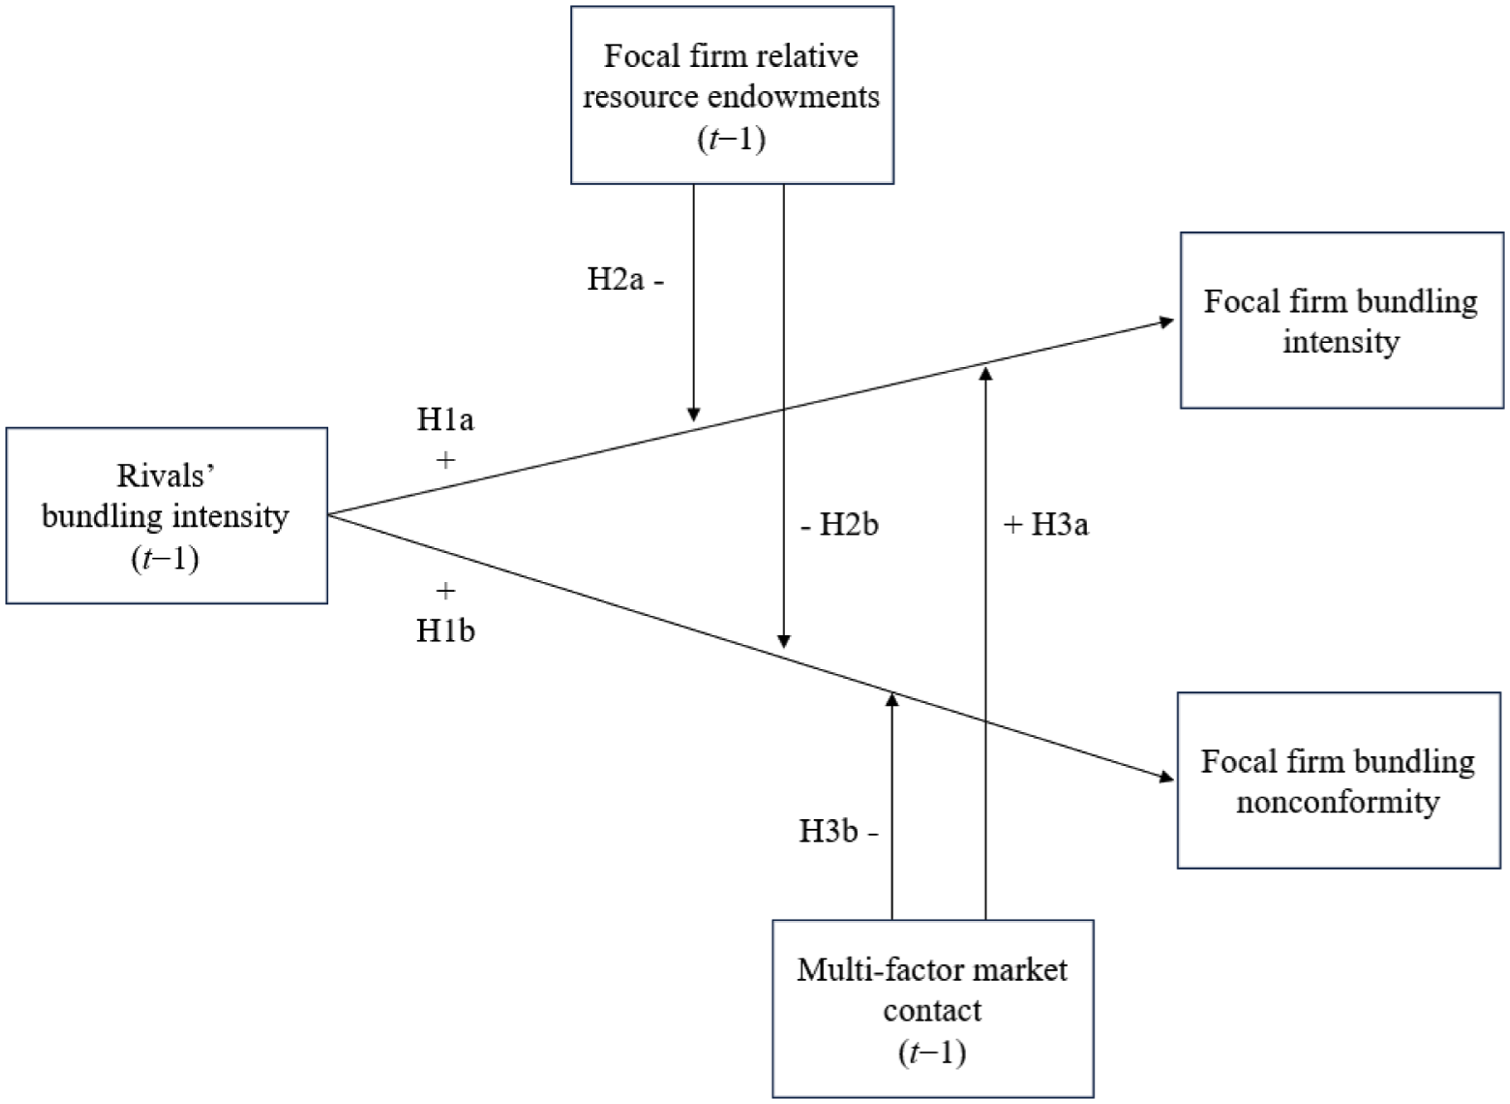
Hypothesis 1a: Rivals’ bundling intensity is positively related to subsequent focal firm bundling intensity.
As firms compete, they take a variety of actions in combination (D’Aveni, 1994). In this vein, the competitive dynamics literature analyzes firm competitive activity in repertoires—the entire set of actions a firm takes in a given period (Ferrier et al., 1999; Miller & Chen, 1996b). Nonconformity reflects how much a firm’s repertoire of actions differs from the industry average (Miller & Chen, 1996a). The literature has used various terms to describe such nonconformity, including “competitive deviance” (Ndofor et al., 2011), “action dissimilarity” (Gimeno & Woo, 1996), and “competitive action heterogeneity” (Hughes-Morgan, Ferrier, & Labianca, 2011). Action nonconformity is one of the critical aspects of competitive behavior, because a repertoire that does not conform to market or industry norms can be difficult for rivals to imitate, impeding their ability to respond (Chen & Miller, 1994) or delaying their response (Chen, Smith, & Grimm, 1992). Thus, nonconforming activity can lead to distinctive and more enduring competitive advantages.
Nonconformity in resource management has salient implications for competitive advantage (Ndofor et al., 2011). Nonconformity in bundling activity can lead to performance heterogeneity among rivals under resource parity. Unlike internally developed strategic resources (Dierickx & Cool, 1989), resources acquired in factor markets are not necessarily unique, and their value depends on how they complement firm capabilities (Makadok, 2010). By adopting a repertoire of bundling actions that differs from those of its rivals, a focal firm can achieve unique capability configurations and competitive advantage, even in the absence of superior resources (Peteraf, 1993). Bundling may also facilitate novel resource combinations. For example, Baker and Nelson (2005) found that via innovative extraction methods, depleted coal mines can become sources of methane gas. Indeed, research indicates that competitive nonconformity improves relative performance (Caves & Ghemawat, 1992; Ferrier & Lee, 2002) and that firms tend to experiment with nonconforming action combinations when faced with poor performance (Hughes-Morgan & Ferrier, 2017). Further, as performance pressure can drive rivals to simultaneously invest in resource acquisition, costs of inputs—both scarce and generic—tend to increase, making bundling activity more costly (Barnett, 1997; Derfus et al., 2008). Firms that follow best practices and conform to proven capability configurations are particularly vulnerable to this effect as they might need to simultaneously compete with each other for the same inputs. Under these conditions, nonconformity in bundling activity can also be cost-saving by enabling the utilization of alternative inputs. Overall, rivals’ bundling activity can impose competitive pressure on a focal firm to not only intensify its bundling activity but also differentiate it.
Hypothesis 1b: Rivals’ bundling intensity is positively related to subsequent focal firm bundling nonconformity.
Relative Resource Endowments: Attenuated and Conforming Reaction
Both resource orchestration and competitive dynamics perspectives imply a potential tradeoff between a firm’s resource position advantages and dynamism in bundling activity.
Value creation is maximized when bundling activity and resources complement each other (Black & Boal, 1994). Yet, there are limitations to the synergy and the competitive improvement a firm can achieve through resource bundling and capability building (Makadok, 2001; Ray, Barney, & Muhanna, 2004). Resource and action heterogeneity represent two distinct but related paths toward performance heterogeneity. Capturing this interplay requires an examination of the “independent effects” of “relative or comparative levels of rivals’ resource management and resources” (Sirmon et al., 2008: 920). Accordingly, at high levels of “relative resource endowments” (Ndofor et al., 2011), the marginal benefit of bundling activity diminishes, as resources themselves might become the main drivers of performance heterogeneity. Conversely, “managerial ability becomes increasingly important in firms at lower levels of resource quality” (Holcomb et al., 2009: 478), as “large differential in resources [in favor of the focal firm] overwhelms the influence of managerial bundling” (Sirmon et al., 2008: 923-924). Further, bundling actions also entail both direct and indirect costs, including investments in complementary assets (Ellram et al., 2013), learning (Winter, 2003), administrative costs and complexity (Helfat et al., 2007), as well as attention and cognitive effort—another limited resource (Helfat & Peteraf, 2015). Accordingly, from a rational point of view, firms with high relative resource endowments can choose to react to rivals’ bundling activity to a lesser extent than those with smaller resource endowments, as the marginal positive effect of bundling on value-creation diminishes at higher resource levels.
A firm’s resource advantages can also mitigate the perceived “pressure to bundle” that is driven by rivals’ bundling activity. In competitive dynamics, a reactor’s perception of rivalry depends on not only the action and the actor, but also its own relative position; two firms might react differently to the same competitive cue. From a behavioral point of view, “competitive asymmetry” explains why rivals often do not pose an “equal threat” to each other (Chen, 1996: 102; Miller, 2003); “powerful firms,” those with greater market share and resource endowments may not be motivated by the moves of “weaker firms.” In this vein, the variance among rivals in terms of resource endowments can also result in competitive asymmetries when reacting to the performance pressure driven by the intensity of bundling at the market level. Accordingly, a focal firm with superior resource endowments is less apt to react to the bundling activity of its rivals, which it might perceive as “weaker” in terms of resource endowments or factor market share.
Hypothesis 2a: Relative resource endowments of a focal firm attenuate the positive relationship between rivals’ bundling intensity and subsequent focal firm bundling intensity.
The competitive asymmetry caused by the variance in resource endowments among rivals might affect not only a firm’s likelihood and intensity of reaction to rivals’ bundling, but also how it might react. There is evidence that larger firms with superior resource endowments compete differently than smaller ones with limited resources (Chen & Hambrick, 1995). To compete, in addition to intensive resource bundling, a firm can differentiate bundling activity to compensate for “comparative resource disadvantages” (Sirmon et al., 2008: 922). As unique capability configurations have the potential to drive relative performance without scarce resources that are acquired in strategic factor markets (Schmidt & Keil, 2013), by pursuing nonconformity in bundling, a firm with resource disadvantages can also mitigate its exposure to factor-market rivalry, which could further accentuate its “weakness.” Conversely, firms with high relative resource endowments, which can potentially achieve superior performance by exploiting their existing resource advantages, might not have the motivation to pursue experimentation and nonconformity in bundling. For instance, Shuen, Feiler, and Teece (2014) point to the scarcity of hydrocarbon reserves as a main driver of innovation and action heterogeneity in the upstream oil and gas industry. Rather than competing head-on with rivals, firms can be driven to develop or adopt new technologies, build new routines, and invest in experimentation. By contrast, when faced with competition, larger firms with superior resource endowments are likely to utilize more conventional and conforming capability configurations.
Hypothesis 2b: Relative resource endowments of a focal firm attenuate the positive relationship between rivals’ bundling intensity and subsequent focal firm bundling nonconformity.
Multi-Factor Market Contact: Imitative and Intensified Reaction
Based on the assumption that firms overlapping in multiple markets are likely to be similar in scale, scope, and market opportunities (Edwards, 1955), multimarket contact has primarily been studied as an antecedent of anticompetitive behavior. Accordingly, the strategic similarity among multimarket rivals drives them to “forbear”—refrain from aggressive competition—to prevent rivalry from spreading to other joint markets (Gimeno & Woo, 1996), and, at the same time, retaliate against those who “defect” (Young, Smith, Grimm, & Simon, 2000). Although multimarket contact has most frequently been associated with forbearance across product markets (Yu & Cannella, 2013), it also has salient implications for imitative behavior (e.g., Hsieh & Vermeulen, 2014; Scott, 2001). Analyzing imitative behavior among rivals, Lieberman and Asaba (2006: 376) posit that institutional and competitive forces “are not mutually exclusive; both types of imitation can occur simultaneously.” In this view, (a) ambiguity surrounding rivals’ activity (such as bundling) and environmental uncertainty drive mimetic behavior through information-seeking, and (b) market commonality drives multimarket rivals to be vigilant and reactive to each other (Lieberman & Asaba, 2006).
In line with these premises, multi-factor market contact (MFMC)—overlap across multiple factor markets (Markman et al., 2009)—can foster imitative bundling behavior among rivals. First, as noted, because factor market overlap implies potential resource similarity, multi-factor market rivals are even more likely to have similar resources than others. Second, multi-factor market rivals also have more opportunities to observe and learn from each other’s bundling activity across multiple factor markets. Rivals’ actions can provide information to each other (Fiegenbaum, Hart, & Schendel, 1996), which can mitigate the causal ambiguity that tends to surround bundling activity (Bridoux et al., 2013). Typically, the exact values of strategic resources traded in factor markets are ex-ante unknown and dependent on how they are bundled (Schmidt & Keil, 2013). Accordingly, rivals’ bundling activity can mitigate the ambiguity about the routines and complementary assets needed to deploy the traded resources and reveal their actual value-creating potential. Contact across multiple factor markets further bolsters such mutual learning among rivals (Phillips & Mason, 2001).
When these two factors—resource similarity and the availability of information on rivals’ capability configurations across multiple markets—are combined with pressure to bundle driven by rivals’ activity, imitation of multi-factor market rivals in bundling becomes a viable option for a focal firm. Regarding the motivation, Theeke and Lee (2017) suggest that although multimarket contact can engender forbearance in product market activities, it actually intensifies competitive tendencies in “upstream” activities through which retaliation is not possible. Because bundling is an internal activity which does not constitute an “attack,” rivals lack the motivation to forbear in their bundling across markets. Imitation of rival activity is a common response to heightened competitive pressure (Derfus et al., 2008; Major, Maggitti, Smith, Grimm, & Derfus, 2016) and uncertainty (Posen, Ross, Wu, Benigni, & Cao, 2023; Sirmon & Hitt, 2009). A firm might choose not to adopt certain technologies, routines, and capability configurations before observing rival adoption (Endenich, Hahn, Reimsbach, & Wickert, 2023). From an economic standpoint, too, imitation of “closest rivals” in bundling can be more feasible than nonconforming activity because it does not involve the potential time and costs associated with learning and experimentation (Boyd & Bresser, 2008; Giachetti, Lampel, & Pira, 2017). The efficient, “quick and vigorous” reaction enabled by imitation (Porter, 1985: 498) could further escalate bundling activity. Thus, multi-factor market rivals are more likely to react to the performance pressure driven by each other’s bundling activity with their own, albeit in a more conforming manner. Figure 2 summarizes our hypotheses.
Hypothesis 3a: MFMC enhances the positive relationship between rivals’ bundling intensity and subsequent focal firm bundling intensity.
Hypothesis 3b: MFMC attenuates the positive relationship between rivals’ bundling intensity and subsequent focal firm bundling nonconformity.
Hypotheses
Methods
Context: Upstream Oil and Gas
We tested our hypotheses in the context of the upstream oil and gas business. Consistent with our hypotheses, firms that are primarily occupied with crude oil and raw natural gas production tend to overlap in both product and factor markets. Within and across oil and gas basins, these firms compete for land and leases granting them exclusive rights to explore for and exploit oil and gas reserves, highly scarce and strategic resources. Oil and gas basins are essentially large depressions in the earth’s crust that contain hydrocarbon-rich sediment; they vary in their geological characteristics, depth, and pressure of reservoirs, as well as the type and quality of hydrocarbons (International Association of Drilling Contractors, 2023). These characteristics determine how operators can produce hydrocarbons. Thus, the basins constitute geographic factor markets for strategic resources (Lim, Celly, Morse, & Rowe, 2013), which are prone to bidding wars that benefit landowners. The efficiency of these factor markets accentuates the importance of resource bundling in this context. Other than engaging in bidding wars in factor markets or resource picking by estimating reserves more accurately than others (Le Breton-Miller & Miller, 2015; Makadok & Barney, 2001), firms can improve their production and relative performance by bundling their reserves via different routines, techniques, and complementary resources. In the United States, operators must get permission for every such major action they plan to undertake. The data related to these permits are published by state agencies, such as the Railroad Commission of Texas (RRC).
These firms also tend to overlap in product markets since they sell their output in the spot market or via contracts varying in length at the benchmark index prices, such as West Texas Intermediate for crude oil and Henry Hub for natural gas in the United States. Accordingly, this context is prone to escalating resource bundling activity. In fact, the recent shale boom that originated from Texas has been enabled by intense bundling activity. During this period, firms’ bundling activity (e.g., in the form of hydraulic fracturing) has gradually intensified. According to the U.S. Energy Information Administration (EIA), the total number of hydraulically fractured wells in the United States increased from 23,000 in 2000 to 300,000 in 2015 (EIA, 2016), making the United States the world’s largest crude oil and natural gas producer (EIA, 2024).
The tradeoff between resource endowments and the motivation to engage in resource bundling and pursue nonconformity in bundling activity is also evident in the upstream oil and gas industry. Whereas small, resource-strapped firms have been investing in “unconventional” methods to better utilize their limited reserves in Texas shales, which were once deemed “worthless,” upstream giants like Exxon and Chevron chose to ignore shale drilling until it became “undeniable” (Zuckerman, 2014). Local firms such as Mitchell Energy pioneered innovative extraction methods, including hydraulic fracturing, ushering in the recent Texas shale boom. On the other hand, there is evidence that upstream oil and gas companies that operate in proximity tend to follow one another in their activities (Covert, 2015; Décaire, Gilje, & Taillard, 2020). Thus, firms competing across multiple basins were largely responsible for the nationwide diffusion of these techniques (Tabuchi & Migliozzi, 2023).
Sample
We utilized a proprietary upstream oil and gas dataset, provided courtesy of WellDatabase, to build our sample, and we defined factor markets based on the major oil and gas basins in the United States. Accordingly, we chose the Barnett Shale in the Fort Worth Basin in North Texas as the focal factor market, which is considered the birthplace of the so-called shale revolution (Zuckerman, 2014). We limited our sample to operators that were active in the Texas portion of this basin and captured both dependent variables in this area. We captured MFMC of focal firms across the remaining 29 major oil and gas basins in the United States where some of the firms that have been active in the Barnett Shale also operated. The figure in Appendix A (see the online supplemental material) lists and illustrates the locations of the basins that are the geographic factor markets analyzed in this study. In our dataset, over 75% of all wells with production history in the Fort Worth Basin were directed at the Barnett Shale—the sub-basin. Therefore, we excluded wells outside the Barnett Shale for the focal basin. We do not utilize states or counties to define factor markets because these basins cover large areas and often extend across administrative divisions.
The final sample contains 1,068,830 firm-month observations from 5,415 unique operators (panels) spanning the period from 1981 to 2019. We excluded from the sample firms that did not have any production or development activity within this period. We also excluded observations in the data without operator information and panels with errors identified based on names as well as production and incorporation years.
Measures
Focal firm bundling intensity (Focal Firm BI)
The dependent variable for Hypotheses 1a, 2a, and 3a was measured as the total count of all well completions, stimulations, injections, and tests, for active oil or gas wells (excluding sealed, disposal, and storage wells) in a given month by the focal firm. These actions represent the bundling of strategic resources (reserves) to enable and improve production in the context of oil and gas. Well completions involve physical changes on existing wells. Stimulations involve actions to enhance production by improving the permeability of the reservoir, such as fracking. Injections involve placement of fluids into wells to increase or maintain the pressure within a reservoir. Well tests represent firms’ generation of first-hand knowledge about the conditions and specifications of the wellbore and reservoir through a variety of techniques. We assume that this knowledge is simultaneously bundled into firms’ production capabilities. Appendix B provides further details on these action types.
Depending on the reserve characteristics and firm capabilities, stimulations and completions can also follow and complement new well drills, indicating resource structuring activity. Thus, the count of New Well Drills has been excluded from this variable. However, it is included in all models as a control variable due to the potential relationship (previously discussed) between resource structuring and bundling.
In our nonlinear models, we predicted this variable using the count of the focal firm’s wells in the focal area at t − 1 as the exposure variable (Focal Firm Wells in the Area), allowing us to capture action intensity relative to firm size rather than an absolute “action volume.”
Focal firm bundling nonconformity (Focal Firm BN)
Following the dissimilarity measure of Connelly, Lee, Tihanyi, Certo, and Johnson (2019), the dependent variable for Hypotheses 1b, 2b, and 3b was measured as the Euclidean distance between the action combination of the focal firm and the basin/factor-market average of 16 different types of bundling actions that are included in the first dependent variable (well completions, stimulations, injections, and tests), captured as dummies, in a given month. Aligned with our arguments about the competitive implications of resource bundling, instead of comparing rivals in dyads, our measure compares the focal firm to the market average.
Binary identifiers represent action types: (1) well modification-related completion actions (reentry, plugback, sidetrack, deepening, and other/unclassified); (2) well stimulation actions (slickwater, surfactant, and acid); (3) well injection actions (water, gas, carbon dioxide, and other/unclassified injections); and (4) well tests (steam injection, flow, gas lift, and pump). For robustness checks, an alternative measure of action nonconformity was calculated under four broader action categories, namely (1) completions, (2) stimulations, (3) injections, and (4) tests, and similar results were obtained. Accordingly, the bundling nonconformity of firm i at time t is calculated based on the difference between the binary action indicator

Due to its non-normal distribution and continuous and exclusively positive nature (without zeros), we log-transformed this variable. This transformation allows us to interpret the results in terms of percentage change in the outcome variable. As reported in Appendix E, we obtained practically identical results using the untransformed version of this variable.
Firm size, age, and scope have critical implications for action nonconformity (Chen & Hambrick, 1995; Miller & Chen, 1996a; Smith et al., 2005) and could confound the relationships of interest. Firms that are larger in size and scope or older can have a greater variety of resources and capabilities or have accumulated more experience. To account for those, in addition to Firm Age (in years), we controlled for firm size through the count of Focal Firm Wells in the Area and a ratio of this measure to the firm’s overall well portfolio nationwide (Weight in Firm Well Portfolio). Boyd and Bresser (2008: 1087) suggest that “a firm’s total number of competitive moves is a proxy indicator for its size.” Accordingly, in subsequent robustness tests, we also included Focal Firm BI as a control variable in combination with Focal Firm Wells in the Area in the models predicting Focal Firm BN and obtained similar results.
To establish temporal precedence, all predictor variables, including controls, were lagged by 1 month. Continuous predictor variables were also standardized and mean-centered. In line with the recent work and best practices (Aguinis, Ramani, & Alabduljader, 2018), we did not drop observations or transform our dependent variables to deal with outliers. However, we conducted several additional tests to determine whether our analyses are sensitive to outlier observations (see Appendix E).
Rivals’ bundling intensity (Rivals’ BI)
This variable captures the intensity of bundling activity of all rivals the focal firm faces in the focal factor market—net of the potentially confounding effect of the focal factor market size (the count of All Wells in the Area), which is included as a control variable in all models. Accordingly, we measure Rivals’ BI as the count of bundling actions of all firms, excluding the focal firm, in the focal basin, divided by the count of all active wells in the focal basin in a given month. In line with the literature conceptualizing rivalry as a set of actions among rivals, this measure follows the measurements of macro level competitive pressure and intensity used in prior empirical work (e.g., Lee, Andrevski, Ferrier, & Waldron, 2026). In this vein, Young et al. (1996: 245) define “the level of competitive activity in the industry (industry-level rivalry) as the aggregation of firm-level competitive activity minus the competitive activity of the focal firm.” Notably, however, our measure specifically captures the intensity of rivals’ resource bundling activity relative to factor market size, excluding market-oriented activities reflecting resource structuring and leveraging.
The lag structure of Rivals’ BI and our dependent variables has important implications regarding the escalation of bundling among rivals. Shale and fracking operations represent a faster-paced environment than conventional oil and gas (Parameshwaran, 2022). Through “short-cycle production” (Eckhouse, 2021), operators achieve fast development timelines, making the U.S. shale industry more dynamic and responsive than its global counterparts (IEA, 2019). Shale operators tend to complete the new-well drilling process—from decision to completion—in 2 to 8 weeks (Agerton, 2020), which involves more substantial and longer planning, permitting, and field-operations processes than bundling actions, such as fracking. Specifically, in the Barnett Shale, while the actual new-well drilling process takes 14 to 25 days, fracking takes around 10 days (Mansfield, 2025). Permits precede firm activity and are announced publicly. According to the RRC, permit processing times can also vary due to demand/workload, seasonality, and changes in policies and regulations. At the time of our analysis, the average permit processing wait time was 2 to 4 days (Railroad Commission of Texas, 2025). Considering these pieces of information and our exclusive focus on bundling actions (which involve current firm wells), we lagged this variable by 1 month along with the rest of predictors. However, in subsequent robustness tests, we used the second and third lags of this variable as well as the rolling average of the first, second, and third lags and obtained similar results across four lag structures (see Appendix E).
Focal firm relative resource endowments (Focal Firm RRE)
In line with the approach emphasizing relative/comparative resource levels (Sirmon et al., 2008), we captured the focal firm’s strategic resource endowments relative to those of its rivals in the focal basin as the firm’s rank in terms of the number of productive wells owned (as of the target month) in the focal basin, where a higher rank indicates greater (in quantity) strategic resource endowments.
Multi-factor market contact
MFMC was measured at “firm-in-market level” (Gimeno & Jeong, 2001), following Gimeno and Woo (1996), as the average of multimarket contacts with all rivals that the focal firm overlaps with in the focal factor market in a given month. Thus, at time t, for focal firm i and rival firm j in the focal factor market f, MFMC is measured as the count of other factor markets m, where D is a binary variable that equals 1 if both i and j operate at time t, divided by the total number of rivals R firm i meets in the focal factor market f at time t (see Equation 2):

Interaction terms
The interaction terms regarding Hypotheses 2a, 2b, 3a, and 3b were operationalized as the multiplicative products of Rivals’ BI and the moderator variables—Focal Firm RRE and MFMC.
Controls
We controlled for a variety of factor-market- and firm-level variables (captured at t − 1). At the firm level, we included six control variables. One reflects focal firm deployment in the previous period. Hydrocarbon reserves are depletable. As upstream firms deploy and exploit their reserves, they need to continually seek new ones and replace them by taking the appropriate structuring and bundling actions (Karadag & Poppo, 2023). This ongoing process can influence our competitive drivers of interest. Thus, we controlled for Per Well Production of the firm in the focal basin based on total production in barrels of oil equivalent (BOE) divided by the number of wells the firm operates in the basin. Following the convention, we used a conversion rate of 6,000 cubic feet of natural gas per one BOE (Klett, 2005). Next, we controlled for firms’ New Well Drills, which is related to firms’ structuring activity (new well drills typically follow new reserve access) and could also confound our analysis due to the inherent relationship between resource structuring and bundling. Additionally, we controlled for Focal Firm Wells in the Area, measured as the count of all wells the focal firm operates in the focal market, representing firm size for the focal basin. As noted, this was included as a regular covariate in Models 6–10 (in Table 3) and as an exposure variable in Models 1–5 (Table 2). We also controlled for the percentage of active wells in the focal market (Weight in Firm Well Portfolio), measured as the number of active wells of the focal firm in the focal factor market divided by the firm’s total number of active wells across the United States. This represents the weight or importance of the focal market for the firm, a key variable because a firm’s market commonality is conditioned by the market’s strategic importance to the firm (Chen, 1996). Further, at the firm level, we controlled for whether a focal firm experienced any Well Accidents at t − 1, as reported by the RRC. Accidents can lead to significant fines and influence operations. Firm Age was measured as the years since the focal firm’s first observed production in the United States.
At the factor-market level, we controlled for whether firms experienced a Price Shock at t − 1, defined as gas or oil index prices changing more than 15% between t − 1 and t − 2. Because the Barnett Shale is a natural gas-intensive deposit, we controlled for the Natural Gas Index Price, based on the average historical residential natural gas index prices reported by the EIA (2021). In subsequent robustness checks, we included both the crude oil index price and the highly correlated Natural Gas Index Price variables, confirming that this choice did not affect our results. We also controlled for All Wells in the Area, representing the size of the focal factor market, measured as the total number of active wells of all firms in the area in a given month. We rescaled this variable by dividing it by 1,000. We did not include lagged dependent variables in the models due to their high correlation with other predictors and the multicollinearity they could introduce. The inclusion of such lagged variables in fixed-effects models often leads to estimation difficulties and bias (Williams, Allison, & Moral-Benito, 2018). However, these were included in subsequent robustness checks, and the results are reported in Appendix E.
Analysis
As noted, Focal Firm BI, the dependent variable for Hypotheses 1a, 2a, and 3a (tested in Models 1–5), required a count estimator that allows for time and firm fixed effects and robust clustered standard errors (SEs). Our sample is an unbalanced panel, and our hypotheses address within-firm changes. Thus, we chose two-way fixed-effects models, allowing predictions net of time-constant factors and time-varying macroeconomic conditions. The mean value for Focal Firm BI was 1.325 with a variance of 18.905. Thus, we took several steps to account for potential overdispersion. First, once firm and year fixed effects were entered in a Poisson model, the Cameron and Trivedi (2005) test failed to reject the null hypothesis of no overdispersion (t = 1.60, p = .11). Further, even in the case of overdispersion, considering the nature of our data, what matters is conditional mean and variance. The Poisson pseudo maximum likelihood (PPML) and “conditional” Poisson fixed effects estimators do not require the variance to equal the mean, and remain consistent as long as the conditional mean is correctly specified (Wooldridge, 1999). Accordingly, we employed PPML models with two-way fixed effects whose assumptions are not violated by the specifications of the dependent variable (Silva & Tenreyro, 2011). Additionally, as a robustness test, using a fixed-effects negative binomial model—which does not allow the use of heteroscedasticity and autocorrelation robust “true” fixed effects (Guimaraes, 2008; Wooldridge, 1999)—we obtained similar results (see Model 18 in Table E1 in the Appendix file). We used the Stata package “ppmlhdfe” (Correia, Guimarães, & Zylkin, 2020) to implement the PPML estimator. Additionally, using the default “xtpoisson” module on Stata, we were able to run fixed-effects Poisson models, include year and firm fixed effects, and obtain identical results. In these models, as noted, Focal Firm Wells in the Area (at t − 1) was included as an exposure variable. Used in count models, an exposure variable is a covariate that is log-transformed and its coefficient fixed at 1. This variable enables us to capture Focal Firm BI at time t relative to firm assets at t − 1, consistent with the measurement of Rivals’ BI (at the factor-market level), albeit without any transformation.
Our second dependent variable, Focal Firm BN (i.e., Focal Firm Bundling Nonconformity), is continuous. A Hausman test confirmed the superiority of fixed effects over random effects (Δχ2 = 2,365.22, p < .001). Accordingly, we used linear two-way fixed effects models (Models 6–10) with year and firm fixed effects and robust clustered SEs to deal with potential heteroscedasticity and autocorrelation. For both dependent variables, year and firm fixed effects also reduce omitted variable bias. All continuous variables were grand-mean centered and standardized to improve the interpretability of the results and facilitate the inclusion of the interaction terms. In PPML models, model fit was assessed using Akaike’s information criterion (AIC), with smaller figures indicating better fit, as well as pseudo R2 and change in deviance statistics. In the linear models, we used both R2 and AIC statistics to assess model fit.
Results
Table 1 presents descriptive statistics and the correlation matrix. Table 2 displays the regression results from fixed-effects PPML models (Models 1–5), testing Hypotheses 1a, 2a, and 3a. Table 3 displays the results from linear fixed-effects models (Models 6–10), testing Hypotheses 1b, 2b, and 3b. Model fit statistics, including ΔAIC (AICnull – AICmodel), Δdeviance, and R2 (McFadden’s Pseudo R2 for count models), are also shown in Tables 2 and 3. Sample size varies across analyses; the count estimator drops observations that are singletons or separated by a fixed effect (162,352 observations in total). The logged version of our second dependent variable, Focal Firm BN, contains some negative values, which are the logs of fractions.
Summary Statistics and Bivariate Correlations
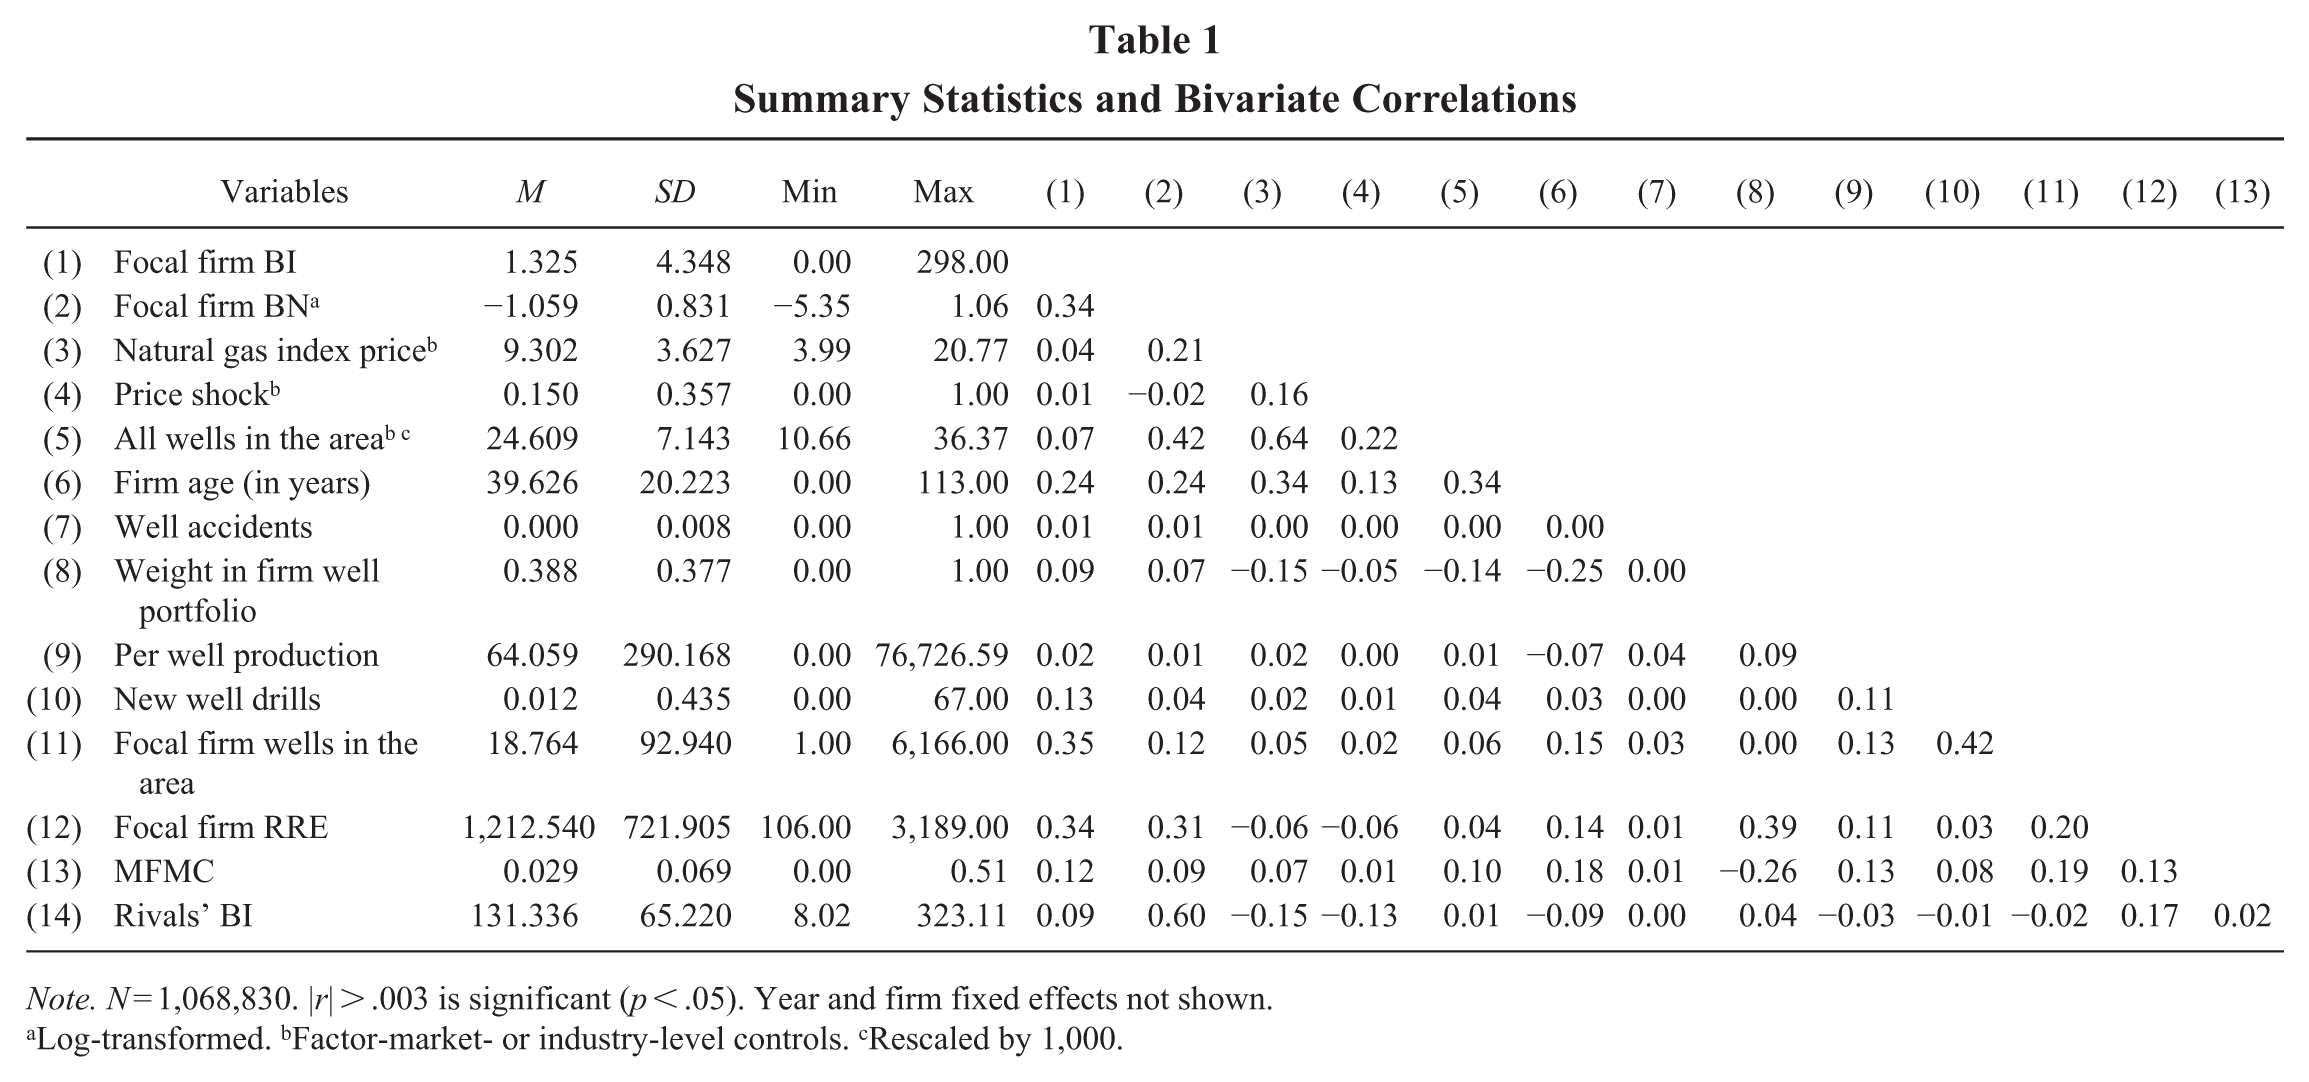
Note. N = 1,068,830. |r| > .003 is significant (p < .05). Year and firm fixed effects not shown.
aLog-transformed. bFactor-market- or industry-level controls. cRescaled by 1,000.
Fixed-Effects PPML Models Predicting Focal Firm Bundling Intensity
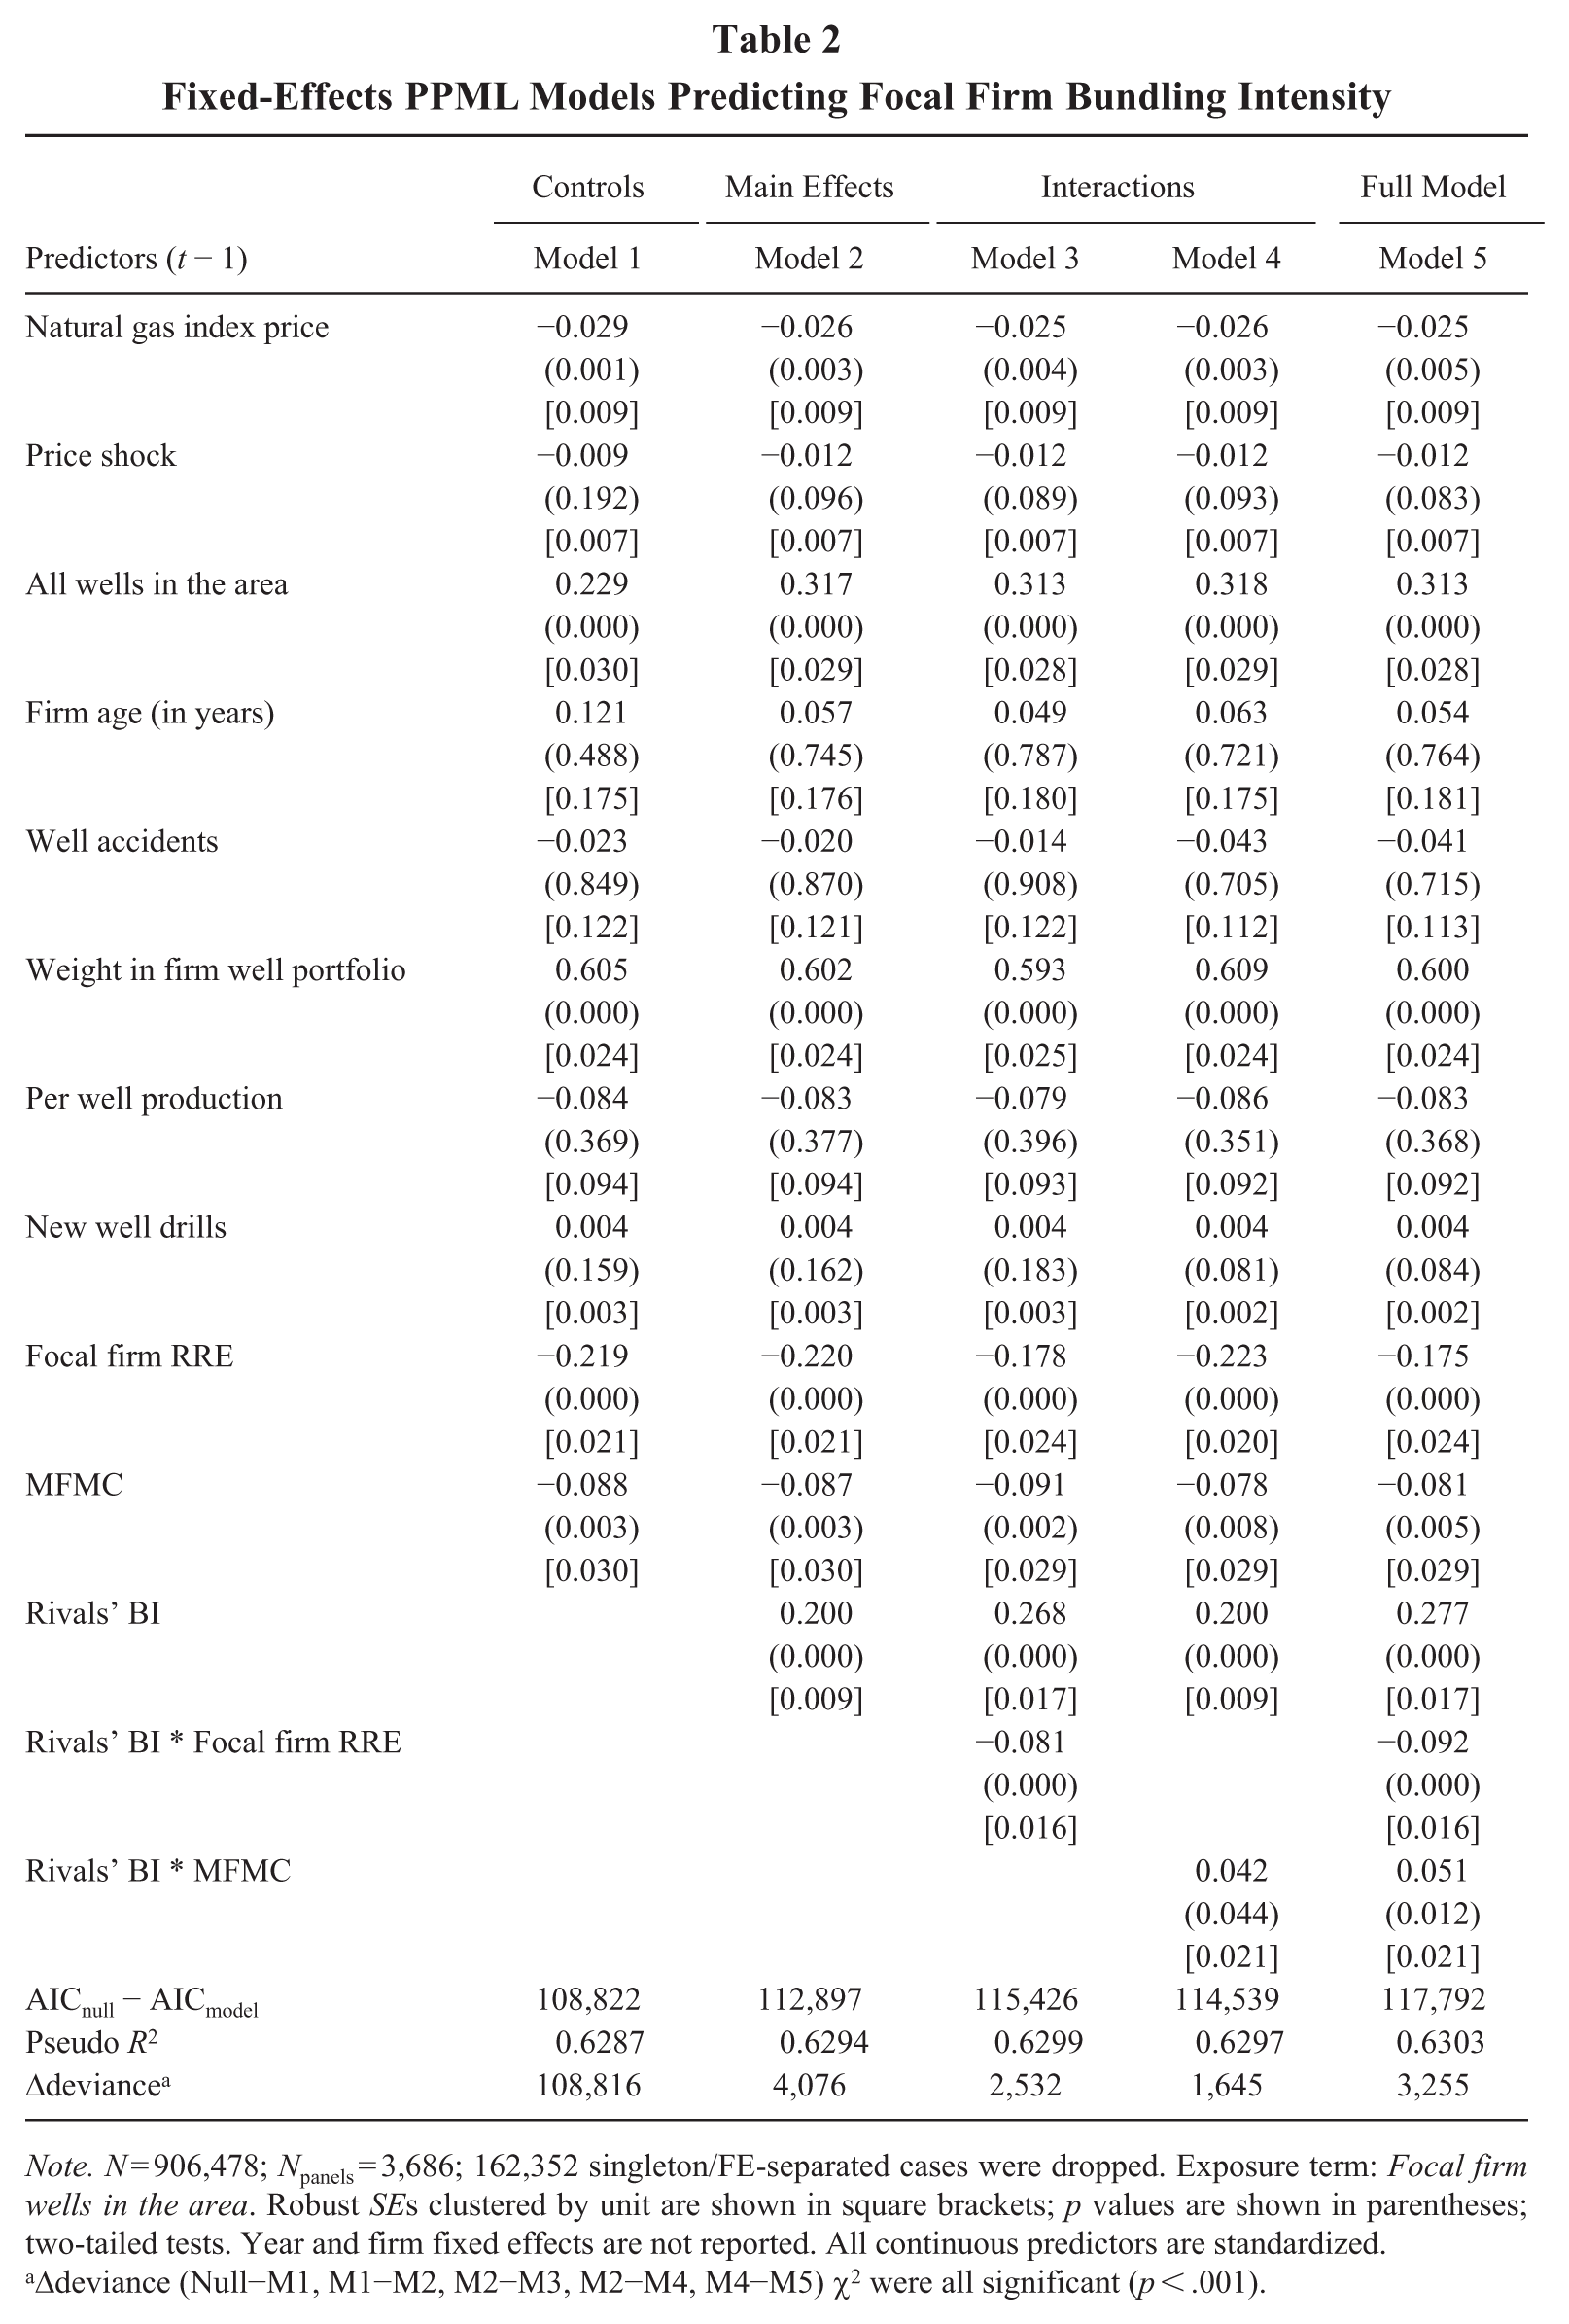
Note. N = 906,478; Npanels = 3,686; 162,352 singleton/FE-separated cases were dropped. Exposure term: Focal firm wells in the area. Robust SEs clustered by unit are shown in square brackets; p values are shown in parentheses; two-tailed tests. Year and firm fixed effects are not reported. All continuous predictors are standardized.
Δdeviance (Null−M1, M1−M2, M2−M3, M2−M4, M4−M5) χ2 were all significant (p < .001).
Fixed-Effects OLS Models Predicting Focal Firm Bundling Nonconformity
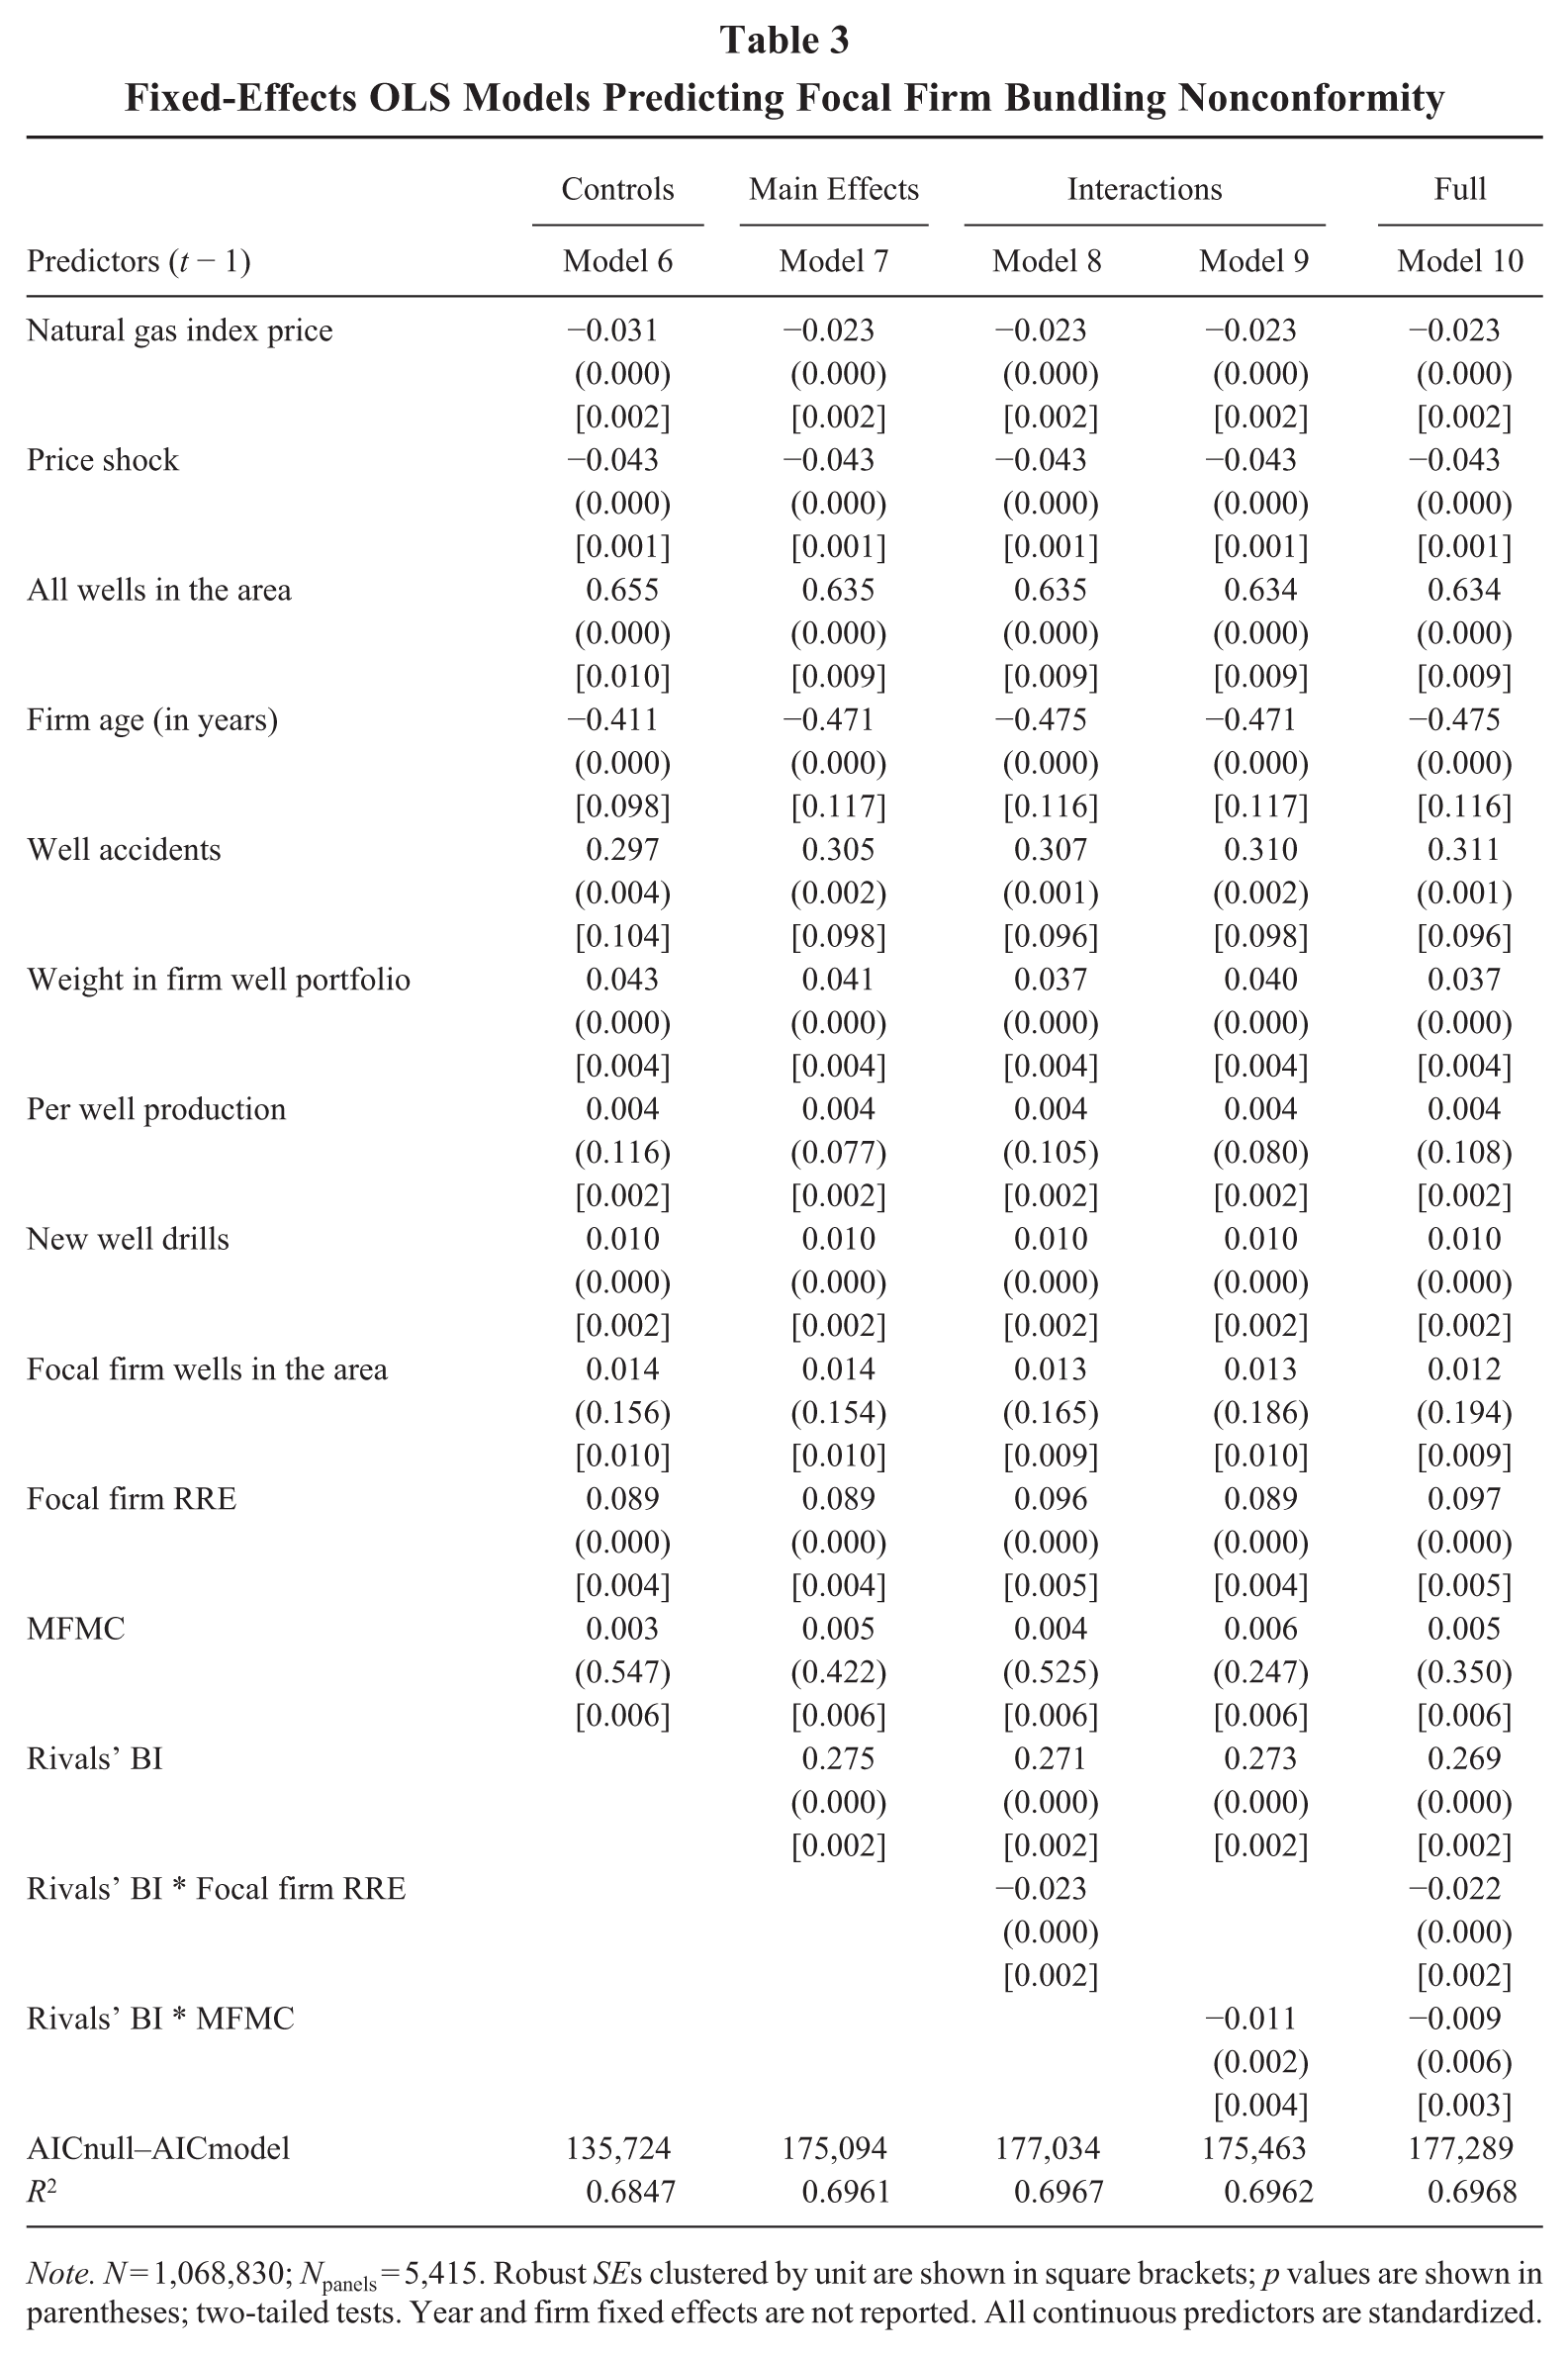
Note. N = 1,068,830; Npanels = 5,415. Robust SEs clustered by unit are shown in square brackets; p values are shown in parentheses; two-tailed tests. Year and firm fixed effects are not reported. All continuous predictors are standardized.
The results in Tables 2 and 3 support all Hypotheses (at p < .05). The hypothesized main effects and moderators were significant both individually (Models 2–4 and 7–9) and in the full models (Models 5 and 10). Per the incidence rate ratios, in Model 5, with each standard deviation (SD) increase in Rivals’ BI, the predicted rate of Focal Firm BI increases by 31.9%. Based on the interaction terms, with each SD increase in Focal Firm RRE, this effect decreases by 8.8%, and with each SD increase in MFMC, it increases by 5.3%. Following best practices to emphasize the economic magnitude of results in such models (Busenbark, Graffin, Campbell, & Lee, 2022; Zelner, 2009), we additionally interpret our results as percentage changes in the predicted count outcome based on marginal effects. Holding all other variables at their mean, increasing Rivals’ BI from its mean to its mean plus 1 SD is associated with an approximately 31% increase in the predicted count of Focal Firm BI. However, at a high level of (+1 SD) Focal Firm RRE, increasing Rivals’ BI from its mean to its mean +1 SD is associated with only a 19% increase in the predicted count of Focal Firm BI. Figure C1 (see Appendix C) illustrates this negative moderation effect based on predicted values. Conversely, at a high level of (+1 SD) MFMC, the same increase in Rivals’ BI corresponds to a 38% increase in the predicted count of Focal Firm BI. Figure C2 illustrates this positive moderation effect.
Given the difficulties in illustrating and interpreting interaction effects from nonlinear fixed-effects models (Wiersema & Bowen, 2009), we also calculated the “true interaction effects” to further assess these interactions (see Appendix C) using the technique of Ai and Norton (2003). 4 Accordingly, the “true interaction effect” values for Rivals’ BI and Focal Firm RRE were negative and significant (at p < .05) for around 76% of all observations (see Figure C3); firms with high relative resource endowments were less responsive to their rivals’ bundling activity, granting further support for Hypothesis 2a. In Figure C4, we present the “true interaction effects” for Rivals’ BI and MFMC, which were positive for all observations, with around 95% of them also significant (at p < .05). In line with Hypothesis 3a, MFMC intensifies the positive relationship between Rivals’ BI and Focal Firm BI.
Model 10—the full model predicting nonconformity—accounted for 69.68% of within panel variance. The dependent variable, Focal Firm BN, was logged, and the predictors were standardized. We found that holding all else constant, 1 SD increase in Rivals’ BI results in a 30.91% increase in Focal Firm BN. However, the coefficients of the interaction terms suggest that with every SD increase in Focal Firm RRE, the positive effect of Rivals’ BI on Focal Firm BN decreases by 2.20%, and with every SD increase in MFMC, it decreases by 0.93%.
Figure C5 illustrates the interaction plot for the predicted values of Focal Firm BN based on Rivals’ BI and Focal Firm RRE. In Figure C6, we plot the marginal effects of Rivals’ BI on Focal Firm BN at ±1 SD of Focal Firm RRE. These plots suggest that, although not large in its magnitude, Focal Firm RRE weakens the positive relationship between Rivals’ BI and Focal Firm BN. In Figure C7, we plot the interaction between Rivals’ BI and MFMC on Focal Firm BN. Figure C8 illustrates the marginal effects of Rivals’ BI on Focal Firm BN at ±1 SD of MFMC. Both plots suggest a similar pattern. Although, as hypothesized, we found a negative and significant moderation effect, on average, this effect was relatively small, which could stem from the narrow breadth of actions reported in our sample (see the Discussion section below).
Endogeneity
We conducted a battery of tests to address potential endogeneity in our models (see Appendix D). First, we predicted Focal Firm BN, our continuous outcome variable, using a two-stage least squares (2SLS) instrumental-variable approach. In the 2SLS models, we relied on lagged instrumental variables relevant to and highly correlated with the endogenous regressors but not with the outcome variable, Focal Firm BN. In Appendix D, we define these instruments, outline our identification strategy, and summarize the sensitivity analysis techniques employed. In Table D1, we report the second-stage results from our 2SLS fixed effects panel-data models predicting Focal Firm BN along with the statistics addressing the conditions of relevance, exogeneity, and exclusion for all models. In Table D2, we provide the first-stage results. In Table D3, we report the details and results of the sensitivity analyses and falsification tests conducted using three complementary techniques, which provide additional support for the validity of our instrumentation.
While the fixed effects included in our models account for unobserved heterogeneity at the firm and year levels (Certo & Semadeni, 2006), to assess the robustness of inferences to omitted variable bias—typically driven by unobservable heterogeneity, and a common source of endogeneity (Bascle, 2008)—we also implemented the impact threshold of a confounding variable (ITCV) and its extension, the robustness of inference to replacement (RIR) techniques (Busenbark, Yoon, Gamache, & Withers, 2022). In Appendix D, we discuss the details of these analyses and report our findings, which provide additional evidence for the robustness of our results from both the fixed-effects OLS and PPML models to omitted variable bias and the potential endogeneity it may cause. Taken together, these analyses provide substantive support for the robustness of our findings to endogeneity concerns.
Robustness Checks
To assess the robustness of our findings, we employed alternative model specifications using different estimators, variable operationalizations, lag structures, and sets of control variables. We also estimated alternative versions of both dependent variables. We conducted additional robustness and diagnostic checks to assess the influence of outliers and potential multicollinearity, among some other important considerations. Appendix E describes these analyses in detail and reports the associated results from Models 11–28 in Tables E1 and E2.
Discussion
Contributions
Firms’ ability to compete “is rooted in firm resources” (Chen et al., 2021: 1824) and “much progress needs to be made to understand the complexity of resource competition” (Capron & Chatain, 2008: 115). Our study of the upstream oil and gas industry demonstrates how rivals’ bundling activity at the market level drives firm-level bundling activity and nonconformity. Whereas an advantage in strategic resource endowments weakens focal firm response via bundling and nonconformity, MFMC intensifies it, albeit in a more conforming and imitative manner. Our study contributes to the development and bridging of competitive dynamics and resource-based perspectives.
We posit that, although bundling is an internal activity, it nevertheless has competitive drivers and that it is prone to escalation. The RBV focuses on the identification, procurement, bundling, and deployment of strategic resources but neglects firms’ interactions outside market contexts. Especially in efficient factor markets, resource bundling and organizational capabilities can underlie effective competition, and firms do not take resource bundling actions in a vacuum. We address this neglected aspect of resource management, which warrants more attention both from the RBV and dynamic capability scholars. In doing so, we also distinguish the competitive implications of product and factor market overlap to suggest how the combination of the two can facilitate the escalation of bundling activity among rivals.
The competitive dynamics literature and most of the strategic analysis and market positioning literature have concentrated on product markets. Rivalry in factor markets has received less attention, and bundling activity has largely been overlooked. Our research demonstrates distinctive dynamics that drive the nature, evolution, and development of bundling processes in a competitive setting. Our findings that focal firm bundling intensity and differentiation are conditioned by rivals’ bundling activity suggest a new direction for competitive dynamics, particularly where market commonality and resource similarity are high (Chen, 1996). These are critical strategic processes worthy of further study and have the potential to bridge the resource-based and competitive analysis perspectives. If rivals react to each other’s bundling activity and bundling can be a salient response to macro competitive pressures, as we suggest, then bundling should also be incorporated into existing models of competition and rivalry, as its omission risks model misspecification.
Our study also contributes to the work on multimarket competition in two ways. First, we capture how MFMC affects firm bundling activity, which is not subject to the forbearance-retaliation mechanisms due to its internal nature. Our findings confirm the distinct nature of bundling activity and its competitive drivers across factor markets. Second, this is the first study to empirically examine the implications of MFMC for interfirm dynamics.
Limitations and Future Research Opportunities
Our study is just a beginning in what may prove an expansive sphere of inquiry and thus has limitations. For example, we analyzed bundling activity among firms that produce a relatively undifferentiated output. Although this was useful in minimizing the influence of product market rivalry on firm bundling behavior, we must take care when generalizing to other industries. Our study also examines one region of the United States, in an industry with specific commercial and technical competitive options, which may not apply to other regions or jurisdictions. In our sample, bundling activity is visible largely due to the public nature of permit information related to firms’ actions through the regulating agency. In different settings, rivals’ awareness may be driven by alternative mechanisms, such as discerning. Thus, future research could explore bundling interactions in other industries.
Our research examines firms at a distance and assesses objective indicators of competition. Thus, we infer motives from actual behavior, but we cannot know the motivations and rationalizations of the managers of these firms. Therefore, it is important to perform qualitative studies to understand why managers adopted the strategies they did and their reasoning for bundling intensively or relying on resource endowments and imitating or differentiating action repertoires. We recommend such studies in the future.
Next, due to the high “decay” rates of oil and gas reserves (Karadag & Poppo, 2023)—the strategic resources in our context—the bundling intensity of firms we examined may be higher than that observed in other contexts. Accordingly, future empirical research on the interfirm dynamics of bundling where firms rely on different types of strategic resources (e.g., human resources and patented technologies) can advance both the RBV and competitive dynamics. Given that multimarket contact with rivals can influence entry/exit behavior (Korn & Baum, 1999), future research could also examine how bundling interactions among rivals shape these dynamics across product and factor markets.
Finally, our study was subject to data limitations. First, we could not examine the financial implications of our findings due to a lack of data. Second, we found a relatively weak moderating effect of MFMC on the relationship between rivals’ bundling and focal firm bundling nonconformity; future research would benefit from examining this effect in contexts with greater variety in bundling activity. Third, because our sample contained lease data only for land developed for production, we used new well drills as a proxy for resource structuring activity. Finally, we lacked data on firms’ ownership structure, alliances, and merger and acquisition activity, which may also be relevant to resource bundling. Rivals may engage in cooperative actions such as strategic alliance formation (Chen & Miller, 2015), which fall outside the scope of this study. Subsequent researchers would do well to investigate these aspects of resource bundling and its competitive implications.
Conclusions
One of the basic premises of competitive dynamics is that any firm action with the potential to affect competitive positions can lead to rivalry. However, the research has so far devoted most of its attention to the study of market activities. Combining arguments from the resource management framework and competitive dynamics, our paper explores the relationship between firm bundling activity and the intensity of rivals’ bundling through what we call “the competitive drivers of bundling.” We tested our predictions on a sample of upstream oil and gas firms that are both factor- and product-market rivals and found that firms respond to rival bundling activity with intensified and differentiated bundling of their own. However, firms’ relative resource endowments weaken these relationships; firms that possess a greater quantity of strategic resources react to a lesser extent—both in terms of bundling intensity and nonconformity—to rival bundling activity. By contrast, multi-factor market overlap engenders imitative behavior, strengthening the relationship between rival and focal firm bundling intensity and weakening the impact of rival bundling intensity on focal firm bundling nonconformity. These interfirm dynamics of resource bundling help bridge the RBV and competitive dynamics literatures, with significant implications for future research.
Supplemental Material
sj-docx-1-jom-10.1177_01492063261448465 – Supplemental material for To Compete From Within: The Competitive Dynamics of Resource Bundling
Supplemental material, sj-docx-1-jom-10.1177_01492063261448465 for To Compete From Within: The Competitive Dynamics of Resource Bundling by Reha Karadag, Danny Miller and Ming-Jer Chen in Journal of Management
Footnotes
Acknowledgements
We thank Editor Hermann Ndofor and the anonymous reviewers for their constructive comments and guidance throughout the review process. We also appreciate the helpful feedback from Brian Wu, Fiona Yao, and Tieying Yu on earlier versions of the paper.
Supplemental material for this article is available with the manuscript on the JOM website.
Notes
References
Supplementary Material
Please find the following supplemental material available below.
For Open Access articles published under a Creative Commons License, all supplemental material carries the same license as the article it is associated with.
For non-Open Access articles published, all supplemental material carries a non-exclusive license, and permission requests for re-use of supplemental material or any part of supplemental material shall be sent directly to the copyright owner as specified in the copyright notice associated with the article.