
Abstract
Throughout his scholarly career, Andrew Isserman made bold calls for vision, storytelling, and narrative construction in regional science and planning. The necessity to plan and make infrastructure and development decisions with incomplete evidence often requires narratives—gists, insights, and ideas that are shorthand for an amalgam of reasoning, evidence, and feedback from practice. Narratives play a large role in planning practice and education, but their premises and implications must be subjected to evidence and compared with alternatives. From their respective work on the third sector, the authors explore a powerful narrative that bigger organizations are better: due to economies of scale, more professional personnel, more sustainable operations, and better measurement, they deliver superior services and greater public value for resources spent. The authors compare this with a competing narrative that smaller organizations generate superior social returns due to flexibility, innovativeness, and community-embeddedness. Using evidence on nonprofit arts and cultural organizations, the authors show that the superiority of large organizations is questionable and further, that the “bigger is better” narrative serves particular interests. In concluding, the authors underscore Isserman’s argument that planners and regional scientists must consciously and deliberately claim their roles in the creation of narratives that shape debate, planning process, and, ultimately, the future. In teaching and research, the authors must both acknowledge whose interests are served and harness evidence to compelling visions, explicit theories of causality, and story arcs—the tools that planners, regional scientists, designers, and social scientists use in defining, shaping, and imagining our regional worlds.
Keywords
Introduction
I recommend that we think big . . . [lest] in our rush to be relevant and marketable we completely forget what planning ought to be and give up our heritage. Let us not forget to teach planning. Let some of us become irrelevant. Let us plan as if it mattered—and let us make big plans, even plans that no one is willing to afford today . . . We must be concerned with what is humanly possible, not just politically and economically possible. We must accept the challenge to show the way, to be a source of inspiration to society regarding what might be. We must make big plans and explain how they can be realised. We must bring the future back into planning . . . We must make the future ourselves. Andrew Isserman (1985, 489–90).
In recent years, Isserman focused on the necessary role of stories and storytelling to ground planning in the richness and diversity of the present and to appreciate the past, summarized in Isserman et al. (2010). In his recent teaching, he coupled film and novels with economic data to help understand regional cultures and economies, relying on the charismatic alchemy of fact and story to both inform and inspire his students—in part because of a perceived lack of reflection on the centrality of narratives in social science and design fields generally but especially in regional planning education and practice.
We define narrative as a characterization or explanation that includes implicit, if not explicit, “if this, then that” statements. A narrative might also be purely descriptive, as in naming a phenomenon, but we prefer here the causal narrative, because it implies action. A planning example is new urbanism, the gist of which might read as, “if people live closer together in homes that have sociable fronts (e.g. porches rather than garages in front), they will be happier and more community-minded.” Or, in our case, “if funders focus their resources on larger—and therefore better managed, and more thoroughly documented—organizations, the goals of those funders will be better realized.”
Researchers, planners, and regional scientists working on urban and regional phenomena often rely on narrative and anecdote in situations where impact and effectiveness are hard to quantify. Fields like planning, human geography, and development studies have a wide research ambit. The topics of study are often complex, multistakeholder, and based on human interactions. The great appeal and strength of these fields are their focus on issues of current and future importance to people’s lives. Each offers a broad menu of acceptable research topics and a wide range of methodological options for researchers. For those very reasons, these fields are particularly policy-relevant, which adds an impetus for reliance on narratives: policy makers often do not have the time or training to go deeper and often want to avoid acknowledging imbalances of class, status, and power. Yet, the breadth of these fields creates vulnerability to intellectual fads and places a premium on narratives and story arcs. The evidence on academia following fads both as institutions (Birnbaum 2000) and in individual disciplines (e.g., the arguments of Martin 2001) seems to indicate a broader susceptibility to and awareness of narrative.
Narratives should be perceptible, open to contestation, and supported by evidence drawn from research and past practice. In this article, we explore the interaction between narrative and evidence in our intersecting research areas: regional planning and policy making in nonprofits in general and in arts and culture in particular. Philanthropic funding of nonprofit organizations is a good candidate for examining the impact of competing narratives on regions and communities. Despite $290 billion in financial resources voluntarily given to American nonprofits in 2010, primary indicators of nonprofit quality and outcomes are illusive. In their place, protagonists often use untested narratives.
As our central object of analysis, we explore a wide spread narrative asserting that “bigger is better” due to economies of scale, more professional personnel, more sustainable operations, and better measurement—bigger organizations are presumed to deliver superior services and greater public value for resources spent. We compare this narrative with a contesting one emphasizing the service impact of small, innovative, dispersed, and community-embedded arts and cultural organizations that rely on high volunteer involvement and focus more heavily on mission and engagement rather than on business operations.
Though narratives guide decisions that affect outcomes far into the future, they serve multiple and sometimes competing constituencies—this function is often hidden. In our case study, we highlight whose interests competing narratives serve.
For the third sector in general, we identify an emerging manager-dominated story arc that favors vertically integrated organizations preoccupied with business efficiency and financial viability. Both generally and in the arts and cultural sector, we find prevailing wisdom dominated by narratives asserting that service quality, accountability, and social impact are likely superior in larger organizations. Organizations seeking philanthropic resources are often forced into “dance of deceit” characterized by information asymmetry, intentional withholding of data, and a heavy reliance on narrative. These narratives—and the grant and tender application processes through which they are propagated—are sophisticated and crafted with expensive expertise.
Drawing on quantitative evidence for California arts and cultural nonprofits and on qualitative evidence from small ethnic and multidisciplinary California and social enterprises, we confirm that dominant narratives serve the larger, better-connected nonprofit organizations rather than those that are small, locally rooted, and have high volunteer-to-staff ratios. However, the alternative narrative is gaining ground, in part because the prevailing narrative is failing to generate patronage or broaden public support for the arts.
Dueling Narratives in the Third Sector
Narratives have consequences. In addition to their obvious roles in political processes at all levels, they influence resource allocation to civil society by governments, philanthropists, and other actors—crucial actors in resource allocation and planning processes. These funding choices have knock-on effects across the realms of social services, education, and arts and culture, among others, with regional consequences.
In this section, we ground our assertions about narrative in examples relevant to regional science planning in the third (nonprofit) sector, and particularly arts and culture. The narratives of interest concern managerialism and professionalism in nonprofits. We provide a basic overview of the third sector’s size and makeup, with a focus on funders and arts and culture organizations, before examining two competing narratives and subjecting them to evidence from a broad quantitative and qualitative research project on Californian arts and culture organizations.
An Arena of Narratives: The Case of Third/Nonprofit Sector Funding
The tremendous power of narratives and gists to condense information into memorable, action-oriented decision-making heuristics has a downside: information is lost in the simplification. Since communicating complex realities is daunting, even fundamentally correct narratives should be held to evidence.
We choose to use nonprofit funding ecosystems as our focus because they are heavily reliant on narratives. Further, foundations, philanthropists, and nonprofit organizations are major actors in many planning processes and often important allies (indeed, the New York Plan of 1929 and the Chicago plan of 1909 were both privately funded and initiated by the same man, Charles Dyer Norton). We examine a prominent narrative that is currently shaping nonprofit arts and culture: that bigger organizations are superior providers of arts and cultural offerings. The narrative reflects a broader discourse about managerialism and professionalism in which larger size implies more sustainability and enables better management and measurement.
These narratives are not restricted to the third sector. We argue, though, that the difficulty in measuring the effectiveness of third sector organizations makes narratives more difficult to prove or disprove and therefore of greater influence. Private firms can meaningfully indicate their performance and robustness with profit-and-loss statements and changing market shares: the “bottom line” conveys, in a few numbers, a substantial amount of information. However, the third sector analogue to profit—social impact—is hard to assess, difficult to compare across investees or grantees, and open to subjectivity. Absent a clear bottom line metric like profit upon which to base decisions, narratives play a powerful role in funding and other decision-making processes.
The importance of narrative is increased by the behavior of individual donors who conduct little or no research in their giving choices and are influenced by performance-unrelated factors. Individual donors gave $210 billion to US nonprofits in 2010 with very little research. Of those donors, only 35 percent did any research in deciding how much and to whom they were contributing, and fewer than 15 percent did more than two hours of total research. Larger donors did no more research than average donors, and all donors were most likely to get their information directly from the nonprofits to which they donated (Hope Consulting 2011). Donors also show an awareness of the prestige effects beyond intrinsic benefits of their gifts (Harbaugh 1998a, 1998b; Frumkin 2006); this prestige is most likely to matter in the donor’s social network. There is evidence that giving is an interdependent phenomenon: the giving decisions of individuals are influenced by the decisions of others in their “social reference space” (Andreoni and Scholz 1998).
Although individuals provide nearly three-quarters of contributions to nonprofits, the $45 billion that foundations give each year (about 15 percent of total contributions) can have an outsized influence on the behavior of nonprofits: The five million people who support a large national organization with a $25 annual donation have far less influence over its direction or policy than a foundation that grants it $50,000 for a specific program or purpose. (Dowie 2001, 3)
The battle of narratives is not necessarily a balanced one; the process by which philanthropic resources are allocated is as fraught as it is important. Necessary information for third sector funding applications and decisions are sometimes obstructed by one or both parties, an opaque process that has been called a “dance of deceit” (Carrington 2007). Larger organizations, often benefiting from full-time fundraising staff, are often well versed in the norms and conventions of funders. They are also sophisticated in structuring and modifying their organization’s story and image to the liking of each funder with whom they interact. Smaller groups rarely have such access or knowledge and are disadvantaged in the process. In other words, political economy matters. In addition to their capabilities, narrative protagonists bring their unequal economic, political, and personal stakes to the contest.
Placing and Sizing the Third/Nonprofit Sector
Private sector, public sector, and third sector funders all play important roles in economic development and prosperity. Directly and by providing resources to other actors, they create employment, improve human capital, help structure social and cultural institutions, and further important social missions. Private sector banks, investors, and venture capitalists—regulated and sometimes subsidized by governments—provide debt or equity funding to for-profit firms. In the United States, corporate foundations also supply operating funding and sponsorships to nonprofits for which they get tax breaks and/or positive publicity. Regardless of form, decisions of private corporations are driven by profit motives and beholden to shareholders. The public sector, where many planners work, is governed by democratic processes, and thus responsible to citizens via the electoral process. It borrows for long-term physical infrastructure and uses taxation and fees to provide public goods and services.
What is often called the third sector, and in the United States, nonprofit sector, comprises organizations that are neither public (public provision governed by democratic processes) nor private (profit-driven). The third sector includes voluntary and community organizations, charities, faith groups, social enterprises, cooperatives, and mutuals both large and small. The nonprofit designation is a narrower notion than third sector in that it does not include the informal components of what is loosely termed civil society. The defining characteristic of all of these groups is that they are value-led for public benefit (Commission for the Compact 2009). 1
In 2011, US nonprofits number 1,574,674 (including 279,000 religious congregations) of which 60 percent are public charities, 6 percent are private foundations, and the rest are chambers of commerce, fraternal organizations and civic leagues. In 2009, US nonprofits accounted for 9 percent of all wages and salaries paid and for 5.4 percent of gross domestic product (GDP). The public charities reported $1.4 trillion in total revenues and an equivalent amount in total expenditures in 2009. Public charities reported $2.56 trillion in assets in 2009 (National Center for Charitable Statistics 2011).
This broad set of actors, comprising a significant portion of the American economy, draws on several streams of capital. Charities that work in the public interest, as defined by the American Internal Revenue Code, are eligible to receive both tax-exempt status and tax-deductible donations. 2 In addition to earned income, which accounts for just over 75 percent of income, about 20 percent of the nonprofit sector’s support comes from voluntary contributions of funds by private individuals and foundations: philanthropy. Philanthropic and charitable giving by private sources has equalled approximately 2 percent of American GDP since the 1970s. While the bulk of giving in the United States is done by individuals, trusts, and foundations account for approximately one-fifth of American giving.
Philanthropic capital stocks and giving rates have been increasing for decades in much of the world, especially by foundations. In the United Kingdom, for example, from 1995 to 2005, the largest 500 foundations and trusts quadrupled their grantmaking, to £3.3b annually, and nearly tripled their assets, to £33.3b (Goodey and Hall 2007). 3 American foundation numbers have nearly quadrupled since 1980, and the 72,000 foundations active in 2006 held assets of approximately $670 billion. The next several decades are likely to witness continued increases as Baby Boomers transfer their wealth to younger generations and the public benefit (Havens and Schervish 1999).
Art, culture, and humanities organizations comprise approximately 9 percent of all American public nonprofits; some 60,000 organizations receive 4.6 percent of charitable contributions, approximately $13 billion in 2010. 4 Arts and culture organizations are unusually reliant on private contributions, receiving approximately half of all their revenue from private contributions and investments in 2008 (Lawrence 2011). Another distinctive element of arts and culture philanthropic funding is high degree of support from foundations, which provide 18 percent of total funding, and almost half of voluntary contributions.
How Third Sector Narratives Are Structured: Three Examples
Just as narratives compete in the nonprofit funding market, narratives structure and restructure the arena itself. Narratives form the arena’s walls, dictating the shape of the arena (what is and is not allowed inside) and whether a given narrative falls under the shadow of doubt or benefits from the light of legitimacy. Philanthropy itself is currently in a time of significant flux, including challenges to its credibility. One response has been the adoption of the language of investment. In much the way that financial terms heavily influenced political discourse in the 1990s (Hesmondhalgh 2008), the language of effectiveness and engagement became prominent in philanthropy in the past decade (Frumkin 2006). 5
The “bigger nonprofits are better” narrative is supported by structural narratives of (1) free market dynamics, (2) managerialism and professionalism, and (3) sustainability. Applying free market narratives to civil society bolsters the idea that bigger organizations are better. Assuming full access to information, impact-maximizing giving (and therefore good impact measurement), and no geographic biases, “better” organizations would attract more funding and grow in a virtuous cycle. The self-correcting and self-optimizing nature of free markets, as the narrative has it, will move nonprofits and their funders toward ever-greater efficiency and effectiveness. This language has moved into civil society in force in the last two decades, wielding considerable influence. The need or desire to professionalize the third sector for increased social impact has wide currency. Scholars have advocated the adoption of private sector business or managerial practices by third sector funders (e.g., Letts, Ryan, and Grossman 1997) and organizations (e.g., Porter and Kramer 1999).
But the wholesale application of free market narratives to the third sector is inappropriate. The philanthropic capital market fails to meet the definitional conditions of a free market. Information asymmetry is rampant (and many donors show little interest in conducting research based on the information that is available). There are few satisfactory means of measuring output quality, and certainly no market-wide way of doing so. And there are multiple spatial and social biases at play in funding choices.
The second structural narrative that of (especially managerial) professionalism, supports the idea that bigger organizations are better because of their improved practices, governance, and conduct. The narrative is, in some ways, a result of the free market narrative: with funders and fundraising nonprofits both speaking the language of investment and return, there is pressure on both side to prove that wise investments are resulting in strong returns. The growth of the labor force in foundations and nonprofits over the last several decades has exacerbated the pressure: workers must justify their salaries as wise expenditures.
The difficulty in measuring outputs is central once again. Given the complexity and expense in even imperfectly measuring outputs, larger organizations are more likely to either have the internal capacity to do so or the funds to hire external auditors. With funders demanding output statistics, the nonprofits that display more rigorously gathered statistics—even if they are off-point—are at an advantage. The same principle applies to documentation more generally. Larger organizations tend to have more professional staff with the capacity to generate more documentation of their work and practices—including documentation that is purpose-built to appeal to new funders and report back to current funders.
The final structural narrative is the ideal of sustainability, the idea that larger organizations are more likely to last into the future and are therefore better choices for funders. The previous investment and managerial narratives both feed into this concept, and similar challenges appear. Because of the difficulty in measuring outputs—and therefore determining efficiency, or input/output ratio—most funders cannot simply fund “better” organizations (presumably the more effective and efficient ones) because they cannot locate them. Downstream, other funders would face the same problem, so that better organizations might not be more likely to survive anyway. The professional pressure and general desire to be rigorous in funding choices, though, dictates that there must be some metric used, and financial input statistics are the only metrics that are universal and easy to measure.
Nonprofits that have raised money have proven the ability to bring in funds, and are therefore more likely to attract more funds—and no one, especially not workers in foundations, wants to write the last check to a defunct nonprofit. (Here, the narrative departs from its private sector counterpart. Profit-driven investors do not care whether a particular firm survives—they may support its sale or dismantling or disappearance via merger. Schumpeter’s creative destruction is not celebrated in the nonprofit sector). The fact that funding often comes with reporting requirements—funders want to see the return on their investment—also feeds into the cycle, with funded organizations developing an arsenal of evidence and stories that can be used to attract additional funding. Investments of philanthropic capital in professionalization have influenced what counts and how it is counted—and in the case of nonprofit sustainability, this translates to financial sustainability.
This exploration of “bigger is better” shows how narratives operating on different scales and with different assumptions can combine to provide legitimacy for another narrative—even if there are substantial theoretical problems with each. There are challenges to third sector organizations and capital providers in satisfying the demands of these narratives, as well as issues regarding aptness of the narratives and who benefits and who does not from their usage. Having asserted the existence and roles of narratives in nonprofit capital provision, we explore these assertions with evidence.
Holding Narrative Accountable with Evidence: The Case of Arts and Culture
In the nonprofit arts and cultural sphere, presumptions about the superiority of services and organizational viability align with the “bigger is better” narrative. In the United States, planners and policy makers rely heavily on the nonprofit sector to deliver arts and culture at all scales—neighborhoods, cities, regions, states, and federally. While a few cities—Los Angeles, San Francisco, Denver—have dedicated taxes that fund departments of cultural affairs, many others have only a very small public sector commitments and most are dominated by economic development concerns (Grodach and Loukaitou-Sideris 2007). Arts-rich Minneapolis, for instance, pays only two city staffers to work on arts and culture, one within the Department of Employment and Economic Development and one reporting to the City Manager. Cities can make important regulatory and financial decisions about redevelopment that shape arts and culture, including designating cultural districts and underwriting (and sometimes owning and managing) large flagship venues. States also, through their capital budgets, underwrite arts and cultural capacity. However, the creation, production, and presentation of American arts and culture are relegated to the nonprofit and for-profit sectors, the latter heavily dependent on the former for talent and innovation (Markusen 2010).
Through data analysis and qualitative insights on the politics of public and philanthropic arts commitments, we document how the “big is better” vision is powerful and yet unsupported by evidence. We also explore how Euro-American “fine arts,” overwhelmingly the domain of the largest arts organizations, are privileged at the expense of ethnic-, racial-, and working-class cultural forms. Our evidence is based on recent studies of California’s arts and cultural ecology (Markusen et al 2011; Brown, Novak, and Kitchener 2008) and US nonprofit arts funding (Sidford 2011).
We find the following. Collection of data and its dissemination within the sector is biased toward large organizations, replicating past funding bias. Use of budgets, employment, and attendance as surrogates for impact understates outcomes, especially for smaller organizations. Financial viability and reserves are increasingly emphasized within the sector as key to mission achievement, distracting from a focus on outcomes. The narrative of “big is better” is reflected in skewed philanthropic funding distributions by organizational size and place. In closing this case study, we reflect on who benefits from the interaction of rhetoric and action.
We draw upon multiple data sources for this effort. Because nonprofits are legally defined and receive substantial public sector tax breaks for their charitable work, the International Revenue Service (IRS) tracks data on revenues, expenditures, employment, and other features of all US nonprofits, available through the National Center for Charitable Statistics (NCCS). A third sector innovation, the Cultural Data Project surveys and makes available nonprofit arts and cultural data that philanthropic and public sector funders use in making funding decisions. 6 We show how the California Cultural Data Project (CDP) survey produces a biased data set supporting the “big is better” and “fine arts” narratives, and that it emphasizes financial viability rather than mission outcomes. At the same time, we use CDP data, benchmarked against the NCCS IRA data, to challenge the “big is better” narrative. We also recap Sidford’s (2011) evidence from the NCCS and The Foundation Center (2011) data to track how funding is skewed away from smaller ethnic and low-income serving arts and cultural organizations.
California provides a great laboratory for studying the American arts and cultural ecology because its population size and diversity, geographical complexity, and multiple large metro areas permit comparisons impossible elsewhere. Home to an estimated 11,000 nonprofit arts and cultural organizations, more than in most countries in the world, California hosts multipurpose cultural centers, science and visual arts museums, symphony orchestras and folk ensembles, artist service organizations, ethnic arts groups, literary societies, dance companies, and professional associations in every region and across all types of communities. How is the “bigger is better” narrative propagated in the sector, and is it reflected in actual funding patterns?
How Metrics Collection and Dissemination Favors Large Organizations
The California CDP sums up nonprofit arts finances, employment, volunteers, and attendance for those organizations that elect to complete an extensive online profile. Most organizations take the survey because it is required when applying to California foundations or agencies for funding. The CDP data thus do not constitute a random sample. They contain relatively few observations—1,604 unique arts and cultural organizations or 14 percent of those in the NCCS, our estimate of the “full universe” of organizations. 7 Even some very large organizations, including the J. Paul Getty Museum, are not in the California CDP data set. However, as we show here, the distribution of survey takers available to us in 2010 was skewed toward large arts nonprofits in certain focus areas (i.e., artistic disciplines/mission) and regions.
By organizational budget size, the CDP captures only 2 percent of California’s NCCS arts nonprofits with budget sizes less than $25,000, a group that makes up 48 percent of California arts and cultural nonprofit organizations in the NCCS (Figure 1). In contrast, the CDP captures 37–40 percent of organizations in budget categories greater than $500,000, although these organizations only make up 10 percent of all California arts and cultural nonprofits in the NCCS.
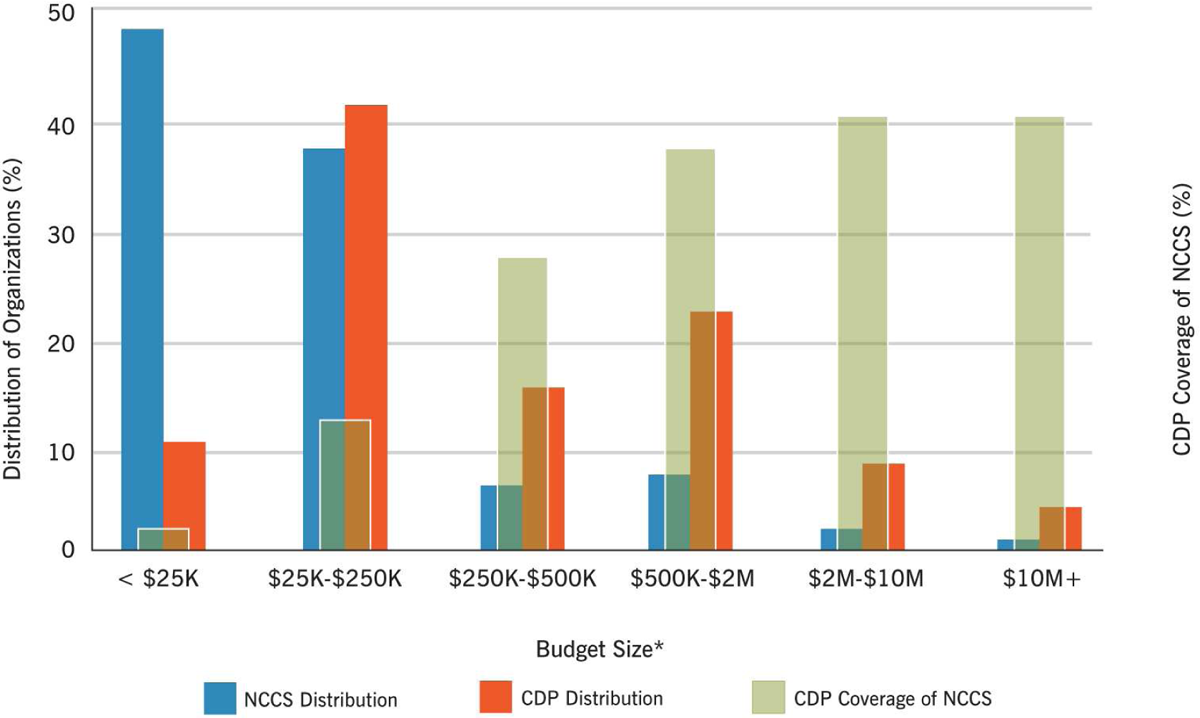
Arts and cultural organizations, budget size: Cultural Data Project (CDP) versus NCCS coverage, 2008.
The CDP survey results also present a skewed view of arts organizational foci and location. The CDP overrepresents performing arts and music organizations with 22 percent and 19 percent NCCS coverage, respectively, compared with 11 percent across all disciplines (Figure 2). Conversely, the CDP only captures 6 percent of the NCCS’s ethnic, folk arts, and multidisciplinary organizations, although this group comprises 22 percent of all NCCS arts and cultural nonprofits. Similarly, the CDP captures only 4 percent of the NCCS organizations in the humanities, legacy, and other museums group, although this group accounts for 21 percent of all NCCS arts and cultural organizations. The CDP overestimates the share of California arts nonprofits in the large urban centers like the Bay Area (15 percent) and underestimates those in the Northern Valley, San Joaquin Valley, and Inland Empire (6 percent or less of NCCS organizations).
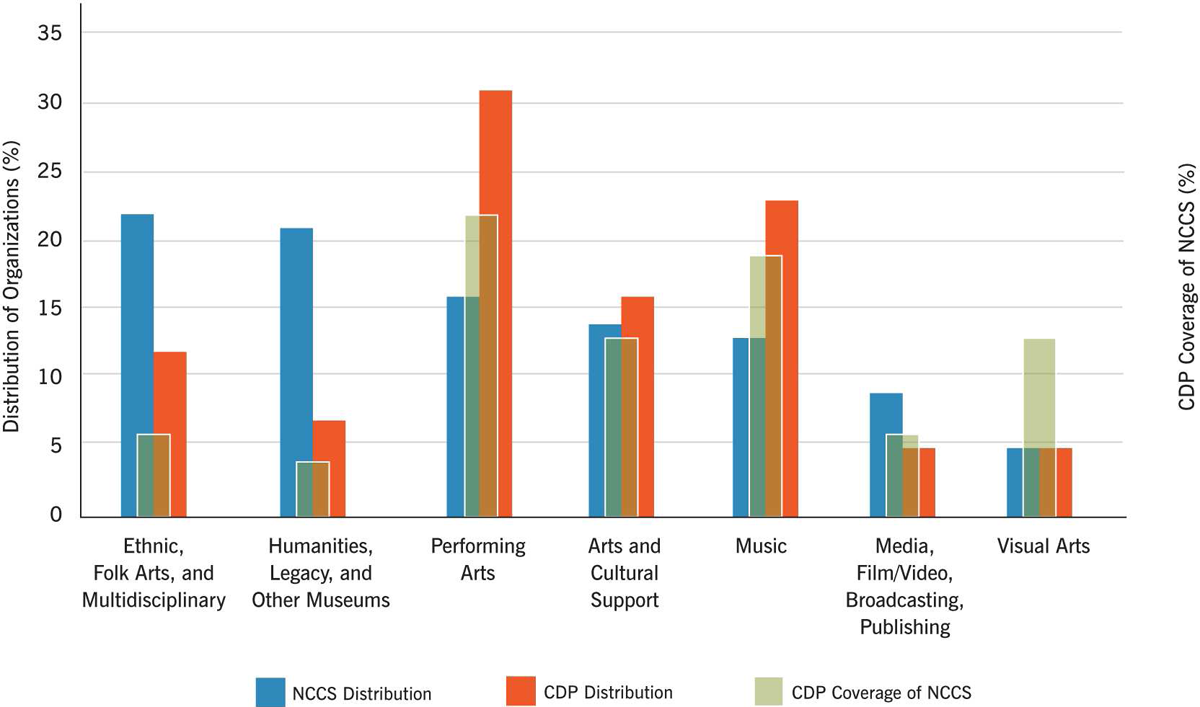
Arts and cultural organizations by focus area: NCCS versus Cultural Data Project (CDP), California 2008.
Thus, California’s nonprofit arts sector is much more diverse than the CDP data suggest. It hosts many more small organizations, and these are more spread around the state, though the CDP coverage is less skewed by region than it is by size and focus area. They are more numerous in ethnic, folk arts, multidisciplinary, humanities, heritage, and nonart museums than they are in what we thing of as the flagship arts institutions—major theatres and visual arts museums. The bias in the CDP data set arises from the fact that larger, big city, and fine arts and performing arts organizations are disproportionately taking the CDP survey. Nationally, foundations fund museum (37 percent) and performing arts (31 percent) organizations at much higher rates than other types of arts groups (Foundation Center 2011, in Lawrence 2011). We speculate that these organizations have been favored by funders in the past and have the capacity to devote staff resources to survey-taking.
The California CDP data are too new to permit longitudinal analysis, but Sidford reports that the number of nonprofit arts organizations in the United States has expanded exponentially in the past thirty years and that a substantial percentage of the new groups focus on non-European cultural traditions. Using 1stAct Silicon Valley data on 659 active arts, culture, and humanities organizations in 2008, she shows that 70 percent of the region’s groups are less than twenty years old, and 30 percent of these are ethnic-specific, focusing on the cultural traditions of India, Mexico, Japan, Korea, China, the Philippines, among others (Sidford 2011, 13).
These concerns with the bias and use of CDP data are not mere researcher nitpicking. In the first major use of CDP data for arts advocacy purposes, the Greater Philadelphia Cultural Alliance (GPCA 2008) study showcased CDP data that are similarly selective. Despite a data note acknowledging an undercount of smaller organizations, the study’s graphical depiction of area nonprofit arts organizations by size and discipline (GPCA 2008, 10, chart 2) depicts medium- and large-sized (not counting very large) organizations as more numerous than smaller ones, highly unlikely given bias in the CDP survey respondents. We estimate that California organizations under $250,000 account for 85 percent of all arts and cultural nonprofits, compared to 39 percent in the Greater Philadelphia study. The same chart displays only thirty community arts and cultural organizations, thirty museums, galleries, and visual arts organizations, and seventy-seven dances, theaters, and other performing arts—again, highly unlikely given our benchmarked results. Yet, the 2008 Portfolio claims to provide “an accurate measure of the current health and vibrancy of the cultural environment” (p. 8.) Thus, the CDP data, its collection and use are, to date, reinforcing the notion that larger, urban arts and cultural organizations are dominant and by inference, superior, providers of arts and cultural experiences.
How Employment and Attendance as Outcome Metrics Serve “Bigger Is Better”
In addition to budget size, funders and arts advocates often use employment and attendance metrics as proxies for outcomes. Granted, comparing outcomes across and even within organizations is challenging: is one attendee at a painting workshop for prisoners worth more than one attendee at a cello recital in a park? Less? As in the public sector, nonprofit managers are prone to using inputs as surrogates for outcomes. Are organizations with bigger budgets and more paid employees producing better art and more meaningful experiences for people? Outcomes, not inputs, justify the significant nonprofit tax exemption, a status that in the case of arts and cultural organizations is currently under scrutiny as possibly not “charitable” in nature (Cohen 2010).
Proxying outcomes with employment totals favors large organizations because they rely more heavily on formal employment than do smaller counterparts, who rely more heavily on volunteers. California arts organizations with budgets over $2 million report just one volunteer for every five paid staff members, while organizations between $25,000 and $250,000 engage seven volunteers for every one staff member. Three dozen interviews conducted with small arts and cultural nonprofits in California, none of whom had taken the CDP survey, found heavy reliance on volunteers (Markusen et al 2011). Volunteers are thus a hidden force multiplier, helping small organizations produce greater arts and cultural impact that their paid employment suggests.
Attendance is an outcome variable, but does not necessarily connote impact, and its usefulness depends on the range of events covered in surveys of individuals and organizations. The National Survey of Public Participation in the Arts (SPPA) asks individuals how many and what types of events they patronize, but the range of choices is narrow and Euro-American centric. 8 When the SPPA’s recently included, for the first time, attendance at salsa concerts (not dances), the shares of California adults who attending at least one arts event annually jumped three percentage points. Many smaller organizations do not treat participants as attendees—for example, festivals that have no admission fees, so that participants are underestimated on the CDP survey. Thus, smaller organizations, especially those serving ethnic and low-income communities, can be dismissed in the quality and size rhetoric that dominates much of the sector. Obstacles to identifying “better” programs and organizations place a premium on narrative and storytelling, favoring organizations (including funders) with the capacity and sophistication to manage their image, story, and relationships.
Preoccupation with Managerialism, Professionalism, Financial Sustainability
Among arts and cultural nonprofits, financial viability has been prioritized over mission outcomes in funding and nonprofit managerial discourse. Data-gathering processes like the CDP implicitly propagate a financial viability norm as denoting a “good” and therefore funding-worthy organization. 9 A seasoned funder recently lamented about both government and foundation review panels that he had sat on, “review criteria and panelists focused on stability and sustainability, perpetuating the old caste system” (Killacky 2011, 4.). Prioritizing financial viability means, too, greater roles for fund-raisers and managers.
Amid a deep recession, the US organization of nonprofit arts funders—Grantmakers in the Arts (2011)—launched a capitalization campaign, counseling arts organizations to bank larger shares of their revenues against a rainy day (Curtis Nelson, and Engel 2010), mirroring a broader nonprofit-wide initiative dating from the early 2000s (Miller 2002). Such campaigns increase resources dedicated to fundraising at the expense of programming during the capital-building phase. Nonprofit arts organizations are encouraged to become investors—9 percent of income comes from investments versus 7 percent in the broader nonprofit sector—as well as service providers, a pattern that is already under legal scrutiny in the nonprofit hospital sector.
While reserves may indeed help support organizations over time, satisfying the demands of the sustainability narrative, their accumulation may result in damage to organizations’ services in the medium run, requiring layoffs and service cuts, particularly in smaller organizations. While medium- and large-sized organizations bid for the funding to create reserves, many smaller organizations are struggling for the same resources to pursue their current missions. Critical of narrow quality and Euro-American centric funding criteria, Killacky (2011, 5) emphasizes this danger: “With organizations like the Philadelphia Orchestra and New York City Opera imploding, I worry that precious philanthropic resources will be further diverted to maintaining what was, instead of capitalizing a more representative future.”
The current concern with financial “health” (though no good indicator of that health has been agreed upon) is reflected in the composition of CDP questions. Fiscal questions are detailed, and the CDP maintains a twenty-four-hour data phone desk where staff members help organizations interpret and answer questions. Few questions inquire about quality or meaning, or the demographics and experience of people who participate in their offerings. Together, these agendas and procedures propagate a commercial business-like mentality rather than a public service and charitable mind-set on the part of arts organizations. Evaluation becomes focused on demonstrating financial viability rather than the more difficult and resource-intensive task of verifying the impact of arts and cultural programming.
Funding Patterns—Action Reflects Rhetoric
Do actual funding patterns favor larger arts organizations and those specializing in Euro-American-centric art forms? For the United States as a whole, recent research shows that philanthropic funding heavily favors large arts organizations over small, ethnically distinctive, and social justice groups. Sidford (2011) concludes that in the arts, “philanthropy is using its tax-exempt status primarily to benefit wealthier, more privileged institutions and populations” (p. 4). Using NCCS data, 10 Sidford finds that nonprofit arts groups with budgets greater than $5 million receive 55 percent of all contributions, gifts, and grants, even though they account for only 2 percent of total arts and cultural nonprofits (p. 8). Furthermore, these huge institutions “focus primarily on Western European art forms, and their programs service audiences that are predominantly white and upper middle income” (p. 1). Ethnic, non-Euro-American, and low-income community serving arts organizations are markedly underfunded.
Regional imbalances in arts and cultural funding parallel lopsided funding by size and focus. California private philanthropic (i.e., foundation) funding on a per capita basis is markedly skewed in favor of the Bay Area but also high in the Los Angeles and the Central Coast regions, while much lower elsewhere (Table 1). 11 The Bay Area receives $24 per capita in arts and cultural philanthropic grants, while the San Joaquin Valley, Inland Empire, and North Coast and Sierra regions receive $1 per capita. Large institutions account for part of this bias—nearly 30 percent of arts funding by California-based foundation was awarded in just twenty-nine grants to large museums, performing arts organizations and media groups, chiefly located in large metro areas (Helicon Collaborative, 2010).
Private Philanthropic Funding for Arts and Culture, per Capita by Region (2008$)
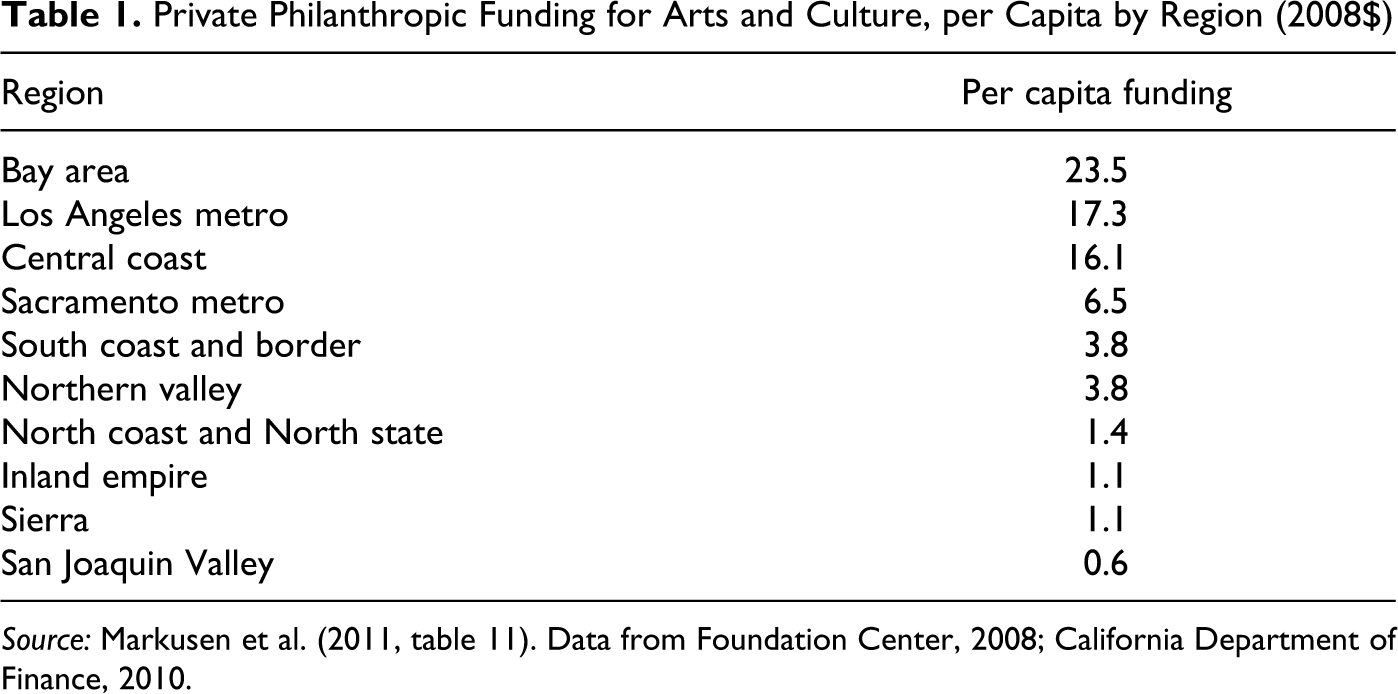
Source: Markusen et al. (2011, table 11). Data from Foundation Center, 2008; California Department of Finance, 2010.
We can conclude, then, that both in California and at national levels, larger arts and cultural organizations, those in the heavily populated metro areas, and those that focus on higher brow art forms receive disproportionate shares of philanthropic funding. Action is consonant with narrative.
Who Benefits from the “Big Is Better” Narrative and Its Funding Counterparts?
Despite huge tax subsidies (federal, state, and local), nonprofits do not have to demonstrate their contributions to the public good nor are they responsible in any formal way to the publics they serve. They can be defrocked of their nonprofit status, but this rarely happens, and usually only to very small organizations that have difficulties with IRS paperwork, a problem the IRS is attempting to remedy with a new postcard system (Blackwood and Roeger 2010). This distance from performance requirements leaves the door open for special interests to use nonprofits to for ulterior motives.
Top staff and members of boards of directors of nonprofits comprise one group of special interests, at least in large, established arts organizations. As the economics literature has long theorized, they (like public sector employees and even managers in large firms) have satisficing goals for their organizations that include preserving their own relatively comfortable jobs and perquisites. 12 It does not help matters that most nonprofit boards of directors are self-perpetuating, picking their own successors (i.e., the recipients of their charitable services have no voice or vote). Board members contribute meaningfully to their organizations, providing both funding (many organizations impose a “give-or-get” policy of mandatory donations from board members) and volunteer labor, most often in accounting, strategy, and finance—roles that might otherwise be hard to fill. In smaller organizations, board roles and composition is more diverse. Board members may be elected by the membership, friends of the founder, artists, community members, or service providers, and in some cases, they may serve as tokens only (Markusen et al. 2011, 39–40).
One confounding factor for arts and cultural nonprofits, especially the largest and Euro-American-oriented ones, is that their activities often provide wealthy contributors and board members pleasurable opportunities for exclusive social mixing, a phenomenon less true of nonprofits devoted to poverty reduction, social services, or community development. Operas, fine arts museums, and high-end theaters provide beautiful and exciting spaces for benefits and special perks. This function reinforces the privileges and access given to large, elite arts nonprofits by both governments and foundations.
Why do narrative struggles like these matter? Third sector/nonprofit organizations are major creators and deliverers of community well-being. Researchers, planners, and policy makers in fields like workforce development, cultural affairs, health care, and parks and recreation are often working with nonprofits, providing knowledge-building, evaluation, funding, and regulatory advice and directions to their leadership. In the arts and cultural sphere, these intermediaries often have little understanding of nonprofits’ governance structures, motivations, embeddedness in their communities or regions, or synergies with public and private sector actors in the same ecologies. These lacunae can lead to facile acceptance of narratives such as “big is better for the mission.”
Arts and cultural organizations, whether public or nonprofit, are not without their embedded special interests, and these may affect the spatial distribution of arts and culture (Markusen and Gadwa 2010a). A case study of Gordon Square Arts District—a long process started by a musician and carried forward by a community development corporation—shows how three theater groups on Cleveland’s declining working-class west side were able to revitalize their neighborhood with modest city commitments for planning assistance and streetscapes (Markusen and Gadwa 2010b). They had to contend with years of rejection from major area arts philanthropies that were deeply committed to existing large and venerable arts venues on the east side of the city. Eventually, however, both the Gund and Cleveland foundations helped the theaters with funding for renovation. The Gordon Square case demonstrates the ability of smaller organizations to produce substantial artistic and economic impact while revealing the reluctance of larger philanthropic funders in the area, preferring their large arts institutions, to fund their efforts.
Conclusion
Planning and policy making, and the regional science, social science, geography, and design fields that inform them, should more explicitly and honestly use narrative and storytelling in their toolkits, as Andy Isserman recently argued and demonstrated. Narratives abound in all these fields, and often are contested by others within or elsewhere. We have made the case for why narratives and storytelling are important, affirming Andy Isserman’s emphasis on the need to envision, plan and design the future in planning and policy making.
At the same time, we insist on the need to subject narratives and stories to evidence, moving beyond rhetoric to reality. We thus honor Isserman’s commitment to face squarely the frequent problem of insufficient metrics and evaluation tools, to which he dedicated much of his own life’s work. For nonprofit arts and cultural activity, we have examined prevailing narratives in philanthropy and planning, noting counternarratives and subjecting the former to evidence.
Our revisiting of the Isserman contributions yields implications for teaching and research. Introduction to planning and regional science courses, at both undergrad and graduate levels, should review outstanding visions and narratives in these fields’ histories of thought. In planning, Peter Hall’s Cities of Tomorrow (2002), an intellectual history of the past hundred years of city and regional planning, is a great text for this. In these and other fields, students can dissect the dominant narratives of each period, review whether and how the protagonists provided evidence for their contentions, and reflect on the impacts and outcomes. Such an exercise will both embolden future planners and regional scientists to think about vision themselves and to be deliberate (and cautious) in their construction of complementary narratives. Isserman, in his call for vision and narrative, invoked Alonso’s (1971) call for radicalism, even utopianism, to invent new alternatives and even new objectives.
Visioning is also something Isserman ardently advocated. In his forthcoming Abercrombie lecture, he intended to point out that although quantitative and qualitative tools help us understand past and current spatial relationships, their predominance makes it riskier for practitioners to advocate major shifts that might improve our future. Rather than method-driven research, which is more common than many of us would like to think (the recent Geographic Information Systems (GIS) craze is an example), researchers should pursue question-driven research. Whatever our field, what we spend time thinking about, conceptualizing, and writing should justify the significance of the problem attacked and the researchers’ ability to make a difference to it. For academics, our teaching should reflect this—the topics we choose to present and discuss in class should not be those that fall easily under the lamplight (and use flashy methods), but those that are central to making a better world.
Finally, we should extract from other fields of study what is useful about the concept of narrative and the use of storytelling as a presentation and teaching device. We were shocked to find so little concerted planning literature acknowledging the power of narratives and their ubiquitous (but implicit) presence in planning discourse and practice. As planning scholars, especially across our fields of expertise, we should be questioning each other . . . “wait a minute, what does that word/concept mean?” Examples might be “sustainability,” “resilience,” “amenities,” “well-being,’’. . . and many more. So many narratives that we use are built, on examination, on fuzzy concepts, a phenomenon documented in Markusen’s (2003) article of that name that challenged narratives of “flexible specialization” and “world cities” among others. Will planning finally pay attention to its own rhetoric? Will regional science move beyond tools to imagine and conscientiously construct narratives? Andy Isserman hoped so, demonstrating how in his teaching and writing. And, perhaps most daunting of all, we should be telling more (good, documented) stories!
Footnotes
Declaration of Conflicting Interests
The author(s) declared no potential conflicts of interest with respect to the research, authorship, and/or publication of this article.
Funding
The author(s) disclosed receipt of the following financial support for the research, authorship, and/or publication of this article: Author Markusen received research support from The James Irvine Foundation for the data analysis covered in the section on the case of arts and culture, including the figures and tables.