
Abstract
Strategic design of direct public engagement methods is an important consideration for local government officials. We present a descriptive and exploratory investigation of correlations between local-level contextual factors and municipal public engagement practices. The article addresses two questions: (1) How heterogeneous are the public engagement mixes utilized by local governments in the United States? (2) What local-level variables are associated with increased heterogeneity of engagement mixes? Using data from the 2016 ICMA Innovation and Emerging Practices in Local Government Survey, we create an index to measure of number of direct public engagement tools and frequency of their use by municipalities. We find that local governments vary widely in combinations and frequency of use of direct public engagement tools, although, in general, increased capacity and resources are associated with more tools used. Municipal scale, home rule, democratic vote share, and demographics of the municipality are associated with increased variety of engagement tools.
Introduction
The role of local governments in the United States as front-line agents linking individuals to the practices of democratic governance is well documented (Cho et al. 2021). Local governments are particularly important arenas for public engagement because of their physical proximity to the public and their influence on policies that directly influence individuals’ day-to-day well-being (Nabatchi and Amsler 2014, 64S). Municipal officials rely on the “locally situated knowledge and policy insights” that constituents provide to address complex issues with community support and investment (Eversole 2011, 52). The changing trends in engagement modes precipitated by the racial, political, economic, climatic, and public health related events of the past several years in the United States serve to underscore the importance of public engagement as a critical item for local government research agendas (Bowman et al. 2020).
Extant public engagement studies (see Carpini et al. 2004; Nabatchi and Amsler 2014; Schafer 2019 for comprehensive overviews) are rich and voluminous. Scholarship examines individuals’ propensity for engagement (Hock et al. 2013; Scott 2006; Yetano and Royo 2017) investigates factors contributing to the success or failure of specific engagement activities or tools (Adler and Blake 1990; DeSantis and Hill 2004; Ely 2015; Filner 2006; Kasymova and Gaynor 2014; Perlman 2012) and details engagement from institutional (Escobar 2017; Hoppe 2011), administrative (Buckwalter 2014), and process design (Bingham et al. 2005; Bryson et al. 2013; Fung 2003, 2006) perspectives.
Process design studies at the local level often focus on single issues or isolated instances of public engagement (Leighninger 2012), but there is evidence that this disposition is evolving and that, “many local governments are increasingly exploring ways to move from temporary to more stable, durable, and embedded forms of public engagement” (Nabatchi and Amsler 2014, 74S). This shift implies the utility of systems level perspectives that acknowledge the potential of engagement tools working in tandem to achieve multiple goals simultaneously. Examples of such interrelated goals include gaining a functional knowledge of the values and demands of a locality’s key publics (Ebdon and Franklin 2006; Eversole 2011), increasing accountability and trust, informing community members (Berner and Smith 2004; Berner et al. 2011; Jo and Nabatchi 2021; Krah and Mertens 2020), legitimizing policy decisions (Michels and De Graaf 2010), building consensus (Wang 2001), improving government performance (Yang and Callahan 2005), fostering inclusion and empowerment (Arceneaux and Butler 2016; Arnstein 1969; Feldman and Khademian 2007; Jo and Nabatchi 2021), and achieving equitable outcomes (Thomas 2012), among others. Not all engagement tools promote or prioritize all goals equally, and some tools exert countervailing pressures (Fung 2006). We argue that this situation makes developing an understanding of municipalities’ overall public engagement tool mixes a valuable pursuit for local government scholars and practitioners.
We add to the existing literature on strategic design of direct public engagement with an empirical examination of the local-level variables associated with municipal suites of public engagement tools. Our study is descriptive and exploratory; we investigate variables that we expect to be associated with use of public engagement tools, without hypothesizing directional relationships between the variables and tools. We address the following research questions: (1) How heterogeneous are the public engagement tool mixes utilized by local governments in the United States? (2) What local-level variables are associated with increased heterogeneity of engagement mixes? We employ the definition of direct public engagement developed by Nabatchi and Amsler (2014, 65S): “in-person and online processes that allow members of the public (i.e., those not holding office or administrative positions in government) in a county, city, town, village, or municipal authority to personally and actively exercise voice such that their ideas, concerns, needs, interests, and values are incorporated into governmental decision making.” Our findings indicate that within municipal governments, mixes of public engagement tools vary substantially. Home rule provisions, population size, Democratic vote share, and the demographic composition of the municipality are associated with using a greater variety of tools.
Strategy and Municipal Public Engagement
Numerous process design choices undergird any public engagement activity (Nabatchi and Amsler 2014). By categorizing engagement mechanisms, local government officials can employ strategic decision making to identify appropriate uses for various types of direct public engagement tools and can clarify the implications of their deployment in specific contexts. This idea is not new; Arnstein (1969) develops a typology based on an eight-rung “ladder of empowerment” that offers a picture of the potential interplay of engagement mechanisms and goals. Although the normative implication of the ladder concept—that mechanisms that offer more citizen control are ultimately more desirable—may be oversimplified, the framework has been widely influential and is still utilized to aid practitioners in categorizing and designing engagement activities today (Contreras et al. 2026; Cutts et al. 2024).
More recently, Rowe and Frewer (2005), classify public engagement mechanisms as one of three main categories: communication, consultation, or participation mechanisms. As with Arnstein’s typology, classifying the mechanisms provides a basis for aligning appropriate mechanisms with engagement contexts and participants. Although the focus of this approach on information flows does not allow for full consideration of all the potential goals of public engagement, the framework does provide practical guidance for matching tools to information processing needs.
A third typological approach, Fung’s (2006, 2015) “democracy cube,” better captures the complex reality and institutional setting of public engagement mechanisms. A set of three axes including participant selection, communication/decision making, and authority/power allows participatory mechanisms to be plotted comparatively along three key dimensions simultaneously. The cube provides a tool for thinking strategically about what types of problems each mechanism may be best suited for addressing and to visualize multiple tools in the same space. Importantly, this allows the user to assess the tensions or complementarities that may arise from concomitant use of different tools.
In addition to typologies of public engagement tools, scholarship also investigates the design of public engagement processes for addressing specific types of problems or policy areas. Although the focus of work in this area typically emphasizes selecting the right tool or tools for a given context, the questions that scholars identify are foundational for considering how multiple tools and platforms might fit together to form a local government’s overall strategic mix of direct public engagement mechanisms. For example, Cho et al. (2021) examine online platforms and their benefits and drawbacks of specific tools. Their work queries how tool adoption might be affected by municipal characteristics such as population demographics, and they highlight the implications of different online tools for the quality and type of information that will be gathered. Nabatchi’s (2012) scholarship has been particularly influential in the process design arena by depicting eight participatory design elements alongside propositions about relationships between design elements and administrators’ ability to gather information and uncover value conflicts associated with a policy issue of interest. Fung (2003, 2006) similarly focuses on the who, what, when, where, how, and why questions of design as well as issues related to resident empowerment and effective monitoring engagement efforts once they have been adopted.
Notably, most of the approaches tend to assume isolated instances of public engagement or iterative uses of the same tools. Nabatchi et al. (2015), however, suggest that direct public engagement may be evolving toward approaches embedded in more comprehensive systems perspectives. They argue for a better, more intentional mix of participation methods alongside new and updated institutional and legal structures to support these intentional mixes. For practitioners, Leighninger and Mann (2011) provide a guide that frames local public engagement efforts as a coherent system that requires developing supportive civic infrastructure and strategic planning processes to meet goals of shared democratic governance. In 2019, the International Association for Public Participation (IAP2 2019) awarded Boulder, Colorado its Organization of the Year Award in recognition of the city’s creation of a public engagement strategic framework that emphasizes consistency in decision making and use of public participation methods that align with the six overarching city-wide strategies defined in the framework. Although movement in the direction of more comprehensive strategic planning for public engagement is evident, it remains the exception rather than the norm.
Making progress toward more cohesive and strategic systems of direct public engagement tools requires the development of design processes that consider the shared dynamics of multiple tools and processes. Part of understanding these dynamics includes appropriately allocating scarce resources to engagement tool selection and implementation despite the uncertainty of success of selected public engagement approaches. In the face of routine uncertainty, risk management and its emphasis on diversification is a missing element of local public engagement strategy discussion. Specifically, municipal resources are being invested in the hopes of achieving a set of specified goals, and risk accrues from investing in one type of public engagement mechanism over another without certainty of which mechanism will generate the greatest return on investment. Risk management refers to the practice of reducing dependence on a single strategy or element to promote resilience and mitigate uncertainty.
One of the core elements of the practice of risk management is diversification (Koumou 2020). While diversification may call to mind investment portfolio strategies and using of a mix of financial instruments and assets to achieve wealth building goals, diversification as a risk management tool is not confined to investing. It has also been useful in non-financial fields to help develop approaches to agricultural land-use management (Paut et al. 2019), combat regional unemployment (Chiang 2009), preserve biodiversity (Figge 2004), mitigate flood impacts (Aerts et al. 2008), and develop information retrieval processes (Wang and Zhu 2009). The connection between these various applications is that they exist in situations in which there are several possible tools that can be used to achieve goals, each with a level of uncertainty or potential volatility with regards to return on investment. By using multiple tools to work toward stated goals, the harm caused by the underperformance of a single tool can be mitigated.
Foundational to understanding whether or how diversification might function in a similar way for managing public engagement tools, is gaining knowledge of the current landscape of municipal engagement tool mixes. Notably, diversification alone is not necessarily positive. Implementing too many engagement tools or approaches could indicate that a municipality is overextending its resources for only marginal gains in understanding of community preferences. Additionally, certain engagement tools are better suited to specific goals than others and intentionally matching the engagement method to goals then executing that method well is of primary importance. The contextual factors of a local government also play a role in the variety of tools that are needful. For instance, a more diverse community may require a more diverse engagement toolkit to mitigate the risk of missing important segments of the population. To date, engagement scholarship is relatively silent on these issues. We assert that by understanding the current number, type, and frequency of use of engagement tools adopted by municipalities that we can begin to develop a baseline from which we can provide valuable information to support more strategic municipal engagement approaches.
To summarize, previous research indicates that local government managers are often strategic in their approach to the design of individual public engagement tools, events, and processes. Progress toward applying this strategic perspective more comprehensively to develop permanent public engagement systems requires local government officials to agree upon and define engagement goals, identify desired returns, and take steps to understand and mitigate risks and uncertainty associated with trade-offs among direct public engagement tools. Because effectiveness in public engagement practices is highly dependent on goals and context, we suggest that it is needful to investigate whether diversifying engagement tools may help to mitigate engagement risks and uncertainties. As an initial step, we set out to describe the existing state of diversification in suites of local government public engagement practices. Specifically, we examine trends between contextual variables and the existing variety of direct public engagement tools used by municipal governments. Below, we describe each of the contextual factors that we include as independent variables in our study.
Contextual Factors
In their comprehensive review, Nabatchi and Amsler (2014) provide a framework for understanding differences in local public engagement practices. A driving element of that framework is the context or setting within which public engagement occurs. They highlight five contextual influencers of engagement practices including: legal frameworks, municipal size, political systems, political culture, and civic assets (p. 67S).
Legal Framework
The legal framework for public participation refers to the statutory requirements that govern or compel a municipality’s development of engagement strategies and can affect participatory processes, systems, timing, and participants (Nabatchi and Amsler 2014; Working Group on Legal Frameworks for Public Participation 2013). Legal scholars acknowledge the connection between home rule and public engagement, “Local democracy requires some level of local autonomy, of home rule. People will bother to participate in local government decision making only if local governments have real power over matters important to local people” (Briffault 2004). State governments vary in how authority is delegated to subgovernments. Home rule provisions allow local governments to have more freedom to enact ordinances that they deem necessary even if they have not been directly addressed by the state. While forty-four states currently have some type of home rule provisions (Russell and Bostrom 2016), there are inter and intra-state variation in the application these provisions. These variations in home rule have implications specifically for public engagement. Nabatchi and Amsler (2014) describe how shifting conceptions of home rule influence perceptions of appropriate levels and types of public engagement, and, through various iterations of reform efforts, increased direct public participation became associated with home rule. Although home rule acts themselves do not typically include public participation provisions (Nabatchi and Amsler 2014, 67S), linkages between home rule and public engagement persist in the form of expectations that home rule allows for more municipal freedom to innovate in developing and deploying additional participatory tools.
Municipal Scale
The second contextual element listed above is municipal scale or size. Population size has been a central concern of many scholars seeking to understand its relationship to democracy and civic participation (Dahl and Tufte 1973; Van Houwelingen 2017). Studies report conflicting findings regarding the relationship between municipal population and political participation rates, complicated by varying definitions of participation (Oliver 2000). Differing theoretical starting points also tend to point toward different conclusions. For instance, those who assume that smaller places produce closer social relationships predict more civic participation at the local level. On the other hand, some suggest that the size and complexity of issues in larger cities may be more likely to attract community attention and that the resources and technology available in these places are more expansive and better suited to accommodating larger numbers of participants (Oliver 2000). In other words, the expectation is that larger municipal size, as measured by population, is correlated with more demand and capacity to offer diverse channels of public participation.
Additionally, recent meta-studies have found a general trend toward inverse relationships between municipal population size and political participation (McDonnell 2020; Van Houwelingen 2017). All else equal, smaller municipalities tend to exhibit higher levels of resident participation. These findings may indicate that additional or more diverse participation mechanisms may not be necessary in smaller municipalities for them to gather enough information for decision making. On the other hand, more populous municipalities may be more disposed to cultivating multiple avenues of information gathering.
Political System
Municipal form of government speaks to engagement mechanism heterogeneity because it captures the structure of the administrative and political processes that control decision making about engagement strategy implementation, financing, and utilization (Nabatchi and Amsler 2014). Municipalities with more control exerted by professional managers typically have at their disposal a greater level of expertise and training regarding the planning of public engagement activities and the use of different technologies in engagement efforts (Nalbandian 2008). This suggests that “executive officials in council-manager cities are more likely to involve residents in deciding issues of public importance than their counterparts in mayor-council cities,” (Carr 2015, 679). Nalbandian et al. (2013) suggest that city managers with training on multiple engagement modalities may be more likely to use different types of engagement processes beyond voting. Similarly, council-manager municipalities may leverage their administrative capacity by employing a greater number of public engagement tools.
Civic Assets
In addition to the legal and demographic characteristics of a city, infrastructure has also been noted as an important influencer of public engagement (Nabatchi and Amsler 2014). Civic assets are “Any kind of resource – a building, an organization, a program– that connects citizens to one another, and to their public institutions, in ways that inspire and support collaboration, deliberation, and shared responsibility” (Leighninger and Mann 2011, 3). Accumulations of civic assets in a locality are assumed to increase the linkages between residents and government. Because civic assets themselves are so varied, ranging from hospitals and libraries to neighborhood associations, bowling leagues and churches, the mechanisms needed to effectively engage with and through various types of civic institutions is likely to vary greatly as well.
In summary, we expect relationships between several key contextual elements and the diversity of public engagement tools that a municipality elects to employ on a regular basis.
Data, Methods, and Results
To investigate our research questions, we utilize data from the International City/County Management Association’s (ICMA) 2016 Innovations and Emerging Practices in Local Government survey. Although, the landscape of the United States has changed in many important ways since 2016, effective public engagement by local governments has only become more essential. Additionally, no nationwide survey asking similar questions has been conducted in the intervening years. Therefore, the information from the 2016 survey still provides the most current snapshot available for these valuable.
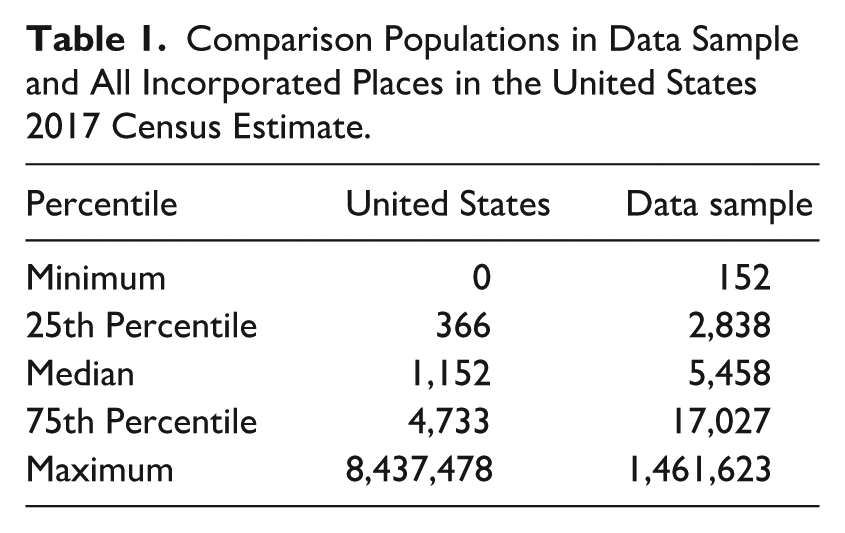
The survey was mailed to 5,450 U.S. municipal and county governments, including all local governments in the U.S. with populations greater than 250,000, and 1 in every 3 randomly selected from local governments with populations less than 250,000. Of those selected, 599 (11%) responded to the survey. To facilitate appropriate comparisons, we removed county government respondents from the data and were left with a sample of 371 municipal government respondents. We combine this dataset with local government economic and demographic data from the Census Bureau. Table 1 shows a comparison of our data to the United States as a whole. The survey data are relatively representative of the country. Municipal population in the survey data has a range of 152–1.4 million with a median of 5,458; whereas, the U.S. has a range of 1–8.4 million with a median of 1,152. The data slightly oversamples medium-sized municipal governments and under samples very small and very large ones. 1 We recognize these as limitations for the generalizability of findings but, given the relative dearth of data on this topic, the data are useful for the exploratory purposes of our study.
Comparison Populations in Data Sample and All Incorporated Places in the United States 2017 Census Estimate.
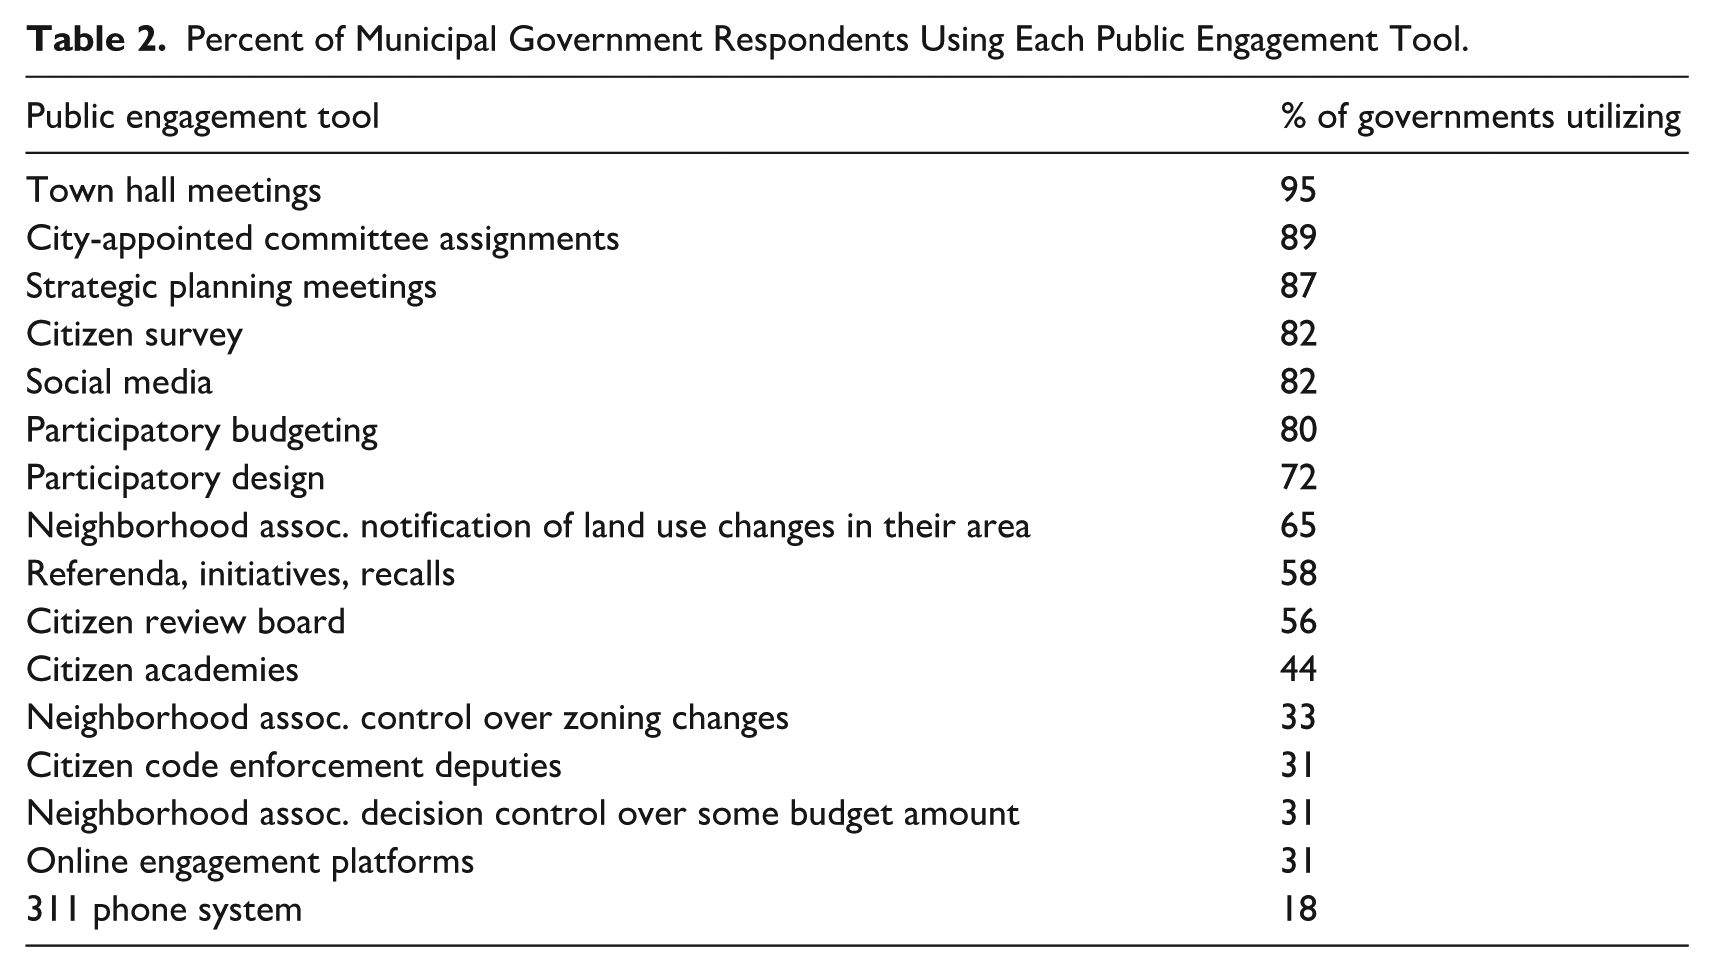
To investigate the collective use of public engagement tools, we created an index to measure both the number of tools and frequency of use per municipality. Our data set asks respondents to report on their municipality’s use the following: town hall meetings, participatory budgeting, participatory design, 311 phone systems, neighborhood association notification of land use changes in their area, neighborhood association control over some budget amount, citizen code enforcement deputies, strategic planning meetings, citizen surveys, referenda, initiatives, recalls, city-appointed committee assignments, citizen review boards, citizen academies, neighborhood association control over zoning changes, online engagement platforms, and social media. The response options for this question included the following: never, rarely, moderately, regularly, or frequently. There was no option to add additional types of tools as an open-ended response. Table 2 shows how many municipalities in the survey claim to utilize each public engagement tool. Town hall meetings, city-appointed committee assignments, strategic planning meetings, citizen surveys, social media, and participatory budgeting are the most common tools regularly used by municipalities to engage residents, with at least 80 percent of responding municipalities employing them. Tools that are less frequently used by municipalities include giving some budgetary or zoning control to neighborhood associations, citizen code enforcement deputies, online engagement platforms, and 311 phone systems.
Percent of Municipal Government Respondents Using Each Public Engagement Tool.
To create the index for municipal governments, we determined which tools they employed and how frequently each was used: never (0), rarely (1), moderately (2), regularly (3), or frequently (4). Each tool was given a score based on frequency of use and the index was the sum of these scores. While this index allows us to measure both the number and frequency of public engagement tools, it is still a limited estimate of overall public engagement opportunities available in each city. We assume that frequency of use scores (ex. never, rarely, moderately) mean the same across all governments surveyed. Further, we assign equal weights across tool types even though some tools (participatory budgeting) are more likely to represent thick participation than others (social media).
Table 3 provides an example of how the public engagement index was created using the Clearfield, Pennsylvania to demonstrate. This government uses a total of eight of the sixteen tools, ranging from rarely used tools such as participatory budgeting and referenda to frequently used social media, for an overall public engagement index score of 17.
Creating an Index of Public Engagement Tool Use: Borough of Clearfield, PA.
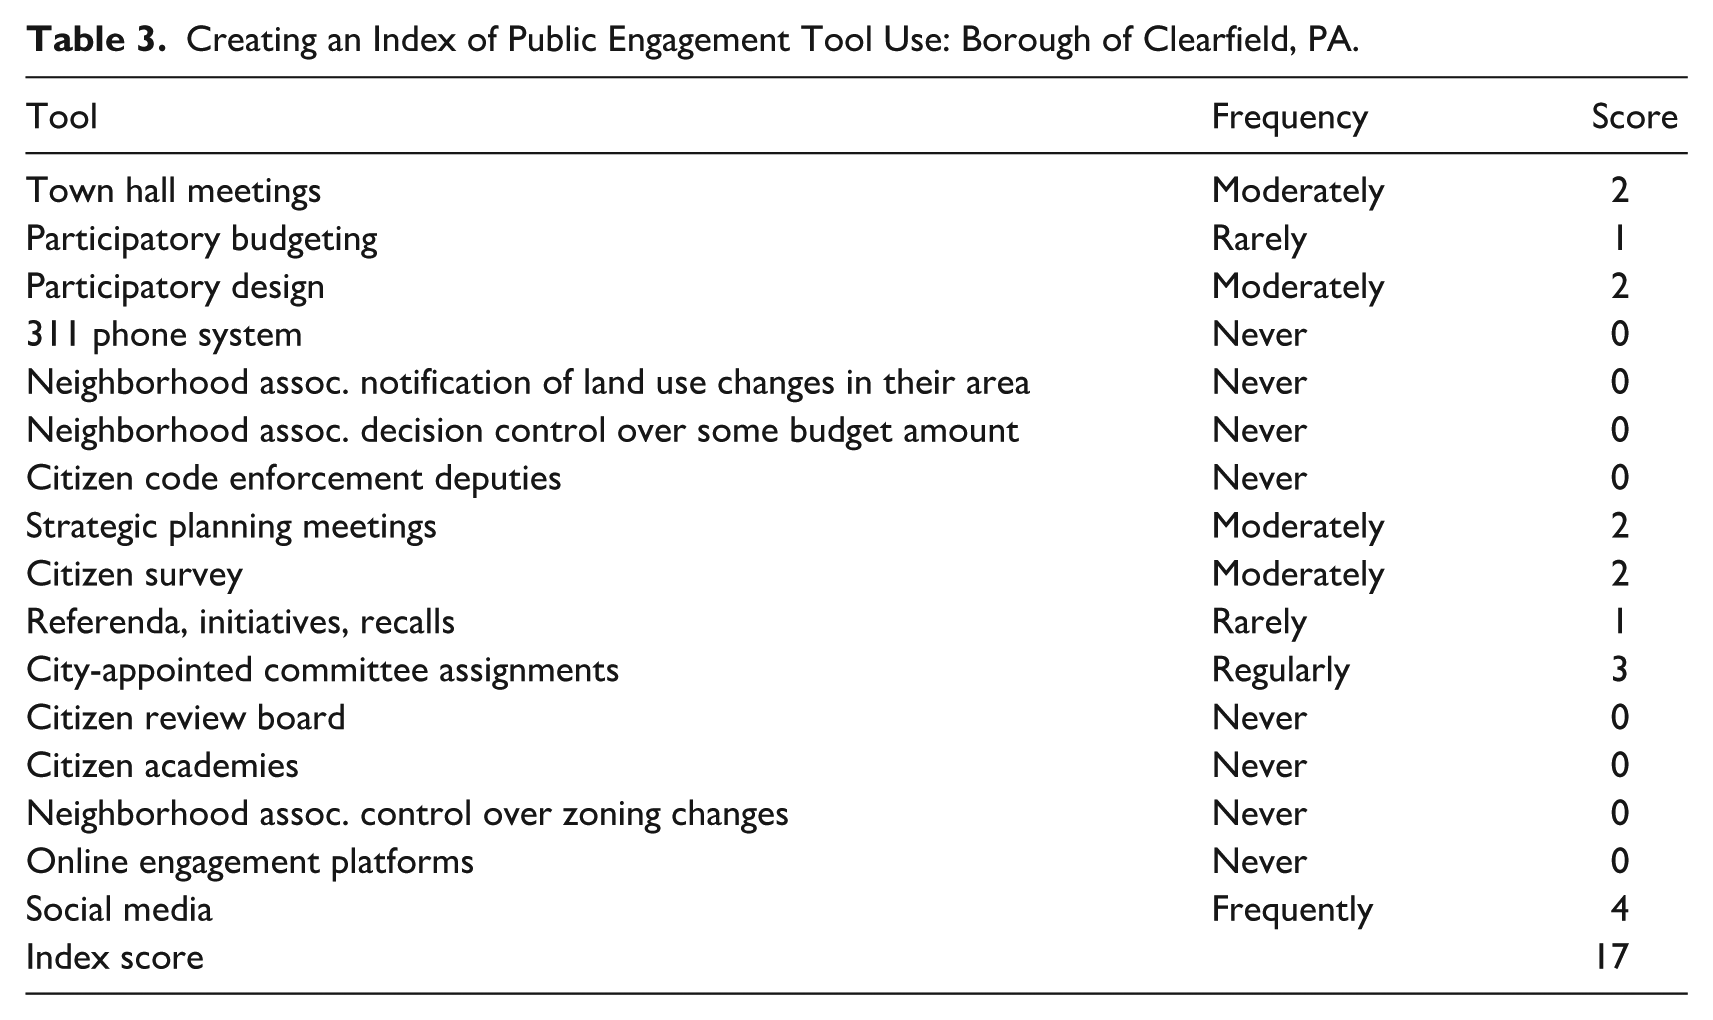
Figure 1 shows two histograms, the first provides the count of tools used per municipality and the second shows the distribution of public engagement scores, which accounts for both use and frequency, for all municipalities within the data. The average number of tools employed per municipality is 9.5 with a standard deviation of 3.6 with a range of 1–16. The average public engagement tool score is 20.9 with a standard deviation of 10.1 with a range of 1–52. We also investigated whether there were any popular combinations of tools used across the municipalities. Approximately 6.5% of our sample, 24 local governments, used all 16 possible tools. An additional 3.5%, 13 governments, used all available tools except for 311 phone services. In short, it appears that, when possible, municipalities prefer to employ a wide range of tool combinations, and the specific combination of those tools varies greatly across municipalities. As discussed above, we include independent variables in our analysis to capture important contextual variables associated with local level direct public engagement as identified by Nabatchi and Amsler (2014), and we detail why each of these factors may be linked to the mix of engagement tools that a municipality elects to employ. Our measures for each of these contextual variables is discussed in turn below.
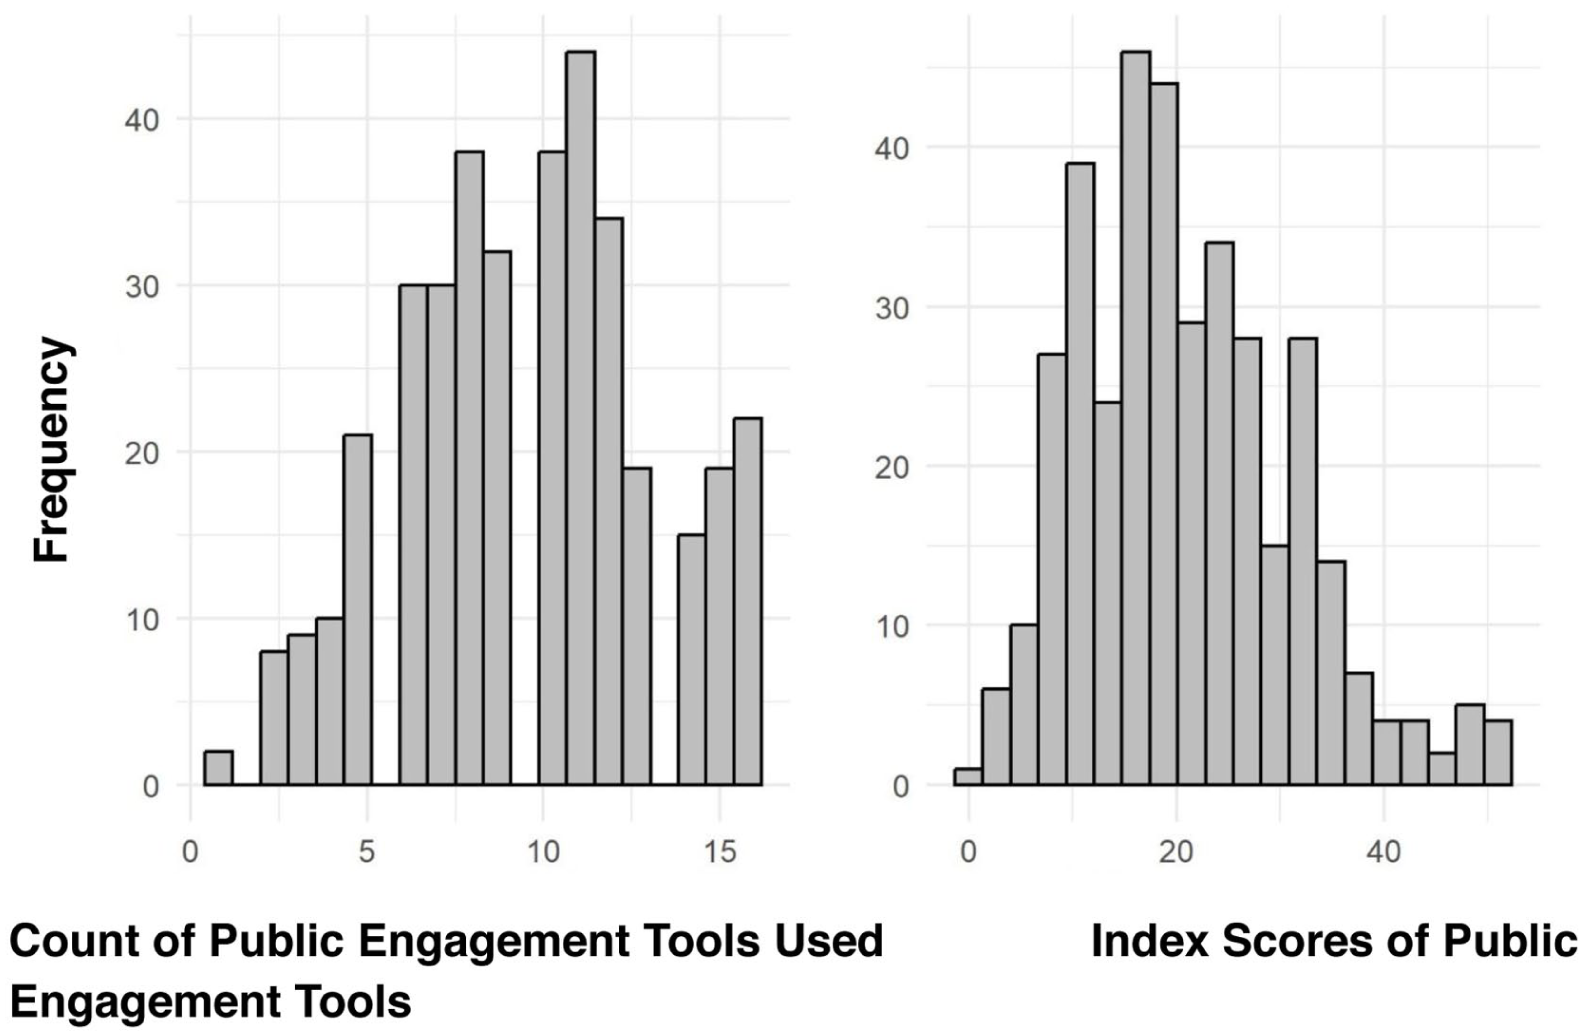
Distribution of counts of public engagement tools used and index scores for frequency of use of public engagement tools.
Legal Framework
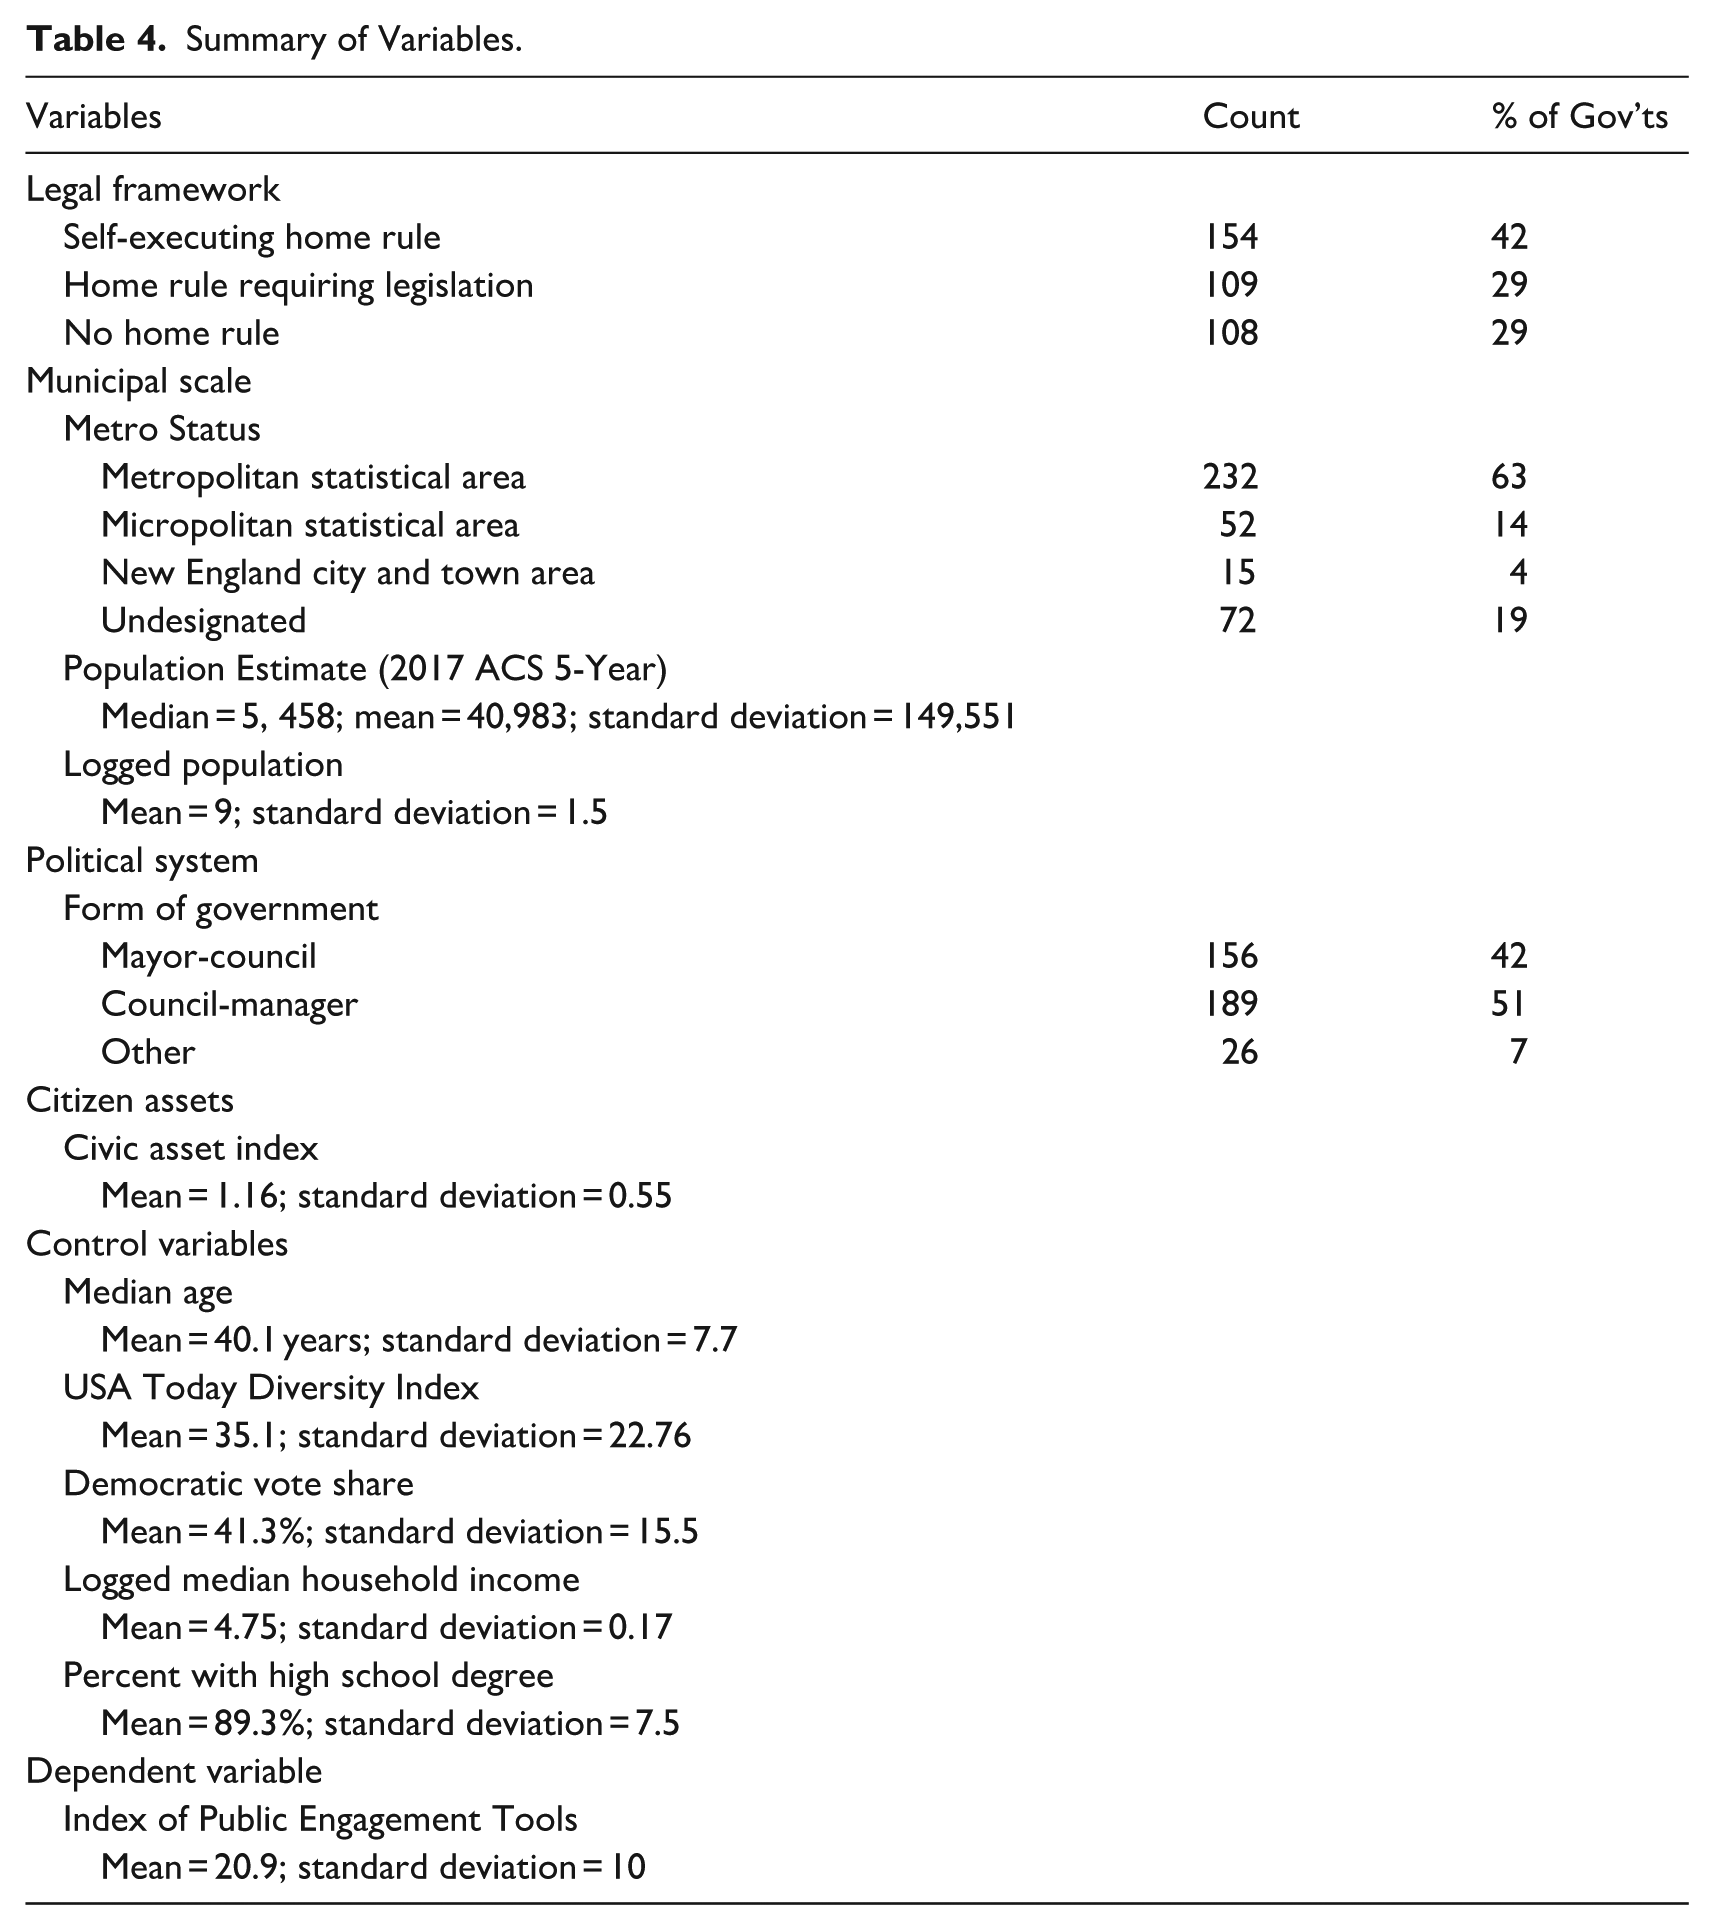
Our legal framework variable captures legal restrictions placed on local governments by their state constitutions. Within our data set, each municipality was coded for whether it operates under a constitutionally self-executing home rule, home rule requiring enabling legislation, or no home rule (Russell and Bostrom 2016). Those municipalities operating in states with “home rule requiring enabling legislation” may or may not have been granted home rule authority. Forty-one percent of municipalities operated under a self-executing home rule system. Table 4 displays summary statistics for this independent variable as well as the rest used in the study. We expect the municipalities without the benefit of self-executing home rule systems will utilize fewer engagement tools than their counterparts.
Summary of Variables.
Municipal Scale
We measure the size of the municipality using the Census 2017 ACS 5-year population estimate as well as Census designation as a metropolitan, micropolitan, New England city or town, or undesignated. Sixty-three percent of the responding governments are classified as metropolitan statistical areas and the median population for municipalities in our data set is 5,458. Our data includes a varied set of places, populations range from 152 to 1.4 million, with 75 percent of our sample having a population of 17,027 or less. We note the importance of understanding public engagement in the nonmetropolitan context and that our work can help to alleviate some of the “urban bias” that has been observed by scholars (Lobao and Kelly 2019). Methodologically, because we have such a large range in populations, we used the natural log of population in our model to improve results and interpretability.
Political System
Political system categories in our data include council-manager, mayor-council, commission, town meeting, representative town meeting, and unknown. We capture these using a series of dichotomous variables. Mayor-council and council-manager forms of government account for 42 percent and 51 percent of the municipalities in this data. The remaining 7 percent were collapsed into a category labeled “other.”
Civic Assets
As defined above, civic assets are resources, such as buildings, organizations, or programs, that connect community members both to one another and their public institutions (Leighninger and Mann 2011). These resources, while difficult to measure across all municipalities in our study, can be estimated by social capital variables like the number of active organizations in an area, such as religious, civic, social, business, political, and recreational organizations. These organizations allow residents to connect with one another as well as community leaders to increase efficacy and engagement. To capture civic assets, we use the measure developed by Rupasingha et al. (2006). They create an index using an aggregate count of relevant organizations 2 and establishments 3 within each county per 1,000 residents. The index range is 0.1–4.38 organizations and/or establishments per 1,000 residents with a mean of 1.16 and a standard deviation of 0.55. While our data is based on the municipality, these county estimates of assets should still reflect the overall resources and opportunities for social connections and community culture in each area.
Control Variables
In addition to the key independent variables, we also include variables to account for the population characteristics of the municipalities, including racial and ethnic diversity, median age, education level, median income, and party preference. These variables are particularly important because public engagement is predicated on the assumptions that the populace of a locality should shape its policy decisions and directions. Therefore, understanding the population characteristics that shape preferences for specific types of engagement tools and pathways is crucial (Glaser et al. 2006).
To measure the diversity of municipal populations we used the Diversity Index which accounts for the proportions of the four named races in the US Census (white, black/African American, American Indian/Alaska Native, and Asian and Native Hawaiian/Other Pacific Islander) and Hispanic and non-Hispanic ethnicities (Meyer and McIntosh 1992). We used ACS 5-year 2017 population estimates from the U.S. Census Bureau (2017) to calculate the index which estimates the likelihood that any two people chosen at random from the municipality will represent a different race or ethnicity. The index ranges from 0 to 100, with 0 meaning that there is no diversity within the population and 100 meaning a 100 percent chance that if two people were drawn at random, they would represent different races and/or ethnicities. We calculated several measures for diversity, including entropy and the higher education diversity index, and they all were correlated at greater than .9. We chose the Diversity Index because it has the most straightforward interpretation and a similar scale (0–100) as many of our other variables. The average Diversity Index score for our data is 35.1 with a standard deviation of 22.76.
Second, we include median age of the populace from US Census (U.S. Census Bureau 2017). Sharp (2009) demonstrates that age influences an individual’s propensity to use specific types of engagement mechanisms. While we do not specify a direction of the expected relationship between age and heterogeneity of tools, we do include it as a control variable. The average median age of cities in this data is 40.1 years with a range of 21.5–71.9.
Next, we include education as measured as the percent of population with at least a high school education and median household income from the U.S. Census (U.S. Census Bureau 2017). Studies consistently find a relationship between education and income levels and political participation (Hillygus 2005). Many scholars argue that both are associated with higher levels of political efficacy as well as providing the resources necessary to participate in public policy making (Brady et al. 1995). The average percent of the population with a high school degree is 89.3 with a range of 50.3–99.7 percent. The average median household income is $61,265 with a range of $17,344–$244,539. Given this large range in incomes, we also calculated the natural log of the median household income.
Last, we include partisanship of the populace as using the Democratic vote share in 2016 Presidential Election at the county level (MIT Election Data and Science Lab 2018). Previous studies have found differences in political engagement practices based on individual partisanship, particularly on social media (Vraga 2016). Thus, we include partisanship as a control in our model. We matched the city to the county using the FIPS codes provided in the dataset to be consistent when accounting for cities that may be included in multiple counties. While we understand that cities within a county can vary greatly in terms of partisan preferences, this measure was the most consistent one available. Areas vary greatly in terms of electoral politics with some responding areas being extremely Republican-leaning and others heavily Democratic. The average Democratic vote share in 2016 for the governments included in this data is about 41 percent, with a range of 8.5–78 percent.
Methods
Using the data described above, we employed a negative binomial regression to model the relationship between the index of public engagement tools and contextual factors of municipalities. Negative binomial models are appropriate for this study given the dependent variable is a discrete index based on the count of tools used by a municipality. This model also controls for the over dispersed nature of the data that a simpler count model (i.e., Poisson) could not. The negative binomial model is preferable to a Poisson model due to the over dispersed nature of the data which we confirmed using an overdispersion test (Cameron and Trivedi 1990). Further, a likelihood ratio test to compare the fit of both the Poisson and negative binomial models suggests that the negative binomial model offers the best fit (Zeileis et al. 2008).
Results
The first model gauges the differences in the index of public engagement tools used by municipalities based on the legal framework, municipal scale, political system, and civic assets. Table 5 shows the findings for the negative binomial model which estimates the municipal public engagement scores. The baseline for legal framework is set to self-executing home rule, metro status is set to metropolitan statistical area, and political system is set to council-manager systems, respectively. Overall, the results show associations between the contextual factors highlighted by the current literature with public engagement tool index scores for municipalities. Cities that are in states without home rule provisions exhibit lower scores, while micropolitan and undesignated areas, higher population sizes, increased diversity, and higher Democratic vote shares are positively associated with public engagement index scores. Since the findings of negative binomial models cannot be directly interpreted, Table 5 also includes the incident rate ratios (IRR) which show the expected percent increase or decrease in the dependent variable for each one unit increase in an independent variable. To identify the rate of increase or decrease we look at the difference between the IRR (which are reported in Table 5 along with their 95% confidence intervals) and 1. Those IRRs above 1 are positively associated with the dependent variable, public engagement tool index score; whereas, those IRRs below 1 are negatively associated with the public engagement tool index score. For example, those cities with no home rule provisions are associated with at 11.4% decrease in the public engagement tool index. The Diversity Index, conversely, is associated with a 4% increase in the public engagement tool index for every ten unit increase in diversity.
Negative Binomial Model: Public Engagement Tool Index per Municipality.
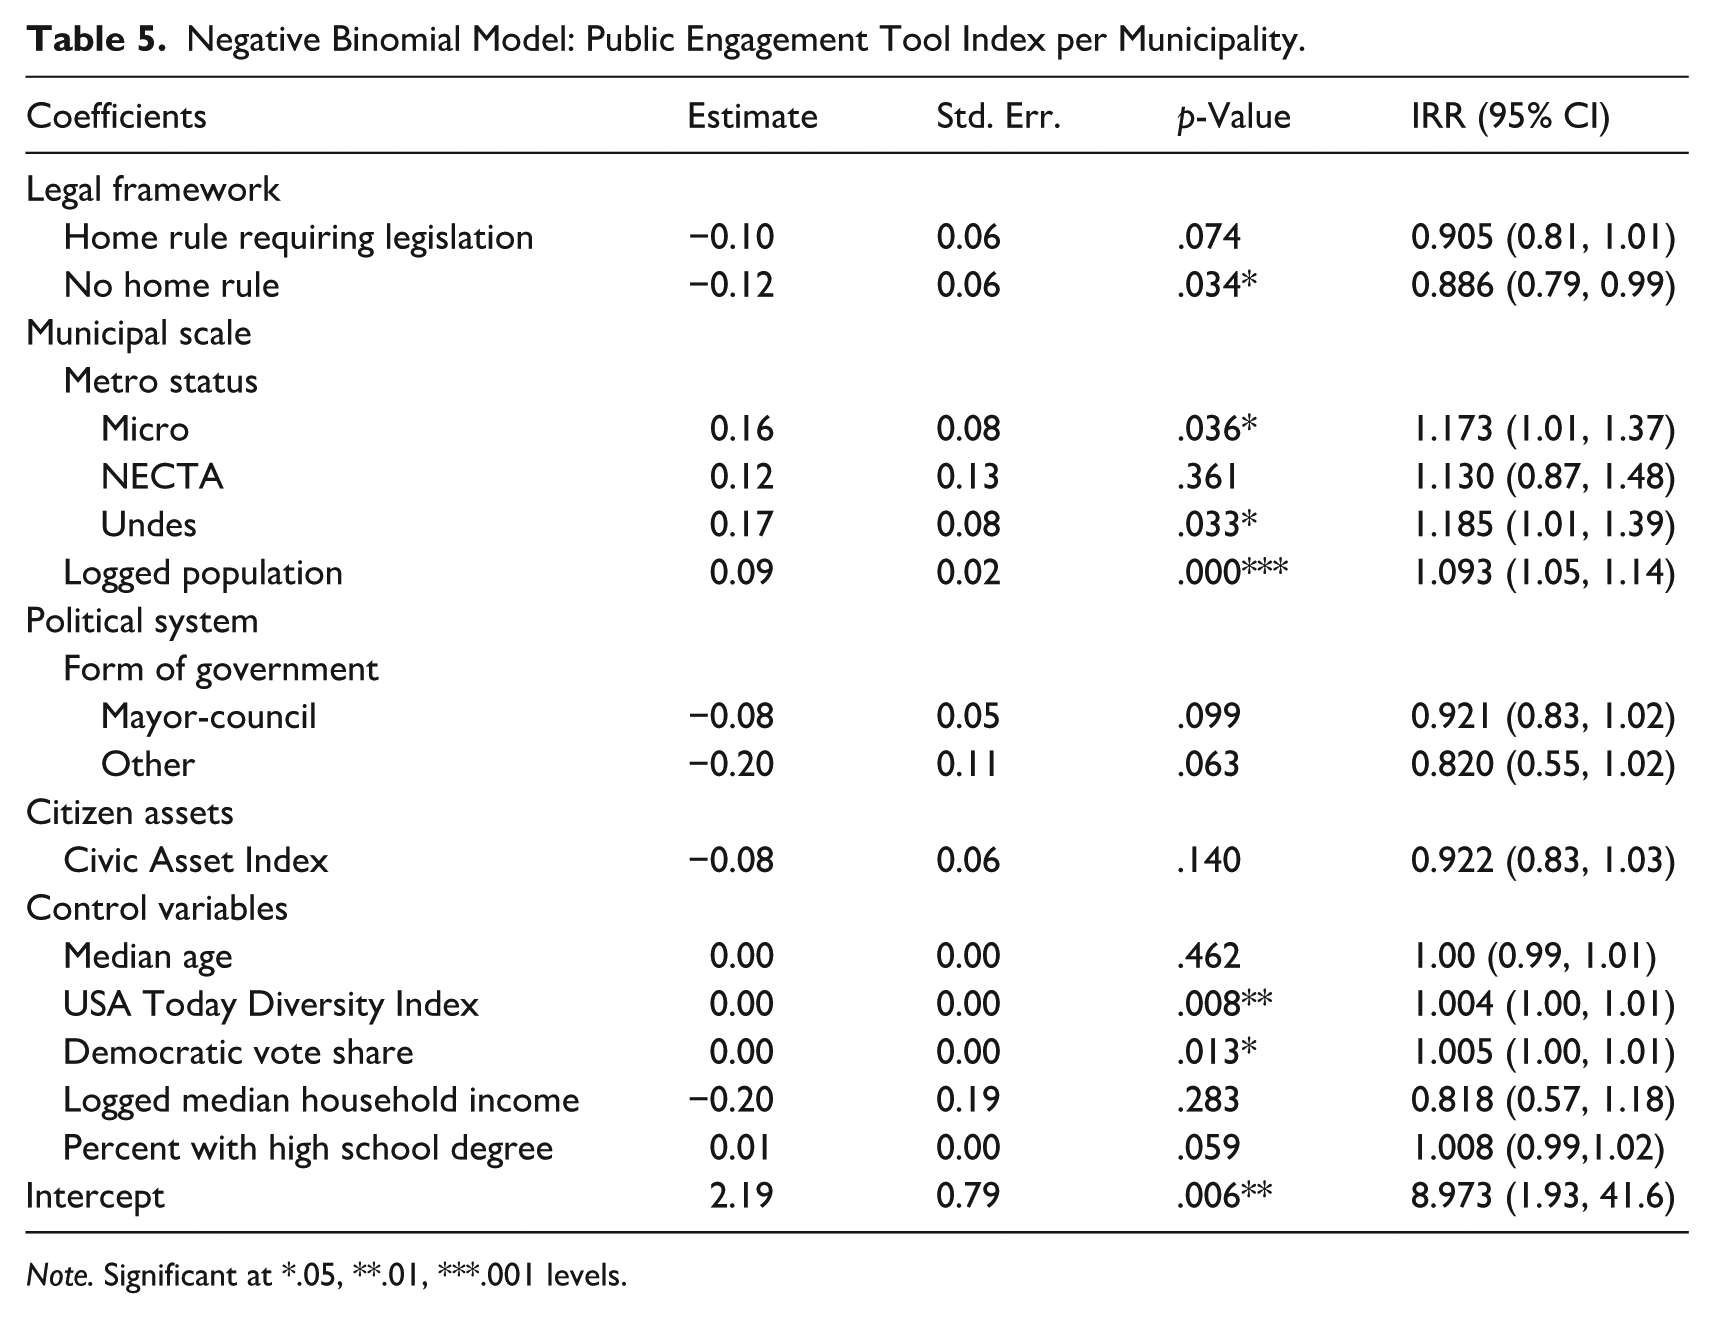
Note. Significant at *.05, **.01, ***.001 levels.
As noted above, those cities in states with no home rule were associated with an 11.4% decrease in their public engagement tool index scores. Cities with less legal authority, then, are more likely to have fewer, and less frequently used, public engagement tools. Municipal scale is positively associated with the diversity of public engagement tool mixes. That is, as the population of a municipality in our data set increases, on average, so does the diversity of tools included in its engagement mix. A one unit increase in logged population with a 9.3% increase in a municipality’s variety, and frequency of use, of public engagement tools. Figure 2 offers further explanation of the predicted impact of population on public engagement. This finding suggests that cities with larger populations are more likely to use a wider range of tools to encourage public engagement, an increase in score that may be the result of both greater community demand and greater government capacity. Conversely, the findings for the micropolitan and undesignated areas suggests that smaller communities may also have increased opportunities for public engagement. Micropolitan and undesignated areas are associated with 17.3% and 18.5% increase in public engagement tool index. Taken together, this suggests that across all area types, population is positively associated with increased public engagement index score, but micropolitan and undesignated areas also have a higher baseline of adoption and use of tools.
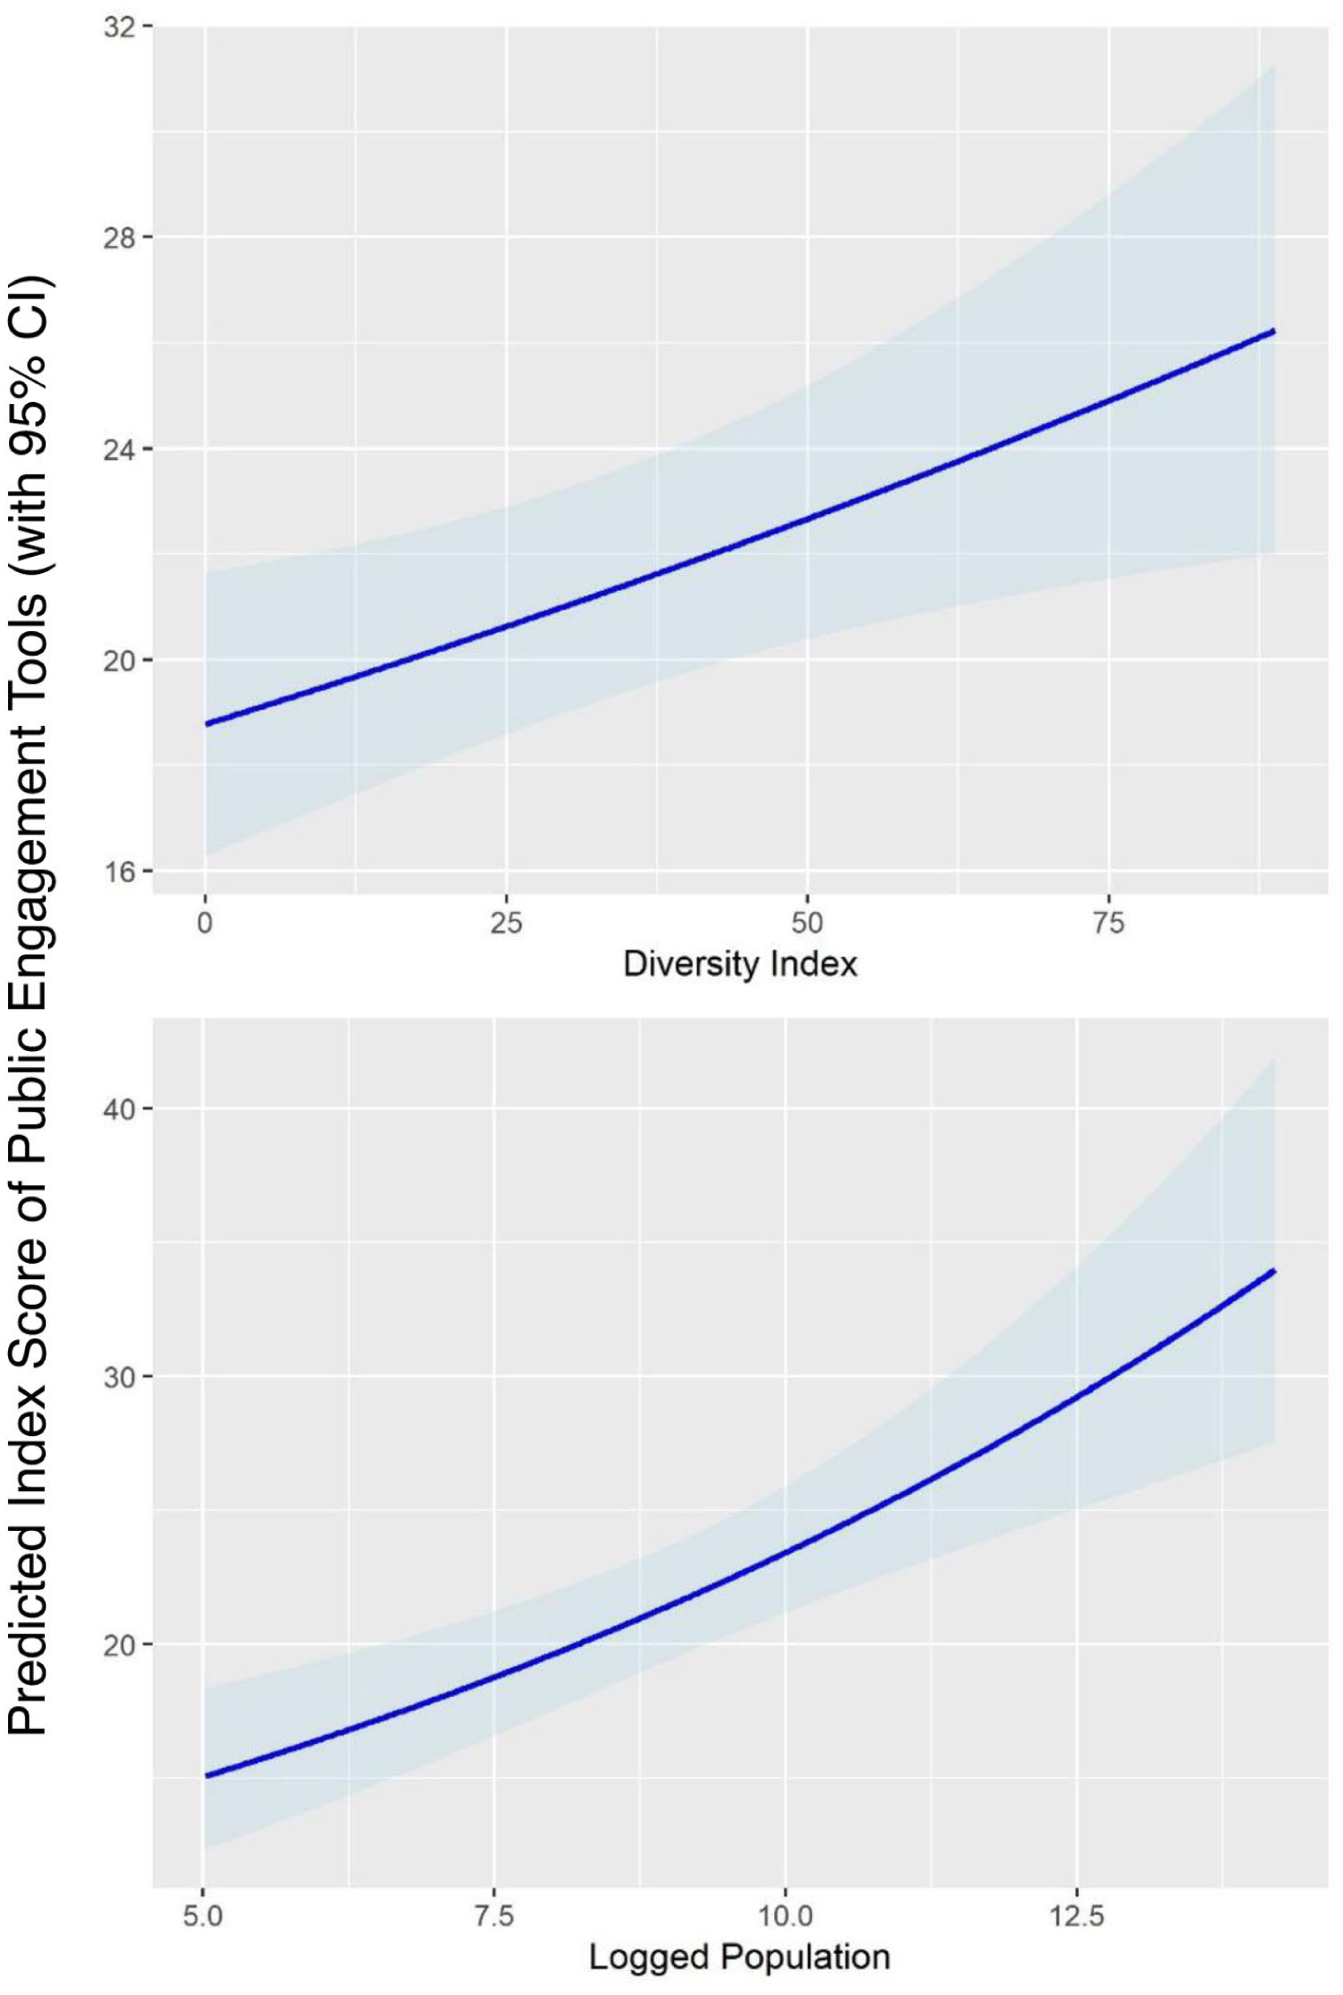
Predicted index score of public engagement tools used by a municipality in response to changes in the diversity and size of municipality populations.
The model does not identify any associations between political system, form of government, or presence of civic assets being associated with the diversity or frequency of use of public engagement tools.
In terms of control variables, the regression results support a connection between a community’s racial and ethnic diversity and the availability of public engagement tools. First, a more ethnically and racially diverse population is positively associated with heterogeneity of engagement tools. As the ethnic and racial diversity increases so does the city’s public engagement tool index score. In fact, for every 10-point increase in the Diversity Index, a city’s public engagement score is predicted to increase by 4%. This finding implies that cities recognize and respond to the varied participation needs associated with a diverse population.
Additionally, those municipalities located in districts that had increased support for the Democratic presidential candidate in 2016 are positively associated with the engagement tool index score. The IRR suggests that for every 10-point increase in the Democratic vote share, a city is predicted to have a 5% increase in its public engagement tool index score. This result suggests a need for additional study to understand how municipalities may utilize engagement tools to respond to the political preferences and demands of their electorates. Average age, median household income, and percentage of the population with a high school degree are not associated with a city’s public engagement tool index score.
To further illustrate the impact of population characteristics on a city’s diversity and use of public engagement tools, Figure 2 shows the predicted probabilities for logged population and the Diversity Index. To calculate these predicted values, legal framework, metro status, and political system were set to their baseline values and other variables were set to their means (or modes where appropriate). Population size has a statistically significant and positive effect on the predicted index score of public engagement tools. The predicted probability plot indicates that as population size increases, there is an increase in the predicted public engagement tool index score. For example, a city with a population of approximately 2,000 residents is predicted to have a tool index score of slightly less than 20; whereas a city with a population of approximately 275,000 would be predicted to have an index score of almost 30. We also notice a statistically significant increase in scores associated with not just the size of the population, but also the racial and ethnic composition of a municipality’s population. Figure 2 shows that the predicted public engagement tool index for a city with a Diversity Index score of 0 is 19; whereas the predicted engagement tool index score is 26 for a city with a Diversity Score of 100 (a roughly 40% increase). These two findings suggest that cities adopt more tools and use them with higher frequency when serving larger and more diverse populations.
Form of government, civic assets, median age, and median income are not associated with increased public engagement tool index scores.
Discussion and Conclusion
Our study joins with other work on public engagement that highlight the importance of understanding the municipal context in order to strategically design public engagement approaches. Given reports of engagement failures (Irvin and Stansbury 2004), lack of knowledge about the linkages between participatory design processes and outcomes (Jo and Nabatchi 2021), the difficulties in defining and measuring engagement effectiveness (Berner et al. 2011), and the unintended negative consequences sometimes associated with public participation (Callahan 2002), expanding knowledge about strategic design of public engagement tools is a goal of both scholars and local government practitioners. Municipal leaders can use the information from our study to begin to develop an understanding of the types of contextual factors that may increase pressure for more diverse public engagement strategies. This knowledge encourages more systematic consideration of when diversification of engagement tools is desirable or beneficial and can help provide insights toward developing a strategic mixing approach of direct public engagement tools. The important contextual elements that our study identifies include the scale of the municipality, presence of home rule, Democratic vote share, and racial diversity. Our findings support the idea that municipal leaders may recognize linkages between demographic characteristics and attendant information needs and preferences for engaging with local governments. For instance, a public meeting is unlikely to offer universally effective engagement with diverse groups of residents. Therefore, additional mechanisms may be considered as a means of fostering more inclusive engagement processes, and diversification of engagement channels may mitigate the risk of systematically missing a constituency group.
We acknowledge the limitations of our study. Our study is cross-sectional, and therefore we are unable to draw causal conclusions about the associations between our variables. Also, our survey respondents were largely small to mid-size cities and towns in the United States. Therefore, we are unable to generalize our findings to very large municipalities, other types of local governments such as counties, or to municipalities beyond the U.S. context. Our study is an initial step at describing the collective mix of municipal direct public engagement tools. As such, our measure of public engagement mechanism heterogeneity may be refined in future work. For instance, it may be possible to rank or score engagement mechanisms based on various goals or attributes and develop a portfolio that maximizes those desired attributes. Additionally, developing measures for risk and expected return could provide additional insight into when increased diversification is most appropriate. As previous studies on participatory design indicate, contextual factors are not the only elements critical to developing strategic public engagement infrastructure (Bryson et al. 2013; Fung 2003, 2006; Godwin 2014; Michels and De Graff 2010; Nabatchi 2012). Future work can explore how goals, information needs, frequency of tool use, cost, policy areas, recruitment considerations, and monitoring and evaluation efforts may also influence a local government’s public engagement tool mix. Additional work is also needed to understand how the administrators of different municipal departments and policy leaders may work collaboratively to develop and design effective and comprehensive engagement approaches. Finally, although it is the most recent nation-wide data available on this topic, the survey data for our study was collected in 2016. Much has changed in the intervening years given the realities of events like the COVID pandemic, the changing U.S. political landscape, and the rapid evolution of artificial intelligence (AI) and large language models (LLM; Corbett et al. 2023; Wilson 2022). ICMA surveyed local governments in 2024 regarding AI use in local government. Respondents identified public engagement as one of the areas with the most potential for AI use, but, at the time of the survey, less than 12 percent of local governments reported using AI for resident engagement and many were concerned about combating AI misinformation and disinformation (ICMA 2024). In many ways, these changes and developments have only intensified the need for local governments to continue to develop approaches to public engagement that are effective and efficient. Therefore, observing municipal contextual variables and their correlation to tool use with the available data is an important step in advancing knowledge in this arena.
Further, municipal leaders’ abilities to pursue more integrated systems of public engagement are conditioned on political, economic, and social feasibility. While efforts exist to assist municipalities with developing frameworks that are hospitable to encouraging more expansive public participation (Leighninger and Mann 2011; Working Group on Legal Frameworks for Public Participation 2013), affecting change to institutional and cultural barriers can be a slow process. Officials seeking to deepen public engagement can also look to scholarship that encourages understanding how and when “thinner” participation mechanisms like social media or other online engagement may lead to “thicker” engagement practices and more collaborative decision-making environments (Scott 2019). We highlight the relationships between these different categories of participation and their utilization as a fruitful avenue for future scholarship.
As most local government officials have experienced, not all approaches to public engagement generate interactions between the public and government officials are amicable or mutually beneficial (Nabatchi and Amsler 2014). However, the role of institutions and administrators for the design of effective methods of public engagement (Bingham et al. 2005; Bovaird 2007; Nabatchi et al. 2017; Nalbandian et al. 2013) is critical. No universal formula exists that will produce a perfect mix of public engagement mechanisms, but enhancing decision makers’ abilities to identify contextual forces and translate their implications for public engagement tool selection provides a step toward developing strategic mixes of engagement tools that can support more permanent and effective public engagement infrastructure.
Footnotes
Funding
The authors received no financial support for the research, authorship, and/or publication of this article.
Declaration of Conflicting Interests
The authors declared no potential conflicts of interest with respect to the research, authorship, and/or publication of this article.
Data Availability Statement
The data that support the findings of this study are available from the International City/County Management Association (ICMA) but restrictions apply to the availability of these data, which were used under license for the current study, and so are not publicly available. Data are however available from the authors upon reasonable request and with permission of ICMA.