
Abstract
Transverse oscillation (TO) techniques have shown their potential for improving the accuracy of local motion estimation in the transverse direction (i.e., the direction perpendicular to the beam axis). The conventional design of TOs in linear geometry, which is based on the Fraunhofer approximation, relates point spread function (PSF) and apodization function through a Fourier transform. Motivated by the adaptation of TOs in echocardiography, we propose a specific beamforming approach based on back-propagation (BP) to build TOs in sector-shaped geometry. Numerical simulations and experimental data give a comparison between proposed and conventional beamforming for TOs. The accuracy is first quantified by comparing the generated and theoretical PSF using the root mean square error (RMSE) and shows that BP-based beamforming approximates the desired TOs more closely than the conventional approach. Motion estimation is then evaluated. The axial and lateral displacements are within the range [0-0.6] mm and [0°-6.4°], respectively, which correspond to 0.8 times the axial (0.73 mm) and lateral (8°) wavelengths. The result shows that the proposed method yields a clear improvement for lateral displacements, by reducing the error by 28.6% compared with Fourier transform–based beamforming, while maintaining the same error for axial motion estimation. Experimental measurements are discussed to complete this study and confirm that BP-based beamforming leads to better controlled TO images than conventional Fourier-based beamforming.
Introduction
Ultrasound echographic imaging is widely used for assessing organ functions and assisting diagnosis due to its many advantages: it is noninvasive, it allows for high frame-rate acquisitions, the examination can take place at the patient’s bedside, and its cost is relatively low. 1 Moreover, ultrasound imaging allows for motion estimation of the organs or tissues imaged. This is extremely valuable because their motion can be influenced by pathological changes. In particular, motion estimation is of great interest in elastography,2,3 blood flow imaging,4,5 and echocardiography.6-8
This paper focuses on motion estimation in echocardiography. Even if several techniques have been described to estimate precisely multidimensional motion,9-12 as underlined by Lopata et al. 13 and confirmed in a more recent study, 14 current motion estimation techniques can still not easily estimate motion in the transverse direction (direction perpendicular to the beam axis) with high accuracy. This problem can be addressed by modifying the image formation and using a beamforming scheme yielding a system point spread function (PSF) with transverse oscillations (TOs).
TO techniques were initially developed for 2D vector blood flow estimation by two groups of authors.15-18 It has been further investigated for elastography.19,20 The principle of the TO technique is to modify image formation by using a beamformer that is able to produce a pulse-echo sound field featuring axial oscillations and TOs, whereas conventional beamformers lead to axial oscillations only. The very interesting consequence is that the signature of the backscattered signal received from a moving group of ultrasonic scatterers crossing such a sound field will carry information about both the axial and the transverse velocity. How these images are obtained and exploited as well as their potential for different applications has previously been summarized in a short review. 21
In TO techniques, there are mainly two crucial steps: (a) obtaining the images through specific beamforming and (b) using these images to compute the motion of the medium under investigation. In this paper, we use a recent motion estimation technique 22 specifically taking advantage of a double oscillating pressure field, which motivates our efforts in trying to obtain TOs. Moreover, as we intend to use the TO technique for echocardiography, we focus on a particular configuration corresponding to sector-shaped geometry. In the literature, the TO beamformer is usually designed using the Fraunhofer approximation. 23 In contrast to previous studies 24 where the apodization function used to obtain TO with a linear array in a rectangular field of view was constant for all directions, we take into account the sector shape of the pressure field corresponding to the sector-shaped field of view typically used in echocardiography. This results in an apodization function varying with beam direction angle. 25 In a previous study, 26 Liebgott proposed to beamform TO images in the Fourier domain, consequently separating the different frequency components and adapting the apodization function for all of them. However, this method is extremely time-consuming, and as the real time nature of ultrasound imaging should be preserved, this technique was not considered in this study. Another approach has been proposed by Sumi, 27 where an iterative optimization procedure using a conjugate gradient is used. Besides beamforming techniques dedicated to produce TO images, specific beamformers can also be designed28,29 to improve more general ultrasound image features like penetration depth, contrast, and so on.
Previous studies proposed to extend the use of TO from blood velocity estimation to motion estimation of the heart muscle.24,30 More recently, another group used a phased array for 2D vector flow estimation
31
and extended their study to 3D by using a matrix-phased array.
32
These studies yielded relative good performance but used the same apodization function for all beam angles. With the aim of respecting better the real physics of wave propagation in echocardiography, we propose a specific beamformer design method based on back-propagation (BP) and reciprocity theorem, under which the parameters depend on the beam direction. This approach allows for more accurate results in sector-shaped geometry. A complex BP method has been proposed17,18 for Doppler imaging. However, Doppler imaging implies several transmissions in the same direction to estimate the motion vector in one direction (up to 32 transmissions
33
). This will result in a time lag between the first and the last acquired directions yielding a large cardiac motion. As studied in other work15,16 which are dedicated to blood flow estimation and use a complex field, two beams are focused during receive for forming in-phase and quadrature fields. In this study, we propose to estimate transverse displacement by using only one beam. This however does not preclude the possibility of estimating the transverse motion component. Indeed there is an important difference between our approach and the one used in blood flow. In blood flow techniques, Doppler signals are acquired along a given direction and the signal obtained by taking the samples at a given depth from each Doppler signals is analyzed. Such signal is thus constructed in the so-called slow time direction. For the TO Doppler technique, a complex slow time signal composed of an in-phase and quadrature component must be made available. These two components are obtained by steering two Doppler beams, separated by a distance
The principle of the method has been given in Xinxin et al. 25 and is further investigated here with more complete simulations and the first experimental validations. In particular, the proposed method is tested from numerical simulations and compared with conventional Fourier-based beamforming. The improvement brought by the proposed technique is demonstrated by comparing the generated and theoretical PSF using the root mean square error (RMSE).
This paper is structured as follows. In the section “Beamformer Design for Transverse Oscillations,” we first detail the beamformer design used for obtaining a PSF with TO, both using the Fourier Transform approach and the BP approach for a rectangular field of view. We then describe our approach to extend the beamformer design to a sector-shaped geometry. In “Numerical Simulations” section, we present the parameters used for the simulations of the apodization functions, the PSFs accuracy estimation, the motion estimation, as well as the simulated cardiac motion estimations. “Results” section presents the results of the simulations described in “Numerical Simulations” section as well as one simple experimental result. Finally, in “Discussion and Conclusion” section, we conclude the results for each simulation and discuss the limitation of our work.
Beamformer Design for TOs
The 2D PSF system incorporating the desired TOs is assumed to be separable 34 for both directions as well as for the transmit and receive scheme as given in Equation (1)

where
Our beamformer design mainly focuses on lateral profiles. Moreover, the transmit scheme can be considered as having little influence on the final image formation if a plane wave is emitted by making a focus in the far-field. As a consequence, we only consider beamforming during receive.
Beamformer Design Using Fourier Transform
In linear geometry, lateral oscillations correspond to the lateral profile expressed in Equation (2), which is a multiplication of a Gaussian envelope with a cosine function. In this equation,
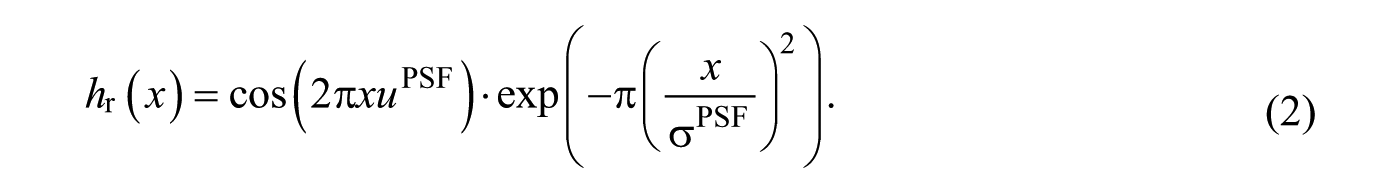
The conventional beamforming used to obtain the profile expressed in Equation (2) is based on Fraunhofer approximation, the conditions of which are met at the focal point. If a broad beam is emitted,
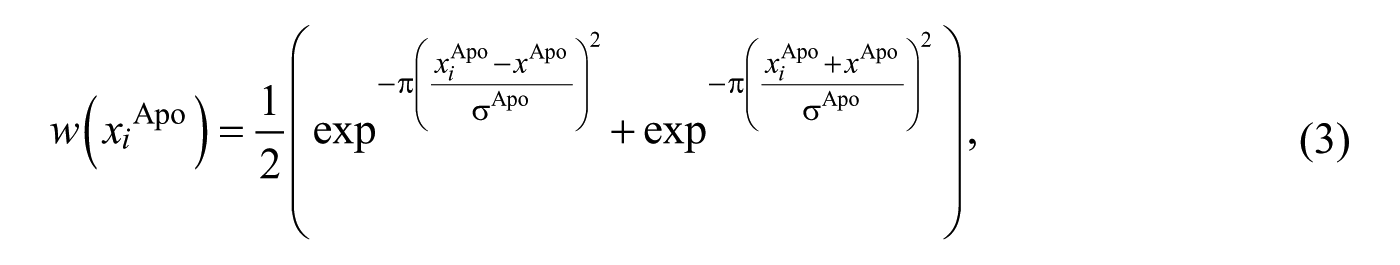
where


where
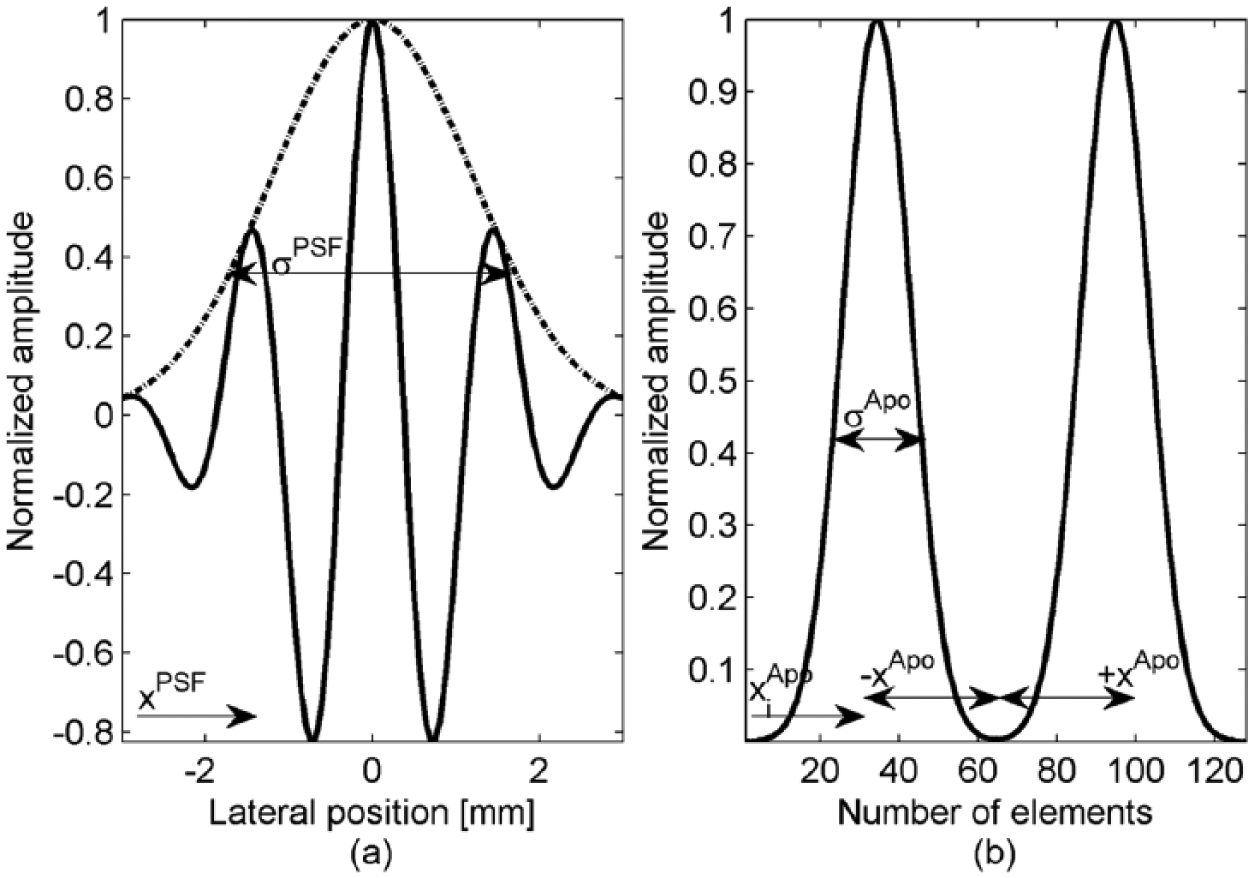
Lateral PSF profile (a) and corresponding apodization function (b). See text for relationships linking
The framework just described was previously used for motion estimation in echocardiography where TO feasibility in sector-shaped field of view was tested.24,30 To adapt that framework to a sector-shaped geometry, we transform
Transformation to Sector-Shaped Geometry
To adapt the above framework to sector-shaped geometry, we transform the model parameters from Cartesian to polar coordinates. This is done by setting


where


Beamformer Design Using BP
In reality, the conditions of Fraunhofer approximation are not completely met. This result in a PSF that does not precisely correspond to the expected PSF, especially in a sector-shaped geometry, owing to the approximated Fourier transform between the impulse response of aperture and the propagated pressure field. This limitation leads us to propose a new TO beamformer design using the BP method, which is better adapted to sector-shaped geometry and could yield a more precise PSF than the conventional beamformer design.
The PSF pressure field at the focus can be considered as the combined effect of all ultrasound pulses sent by all the aperture elements. As the ultrasound propagation function from the ith element to a point of interest can be modeled as a Green function,
23
one can relate the pressure in front of each element of a linear array
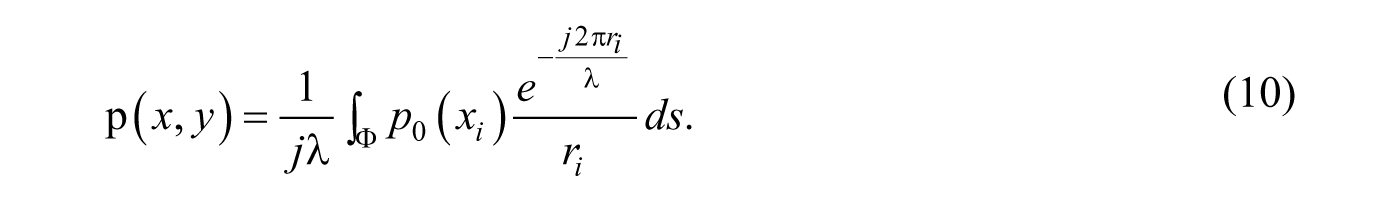
Considering that the pressure on axis of an element is directly proportional to the apodization function of each element
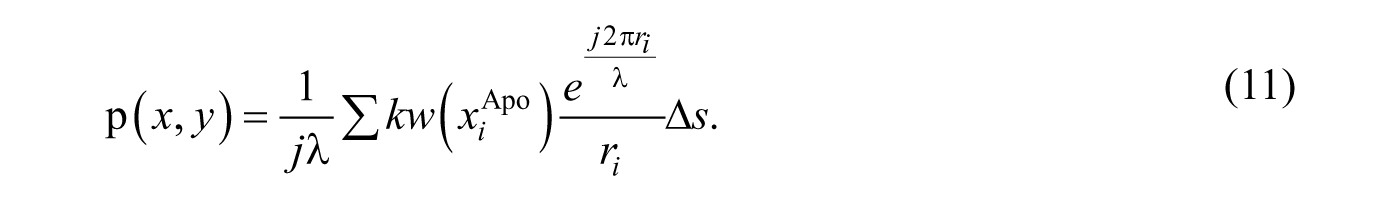
After factoring all constant coefficients in one single constant
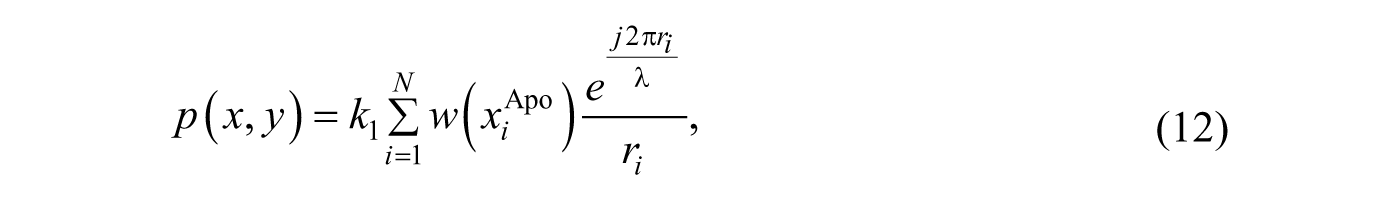
where N is the number of active elements,
Under the reciprocity theorem, 35 the function in Equation (12) can be reversed. This leads to a relation giving the pressure that would be observed at the position of the aperture elements when the apodization function is applied at (x, y). This approach is thus called the BP and can be expressed as
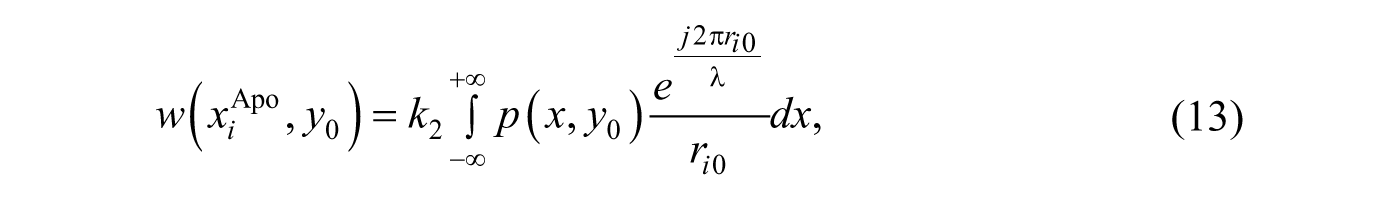
where


Both the pressure field of

where
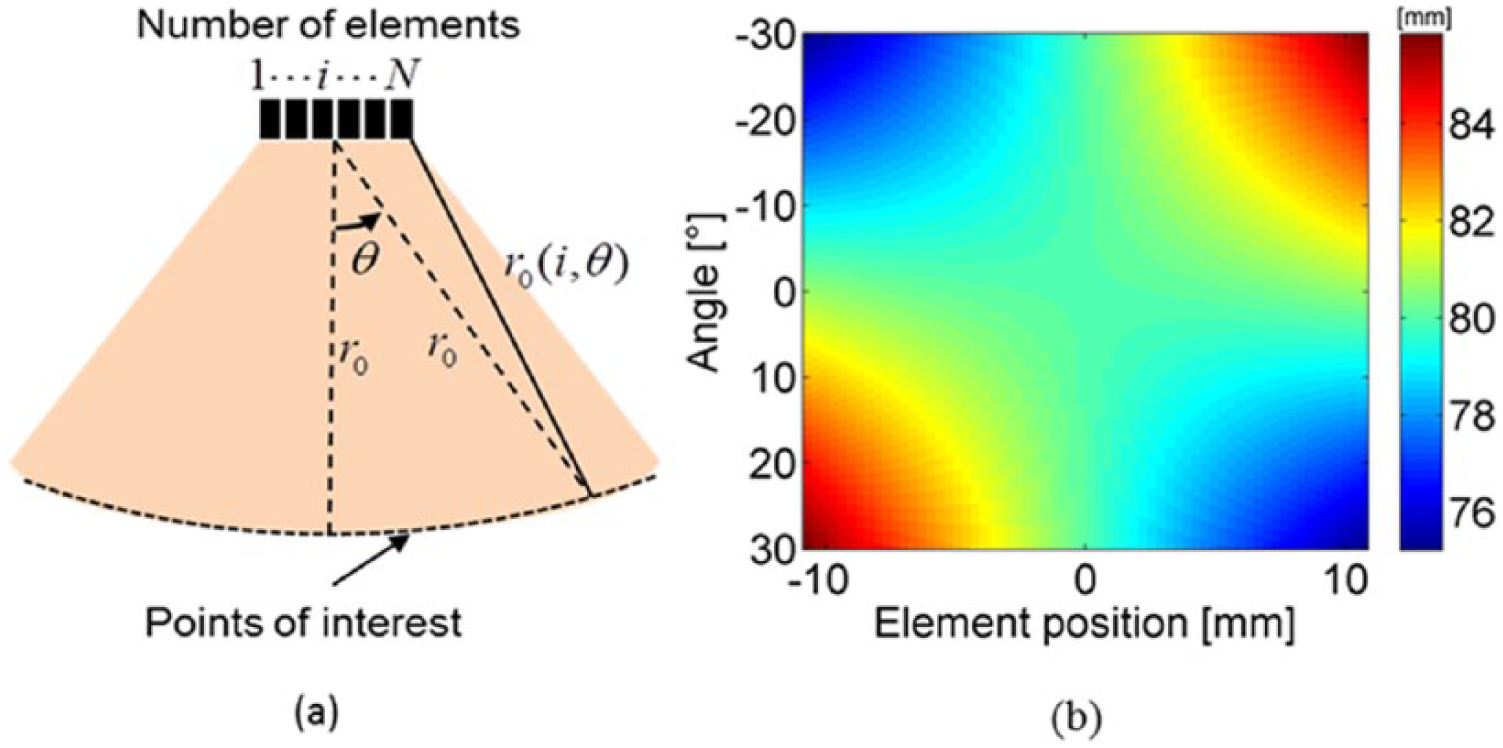
Presentation of the distance from the ith element to points of interest. (a) presents all the parameters, where the distance from central element to the points of interest is r0 = 80 mm, the scan sector θ covers a region from −30° to 30°, the number of elements is 64; (b) presents the distance from the ith element to points of interest. The position of elements is represented as [mm].
Numerical Simulations
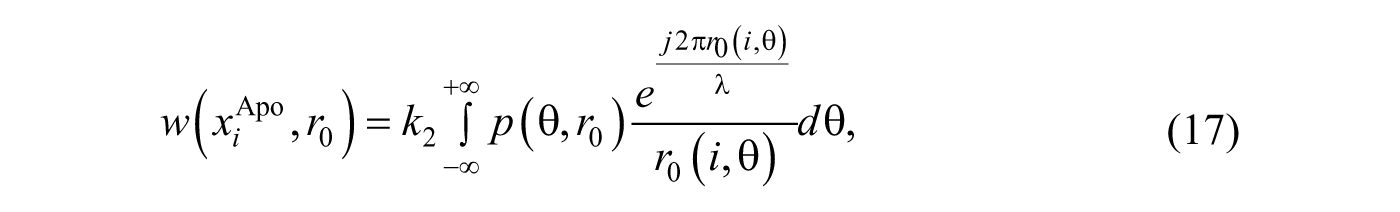
Numerical simulations were performed using Field II.36,37 The configuration in Equations (16) and (17) thus provides the BP beamforming design in sector-shaped scanning. All the results presented in the following context, both for simulations and experiments, were calculated with configurations given in Equations (8) and (9) for Fourier-based and Equations (16) and (17) for BP-based beamforming. Unless otherwise mentioned, the simulation parameters are given in Table 1. Note that for both methods, the transmitted energy is the same and only the receive apodizations are changed.
Simulation Parameters.
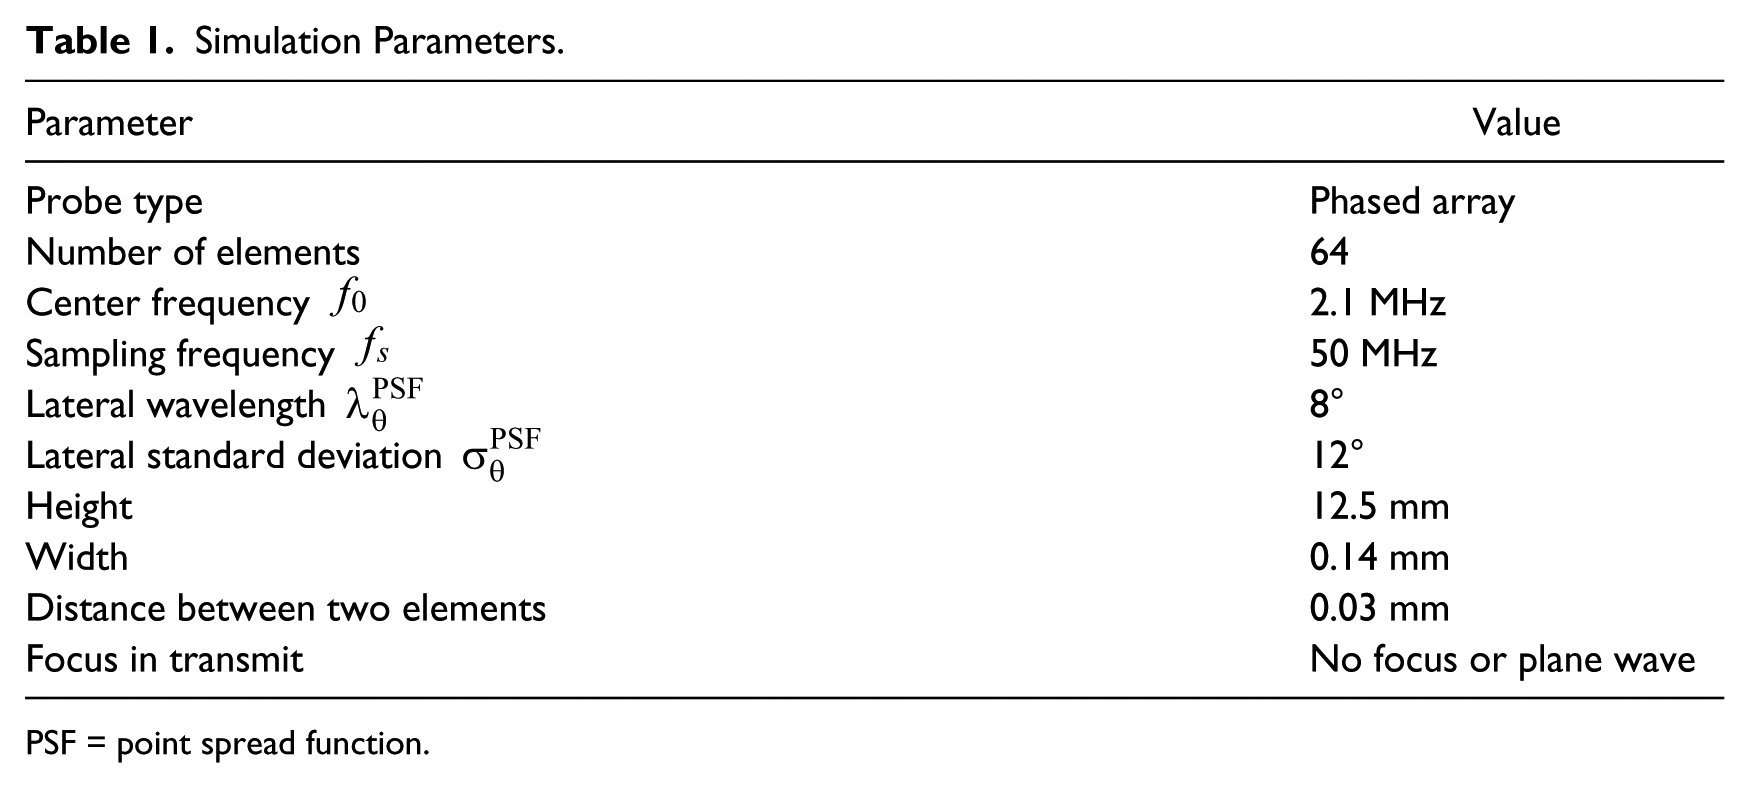
PSF = point spread function.
Apodization Function
Figure 3(a) shows a 2D representation of the BP apodization function in relation to the scan angle and element number. Figure 3(b) provides two profiles at two different angles of −30° and 30°. Figure 3(a) shows variations of the lateral profile of the BP-based apodization function with the angle and Figure 3(b) shows a slight asymmetry of the apodization lateral profiles with respect to the central (0°) line.
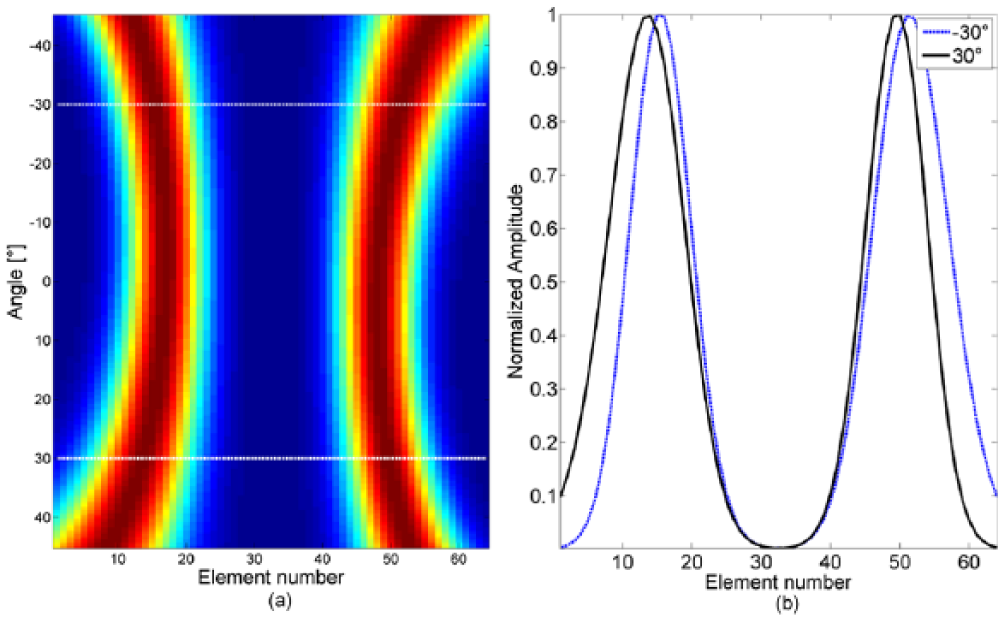
(a) 2D representation of BP apodization function as a function of angle and element number. (b) Extraction of two profiles at two different angles, 30° and −30°, the parameters are
PSF Accuracy Evaluation
The method’s accuracy is measured by comparing the expected, theoretical 2D point spread function (PSFth) and the PSF obtained in the simulation by applying a beamforming or apodization scheme, noted PSFreal, which is obtained by applying either the proposed BP approach or the conventional Fourier-based technique. In all simulations, the PSF amplitudes were normalized. The measure used in simulations to quantify the similarity between PSFreal and PSFth is the RMSE. Calling PSF ij real the i,jth value of the discrete 2D PSF obtained through the Fourier transform or BP and PSF ij th the corresponding i,jth value of the theoretical PSF, the RMSE is given as
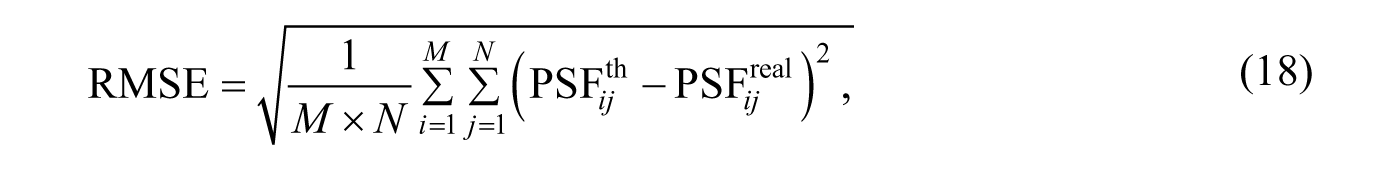
where i and j are the indices of the pixels considered, and M and N are the number of rows and columns of the discrete PSF, respectively.
Motion Estimation
Because our method is based on phase differences, according to Shannon theorem, it cannot estimate motions larger than half of the axial (0.36 mm) or half of the lateral wavelength (4°). Larger motions would lead to aliasing. The simulated motions are within the range [0°-6.4°] in the transverse direction and [0-0.6] mm in the axial direction (i.e., along the beam axis). The maximum values are thus larger than half the lateral and axial wavelength, allowing assessing the limits of the technique.
The applied motions are purely axial, purely transversal, or diagonal. These motions are applied to 100 different isotropic phantoms, each of them containing 10,000 scatterers located on the central axis of the probe. The phantom covers a depth ranging from 70 to 90 mm and its width is 100 mm.
In these experiments, the motion is estimated between 2 full image acquisitions and the results are obtained by performing 100 motion estimations by varying the scatterers’ random distributions at the same position, then computing the average of these estimates. This method was used in the following conditions:
For a given phantom, we apply 8 motions in the transverse, axial, and diagonal directions, resulting in a total of 24 motions.
For a given motion, we chose a region of interest (ROI) with a size equal to half of the lateral and axial wavelength and centered around the initial and displaced position of the phantom.
The motion is then estimated using the phase-based method of Basarab et al. 22 applied in these ROI.
The principle of this local phase-based method is to create complex image blocks based on a 2D extension of the analytical signal. 38 In short, such an image block is generated by keeping only one quadrant of its 2D Fourier spectrum. Two different analytical images are obtained by keeping two different quadrants of the 2D Fourier transform spectrum. A 2D rigid translation vector is then deduced from the phases of two successive TO images. For more details on this motion estimation technique, the reader can refer to Basarab et al.22,39
Simulated Cardiac Motion
We also did realistic cardiac simulations in a parasternal short-axis (Sax) view which correspond to one of the most commonly employed views in the clinical practice. 40
The simulation is performed as described in Alessandrini et al. 41 and leads to a complete cardiac cycle composed of 46 consecutive frames. Note that the simulated cardiac sequences span one cardiac cycle from one end-systole to the next.
Results
PSF
Accuracy of the PSF
The accuracy of the PSFs obtained for depths ranging from 60 to 100 mm and scan angle from −30° to 30° is given in Figure 4. The accuracy is evaluated using RMSE as given in Equation (18). The comparison of Figure 4(a) and (b) shows that the RMSE associated with the Fourier-based beamforming increases with scan angle and that RMSE associated with BP decreases. To display these observations more accurately, Figure 5 provides a plot of the RMSE profiles obtained at a depth of 80 mm both for Fourier-based and BP-based beamforming. Figure 5 confirms that BP-based beamforming provides a PSF closer to the expected PSF than Fourier-based beamforming, whatever the scan angle, and that this difference is particularly large for lateral scan regions, that is, for large scan angles, such as the position close to 30°.
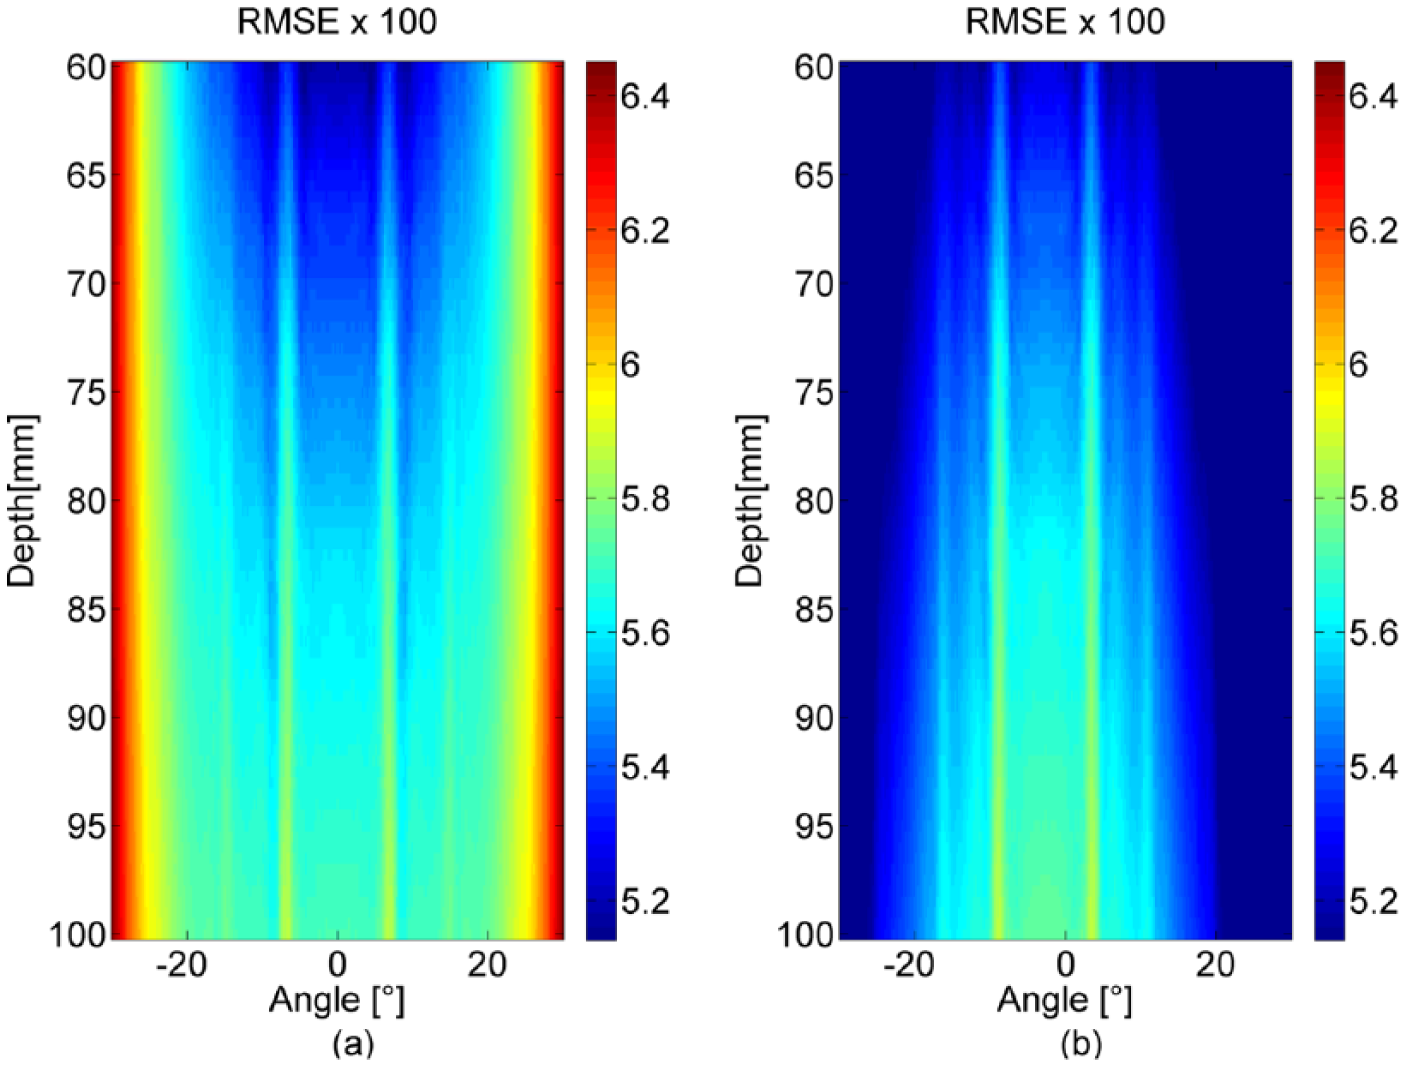
Presentation of 2D RMSE images obtained with Fourier transform in (a) and back-propagation in (b) separately, the parameters are
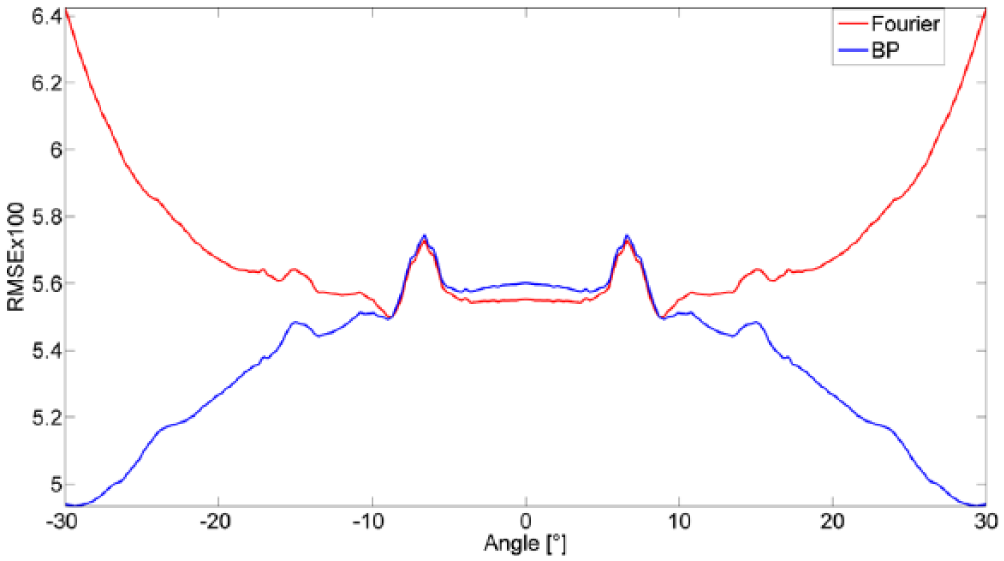
RMSE profiles corresponding to Figure 4 at depth of 80 mm. The RMSE profile associated with BP is plotted in blue, whereas the RMSE profile associated with Fourier is plotted in red. RMSE = root mean square error; BP = back-propagation.
Influence of the apodization parameters
In this section, we present the result of the study of the influence of the parameters driving the shape of the TO, that is, the lateral wavelength
Figure 6 displays the influence of
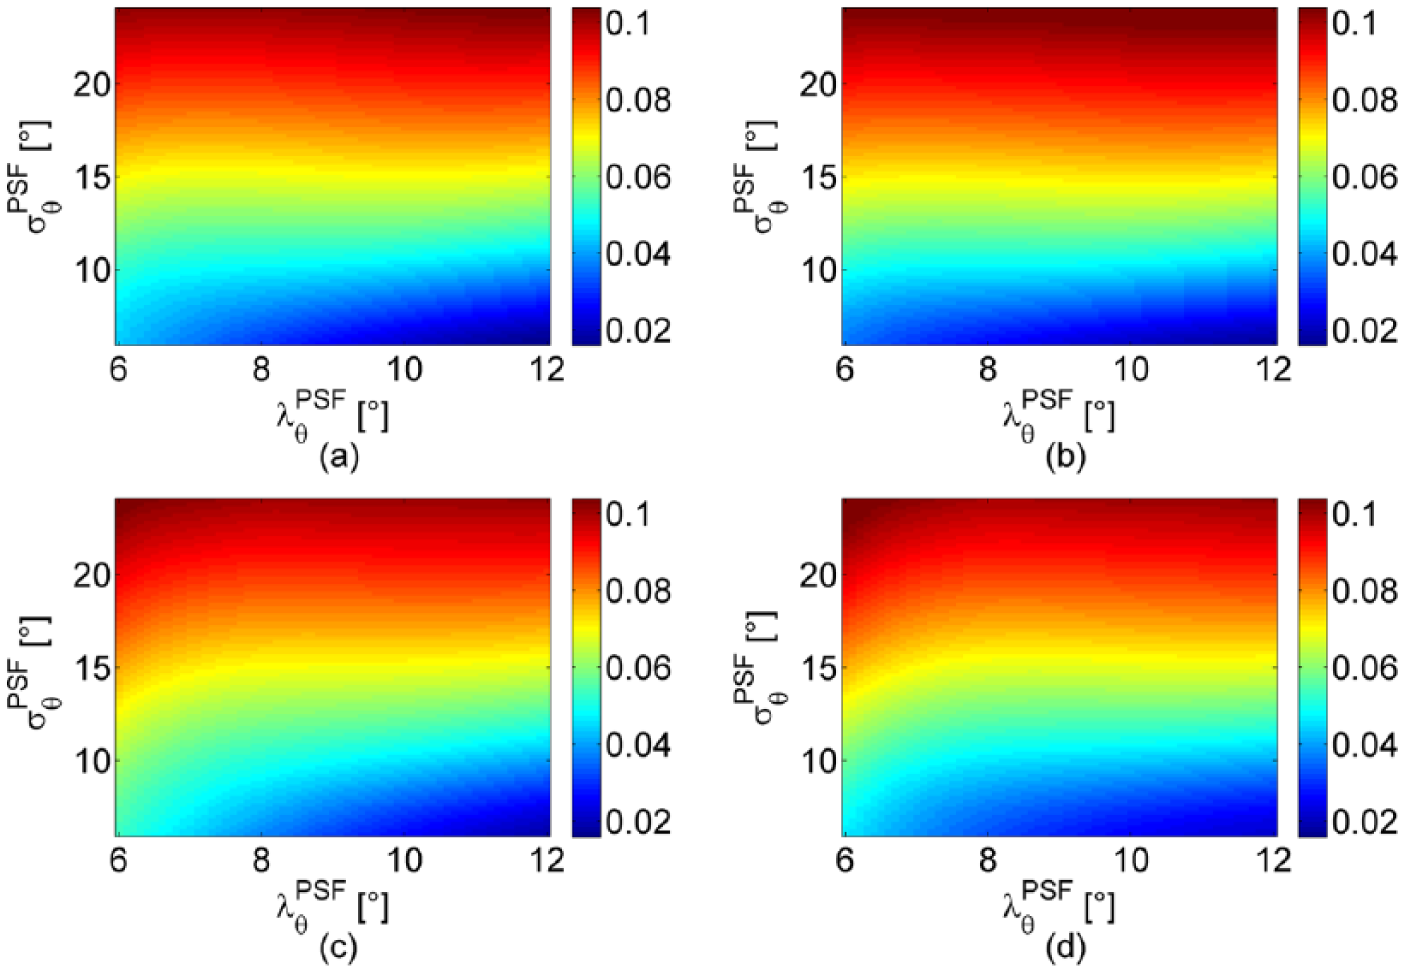
Presentation of RMSE obtained with different
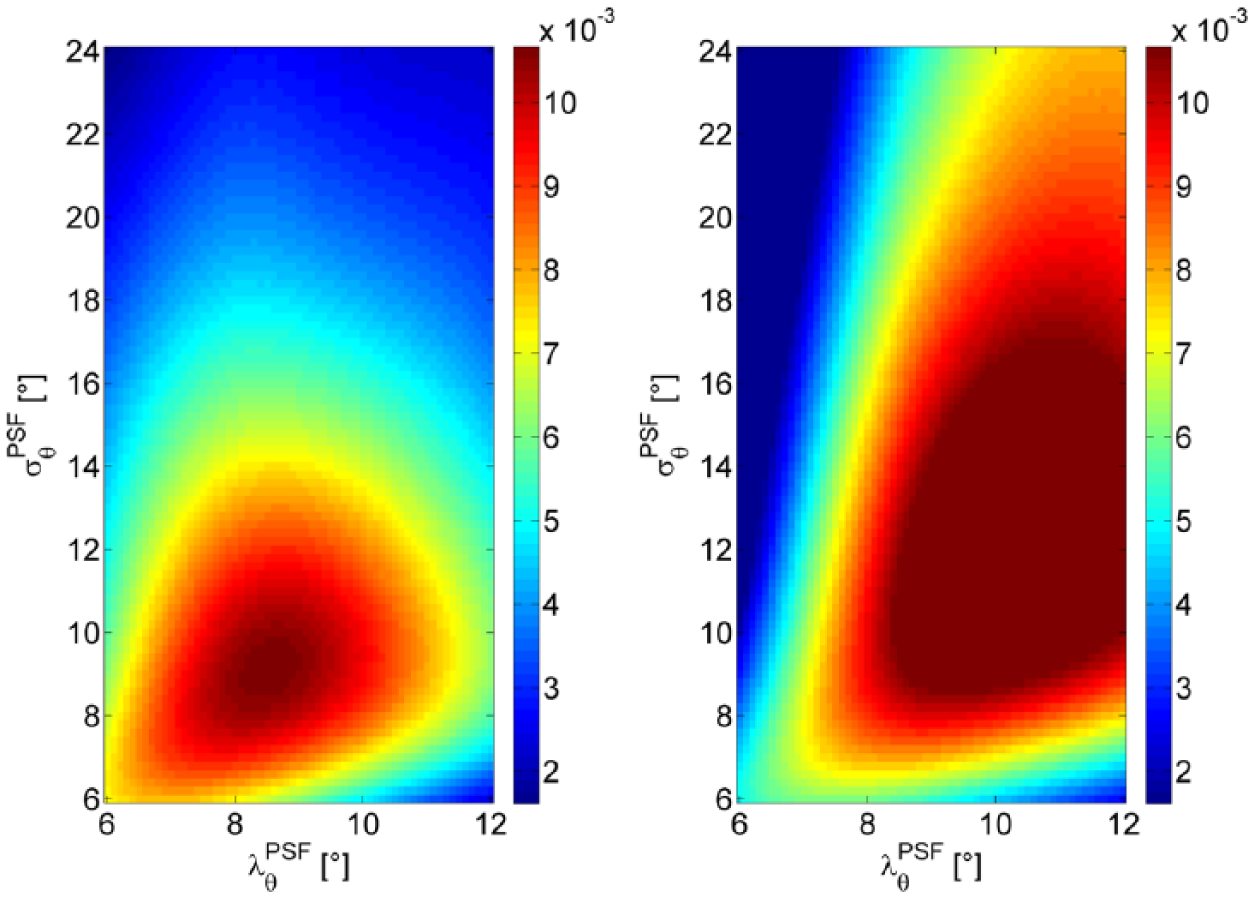
(a) Difference of RMSE obtained with BP and Fourier-based method on the central axis of the probe (i.e.,
Figure 7(a) corresponds to the difference obtained on the central axis of the probe (i.e.,
From these results, it may be inferred that BP-based beamforming should improve the estimation of lateral motion compared with Fourier-based beamforming. The next section investigates this question.
Motion Estimation
For each kind of motion, that is, lateral, axial, and diagonal, the motion estimation procedure described previously in the section “Motion Estimation” is applied to 100 different phantoms obtained by varying the scatterer random distributions. The results are then presented as
The mean value of the motion estimation (Figures 8-13) performed at points located on axis (
The mean value and standard deviation of the motion estimates at a depth of 80 mm for varying direction ranging from −30° to 30° relative to the probe central axis. They are presented in Figures 14, 15, and 16.
The spatial distribution of the motion estimation error, measured as RMSE between estimated and real motion, is plotted for a sector-shaped scanning region corresponding to a depth ranging from 60 to 100 mm and an angle ranging from −30° to 30° (Figures 17, 18, and 19).
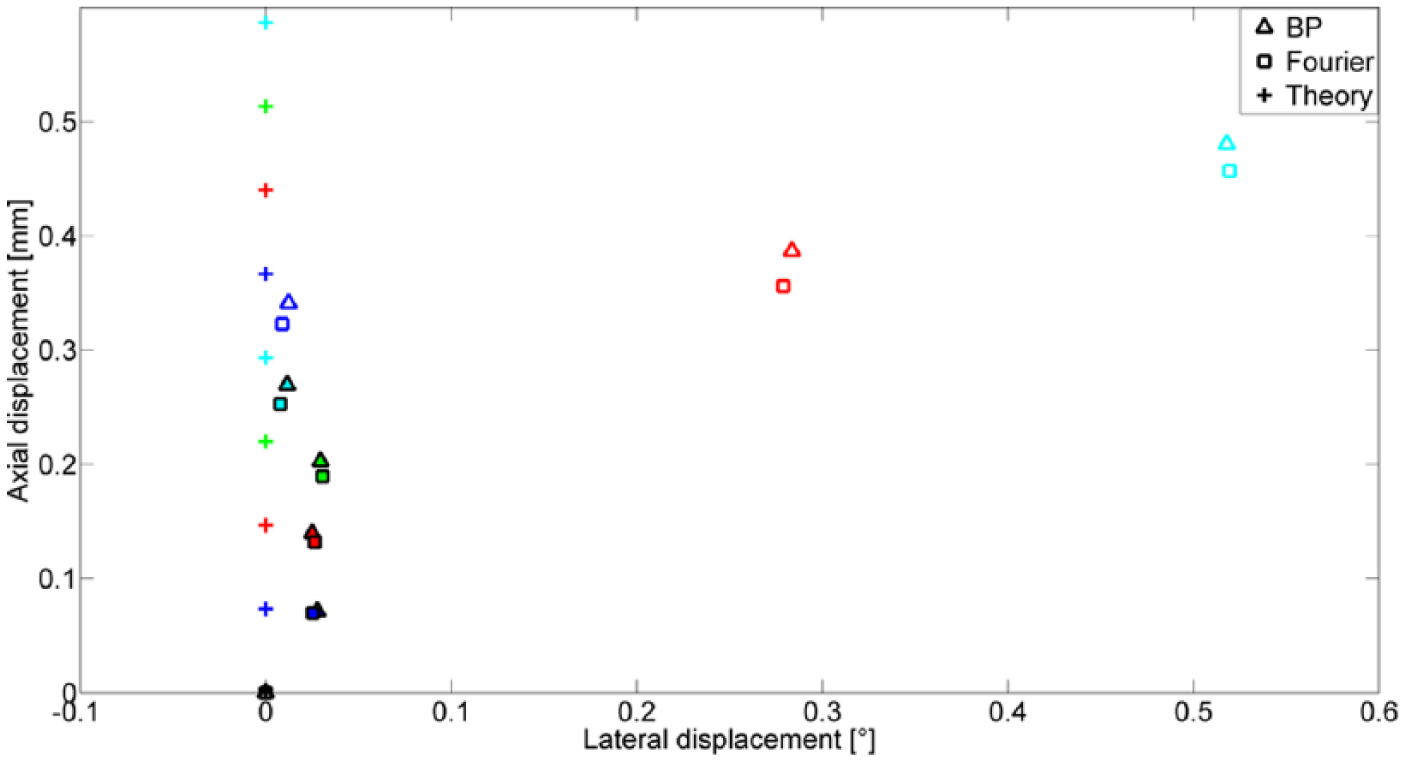
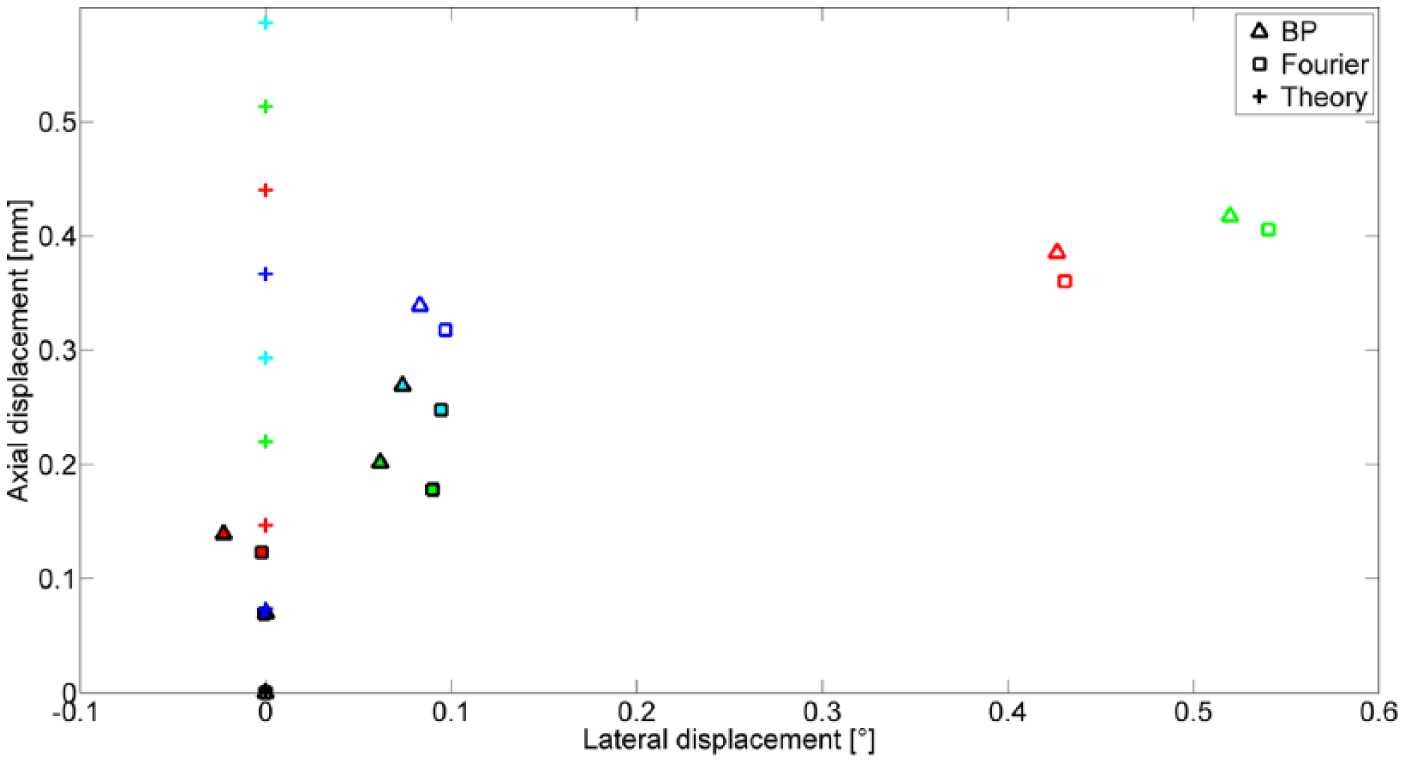
Estimation of lateral displacements. The motion was estimated using either Fourier-based (square) or BP-based (triangle) beamformed images and the results are compared with the true motion (crosses). Motion estimation was performed at points located on axis (
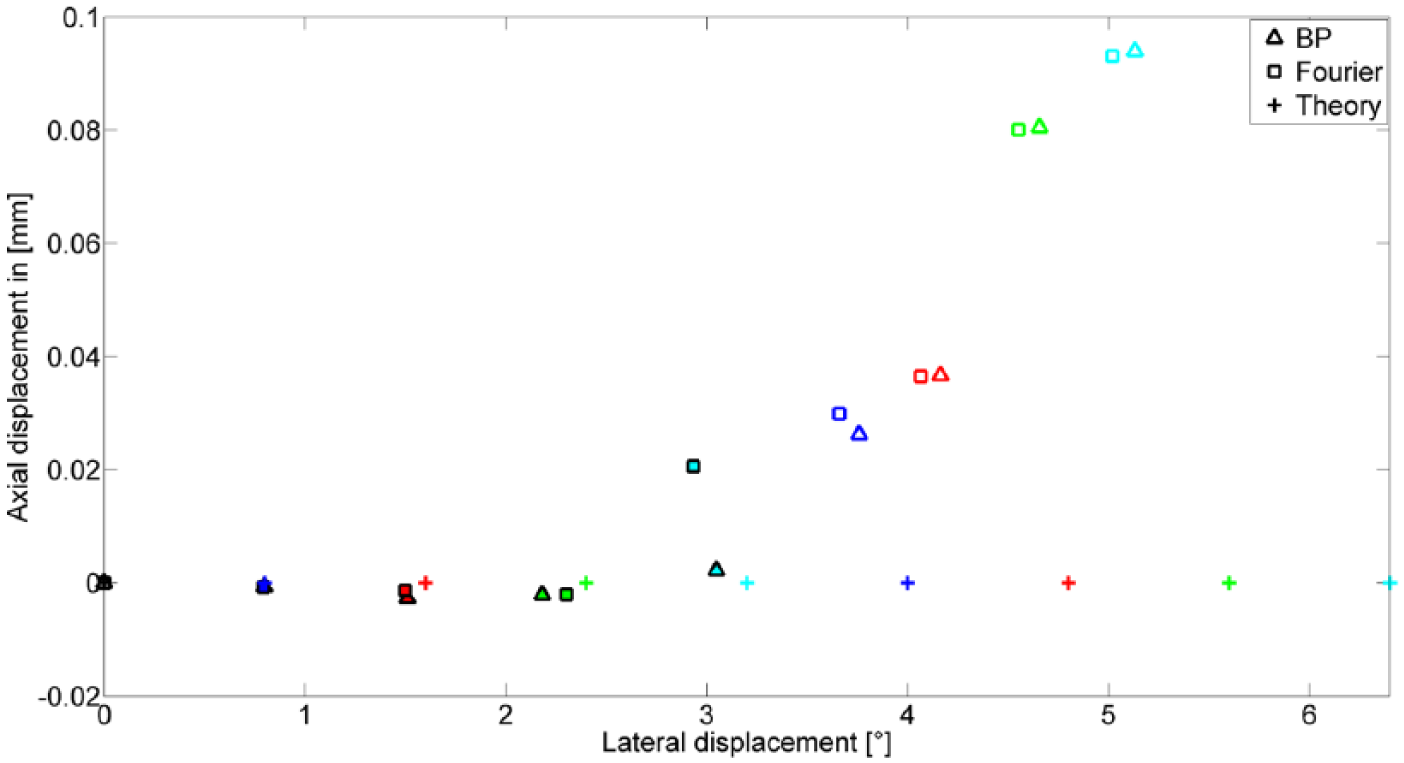
Estimation of axial displacements. The motion was estimated using either Fourier-based (square) or BP-based (triangle) beamformed images and the results are compared with the true motion (crosses). Motion estimation was performed at points located on axis (
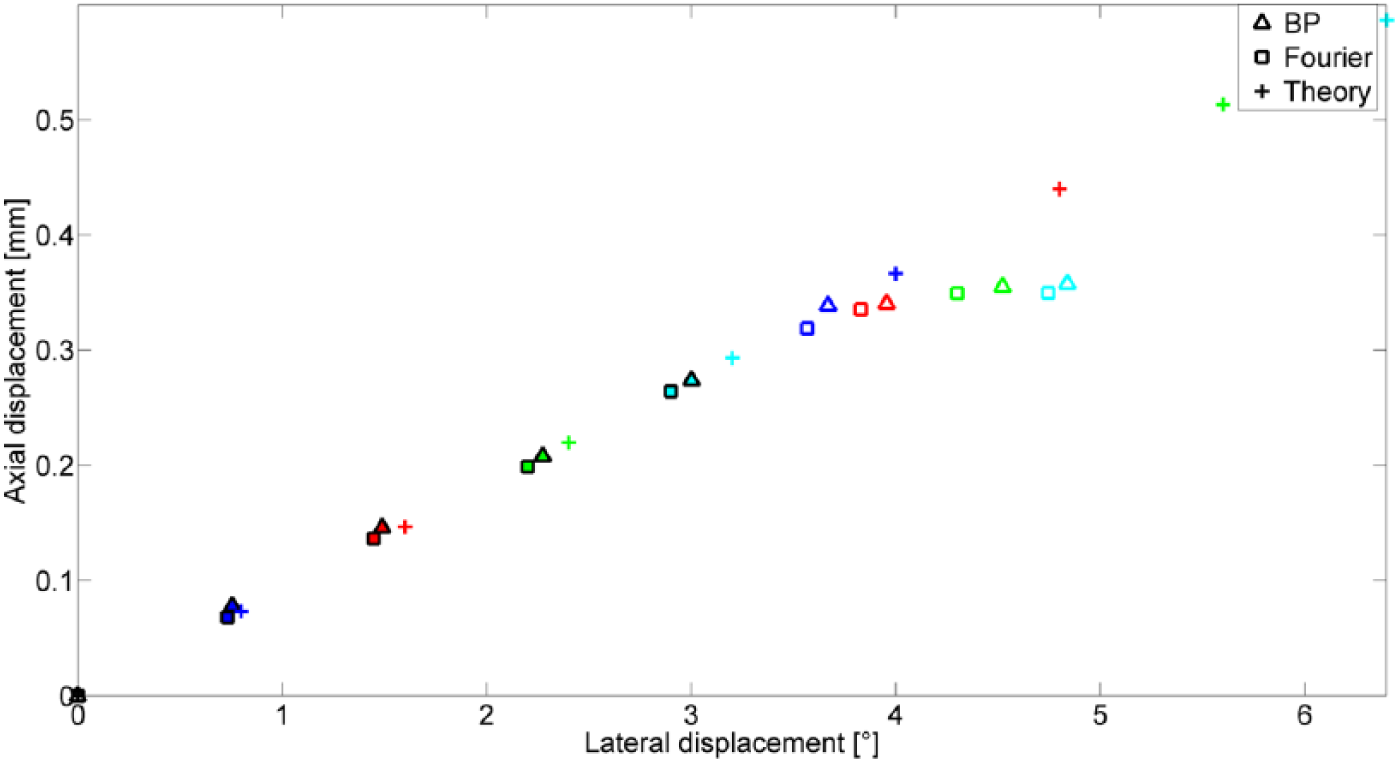
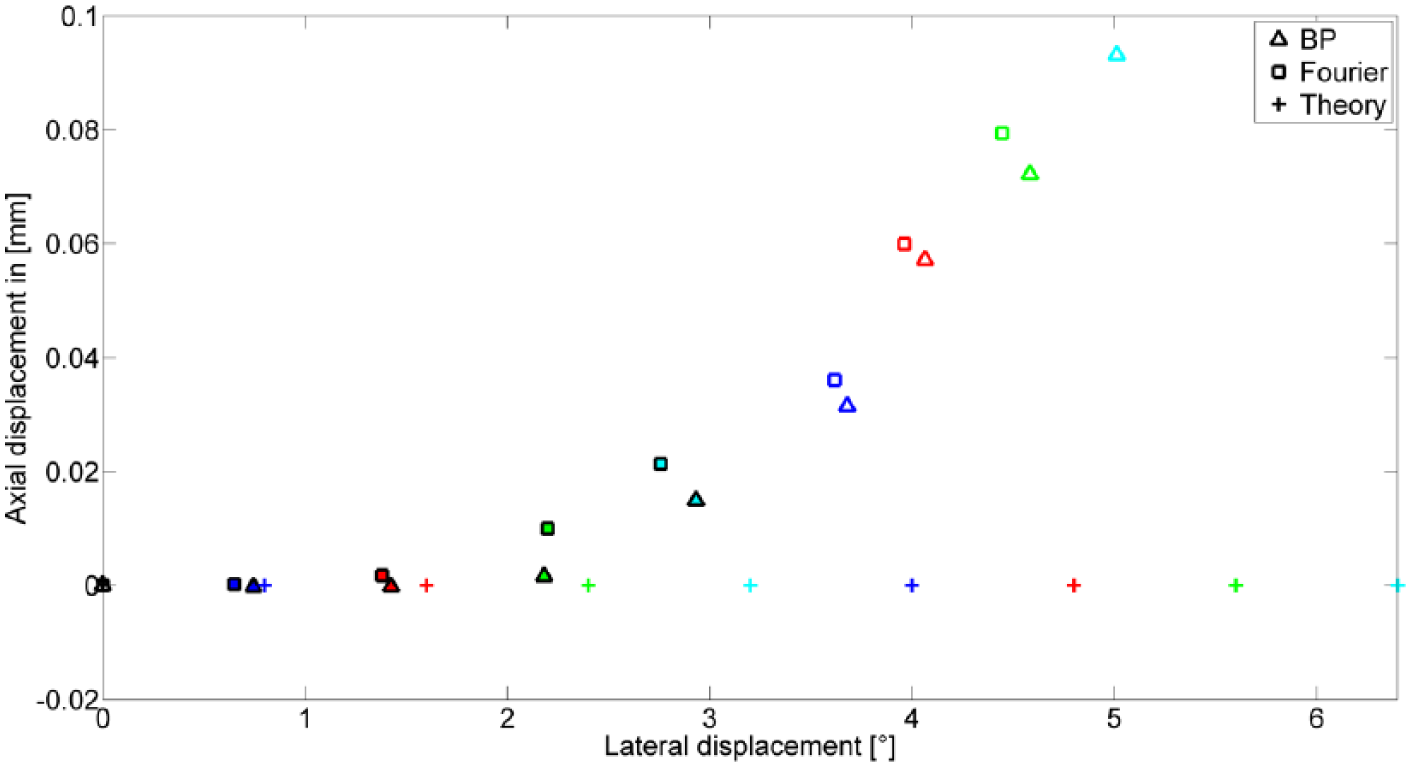
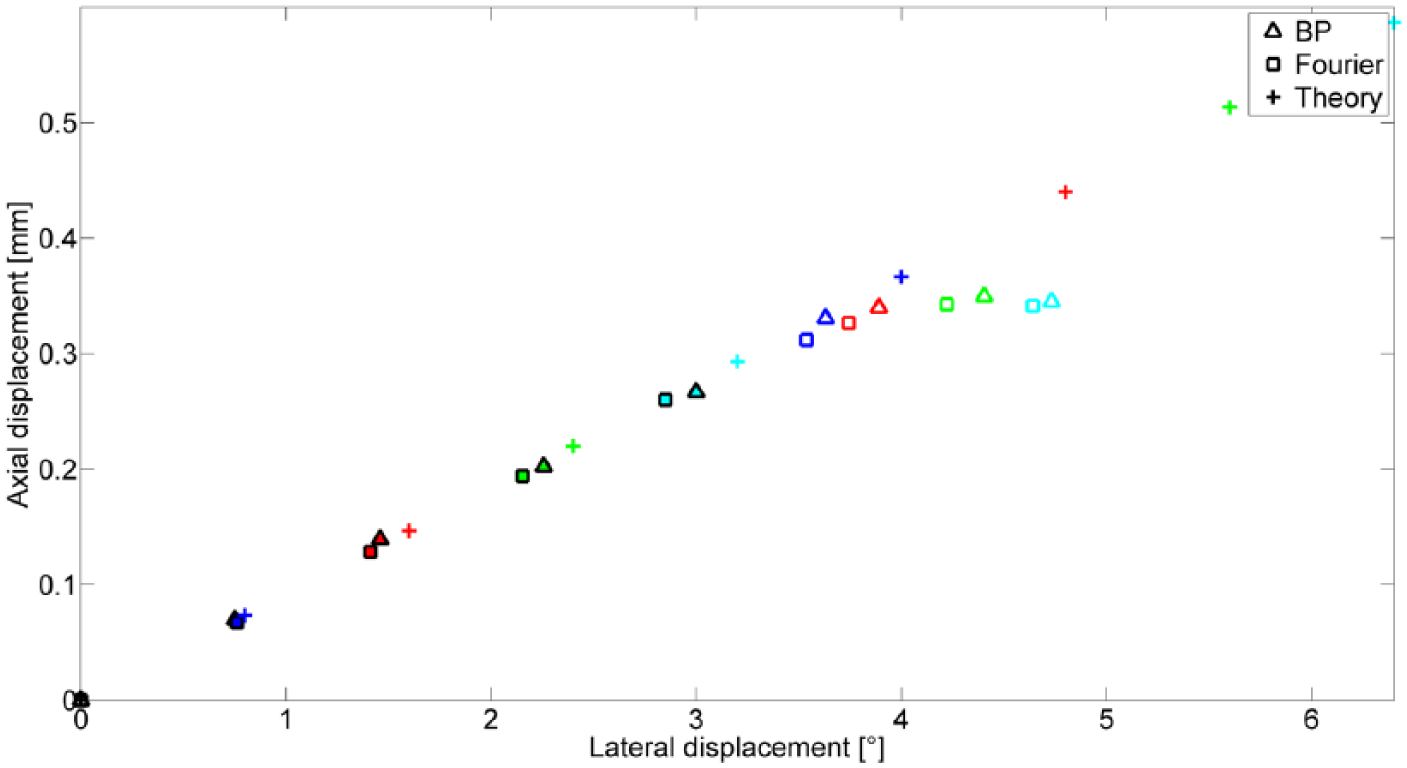
Estimation of diagonal displacements. The motion was estimated using either Fourier-based (square) or BP-based (triangle) beamformed images and the results are compared with the true motion (crosses). Motion estimation was performed at points located on axis (
Estimation of lateral displacements. The motion was estimated using either Fourier-based (square) or BP-based (triangle) beamformed images and the results are compared with the true motion (crosses). Motion estimation was performed at points located off axis (
Estimation of axial displacements. The motion was estimated using either Fourier-based (square) or BP-based (triangle) beamformed images and the results are compared with the true motion (crosses). Motion estimation was performed at points located off axis (
Estimation of diagonal displacements. The motion was estimated using either Fourier-based (square) or BP-based (triangle) beamformed images and the results are compared with the true motion (crosses). Motion estimation was performed at points located off axis (
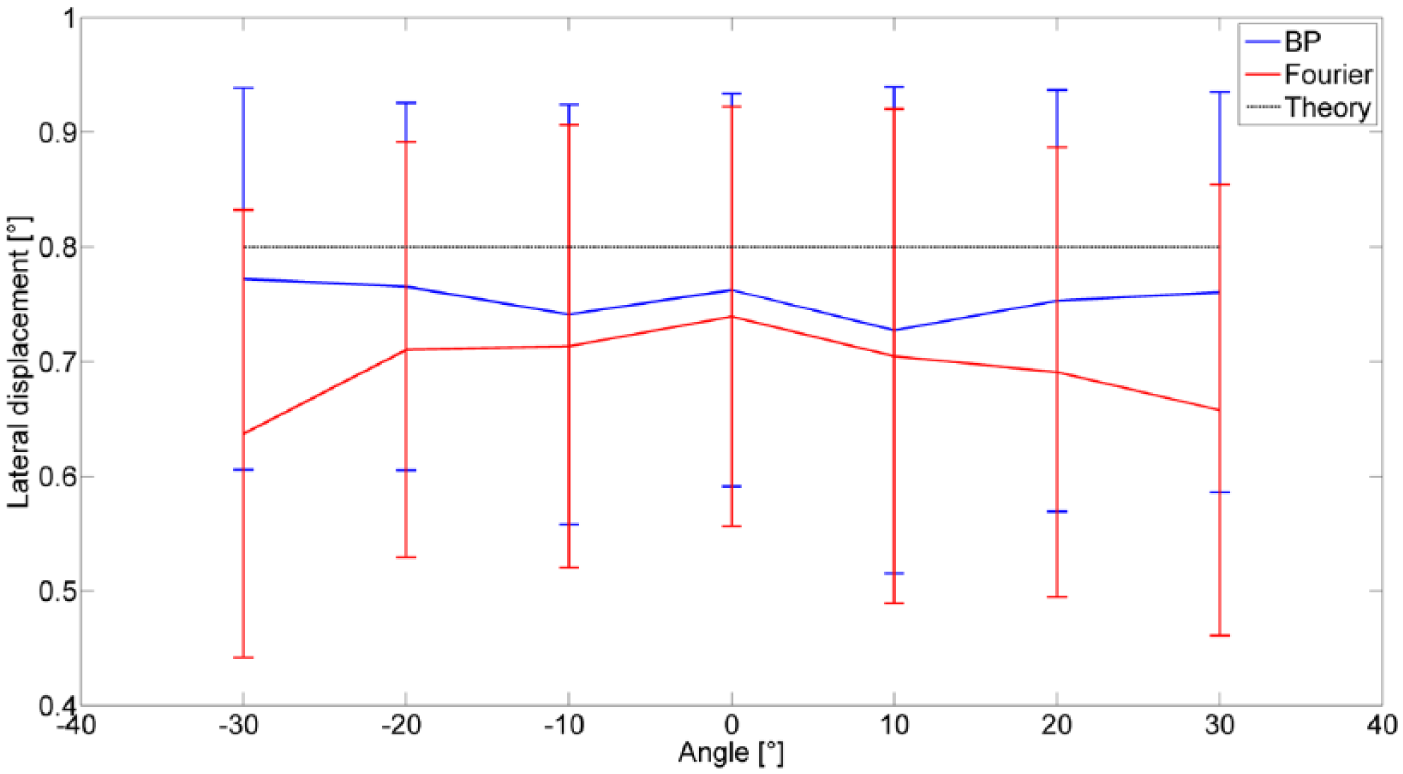
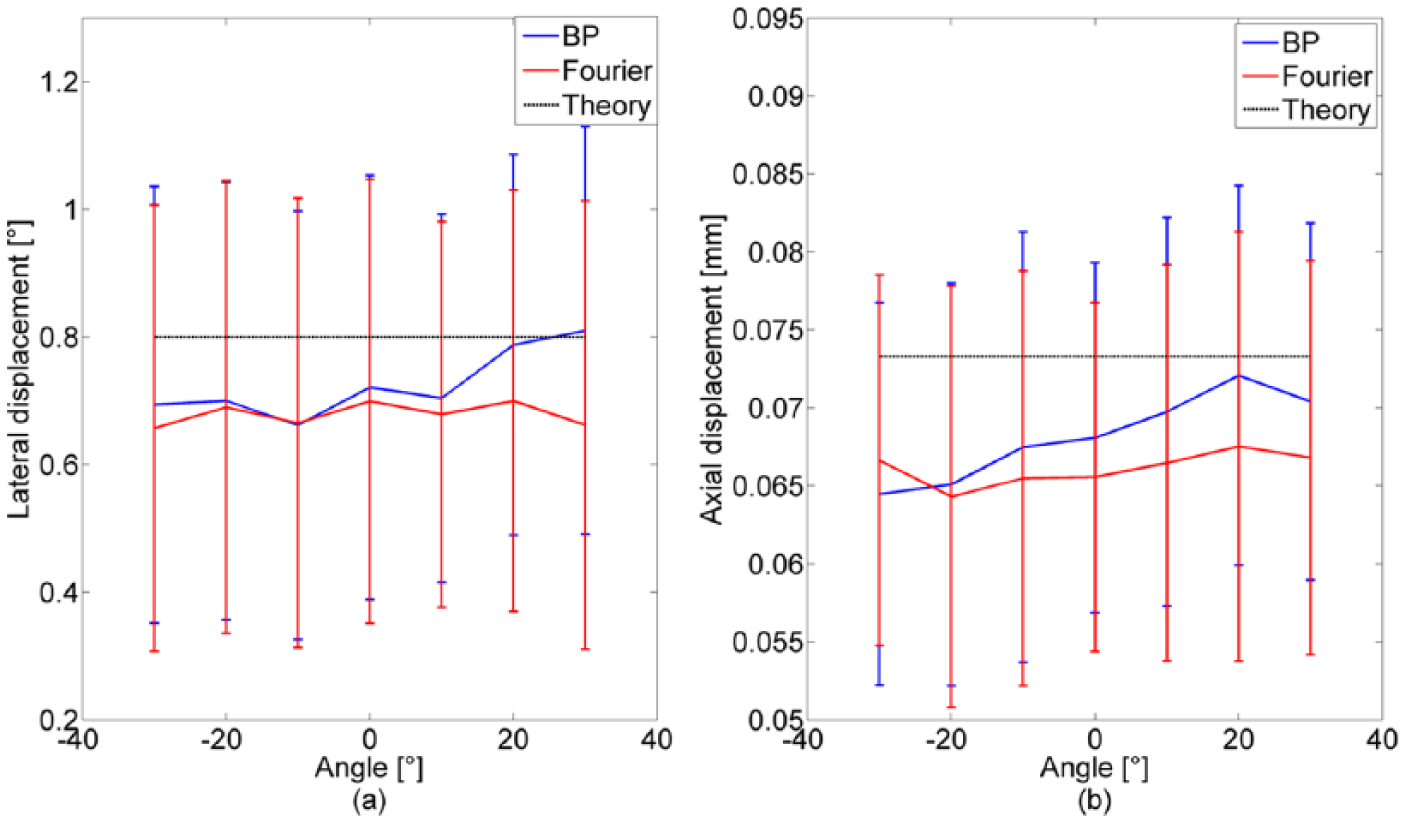
Presentations of the mean value and standard deviation of the motion estimates in the case of a pure lateral motion at a depth of 80 mm from −30° to 30°. The blue solid line corresponds to BP method, the red solid line corresponds to Fourier method, and the black dashed line demonstrates the theory mean value. BP = back-propagation.
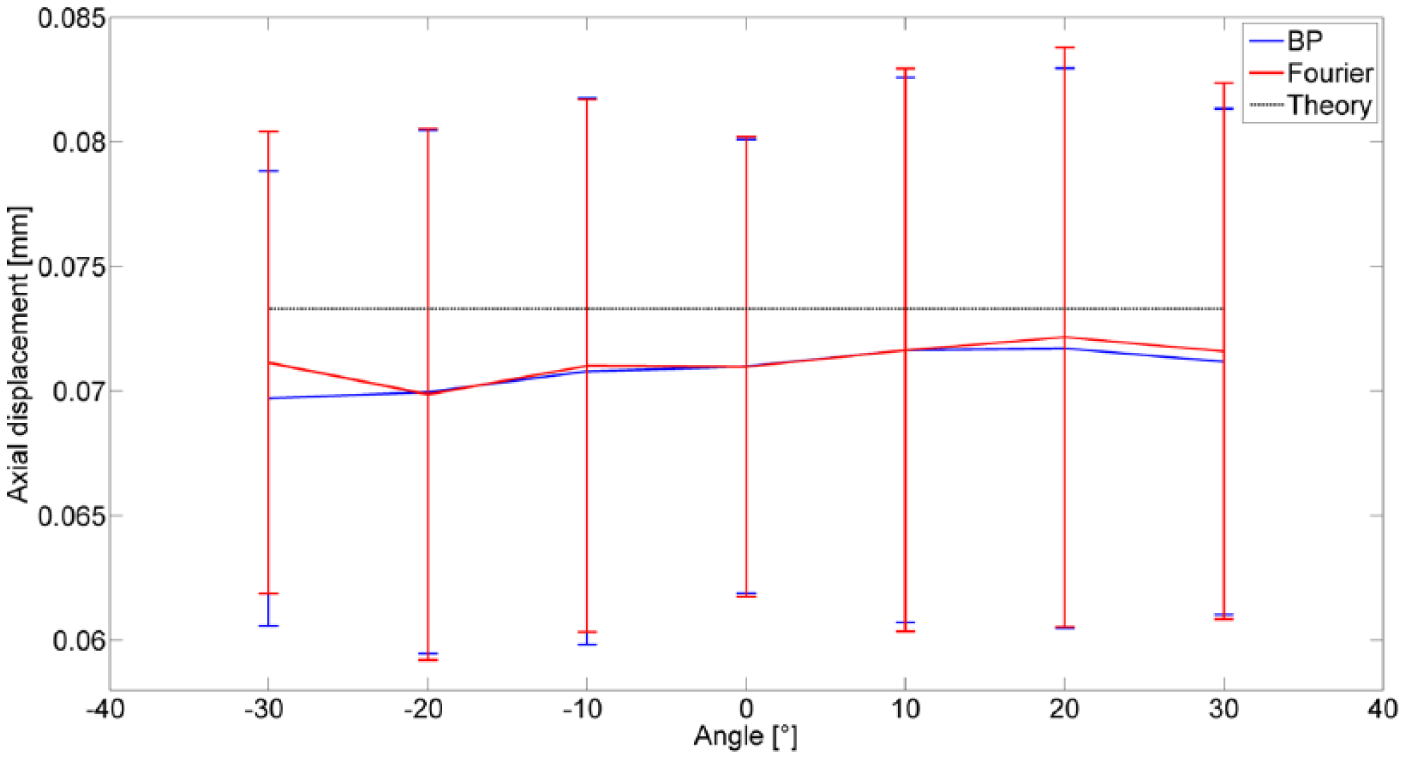
Presentations of the mean value and standard deviation of the motion estimates in the case of a pure axial motion at a depth of 80 mm from −30° to 30°. The blue solid line corresponds to BP method, the red solid line corresponds to Fourier method, and the black dashed line demonstrates the theory mean value. BP = back-propagation.
Presentations of the mean value and standard deviation of the motion estimates in the case of a diagonal motion at a depth of 80 mm from −30° to 30°. (a) shows the lateral motion estimates and (b) presents the axial motion estimates. The blue solid line corresponds to BP method, the red solid line corresponds to Fourier method, and the black dashed line demonstrates the theory mean value. BP = back-propagation.
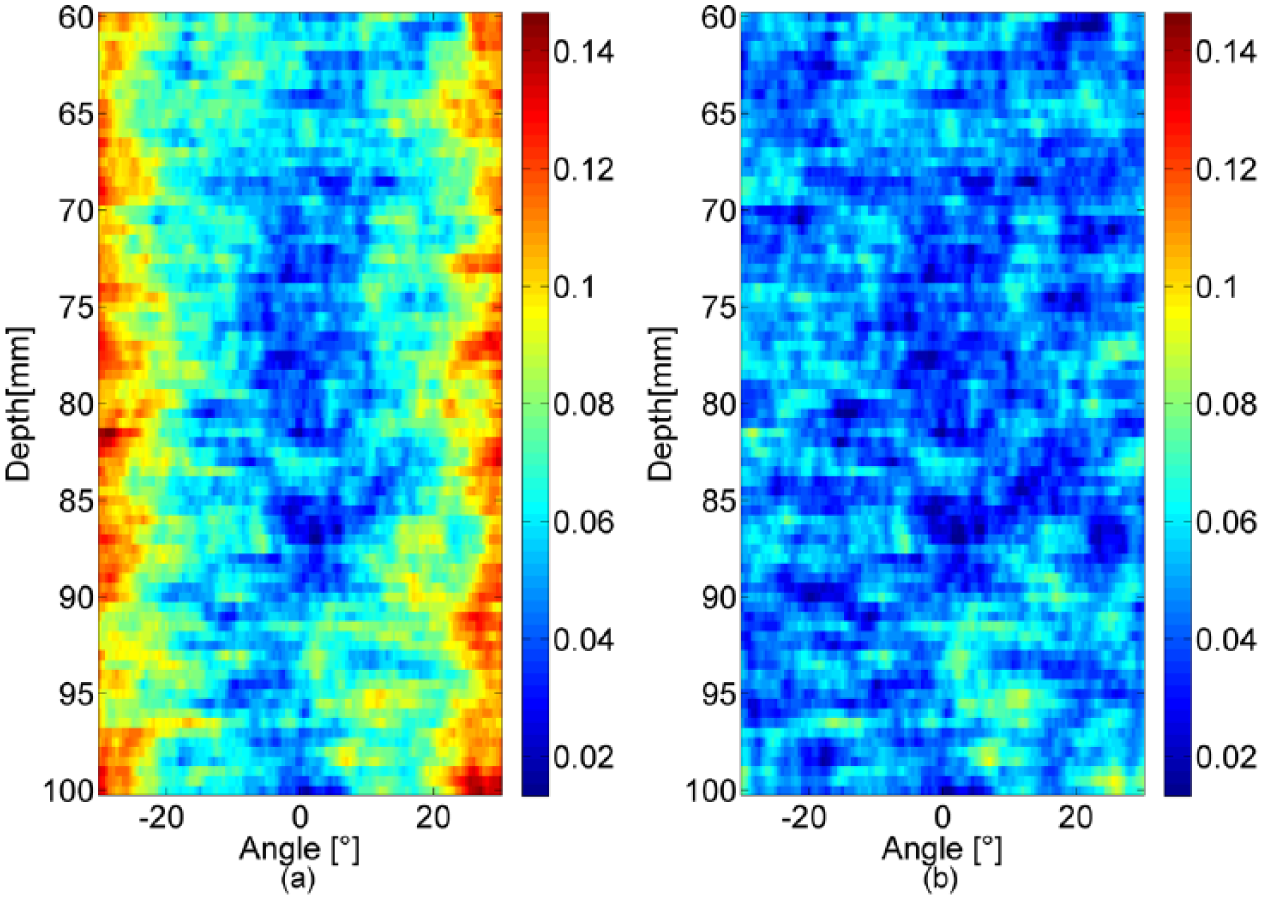
Presentation of estimated accuracy evaluated by RMSE for lateral motion estimation obtained for scatters located from the depth of 60 to 100 mm over the scanning sector from 30 to +30, using Fourier-based beamformed images in (a) and back-propagation in (b). The RMSE is presented by [º]. RMSE = root mean square error.
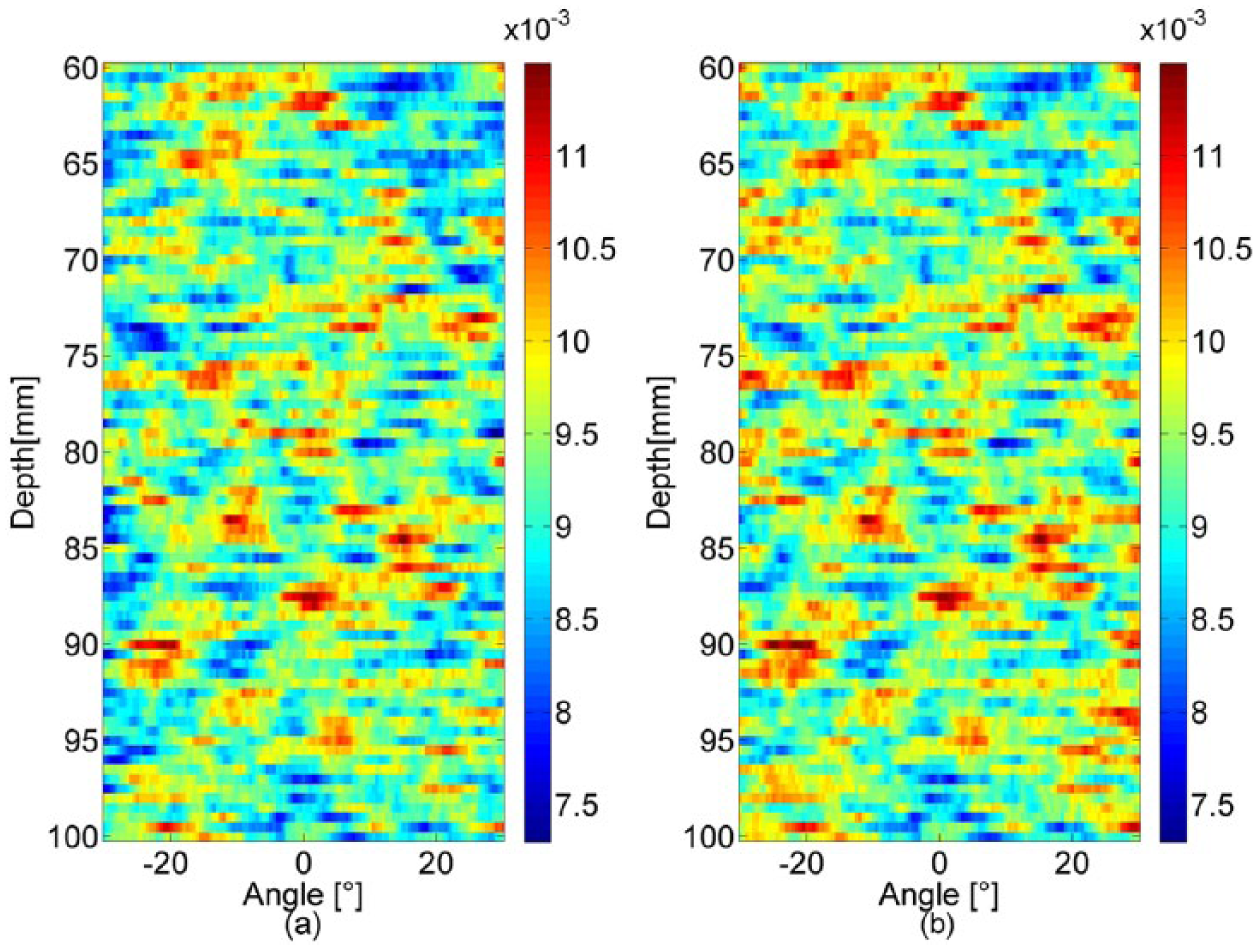
Presentation of estimated accuracy evaluated by RMSE for axial motion estimation obtained for scatters located from the depth of 60 to 100 mm over the scanning sector from −30° to +30°, using Fourier-based beamformed images in (a) and back-propagation in (b). The RMSE is presented by [mm]. RMSE = root mean square error.
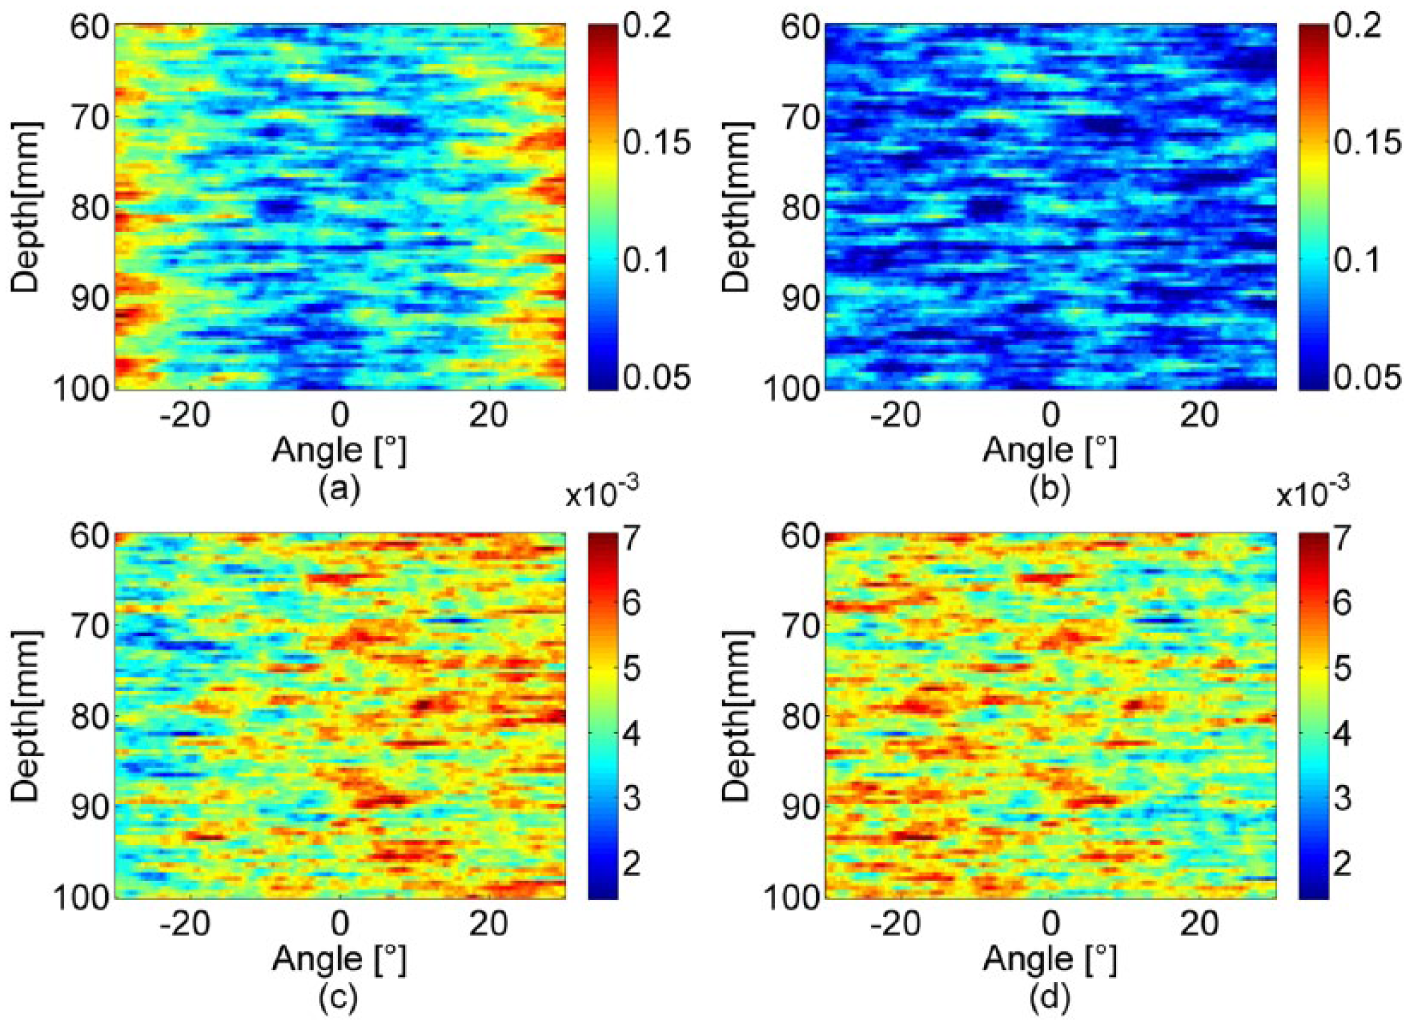
Presentation of estimated accuracy evaluated by RMSE for diagonal motion estimation for scatters located from the depth of 60 to 100 mm over the scanning sector from −30° to +30°: (a) and (b) show the magnitude in [°] of the transverse RMSE using Fourier-based beamformed images and back-propagation, respectively; (c) and (d) show the magnitude in [mm] of the axial RMSE using Fourier-based beamformed images and back-propagation, respectively. RMSE = root mean square error.
Figures 8 to 10 give the results of motion estimation performed at points located on axis (
Regarding pure transverse motion estimation off axis (Figure 11), BP-based beamforming demonstrates improvement in accuracy over Fourier-based beamforming, albeit not as much as when compared with on-axis transverse motion estimation (Figure 8). Results for axial motion estimated off axis (Figure 12) are similar to results on axis (Figure 9): BP-based beamforming shows only limited improvement over Fourier-based beamforming in terms of motion estimation accuracy. Here again, the results associated with diagonal motion correspond to an intermediate situation where BP performs better than Fourier in Figure 12. In line with the conclusion from Figures 8, 9, and 10, the estimated motion deviates a lot from the real motion when it becomes larger than half the signal wavelength (8° for the lateral wavelength and 0.73 mm for the axial wavelength), thus confirming that the maximum displacement that the method can handle is the half wavelength of the signals.
Figures 14, 15, and 16, show the mean value and standard deviation of the motion estimates at a depth of 80 mm for varying angles ranging from −30° to 30° relative to the probe central axis. Figure 14 is given for the estimation of a pure lateral motion using Fourier and BP-based beamformers, respectively. Note that the better value of RMSE observed for BP mainly comes from the smaller mean error associated to BP. Indeed the standard deviation found for both methods are very close. However, Fourier and BP-based beamforming provide very close mean value and standard deviation for pure axial motion as presented in Figure 15; Figure 16 gives the result for diagonal motion and yields the same conclusions as in Figure 14 for the lateral component estimation and in Figure 15 for the axial component estimation.
Figures 17, 18, and 19 illustrate the spatial distribution of the motion estimation error for three types of motion: a transverse motion with magnitude 0.8°, an axial motion with magnitude 0.07 mm, and a combined motion with the same magnitudes as above. For each point in the phantom, the accuracy is quantified as the root mean square of the magnitude of the error vector over the 100 experiments (RMSE).
Figure 17 displays the results obtained in the case of transverse motion. Figure 17(a) shows that the RMSE associated with Fourier-based beamforming is relatively stable along the propagation direction and increases with the scanning angle to reach a maximum in the lateral regions of the sector. However, the RMSE associated with BP is fairly stable. Moreover, it is smaller than the RMSE obtained for Fourier-based beamforming, except around the direction corresponding to the probe axis (
Figure 18 displays the results obtained in the case of axial motion. In contrast to the results obtained for transverse motion, it can be observed that the two beamforming methods yield very similar RMSEs. The mean RMSE values are 9.4 × 10⁻³ mm and 9.3 × 10⁻³ mm for Fourier-based beamforming and BP, respectively.
Figure 19 displays the results obtained in the case of a diagonal motion. Figure 19(a) and (b) shows the magnitude of the transverse RMSE using Fourier-based beamformed images and BP, respectively. Figure 19(c) and (d) shows the corresponding axial RMSE. These results yield the very similar conclusions as in Figures 17 and 18. Indeed, Figure 19(a) and (b) shows that the transverse RMSE associated with Fourier-based beamforming increases with the scanning angle, whereas the RMSE associated with BP is more stable and smaller. Concerning the axial RMSE, Figure 19(c) and (d) indicates that both methods yield very close accuracy values. The mean transverse RMSEs are 0.11° and 0.08° for Fourier-based beamforming and BP, respectively; thus BP contributes an average improvement of 27.3% over Fourier-based beamforming.
To see if the differences are statistically significant, Table 2 presents the t test for the estimated results which are obtained at the center and off axis of image. In this table, the value 1 indicates a rejection of the null hypothesis at the 5% significance level, which means they have significant difference, and on the contrary the value 0 indicates a failure to reject the null hypothesis. From Table 2, we may observe that there is no significant difference concerning the estimates of the axial motion component. The situation for the transverse component is the following:
In the center of the image, there is no significant difference.
On the contrary, off axis of the image, the difference is significant.
T Test Result of Estimated Motion Accuracy.

ROI = region of interest.
These findings clearly show that BP beamforming improves the accuracy for the transverse motion estimates off axis of the image.
Simulated Cardiac Motion
The realistic cardiac simulation motion has maximum lateral amplitude of 1.5°. In the axial direction, most points have a magnitude of motion below 0.36 mm, with a few outliers reaching a maximum magnitude of 0.6 mm. As the phase-based estimator can accurately estimate motion within 4° laterally and 0.36 mm axially, the motion of the realistic cardiac simulation falls within the limits of the estimator.
Figure 20 presents the displacement errors in degree for lateral estimation and in mm for axial estimation. The blue plot corresponds to BP-based beamformer and the black plot to the Fourier-based beamformer. Figure 20 illustrates the mean error values for each frame of the synthetic sequence for the lateral error (a) and the axial error (b), which shows that BP-based beamformer provides lower lateral error than that of Fourier. However, the two methods give the same results for axial error. Figure 21 reports the corresponding standard deviations. It shows that BP-based beamformer presents lower standard deviation for lateral errors in degree and similar axial errors in [mm].
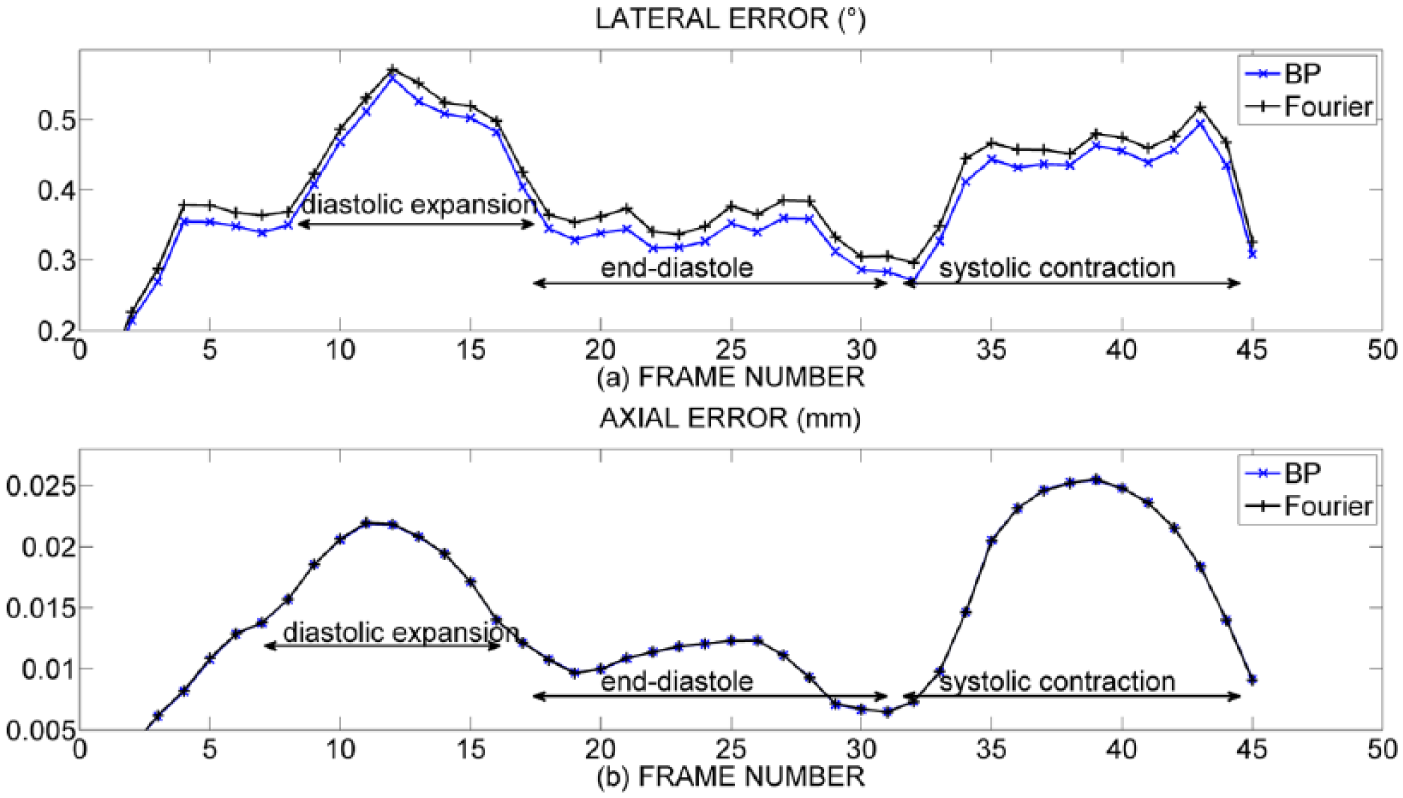
Displacement errors on pre-scan converted data for the short-axis sequence. (a) and (b) illustrate the mean values for each frame of the synthetic sequence for the lateral error in degree and the axial error in [mm], respectively. The blue square line is acquired under BP-based beamformer and the black square line under the Fourier-based beamformer. BP = back-propagation.
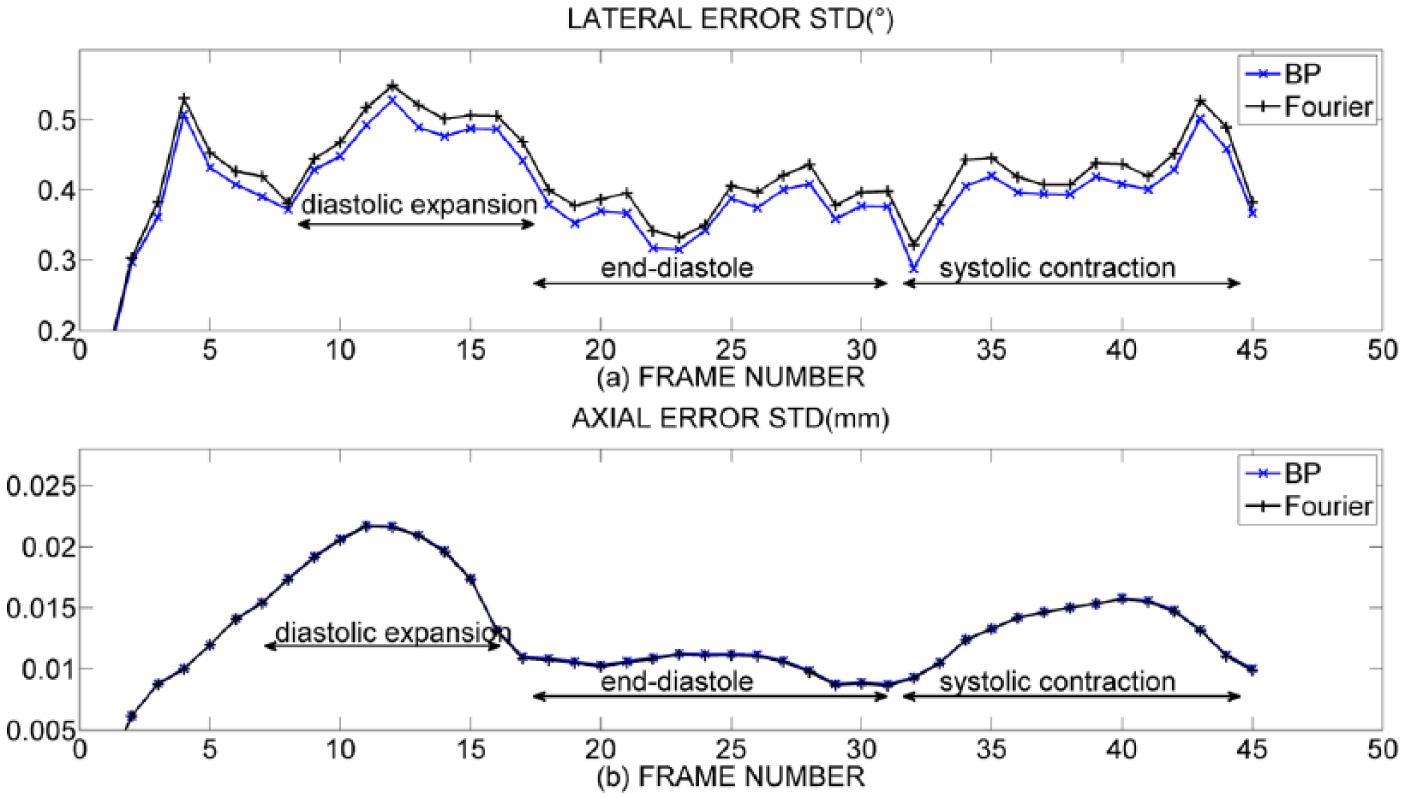
Presentation of the corresponding standard deviations to Figure 20. (a) and (b) demonstrate the standard deviation for each frame of the synthetic sequence for the lateral error in degree and the axial error (in mm), respectively. The blue square line is acquired under BP-based beamformer and the black square line under the Fourier-based beamformer. BP = back-propagation.
In particular, with respect to Figures 20 and 21, frames 7 to 18 correspond to diastolic expansion, frames 19 to 31 to end-diastole while frames 32 to 45 to systolic contraction. As an example, the estimation results during systolic contraction and diastolic expansion on the short-axis sequence are reported in Figure 22. These results show that the estimated displacements are qualitatively consistent with the physiological motion expected on a healthy heart in those two phases of the cardiac cycle.
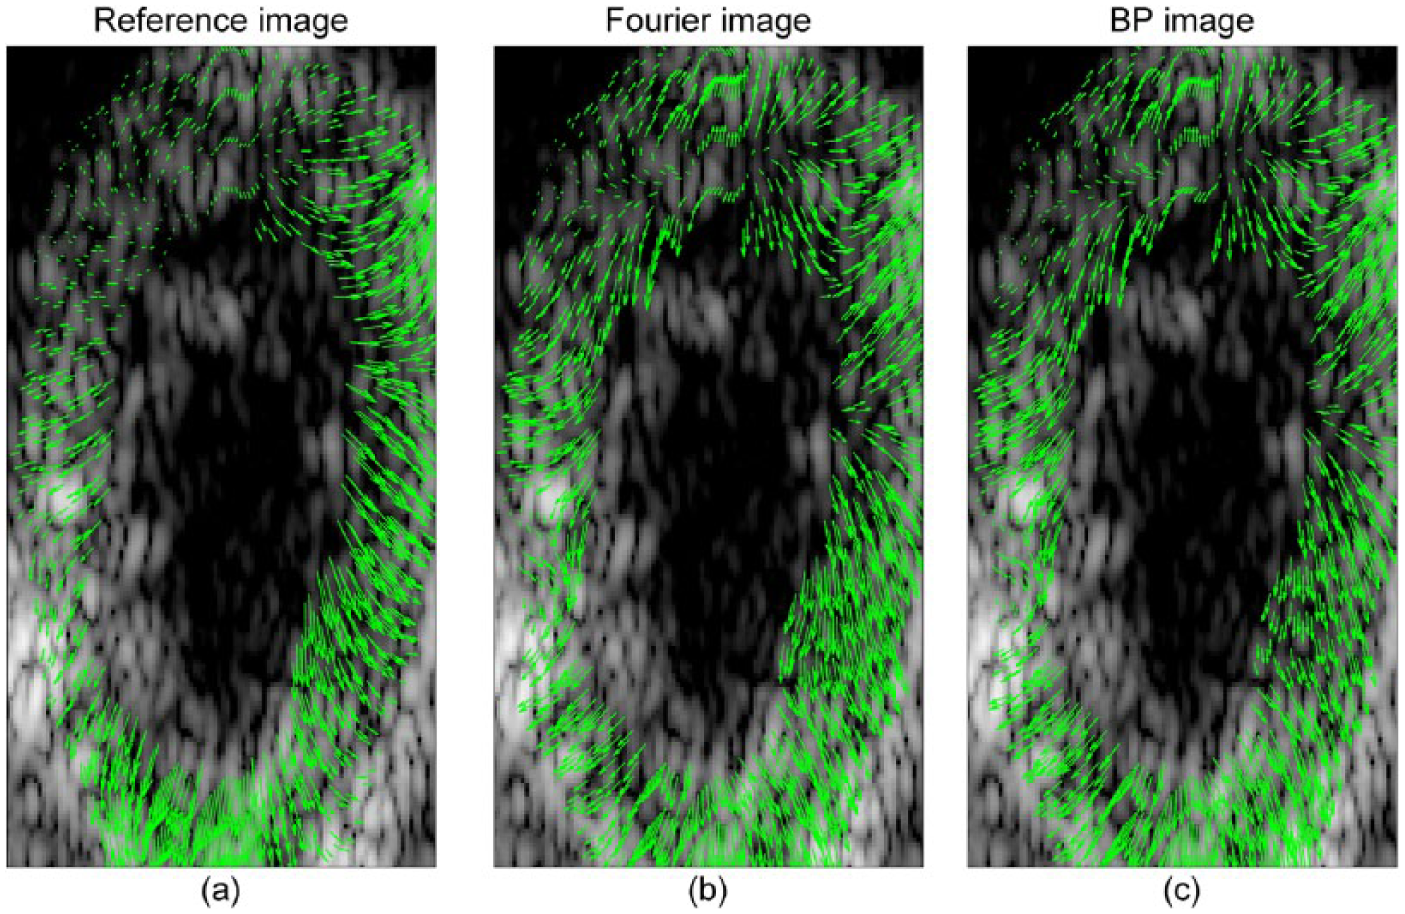
Example of estimated motion fields on one diastolic frame of the short-axis sequence. (a) presents the reference motion, (b) and (c) the motion estimated using Fourier and BP beamformer design. BP = back-propagation.
Experimental Results
To extend this study we have performed a simple experimental study. It consisted in acquiring and beamforming data from a wire and forming experimental PSF. BP-based TO-beamforming method was compared with the Fourier-based technique. The experiments were conducted by using the ultrasound acquisition equipment named ULA-Op,
42
in which we have imported the proposed apodization. The wire was imaged with 0° and 30°, where
Figure 23(a) and (d) presents theoretical PSFs for scatterers located on axis (0°) in (a) and off axis (30°) in (d) of the probe. Both scatterers are located at the depth of 80 mm, as in the simulation results for motion estimation from Figures 8 to 13. Figure 23(b) and (c) shows the PSF obtained on the central axis of the probe using Fourier-based beamforming and BP-based beamforming, respectively. The associated RMSEs are 0.0734 for Fourier-based beamforming and 0.0783 for BP-based beamforming: they thus yield very close results. Figure 23(e) and (f) corresponds to a RMSE of 0.0727 for Fourier transform and 0.0675 for BP, showing that BP-based beamforming improves 7.15% over Fourier-based beamforming. Figure 23(e) and (f) show in particular that this improvement mainly corresponds to the side lobes of the PSF, which are better defined in the case of BP-based beamforming.
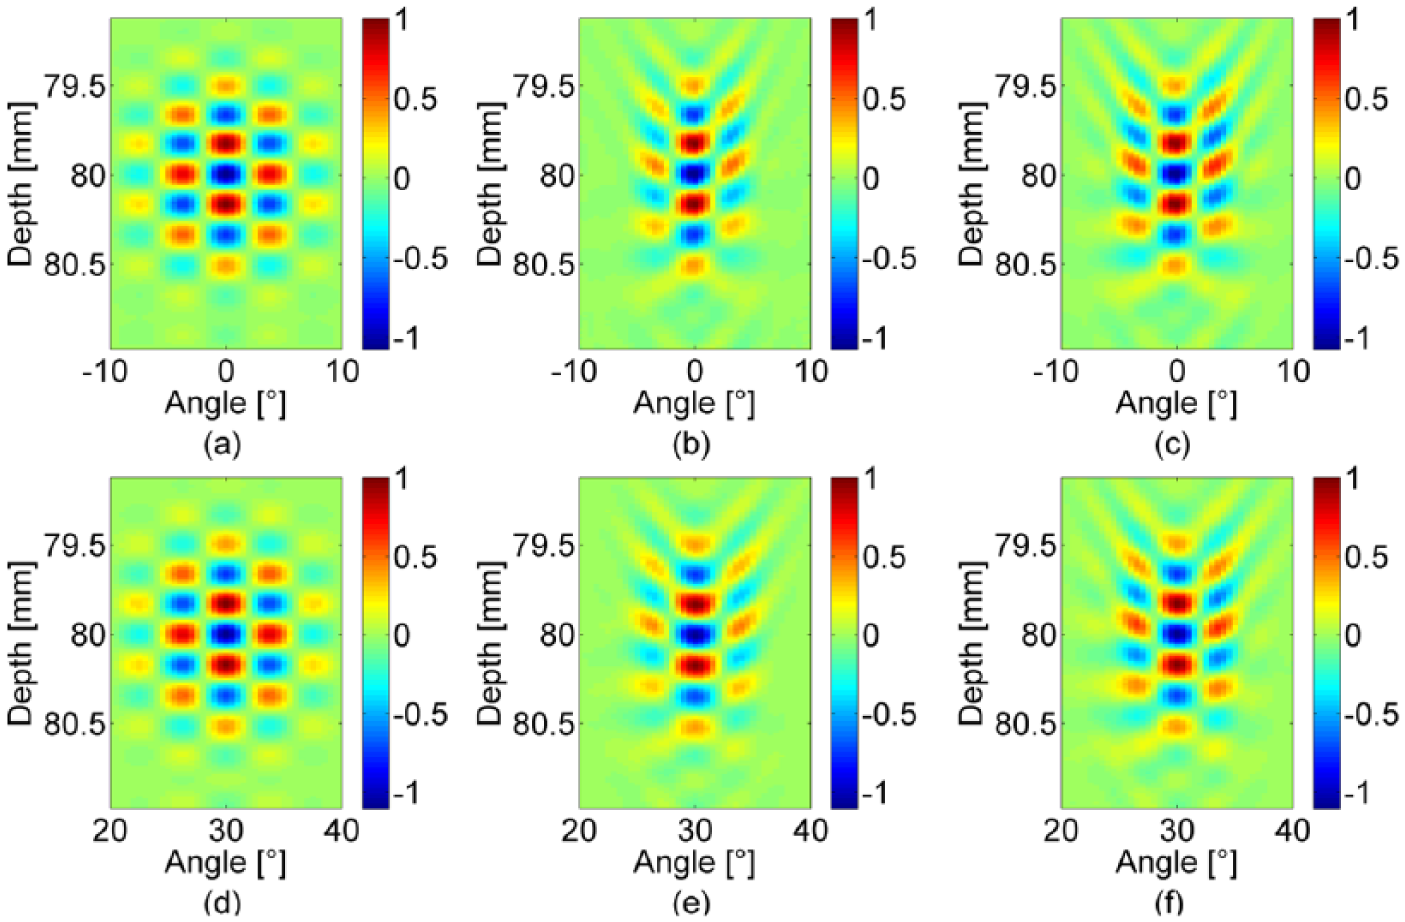
Presentation of the theoretical PSF on axis (0°) of the probe in (a) and the corresponding experimented PSF obtained under the Fourier relation in (b) and BP in (c); (d) is the theoretical PSF off axis (30°) of the probe and the corresponding simulated PSF obtained under the Fourier relation in (e) and BP in (f). PSF = point spread function.
Discussion and Conclusion
In this paper, we focused on a beamformer designed to improve the formation of PSF with TOs in the specific case of sector-shaped geometry, to improve motion estimation. We proposed a beamforming method based on BP and compared it with the classical Fourier-based beamforming method. As presented above, the proposed BP-based beamforming has advantages over Fourier-based beamforming, both for PSF accuracy and motion estimation.
The accuracy of simulated PSFs was measured by the RMSE for scatterers located in the scanning range of −30° to 30° at the depth along the beam axis from 60 mm to 100 mm. The results showed that BP-based beamforming yields lower RMSEs than Fourier-based beamforming, particularly for large scanning angles. This finding has also been validated for different values of the PSF parameters (
For motion estimation, we observed that the accuracy was similar for both methods for axial motion and that BP-based beamforming yielded better accuracy than Fourier-based beamforming for transverse and diagonal motions. The improvement brought by BP-based beamforming was observed to be greater for the scanning region located off axis of the probe. Note that in this paper, the range was set to −30° to 30° whereas in many situations, it goes from −45° to 45°. As shown in Figures 4 and 5, the BP gives lower RMSE at higher angles as compared with Fourier relation. As a consequence, we can expect the BP technique also to perform better at this higher angle values.
Finally, the proposed framework was also evaluated from realistic echocardiographic sequences by determining the average displacement error and standard deviation for each frame. The obtained results indicate that BP-based beamforming improve motion estimation accuracy as compared with Fourier-based beamforming method.
To extend this study, we have performed a simple experimental study. It consisted in acquiring and beamforming data from a wire and forming experimental PSF. The PSF obtained in a real experimental setting confirms that the proposed BP beamformer design is technically feasible. The results further validated that BP-based beamforming yields a more accurate PSF than Fourier-based beamforming off axis of the probe. These first results will be confirmed in future more in deep experimental studies including motion accuracy assessments.
The proposed study has however some limitations. First of all, it is important to underline that the use of unfocused waves may decrease the signal to noise ratio (SNR). In our proposed TO image formation technique for echocardiography, steered plane waves are transmitted. A more in-depth study of the influence of noise on both BP-based and Fourier-based beamforming should be performed.
Second, the proposed approach tries to compensate the limitations of TO techniques in sector-shaped geometry directly at the beamforming stage. The estimation bias due to a poor matching between expected and obtained PSF could also be compensated for by scaling the estimates based on the actual mean spatial frequency of the PSF. One option could be to estimate the mean spatial frequency, to be able to compensate its variation. A comparison with such an approach could be interesting, especially because post-processing might be easier to implement than the angle-dependent beamformer we have proposed.
Finally, more generally, phase-based motion estimation techniques are extremely precise but limited to “small” displacements. However, in conventional imaging strategies, inter-frame displacements of several millimeters can occur and the unique use of phase-based techniques would fail in estimating such important displacements. It should however be noted that estimating larger motion can nevertheless be easily performed using two different strategies:
The large-scale component of the motion can be estimated in a first step using block-matching techniques and our method can be then used to refine the estimates. 22
The rapidly developing ultrafast acquisition techniques will considerably decrease the magnitude of the motion to be estimated, making the proposed method directly applicable (thus making the above mentioned pre-processing step unnecessary).
To conclude, this paper shows that TO techniques are compatible with the specific geometry used in echocardiography and that some of the limitations due to this particular geometry can be overcome thanks to the proposed BP-based beamformer. To make this technique feasible in vivo, as underlined in the discussion above, different studies still need to be performed.
Footnotes
Acknowledgements
The authors would like to thank Dr. Martino Alessandrini for his help in the simulations.
Declaration of Conflicting Interests
The author(s) declared no potential conflicts of interest with respect to the research, authorship, and/or publication of this article.
Funding
The author(s) disclosed receipt of the following financial support for the research, authorship, and/or publication of this article: This work was partially supported by the US-Tagging grant financed by ANR (Agence Nationale de la Recherche). This work was performed within the framework of the LABEX Primes (ANR-11-LABX-0063) of Université de Lyon, within the program “Investissements d’Avenir” (ANR-11-IDEX-0007) operated by the French National Research Agency (ANR).